INTRODUCTION
Using tree rings as an archive to reconstruct past atmospheric radiocarbon (14C) content is one of the foundations of calibrating 14C measurements and accurately converting conventional 14C ages to real calendar dates. Over the last decades, thousands of 14C measurements from tree rings have been carried out and were compiled, together with non-tree-ring data (plant macrofossils, speleothems, corals, and marine sediments) into the current calibration data set IntCal13 (Reimer et al. Reference Reimer, Bard, Bayliss, Beck, Blackwell, Bronk Ramsey, Buck, Cheng, Edwards, Friedrich, Grootes, Guilderson, Haflidason, Hajdas, Hatteé, Heaton, Hoffmann, Hogg, Hughen, Kaiser, Kromer, Manning, Niu, Reimer, Richards, Scott, Southon, Staff, Turney and van der Plicht2013). Large sections of the tree-ring based calibration dataset are measured on blocks of 10 or 5 years of tree rings averaging the 14C signal archived over those years. With the advent of accelerator mass spectrometry (AMS), the amount of sample material needed for an analysis became small enough to perform extensive analyses on single tree rings. From the perspective of archaeological science adding 14C data with annual resolution to the IntCal calibration data could improve the accuracy of 14C dates.
Also, other fields of research benefit from single-year 14C records. Those records are valuable archives for reconstructing short-term fluctuations of the 14C production caused by changes in solar activity (Braziunas et al. Reference Braziunas, Fung and Stuiver1995; Stuiver and Braziunas Reference Stuiver and Braziunas1998; Güttler et al. Reference Güttler, Wacker, Kromer, Friedrich and Synal2013) and short-term event-like changes such as solar proton events (Shea and Smart Reference Shea and Smart1992; Jöckel et al. Reference Jöckel, Brenninkmeijer, Lawrence and Siegmund2003; Miyake et al. Reference Miyake, Nagaya, Masuda and Nakamura2012, Reference Miyake, Masuda and Nakamura2013). Reconstructing the past solar activity from high-resolution records can be used to understand the sun’s intrinsic mechanisms and dynamics (Solanki et al. Reference Solanki, Usoskin, Kromer, Schüssler and Beer2004; Kitchatinov and Olemskoy Reference Kitchatinov and Olemskoy2016; Usoskin Reference Usoskin2017), and to investigate the sun’s role as a driver of earth climate (Hoyt et al. Reference Hoyt, Schatten, Schatten and Schatten1997; Sirocko et al. Reference Sirocko, Brunck and Pfahl2012; Raspopov et al. Reference Raspopov, Dergachev, Zaitseva and Ogurtsov2013; Thiéblemont et al. Reference Thiéblemont, Matthes, Omrani, Kodera and Hansen2015). Exemplary, Sirocko et al. (Reference Sirocko, Brunck and Pfahl2012) have found an indirect link between the sun’s “11-year” Schwabe cycle and regional temperature anomalies in periods of minimal solar activity. This study relied on observations of group sunspot numbers as a direct indicator of the state of solar activity. Because the atmospheric 14C production is influenced by the solar magnetic field, the application of 14C as a proxy of solar activity in contrast to direct observations of sunspot numbers is clearly beneficial, especially in times before sunspot observations are available. Continuous records of 14C data from tree rings are therefore an ideal archive for solar-activity studies.
Here, we present two tree-ring 14C-series from a high-latitude location in northern Scandinavia and a mid-latitude location in eastern Germany. The high-latitude samples were obtained from a pine tree (Pinus sylvestris) while the mid-latitude tree is an oak tree (Quercus sp.). At the 14C lab (Kromer et al. Reference Kromer, Lindauer, Synal and Wacker2013) of the Curt Engelhorn-Center Archaeometry (CEZA) high precision 14C AMS measurements were performed on 164 single tree rings (covering 290–460 AD) from the high-latitude pine tree and 100 rings (covering 382–486 AD) from the mid-latitude oak tree with an overlapping time period from 290 to 486 AD.
METHODS
Tree Locations and Dendrochronology
Submerged logs of subfossil Pinus sylvestris were recovered from lake Kompsiojärvi (Esper et al. Reference Esper, Frank, Timonen, Zorita, Wilson, Luterbacher, Holzkämper, Fischer, Wagner and Nievergelt2012) in northern Scandinavia (latitude: 68.50°N, longitude: 28.00°E, elevation: 190 m). Tree-ring widths were measured at two radii on a disc of the pine tree “Kom1213175” (radii are labeled as Kom1213175a and Kom1213175b) with a precision of 0.01 mm and cross-dated with the local ring-width chronology (Eronen et al. Reference Eronen, Zetterberg, Briffa, Lindholm, Meriläinen and Timonen2002). For every position t-values and Gleichläufigkeits-percentages (Glk%) were noted (Baillie and Pilcher Reference Baillie and Pilcher1973). Additional maximum-wood-density (MXD) measurements were performed cross-validating the ring-width dating (Esper et al. Reference Esper, Schneider, Smerdon, Schöne and Büntgen2015). TsapWin Professional 4.80ff (Rinn Reference Rinn1996) was used to measure ring width, and Walesch x-ray densitometer was used to measure high-resolution density profiles (Eschbach et al. Reference Eschbach, Nogler, Schaer and Schweingruber1995). Dating was determined by checking the synchronous position both statistically using COFECHA (Holmes Reference Holmes1986) and visually on the light table. The samples measured for this study are a combination of samples from the two radii with 290–435 AD from Kom1213175b and 436–460 AD from Kom1213175a.
The mid-latitude oak tree (Quercus sp.) labeled “Publik2918” was recovered from river gravel surfaced by coal surface-mining in Germany (latitude: 51.4085N, longitude: 14.6911E) close to the location of the former village Publik, Germany. Tree-ring widths where measured independently at the dendrochronology laboratory of the Deutsches Archäologisches Institut (DAI) and CEZA using a stereomicroscope (Leica MS 5) and custom-made measurement devices measuring tree-ring widths with a resolution of 1/100 mm. The dendrochronology lab of DAI cross-dated the ring-width series against the local chronologies of “South Brandenburgia” and “Lusatia and Saxonia” as well as other reference chronologies. The software package TsapWin Professional 4.69h (Rinn Reference Rinn1996) was applied for cross-dating. Those positions that produced results above a given threshold (tBP > 5) were taken into consideration. For every position t-values and Gleichläufigkeits-percentages (Glk%) were noted (Baillie and Pilcher Reference Baillie and Pilcher1973). The dates were determined by checking the synchronous positions both statistically and visually. The dendrochronology lab of CEZA double checked the dendro-dates by cross-dating the series against the Hohenheim German Oak Chronology (Friedrich et al. Reference Friedrich, Remmele, Kromer, Hofmann, Spurk, Kaiser, Orcel and Küppers2004) and the Vosges Oak Chronology (Tegel et al. Reference Tegel, Vanmoerkerke and Büntgen2010), validating dates established by DAI.
Sample Preparation and 14C Measurements
The high-latitude pine samples exhibited very narrow rings with widths between 0.2 and 1 mm. Single rings were sampled at the dendrochronology laboratory of the University in Mainz using a microtome, followed by freeze drying and shipment to CEZA for 14C analysis. Sample material of 5 to 40 mg was available and pretreated. The mid-latitude oak tree showed generally wider rings between 0.6 and 5 mm, which allowed sampling single rings at CEZA by scalpel or razor blades. Sample material of 50 mg up to 700 mg was used for pretreatment.
14C sample pretreatment was aimed at extracting holo-cellulose from the wood samples by applying a BABA-bleaching method (Brock et al. Reference Brock, Higham, Ditchfield and Ramsey2010): (1) soaking in NaOH 4% at 60ºC overnight followed by Milli-Q-H2O rinsing, (2) HCl 4% at 60ºC for 30 min followed by Milli-Q-H2O rinsing, (3) NaOH 4% at 60ºC for 30 min, (4) 3 times Milli-Q-H2O rinsing, (5) NaClO2 (set pH3 of the solution by adding HCl) at 60ºC for 1 hr followed by Milli-Q-H2O rinsing repeated until the cellulose turn white, (6) 3 times Milli-Q-H2O rinsing, and (7) oven drying at 60ºC overnight. Typical cellulose yields (cellulose mass per sample mass before preparation) were between 30 and 60%.
Cellulose (about 3–4 mg) was combusted using an elemental analyzer (vario MICROcube, Elementar). The resulting CO2 was catalytically reduced to graphite in a custom made graphitization system (Kromer et al. Reference Kromer, Lindauer, Synal and Wacker2013) or a commercially available system (AGE3) manufactured by IonPlus (Němec et al. Reference Němec, Wacker and Gäggeler2010; Wacker et al. Reference Wacker, Němec and Bourquin2010c). Graphite (ranging between 0.5 to 1.5 mg of carbon) was subsequently pressed into aluminum targets (IonPlus Inc.) and analyzed using an MICADAS (MIni CArbon DAting System, IonPlus) type AMS (Synal et al. Reference Synal, Stocker and Suter2007; Wacker et al. Reference Wacker, Bonani, Friedrich, Hajdas, Kromer, Němec, Ruff, Suter, Synal and Vockenhuber2010a) at CEZA (Kromer et al. Reference Kromer, Lindauer, Synal and Wacker2013).
Oxalic Acid II (OXII, NIST SRM 4990C) was used as 14C standard. Phthalic anhydride C8H4O3 (Sigma-Aldrich, PN320064)—a chemically produced substance—was used for blank determination. Since it did not pass through the same sample pretreatment procedure as the wood samples, this type of blank mainly determines the 14C background of the graphitization and AMS systems. Several other reference materials including blanks were analyzed. See explanations in the section Quality Control.
Measurement Period
Samples of the high-latitude pine tree and the mid-latitude oak tree where not analyzed during the same period of time. Particularly, the analysis of the high-latitude pine tree was spread out over several years. Tree rings covering 399–417 AD where received in July 2012 and measured in November 2012 (400–417 AD) and March 2015 (399–380 AD). Rings covering 415–430 AD where received and analyzed in November 2015 and rings from 350–382 AD and 428–460 AD where received in December 2015 and analyzed in January 2016. Finally, rings covering 290–347 AD where received and analyzed in August-September 2018. Mid-latitude oak tree samples were all received and analyzed in June–July 2017.
Quality Control
Ensuring not just high precision but also accuracy, reference materials of known age are frequently analyzed and processed in the same way as unknown samples. Reference materials C1, C2, C3, and C6 certified by IAEA (Rozanski Reference Rozanski1991), internal bone references (with known year of death) and bone blanks are measured frequently and show very good agreement with the reference values (not shown here). The high agreement of the analyzed materials with the reference values and the agreement of the internal blank materials (IAEA C1, bone blanks and infrequently measured wood blanks) with the Phthalic anhydride blanks, show that the sample-preparation procedures in our lab add only insignificant amounts of 14C.
Participating in intercomparison exercises is part of our quality control procedures as well. Very good agreement between the results from CEZA to consensus values was shown in a study by (Hammer et al. Reference Hammer, Friedrich, Kromer, Cherkinsky, Lehman, Meijer, Nakamura, Palonen, Reimer and Smith2017) (lab1 and lab10 being our results). During the measurement period of the tree-ring samples presented here, several intercomparison studies using single-year wood samples had taken place. In a study by A. Sookdeo (ETH Zurich) a total of 72 tree-ring samples were prepared and analyzed separately at ETH and CEZA. Additionally, CEZA participated in large lab intercomparison exercise as part of the IntCal dendrochronological focus group organized by L. Wacker (ETH Zurich) using annual wood samples.
Data Evaluation
The AMS raw data were evaluated using the software BATS 4.15 (Wacker et al. Reference Wacker, Christl and Synal2010b). Besides standardizing the analytical results to Oxalic Acid II and a blank correction using Phthalic anhydride, a current correction and isobar correction was applied. Errors of blanks, standards and other corrections are fully propagated. A lab specific error (target scatter) of 0.1% was added accounting for additional uncertainties that are not covered by purely analytical errors. 14C ages are normalized to δ13C = –25‰.
Data smoothing for presenting and interpreting the final 14C results uses a Savitzky-Golay filter with a filter window of size = 9 and filter order = 2. Evaluating the systematic variation in the 14C data of the two new records, a 5–25-yr bandpass-filter was applied to the Δ14C data. Using a bandpass filter removes high-frequency noise and low-frequency trends and exposes cyclic patterns (“11-year” solar cycle) that are imprinted into the 14C data. In order to determine the dominant frequencies (spectral frequency analysis), respectively cycle lengths, of the cyclic 14C variation, a continuous wavelet analysis (“Morlet” wavelet) was performed (Lee et al. Reference Lee, Gommers, Wasilewski, Wohlfahrt, O’Leary and Nahrstaedt2006). The wavelet method, in contrast to Fourier or least-square methods, takes into account that the cycle-length of the variations may not be stationary in time.
Testing the degree of synchronicity between the two new records—in the period of overlapping 14C data—Pearson correlation coefficients (PCCs) were calculated. This method determines the covariance of the two data series and measures their linear relationship.
Since 14C data are inherently noisy due to their analytical uncertainties, the impact of noise on the calculation of PCC is estimated by a Monte Carlo approach. This procedure includes repeated calculations of PCCs between the two series while randomly varying the Δ14C values within their analytical uncertainties. Those random numbers follow a normal distribution given by the measured value and its analytical uncertainty. The randomized data set was smoothed and PCCs were calculated. This procedure was repeated 10,000 times and the distribution of PCC values was extracted.
RESULTS AND DISCUSSION
Dendrochronology
The two dendro-dated sections of the high-latitude pine tree (Kom1213175) yield good cross-dating results including tBP-values of 9.0 (Glk%=68, THO=10.3) for radius Kom1213175a and 10.0 (Glk%=72, THO=9.7) for radius Kom1213175b. Tree-ring widths are available online (Esper Reference Esper2018a; Esper Reference Esper2018b).
Cross-dating the mid-latitude oak tree (Heussner and Westphal Reference Heussner and Westphal2018) yields good linkage to the local oak chronology of the region Lusatia with tBP-value = 12.2 (Glk%=75, THO=13) and to the larger-scale oak chronology of South Brandenburg and Saxony with tBP-value = 5.4 (Glk%=69, THO=6.1).
Quality Control Data
Average F14C of 26 Phthalic anhydride blanks measured together with the samples is 0.0023 ± 0.0007 showing low and consistent background values. Reference materials IAEA C3 (certified value of F14C = 1.5016 ± 0.0002) and C6 (the revised value of F14C = 150.16 (Xu et al. Reference Xu, Khosh, Druffel-Rodriguez, Trumbore and Southon2010) was used instead of F14C = 150.61 given by IAEA) were analyzed together with the samples. Those materials show mean F14C deviations (reference value – measured average) from the reference values of –0.0017 ± 0.0029 for four IAEA C3 (reduced χ2 = 0.34) and –0.0023 ± 0.0019 for three IAEA C6 (reduced χ2 = 1.5). The reference measurements can be considered in good agreement with the reference values. We recently started analyzing ancient wood blanks—Manukau Kauri from New Zeeland (Hogg et al. Reference Hogg, Fifield, Palmer, Turney and Galbraith2007)—averaging to F14C = 0.0032 ± 0.0003. During the same measurement period Phthalic anhydride blanks show F14C = 0.0027 ± 0.0009) slightly lower than the ancient wood blanks. Even though, those wood blanks were not analyzed together with the samples presented here, we conclude that the blank contribution from the sample preparation procedure is small and does not affect the 14C ages significantly.
Our results of two intercomparison studies in which CEZA participated show no significant offsets to the consensus values (Sookdeo, pers. communication, Wacker, pers. communication).
14C Results
Figure 1 shows the results of 14C analysis as conventional 14C ages (upper panel) as well as Δ14C (middle panel). The data Table S1 can be found in the supplementary material. The high-latitude pine covers a range of 290–460 AD (164 rings/dates) overlapping 79 yr with the mid-latitude oak that covers 382–486 AD (100 rings/dates). The years 307 AD, 308 AD, 328 AD, 331 AD, 336 AD, 348 AD, 349 AD of the high-latitude pine and 385 AD, 394 AD, 395 AD, 443 AD of the mid-latitude oak have not been analyzed or included due to insufficient sample material (mostly in case of the for the high-latitude pine) or problems during sample preparation or analysis (insufficient carbon yield, problems during combustion). The 14C data of those missing years are interpolated linearly before subsequent data analysis. The lower panel of Figure 1 shows the difference between the two new records and IntCal13. Since IntCal13 is providing Δ14C values for every 5th year only, the data of the two new records were pooled into 5-yr averages as well and subtracted from the corresponding IntCal13 values.
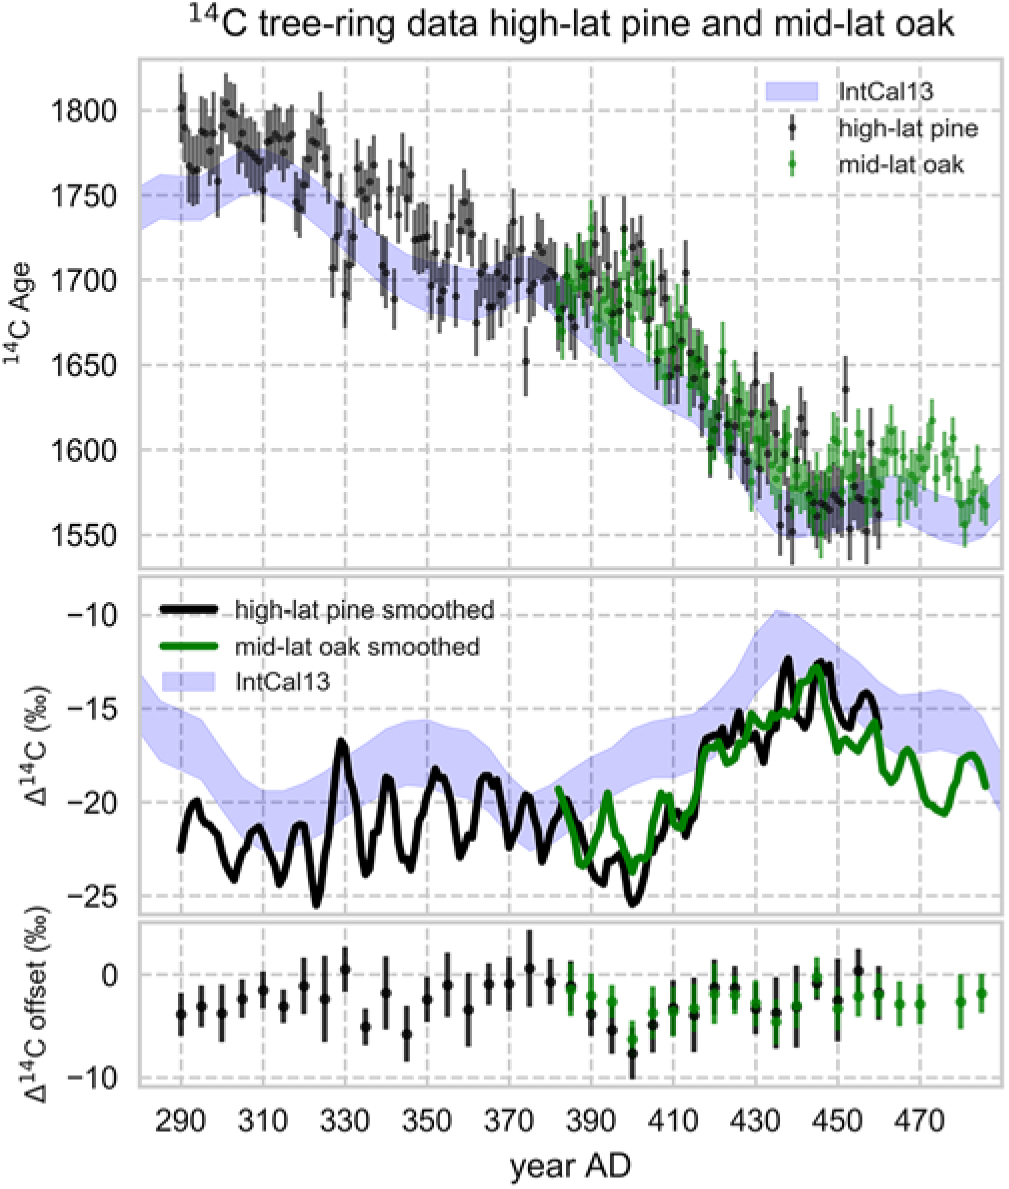
Figure 1 14C results of the high-latitude pine (black) and mid-latitude oak tree (green). The blue band shows IntCal13. Upper panel: results of the individual 14C ages. Middle panel: smoothed Δ14C only. Lower panel: difference between IntCal13 and the two new records. IntCal13 provides 5-yr data. Therefore, 5-yr averages of the new records where used. Error bars are the standard deviations of the pooled 5-yr data.
General Trends and IntCal13
The two high-resolution records of the high- and mid-latitude trees are consistent to each other in terms of overall shape and trend (see Figure 1)—a minimum around 400 AD, a steady increase of Δ14C (decrease of 14C ages) from 400 AD to 440 AD and a decreasing trend thereafter. The trends of the two series are in part very similar to IntCal13 (see Figure 1). There is close coherence around 290–310 AD and 360–390 AD, a synchronous increasing reaching maximum Δ14C (minimum 14C age) at 440 AD and a decreasing trend from thereon. However, between 390 AD to 420 AD the two high-resolution records show a substantial lower Δ14C values (higher 14C ages) compared to IntCal13.
Even though the general trend of the two new records is in part similar to IntCal13 (except the position of the Δ14C minimum in 400 AD) the new data show an offset compared to IntCal13 of (2.6 ± 1.9) and (2.8 ± 1.3)‰ (lower panel in Figure 1) for the high-latitude pine and mid-latitude oak, respectively. These values correspond to an offset in 14C age of 22 and 23 years towards older ages. Similar offsets in other time periods have been reported before (Wacker et al. Reference Wacker, Christl and Synal2010b; Güttler et al. Reference Güttler, Wacker, Kromer, Friedrich and Synal2013).
Latitudinal Effect
Calculating the difference between the two new records for each year (high-latitude pine minus mid-latitude oak) for the period of overlapping 14C data results in a mean offset of (–0.04 ± 2.9)‰. Therefore, no significant latitude effect can be deduced from our data.
It is assumed that no significant gradient in tropospheric 14C exists between low- to mid-latitudes (Kromer et al. Reference Kromer, Manning, Kuniholm, Newton, Spurk and Levin2001). However, local offsets can attribute to significant deviations in 14C found in tree-ring records (Kromer et al. Reference Kromer, Manning, Kuniholm, Newton, Spurk and Levin2001). In contrast, other studies (Braziunas et al. Reference Braziunas, Fung and Stuiver1995; Uusitalo et al. Reference Uusitalo, Arppe, Hackman, Helama, Kovaltsov, Mielikäinen, Mäkinen, Nöjd, Palonen and Usoskin2018) report a general latitude-dependent distribution of 14C. Estimates by Braziunas et al. (Reference Braziunas, Fung and Stuiver1995) find a significant latitudinal offset only at very high latitudes above 70N the difference in latitudes between the two new records (68.5N and 51.4N) may only cause relatively small offsets of less than 1‰.
Even though the IntCal calibration curve represents the mid-latitude Northern Hemisphere (Reimer et al. Reference Reimer, Bard, Bayliss, Beck, Blackwell, Bronk Ramsey, Buck, Cheng, Edwards, Friedrich, Grootes, Guilderson, Haflidason, Hajdas, Hatteé, Heaton, Hoffmann, Hogg, Hughen, Kaiser, Kromer, Manning, Niu, Reimer, Richards, Scott, Southon, Staff, Turney and van der Plicht2013), our data suggest, that the high-latitude pine tree would still be suitable to be included in IntCal.
Solar Cycles
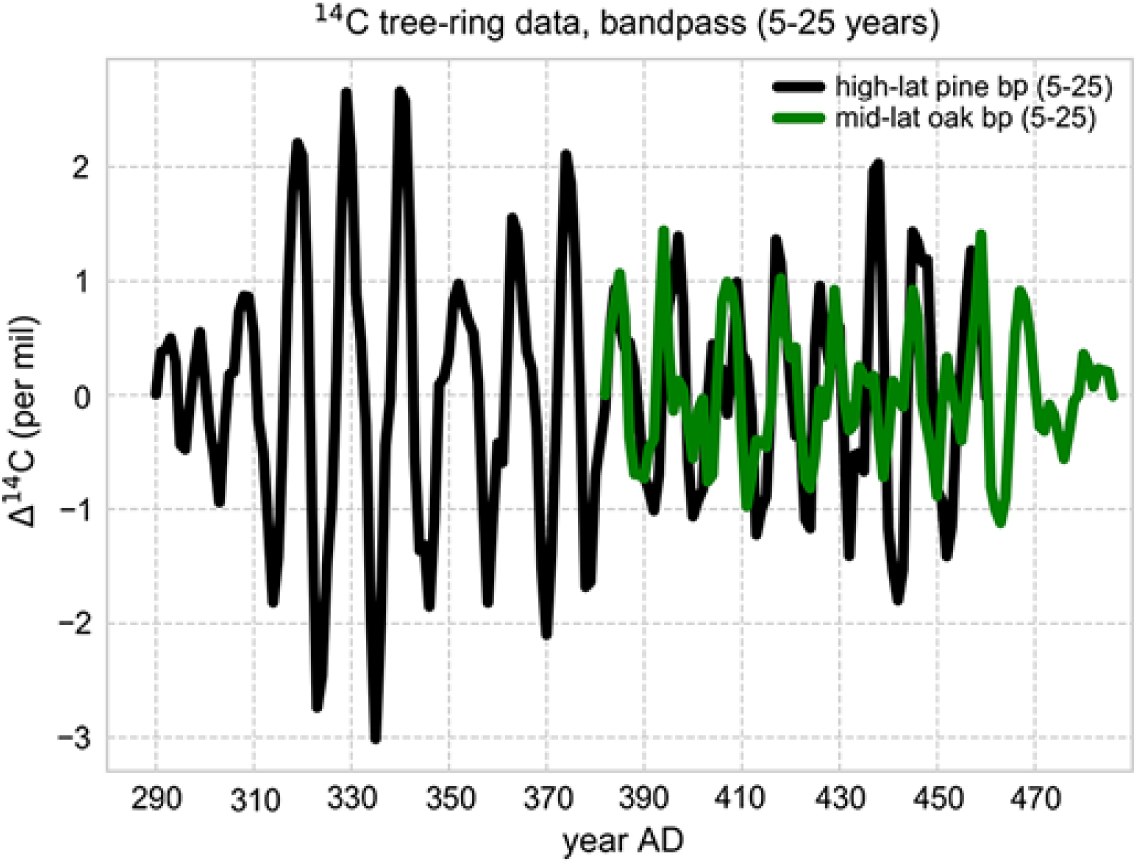
Comparing the high-frequency variations of the two records, (see Figure 1) highly resolved cycles of periodic changes in 14C with a periodicity of about 9–11 yr are evident. The bandpass-filtered Δ14C data in Figure 2 visualize the cyclic changes more clearly. This pattern can be attributed to changes in the 14C production due to the “11-year” solar Schwabe cycle. The amplitudes of Δ14C variations are in the range of 1.5–3‰ (see Figure 2) with slightly larger values for the high-latitude pine compared to the mid-latitude oak tree (Figure 2, middle panel). Those values are comparable to values reported by others (Stuiver and Braziunas Reference Stuiver and Braziunas1993, Reference Stuiver and Braziunas1998; Güttler et al. Reference Güttler, Wacker, Kromer, Friedrich and Synal2013) with respect to natural variation in Δ14C due to the “11-year” solar cycle.

Figure 2 Bandpass filtered 14C of high-latitude pine (black) and mid-latitude oak (green). Bandpass with 5-yr and 25-yr cut-off periods. Bandpass filtered data are smoothed.
In order to estimate the cycle length of the “11-year” solar cycle archived in 14C data by wavelet analysis, a combined data set was created using the individual Δ14C data of the high-latitude pine and mid-latitude oak tree as well as averaging the two data sets in the time period of overlap. Figure 3 shows the power spectrum of the wavelet analysis of the combined record. Dominant cycle periods (maxima of the power-spectrum) fall between 9 and 11 years, which agrees well with cycle length generally known to be variable between 8 to 15 years (Mende and Stellmacher Reference Mende and Stellmacher2000; Güttler et al. Reference Güttler, Wacker, Kromer, Friedrich and Synal2013; Hathaway Reference Hathaway2015).

Figure 3 Wavelet analysis of the combined dataset. The power spectrum of the dominant cycle periods is shown as grayscale in units of log2 (power). Vertical lines at 380 and 460 AD show where the overlap between the two datasets starts and ends. Dominant cycle lengths are in the range between 9 and 11 years (horizontal lines).
Figures 1 and 2 show that the maxima and minima of the Δ14C only partially coincide in some time periods whereas more often their timing is not synchronous. Reasons for missing synchronicity could be found in a time lag of the 14C incorporation into wood of trees of different latitudes due to a delayed latitudinal distribution of atmospheric 14C and a difference in the timing of carbon fixation in wood. According to Stuiver and Braziunas (Reference Stuiver and Braziunas1993) tropospheric mixing of 14C is of the order of a few months within one hemisphere. Therefore, an apparent time lag in 14C of multiple years between trees in mid- and high latitudes cannot be explained by atmospheric mixing alone.
Tree rings of oak trees are known to transfer carbon carried over from previous years into the formation of early-wood (Pilcher Reference Pilcher1995). While late-wood carries the contemporary 14C signal. Thus, analyzing both early- and late-wood of one single tree-ring results in a mixed 14C signal from several years. A recent study (Fu et al. Reference Fu, Grießinger, Gebrekirstos, Fan and Bräuning2017) has found a similar carry-over effect in Pinus kesiya and Pinus armandii, while (Kress et al. Reference Kress, Young, Saurer, Loader, Siegwolf and McCarroll2009) reported no carbon carry-over in Pinus sylvestris.
The onset and length of growing seasons in high- and mid-latitudes also affects the timing of the carbon fixation and therefore the timing of the archived 14C signal. Present-day growing seasons of the high-latitude pine are confined to mid-June until mid-August (Schmitt et al. Reference Schmitt, Jalkanen and Eckstein2004) and May until September for the mid-latitude oak (Skomarkova et al. Reference Skomarkova, Vaganov, Mund, Knohl, Linke, Boerner and Schulze2006). Those differences, however, can only result in a time lag of several months.
Creating an apparent time lag between the two records might in principle be introduced by inaccurate dendrochronological dates of the tree rings. This could be caused by the absence of tree rings. However, such “missing rings” were detected and added through cross-dating. This correction can typically be applied successfully in Northern Europe because climate signals and between-tree correlations are strong. Trees in eastern Germany, on the other hand, grow much faster so that missing rings are generally less common. In particular, oak hardly has any missing rings, as the vessels of the new ring are needed for water transport, so that dating errors due to missing rings are also very unlikely for these chronologies.
Noise introduced by analytical uncertainties could potentially mask a clear periodic signal in 14C and may lead to the appearance of low synchronicity between the two new records. A Monte Carlo approach was applied to estimate its impact on the degree of correlation. Repeated calculations of the Pearson correlation coefficients (PCCs) while varying the Δ14C values within their uncertainties result in a range of PCCs. Figure 4 shows the results of 10,000 repeated calculations. The spread in PCCs reflects the uncertainty of the PCCs due to the analytical uncertainties. The PCCs range between 0.7 and 0.9 (peak at 0.8) showing a median to high correlation between the two new records. Shifting the high-latitude pine by 1 respectively 2 years towards older ages, changes the peak of the PCC distribution to 0.83 and 0.85 (not shown). Shifting the series by 2 years toward younger ages results in a slightly reduced correlation peaking at 0.77. Generally, the degree of correlation remains high and does not change significantly (considering the spread of the PCCs). Therefore, we conclude that present levels of analytical 14C uncertainties do not allow a cross-check of data series against each other on annual resolution (as provided by dendrochronological cross-dating) by using the pattern of the “11-year” solar cycle visible in 14C. The apparent small asynchronicity between the two new records may not be caused by an actual significant real-world shift of the timing of the maxima and minima in the 14C variations. However, the presence of a clearly discernable “11-year” solar cycle in annually resolved 14C provides a constrained time window for ring-width synchronization.

Figure 4 Correlation coefficients of 10,000 Monte Carlo runs comparing the smoothed Δ14C data of the high-latitude pine and mid-latitude oak tree.
CONCLUSION
Improvements of analytical techniques for radiocarbon analysis–the use of AMS compared to counting techniques—enable the use of sample material small enough to analyze single tree rings and facilitate the development of annually resolved 14C time series. 14C calibration data with much higher resolution are a direct result. The data presented here show a much higher resolved section of the calibration curve than is presently included in IntCal13. Even though the general trend of the new data and IntCal are in part similar, certain time periods show significantly different 14C values. Additionally, a mean offset of about 20 14C-years can be observed. We also show that high-resolution 14C records are powerful archives for studying the solar activity. The “11-year” Schwabe cycle can be resolved clearly with a variable cycle length of 9–11 yr. Data sets like the ones presented here can enable in-detail studies of the solar dynamo and its impact on climate.
ACKNOWLEDGMENTS
We thank the teams of the respective 14C and dendro labs for their fast sample turnaround yet careful sample preparation as the foundation of the high quality of the sample material. We thank the IntCal working group for providing intercomparison samples.
SUPPLEMENTARY MATERIAL
To view supplementary material for this article, please visit https://doi.org/10.1017/RDC.2019.34.