


INTRODUCTION
The Gulf of Mexico (henceforth GoM) is a flat-bottomed basin with a maximum depth near 3800 m. It is fed by Caribbean inflow through Yucatan Strait, over a sill about 2000 m deep. Water exits the GoM to the Atlantic Ocean, via Florida Strait over a 740-m-deep sill. Within the GoM, therefore, there is considerable shear between the upper layer circulation that includes tropical and subtropical waters and that below the Florida Strait sill depth (Morrison et al. Reference Morrison, Merrill, Key and Key1983; Jochens et al. Reference Jochens, Bender, DiMarco, Morse, Kennicutt, Howard and Nowlin2005). The Florida Strait sill depth coincides with the center of the Antarctic Intermediate Water (AAIW) layer. Water below about 1000 m is essentially well mixed with a constant salinity of 34.97 indicative of upper NADW (Schroeder et al. Reference Schroeder, Berner and Nowlin1974; Morrison et al. Reference Morrison, Merrill, Key and Key1983; Nowlin et al. Reference Nowlin, Jochens, DiMarco, Reid and Howard2001), as well as consistent with oxygen concentrations (Jochens et al. Reference Jochens, Bender, DiMarco, Morse, Kennicutt, Howard and Nowlin2005). Nutrient concentrations, however, are less well constrained (Nowlin et al. Reference Nowlin, Jochens, DiMarco, Reid and Howard2001). Water masses identified in the GoM are listed in Table 1, together with their physico-chemical characteristics.
Table 1 Water masses of the Gulf of Mexico, based on (a) Morrison and Nowlin (Reference Morrison and Nowlin1977), (b) Nowlin and McClellan (Reference Nowlin and McClellan1967), and (c) Morrison et al. (Reference Morrison, Merrill, Key and Key1983).

18°C water=18°C Sargasso Sea water; AAIW=Antarctic intermediate water; SUW=Subtropical underwater; SUW-LC=subtropical underwater within the Loop Current; TACW=Tropical Atlantic Central water; UNADW=Upper North Atlantic deep water; UNADW-MIX=UNADW mixed with high silicate Caribbean mid-water.
The GoM is characterized by an anticyclonic upper layer circulation that is forced by the Loop Current and a cyclonic circulation below 950–1000 m depth. Within the lower layer, current velocities drop from as high as 2.5 m/s in the Loop Current to approximately 10 cm/s or less at 1200 m, and are likely only 1–2 cm/s at greater depths (Schmitz Reference Schmitz2005; Ledwell et al. Reference Ledwell, He, Xue, DiMarco, Spencer and Chapman2016). The deep cyclonic circulation is inferred from both deep current meter and PALACE float measurements (Molinari and Mayer Reference Molinari and Mayer1980; Hamilton Reference Hamilton1990; Hamilton et al. Reference Hamilton, Singer, Waddell and Donohue2003; Weatherly et al. Reference Weatherly, Wienders and Romanou2005; Hamilton et al. Reference Hamilton, Bower, Furey, Leben and Perez-Brunius2016) and from hydrographic data. DeHann and Sturges (Reference DeHann and Sturges2005) showed that water temperatures increase slowly to the northeast around the edge of the basin at 2000 m as water moves away from Yucatan Strait with its cold, oxygen-rich inflow. Similarly, oxygen concentrations below 1200 m depth show the highest values near Yucatan Strait and decrease cyclonically around the basin so that the lowest values are found in the Bay of Campeche in the southwest GoM (Jochens et al. Reference Jochens, Bender, DiMarco, Morse, Kennicutt, Howard and Nowlin2005). While this cyclonic circulation is found in both the eastern and western sub-basins of the GoM, recent float data suggest separate circulations may exist either side of 90°W (Hamilton et al. Reference Hamilton, Bower, Furey, Leben and Perez-Brunius2016), and remnants of the upper layer circulation can still be seen as deep as 2000 m in mean temperature plots from below the depth of the Florida Strait sill.
The analysis of Johns et al. (Reference Johns, Townsend, Fratantoni and Wilson2002) suggests that net northward flow through Yucatan Strait is ~28.5 Sv. This agrees reasonably well with model estimates of 29 Sv by Roemmich (Reference Roemmich1981), 27 Sv by Romanou et al. (Reference Romanou, Chassignet and Sturges2004) and 27.2 Sv by Cherubin et al. (Reference Cherubin, Sturges and Chassignet2005). The CANEK program of direct current measurements, named after a prominent figure in local Mayan literature (Badan et al. Reference Badan, Candela, Sheinbaum and Ochoa2005), however, gave a mean northward transport of only 23.8 ± 1 Sv over 9 months and 23.1±3.1 Sv over 2 yr (Sheinbaum et al. Reference Sheinbaum, Candela, Badan and Ochoa2002; Candela et al. Reference Candela, Tanahara, Crepon, Barnier and Sheinbaum2003, Badan et al. Reference Badan, Candela, Sheinbaum and Ochoa2005). CANEK researchers suggested that the 4–5 Sv discrepancy results from balancing flow in the Florida Current (east of Florida Strait) with poorly known flow through the Old Bahama and Northwest Providence Channels east of Cuba. There is, however, a large amount of sub-inertial variability in the current meter records. On the other hand, repeated ADCP measurements taken from a cruise liner over several years (Rousset and Beal Reference Rousset and Beal2010) suggest that the flows through Yucatan Strait and in the Florida Current are essentially equal at 30.3±5 Sv and 30.8±3.2 Sv respectively, while altimetry estimates (Alvera-Azcarate et al. Reference Alvera-Azcarate, Barth and Weisberg2009) give flow values through Florida Strait of 32.2 Sv over 13 yr. Clearly, some uncertainty remains over the absolute flows in the region.
The flow is not one way, however. LADCP data (Ochoa et al. Reference Ochoa, Sheinbaum, Badan, Candela and Wilson2001) and current meter records (Bunge et al. Reference Bunge, Ochoa, Badan, Candela and Sheinbaum2002; Sheinbaum et al. Reference Sheinbaum, Candela, Badan and Ochoa2002; Candela et al. Reference Candela, Tanahara, Crepon, Barnier and Sheinbaum2003) show considerable southward flow along the eastern and western sides of Yucatan Strait, both at the surface near Cuba (volume flux ~0.4 Sv) and at depth, where the flow is about 1.5 Sv, although they state that there is essentially no net mass transport below the depth of the Florida Strait sill. This is borne out by model results; Cherubin et al. (Reference Cherubin, Sturges and Chassignet2005) showed a mean southward outflow between 3 and 4 Sv over a 7-yr model run. The flow variability is thought to be related to the formation of Loop Current eddies in the Gulf of Mexico (Maul et al. Reference Maul, Mayer and Baig1985; Bunge et al. Reference Bunge, Ochoa, Badan, Candela and Sheinbaum2002), although the exact mechanism is unclear (Cherubin et al. Reference Cherubin, Sturges and Chassignet2005). This outflow water carries up to 150 GW of heat back to the Caribbean below 750 m depth. An additional 110 GW of heat is lost via eddy heat flux. In exchange, colder, denser water with high oxygen concentrations near the sill depth ventilates the deep Gulf of Mexico (Rivas et al. Reference Rivas, Badan and Ochoa2005). The overall heat flux below 750 m depth is, however, strongly positive into the GoM at about 2900 GW.
Knowledge of the age of the deep water in the Gulf of Mexico is important for constraining models of the region. As a result of the two-layer circulation pattern, GoM deep water has a long turnover time, but this is not known with any certainty. The recent Deepwater Horizon oil spill in 2010 led to increased interest in modeling the circulation in the GoM, and age estimates put limits on the time needed to clear any future oil or other potential toxic agent from the Gulf.
Rivas et al. (Reference Rivas, Badan and Ochoa2005) used calculations based on near-bottom heat and mass fluxes (estimated at about 0.32 Sv) to estimate a residence time of about 250±50 yr. We recently obtained Δ14C data that suggest a similar deep water mean age.
SAMPLING AND METHODOLOGY
Samples for Δ14C analysis were collected during Pelican cruise PE15-21 (32PE20150414) from April 14–19, 2015, at sites shown in Figure 1, and are available from the Gulf Research Initiative Data Archive at https://data.gulfresearchinitiative.org. Standard hydrographic data were collected at the same sites from a rosette fitted with 12 5-liter bottles and a SeaBird 911 CTD containing a SBE-55 temperature sensor, SBE-3 conductivity sensor, SBE45 pressure sensor, and SBE43 oxygen sensor. Additional sensors on the rosette package included a Chelsea Instruments Aqua3 fluorometer and a Biosperical/Licor PAR sensor. Discrete samples were collected from the water bottles for salinity determinations ashore and for oxygen calibration by Winkler titration on board ship. Nutrient samples were collected, filtered, frozen on board and analyzed ashore for nitrate, nitrite, phosphate, silicate, ammonia and urea by standard autoanalyzer methods (WHPO 1994). All data are available from the GRIIDC data repository at https://data.gulfresearchinitiative.org. Note that because the nutrient samples were frozen, the replication in the deep water is not as good as that obtained for temperature, salinity or oxygen, but our shore-based data are very similar to previous data from the deep Gulf of Mexico published by Morrison and Nowlin (Reference Morrison and Nowlin1977) and Jochens and DiMarco (Reference Jochens and DiMarco2008) and do not suggest any benthic nutrient supply from the slope. Both these authors showed nitrate and silicate maxima at the 800–1000 m depth level within the Antarctic Intermediate Water, with concentrations decreasing below this depth to ~22–24 µmol/L for nitrate and 24–27 µmol/L for silicate, as found on this cruise.
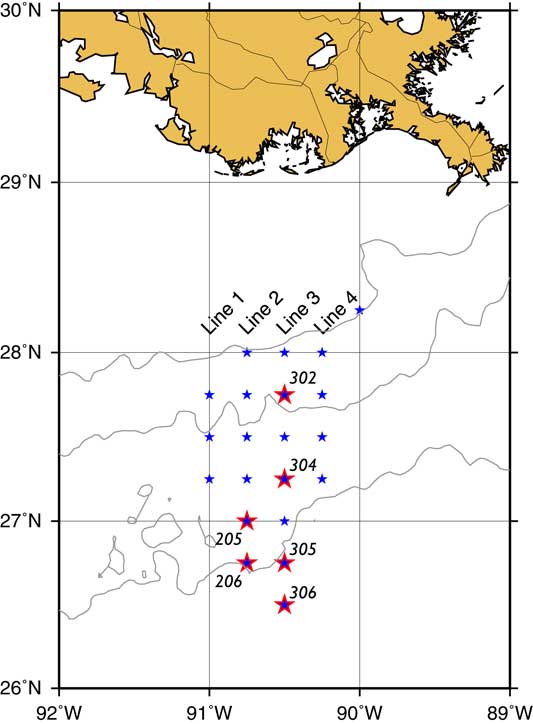
Figure 1 Station positions during cruise PE1521. 14C samples were taken at stations along lines 2 and 3 (larger stars) as shown in Table 2.
14C samples (500 mL) were collected in pre-combusted glass bottles supplied by the National Ocean Sciences Accelerator Mass Spectrometry facility at Woods Hole, MA (NOSAMS) using established protocols, poisoned with mercuric chloride, and analyzed at NOSAMS. The reproducibility of the method is about 4‰ (Elder et al. Reference Elder, McNichol and Gagnon1998). NOSAMS reports the data to two decimal places, but given the reproducibility we report data only to one decimal place. Alkalinity samples were also collected in pre-combusted glass bottles, poisoned with HgCl2 and analyzed ashore using an open-cell auto-titrating method, calibrated daily with buffer solutions and certified reference material seawater samples from Scripps Institution of Oceanography (Dickson Reference Dickson1981; Dickson et al. Reference Dickson, Afghan and Anderson2003).
RESULTS
Table 2 shows the measured Δ14C and δ13C values, and the estimated apparent ages, as calculated by NOSAMS. NOSAMS uses the methodology of Stuiver and Polach (Reference Stuiver and Polach1977) and Stuiver (Reference Stuiver1980); see http://www.whoi.edu/nosams/radiocarbon-data-calculations for details of their analytical procedures and corrections. “Modern” in Table 1 means that sample activity is greater than 95% of the 14C activity for AD 1950, as defined by the NBS oxalic acid standard, and that apparent ages are therefore less than 65 yr old. Other ages in this column are relative to 1950.
Table 2 Station positions and 14C data obtained during the cruise.

A vertical plot of Δ14C against depth is shown in Figure 2a. The Δ14C in the upper water column varies between 20 and 60‰. Below about 400 m the data describe a smooth curve with a minimum of –100‰ near 1100 m. Below 1150 m the values cluster around –94.6‰ with standard deviation of 3.2‰ (n=15). If all samples below 900 m are included (n=20), the mean Δ14C is –95.4‰, with a standard deviation of 3.4‰, and even considering data below 750 m the mean increases only to –93.6‰. [Note that we are not including the data from Matthews et al. (Reference Matthews, Fredericks and Sackett1973) or Morrison et al. (Reference Morrison, Merrill, Key and Key1983) in these statistics.] On constant density surfaces (Figure 2b), however, the surface inconsistencies largely disappear, with maximum values of 55–65‰ occurring at σθ values between 26.4 and 27.0. This is just above the density level of Tropical Atlantic Central Water (27.15; Morrison et al. Reference Morrison, Merrill, Key and Key1983), which makes up much of the water column above the Florida Strait sill depth.
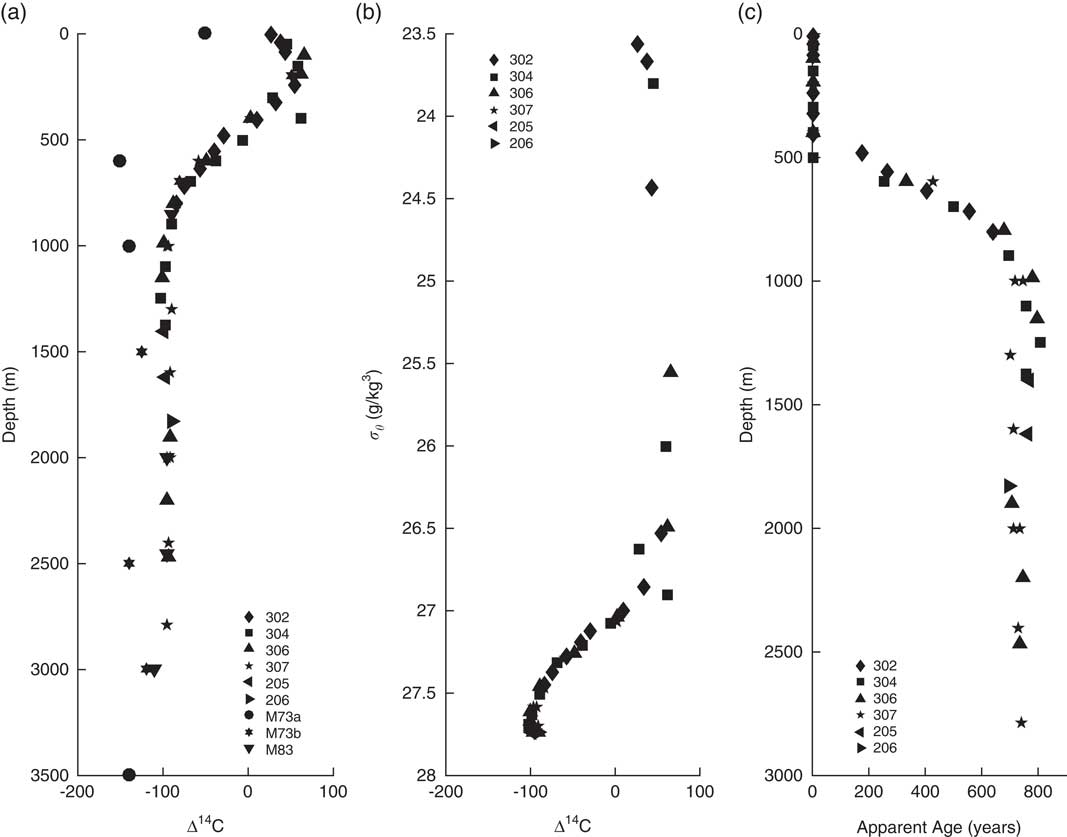
Figure 2 Δ14C concentrations as a function of (a) depth and (b) density, and apparent age as a function of depth (c). M73a, M73b and M83 in (a) refer to early data from Matthews et al. (Reference Matthews, Fredericks and Sackett1973) and Morrison et al. (Reference Morrison, Merrill, Key and Key1983); see text for details.
Figure 2c shows the apparent age of the samples as a function of depth. As expected, the apparent age shows the inverse of Δ14C, with modern ages down to about 500 m depth, which occurs at a σθ value of 27.1. The oldest water, at about 1000 m depth, had an apparent age of 800 yr, and below this depth the apparent age decreased to about 730–740 yr.
As a check on sampling reproducibility, three pairs of duplicate samples were taken from station 307, at depths of 1000, 2000, and 2789 m; the differences between the members of each pair were 3.1, 2.3, and 0.6‰ respectively, which is considerably less than the error estimates from NOSAMS (±4‰).
DISCUSSION
Based on data collected during the GEOSECS program in the 1970s, the replacement times for the deep waters of the world’s oceans were estimated to be 275, 250, and 550 yr, respectively, for the Atlantic, Indian, and Pacific Oceans (Stuiver et al. Reference Stuiver, Quay and Ostlund1983). However, these estimates do not necessarily coincide with the apparent regional age of the water calculated from Δ14C changes. Matsumoto and Key (Reference Matsumoto and Key2004), for example, using the large data set collected during the WOCE program in the 1990s (Key et al. Reference Key, Kozyr, Sabine, Lee, Wanninkhof, Bullister, Feely, Millero, Mordy and Peng2004), showed that the measured Δ14C of deep water at 3500 m in the Atlantic varied from about –50‰ in the Labrador Sea to about –160‰ in the Southern Ocean. These have apparent ages of about 400 and 1500 yr respectively, giving an initial offset of 400 yr for North Atlantic surface water. The –50‰ value from the Labrador Sea shows that even the deep water in this region was contaminated with bomb radiocarbon (14C) by this time, and the pre-bomb surface value is thought to be about –60‰ (Östlund and Rooth Reference Östlund and Rooth1990; Matsumoto and Key Reference Matsumoto and Key2004). To get a “true” age of deep water one has to consider the difference in Δ14C between water sinking in the polar North Atlantic (–50‰) and that found around Antarctica (–160‰), as was pointed out initially by Broecker (Reference Broecker1979). A good discussion of how to correct for mixing of different water masses is given by Matsumoto (Reference Matsumoto2007).
Three deep stations in the Gulf of Mexico have been sampled previously for Δ14C, at 24°30′N, 94°00′W in 1962 and at 23°45′N, 92°38′W in 1971 (Matthews et al. Reference Matthews, Fredericks and Sackett1973), and at 23°01′N, 92°28′W in 1978 by Morrison et al. (Reference Morrison, Merrill, Key and Key1983). Those samples, which all came from the southwestern GoM, were all obtained using the large-volume sampling method (~250-L samples) combined with β-decay counting rather than the small-volume-AMS methodology used here. The data, shown in Figure 2a, were however inconsistent and implied that bomb-produced 14C in the deep western Gulf of Mexico had increased down to 3000 m during the seven years between the last two cruises, with Δ14C increasing from –140‰ to about –90‰. This did not agree with tritium data, which showed no penetration below about 700 m. Morrison et al. (Reference Morrison, Merrill, Key and Key1983) therefore concluded that the earlier data were inaccurate. The Δ14C data reported by Morrison had an estimated uncertainty of±4‰, but their deep water values ranged between –80‰ and –100‰, with a minimum near 3000 m. One possible cause of the unexpected noise in these samples was the fact that the large volume samples had to be collected using repeated casts with 30-L Niskin bottles rather than the more conventional 250-L Gerard barrels commonly used at that time.
Based on GEOSECS data, the pre-bomb surface ocean Δ14C value is thought to have been about –60‰ (Östlund and Rooth Reference Östlund and Rooth1990; Matsumoto and Key Reference Matsumoto and Key2004), although Broecker (Reference Broecker1979) used –69‰. Deep water values are lower (more negative) owing to radioactive decay during circulation within the thermohaline (Druffel Reference Druffel2002; Toggweiler and Key Reference Toggweiler and Key2002; Key et al. Reference Key, Kozyr, Sabine, Lee, Wanninkhof, Bullister, Feely, Millero, Mordy and Peng2004). During the late 1950s and especially the first half of the 1960s, atmospheric testing of thermonuclear weapons caused a huge increase in the atmospheric Δ14C (Hua et al. Reference Hua, Barbetti and Rakowski2013), leading to more positive values for Δ14C, and this added 14C has been slowly working its way deeper into the water column. Once atmospheric bomb-testing ceased, the atmospheric Δ14C level rapidly decreased as the atmospheric 14C was deposited, primarily as 14CO2, onto land and into the surface ocean. The net atmosphere-ocean flux of 14C is now near zero and in some places there is a flux from the ocean back to the atmosphere (Graven et al. Reference Graven, Gruber, Key, Khatiwala and Giraud2012). The –60‰ value, equivalent to the earlier surface or present day deep Labrador Sea concentrations, is now found at about 600–650 m, well above the Florida Strait sill depth of ~740 m.
Local increases of Δ14C to more positive values reflect the downward movement of bomb-produced 14C in the source waters of the Loop Current in both the North and South Atlantic, while constant values of about –95‰ are achieved at about 900 m depth. Antarctic Intermediate Water, which might also be expected to show an increase in Δ14C because of its formation near the surface in the southern hemisphere with Δ14C somewhere near –110‰ (Matsumoto and Key Reference Matsumoto and Key2004), is characterized by a salinity minimum and found at or about the depth of the Florida Strait sill (Rivas et al. Reference Rivas, Badan and Ochoa2005; Table 1), and our data suggest a value of about –85‰ here (Table 2). This is in reasonable agreement with measurements in the western Atlantic of ~–80‰ (Ostlund and Rooth Reference Östlund and Rooth1990). A minimum in Δ14C slightly below this depth coincides with the oldest apparent age (Figure 2c); a similar feature was also found in samples from around 1000 m depth in the subtropical and tropical North Atlantic by Östlund et al. (Reference Östlund, Dorsey and Rooth1974) and may denote homogeneous mixing of abyssal waters of slightly younger age within the Caribbean Sea. At the time of sampling, the Loop Current extended well into the northern Gulf with its western boundary between 90° and 91°W and its northern boundary near 28°N, as shown by altimetric sea surface height measurements (Figure 3), and the influence of this current is known to extend from the surface to below 1200 m depth. Therefore, it is likely that we sampled a mixture of GoM and Caribbean water in this depth range.

Figure 3 Sea surface height in the Gulf of Mexico for 15 April 2015. Image from http://www.aoml.noaa.gov/phod/dhos/altimetry.php.
As a check on our data, we have estimated the “natural” Δ14C values from the relationships between “natural” Δ14C with silica (Broecker et al. Reference Broecker, Sutherland, Smethie, Peng and Östlund1995) and total alkalinity (Rubin and Key Reference Rubin and Key2002; Table 3). This is required to take account of the decomposition of any particulate carbon (mostly diatoms) that would otherwise interfere in the estimation of the 14C:12C ratio by making it more positive through the incorporation of additional sea surface carbon. For the silica method
 $${\rm \ldquo Natural \rdquo }\rDelta ^{{14}} {\rm C}{\equals}-\!70-\left[ {{\rm Si}} \right]$$
where –70 is the theoretical surface value obtained from models (Graven et al. Reference Graven, Gruber, Key, Khatiwala and Giraud2012) and [Si] is the silicate concentration in µmol/kg (Broecker et al. Reference Broecker, Sutherland, Smethie, Peng and Östlund1995). These calculations give numbers in excellent agreement with the measured values; for 24 samples taken at depths of 750 m or below, the mean “natural” Δ14C value is –94.9‰, with standard deviation of 2.3‰, again well within the 4‰ error of the measurements. Thus, the mean apparent age of the deep water in the Gulf of Mexico below 900 m is about 740±32 yr. Using the slightly different Δ14C–Si relationship of Rubin and Key (Reference Rubin and Key2002) for the Atlantic
 $${\rm Natural}\,\rDelta ^{{14}} {\rm C}{\equals}-\!82-0.68\left[ {{\rm Si}} \right]$$
the mean value for natural Δ14C deeper than 800m is –99.1 with standard deviation 1.1‰.
The potential alkalinity method relies on the relationship between 14C and alkalinity when the latter has been corrected for biological activity (Rubin and Key Reference Rubin and Key2002). This is then normalized to a salinity of 35 via Equation (3) (Brewer and Goldman Reference Brewer and Goldman1976) and “natural” Δ14C is calculated from Equations (4) or (5), depending on whether one uses the global Equation (4) or that based on Atlantic data, Equation (5). The difference between the two is 3–4‰, with the Atlantic equation giving more positive values.
 $${\rm Palk}{\equals}\left( {{\rm alkalinity}{\plus}{\rm nitrate}} \right){\times}35/{\rm salinity}$$
 $${\rm Natural}\,\rDelta ^{{14}} {\rm C}{\equals}-\!59.0-0.962{\times}\left( {{\rm Palk}-2320} \right)$$
 $${\rm Natural}\,\rDelta ^{{14}} {\rm C}{\equals}-\!53.6-1.000{\times}\left( {{\rm Palk}-2320} \right)$$
Using Equations (3) and (4) gives slightly lower natural Δ14C values of –100.4‰ (standard deviation 10.7‰) for samples below 750 m depth decreasing to –104.0±8.8‰ if only samples from below 1150 m are considered, but this is still within any likely error. Use of Equation (5) gives ranges of –96.6±11.1‰ for samples below 750 m and –100.4±9.1‰ if only those from deeper than 1150 m are considered. The modification to the potential alkalinity method proposed by Sweeney et al. (Reference Sweeney, Gloor, Jacobson, Key, McKinley, Sarmiento and Wanninkhof2007), primarily for lower thermocline Pacific waters, has negligible impact on the deep GoM samples due to the relatively high oxygen concentrations.
It is perhaps not surprising that there is little difference between the measured Δ14C values and the “natural” values (see Table 3) estimated by Equations (1–5). This is because the deep GoM is known to be oligotrophic, so very little particulate carbon is likely to reach the deep waters except over the upper slope, where particulate organic carbon concentrations are typically 1–3 µmol/L (Cherrier et al. Reference Cherrier, Sarkodee-Adoo, Guilderson and Chanton2014; W Gardner, personal communication) and advection of material from the shelf may occur, although we did not see this during the cruise. However, it is possible that recent bomb carbon has been transported into the deep GoM through sinking organic matter produced at the surface. Cherrier et al. (Reference Cherrier, Sarkodee-Adoo, Guilderson and Chanton2014) found that in De Soto canyon, east of the Mississippi delta, following the Deepwater Horizon rig blowout, particulate matter showed highly depleted Δ14C and δ13C values at depth and a positive relationship between them. This was attributed to surface organisms ingesting depleted oil and gas residues following the spill. A plot of Δ14C against δ13C for our samples shows a negative slope, with δ13C increasing through the thermocline as Δ14C decreases, and roughly constant values of 0.95–1.04 for all samples from below 1000 m depth. This could therefore be attributed to bomb carbon being transported into the deep GoM, and would mean that our estimated age of the deep water is a minimum.
Table 3 Chemical data for determining the “natural” Δ14C values (to nearest 0.1‰) based on their relationships with silicate (a) or alkalinity (b, c). Alkalinity calculations use either the general relationship for the global oceans (b) or that for the Atlantic (c) developed by Rubin and Key (Reference Rubin and Key2002). See text for details. All Δ14C values are in ‰.
The only entrance to the GoM is via Yucatan Strait from the Caribbean, which in turn contains a well-mixed deep water mass. Although many passages connect the Caribbean Sea to the Atlantic Ocean, the deepest channel, the Anegada-Jungfern Passage between Puerto Rico and St Croix, has a sill depth of only 1815 m at its western end in the Jungfern Passage at 17°35.1′N, 65°14.2′W (Fratantoni et al. Reference Fratantoni, Zantopp, Johns and Miller1997). Thus, it is unnecessary to consider any water mass below the upper NADW in terms of a source for deep water in the Caribbean and GoM. There are only three records of 14C data from the eastern Caribbean; one set was taken in the Venezuela Basin in 1973 (Ribbat et al. Reference Ribbat, Roether and Münnich1976) and gave a mean Δ14C of –89.3‰ for all depths below 1500 m. Broecker et al. (Reference Broecker, Blanton and Smethie1991) point out that the 14C decay rate is equivalent to a loss of 10‰ in 80yr, so assuming no deeper penetration of bomb carbon in the region, these data are equivalent to a present day concentration of about –94.3‰, in good agreement with our data from the Gulf. More recently, a station was occupied at 66°W, 14.35°N during the occupation of WOCE line A22 in 1997 (Johnson et al. Reference Johnson, Key, Millero, Sabine, Wallace, Winn, Arlen, Erickson, Friis, Galanter, Goen, Rotter, Thomas, Wilke, Takahashi and Sutherland2003). The mean natural 14C value below 1500 m was about –108±8‰, calculated according to Sweeney et al. (Reference Sweeney, Gloor, Jacobson, Key, McKinley, Sarmiento and Wanninkhof2007), suggesting very slow replenishment of the deep water in the 4500-m-deep basin. However, the data seem to show invasion by bomb 14C between 1500 and 2800 m depth, as is also clearly shown by tritium data from this cruise. More recent CLIVAR data taken along the same A22 line during 2012 suggest little or no pre-bomb carbon below about 800 m depth (Δ14C ~–90‰), but there are only very limited data from below 2000 m (R M Key, personal communication). Tritium, however, is observable throughout the water column in this basin. As discussed above, this suggests that 14C has invaded the deep Caribbean and again means that our estimates for the age of the deep water may be too young. Further samples from this region are needed to clarify this.
Despite the well-mixed nature of the deep water in the GoM, a section along approximately 90°30′W shows some apparent structure in both density and Δ14C (Figure 4). Water between about 900 and 1400 m at stations 304 and 306 had the lowest Δ14C concentrations at about –100‰ and appears to be somewhat older than the rest of the water sampled, while the water immediately below it seems to be somewhat denser (σθ >27.73) than elsewhere. Östlund et al. (Reference Östlund, Dorsey and Rooth1974) and Östlund and Rooth (Reference Östlund and Rooth1990) showed a minimum in Δ14C of the same magnitude at this depth at 21°N in their analysis of 14C data from the Atlantic GEOSECS and TTO cruises, and it is tempting to suggest that the values seen here result from the advection of this water mass into the Gulf of Mexico in the Loop Current via the Caribbean (see Figure 3). It is unclear where this minimum comes from, although it is also seen as a local minimum or inflection in tritium data from the same stations in the subtropical Atlantic (Östlund et al. Reference Östlund, Dorsey and Rooth1974). It seems too deep to be Antarctic Intermediate Water, which is found at a depth of about 750 m in the western subtropical North Atlantic and has a Δ14C of –80 to –85‰, and does not coincide with any particular parameter inflection according to WOCE data (Koltermann et al. Reference Koltermann, Gouretski and Jancke2011). However, allowing for radioactive decay since the GEOSECS data (1972) and TTO data (1981) were collected, and the fact that Östlund et al. (Reference Östlund, Dorsey and Rooth1974) did not correct their data for potential interference from biology, one would expect Δ14C to be nearer –105‰ than the –100‰ we observed. Water at this depth can, of course, enter the Caribbean further north than the deeper water, through the Windward Passage between Cuba and Hispaniola, and as the 14C signal has presumably penetrated further into the water column since the TTO transects this would make the Δ14C value more positive and possibly cancel out the expected decay.

Figure 4 Apparent age as a function of depth and density for the 14C samples taken along 90°30′W. Discrete samples are shown by circles, with red circles showing the 14C sampling sites. Contour lines show the apparent age in years.
An alternative possibility is that the water on the slope of the northern Gulf of Mexico has been contaminated by “dead” carbon. Hundreds of active seeps are known on the shelf and slope in this region (MacDonald et al. Reference MacDonald, Guinasso, Ackleson, Amos, Duckworth, Sassen and Brooks1993, Reference MacDonald, Reilly, Best, Venkataramaiah, Sassen, Amos and Guinasso1996, Reference MacDonald, Leifer, Sassen, Stine, Mitchell and Guinasso2002) and because the oil formations were laid down millions of years ago, any carbon released by them will be radiologically “dead.” This will affect the 14C:12C ratio used to calculate the Δ14C value, pushing it towards more negative values. Our samples were taken across the slope in an area where active drilling for oil and gas is occurring, and Figure 4 shows that the oldest apparent ages were found adjacent to the slope between about 850 and 1200 m depth. Although background levels of dissolved oil are generally very low (Wade et al. Reference Wade, Sericano, Sweet, Knap and Guinasso2016), many of the wells also contain high gas concentrations, and the oxidation of dissolved gas leaking from these seeps may be able to affect the ratio and thus the apparent age. However, the lack of any obvious variability in δ13C values below 1000 m depth (see Table 2) suggests that any such contamination is minimal.
As stated above, the apparent age based on Δ14C is not the actual age of the water sample. This may be calculated, however, by making the necessary corrections, as per Matsumoto (Reference Matsumoto2007). Because deep water in the Atlantic Ocean is a mixture of water from the Arctic and Antarctic, one has first to determine how much each source contributes to a particular water sample. Broecker et al. (Reference Broecker, Blanton and Smethie1991) showed that NADW at 2400 m depth contained more than 90% northern water. As the deepest water that feeds the Caribbean is from 500 m shallower than this, we can probably ignore any contribution from the Antarctic other than a small contribution from AAIW and assume that all the water comes originally from the northern North Atlantic. Broecker et al. (Reference Broecker, Blanton and Smethie1991) in fact state that the effect of AAIW is likely important only south of about 30°S, so we have ignored its possible influence. However, one still has to reset the reservoir age of the northern deep water to zero so that the measured age is then the time elapsed since the water parcel was isolated from the atmosphere. For northern source water this is done by subtracting –67‰ from the measured Δ14C concentration; for any Antarctic component the correction is –140‰ (Broecker et al. Reference Broecker, Peacock, Walker, Weiss, Fahrbach, Schroeder, Mikolajewic, Heinze, Key, Peng and Rubin1998). These corrections need to be weighted by the percentage of each water source in the sample, which in this case is 1.0 as we are only considering a northern source.
The new residual Δ14C value is converted to a “circulation age” by application of Equation (6)
 $${\rm A}{\equals}-\!8033\,{\times}\,{\rm ln}\left( {1{\plus}\rDelta ^{{14}} {\rm C}/1000} \right)$$
where A is the circulation age and Δ14C is the depth averaged residual. Taking the mean measured value for our samples below 900 m depth of –95.4±3.4‰, this gives a circulation age for the water in the deep Gulf of Mexico of 231±28 yr. If, instead, we use the natural Δ14C age determined using Equations (3) and (4), then the circulation age becomes 293±74 yr. Using the Atlantic Equation (5) produces an intermediate age of about 263±84 yr. All these estimates are in good agreement with the heat flux estimate of Rivas et al (Reference Rivas, Badan and Ochoa2005), as well as a basic calculation of residence time for the deep water by Matthews et al. (Reference Matthews, Fredericks and Sackett1973) of 270 yr. These ages also put upper limits on the age of the deep water in the Caribbean Sea, given that this is the source of deep water in the Gulf of Mexico, and agree with the original estimate of a 275-yr turnover time for the deep Atlantic by Stuiver et al. (Reference Stuiver, Quay and Ostlund1983). If anything, because of the caveats considered above, particularly the potential for invasion of the Caribbbean and GoM by bomb carbon, these will be minimum ages. However, additional measurements from other parts of the regional seas, coupled with tracers such as tritium or CFCs, are needed to confirm this and provide additional data on the penetration of anthropogenic gases into the Gulf of Mexico and the Caribbean.
ACKNOWLEDGMENTS
We thank the captain and crew of the R.V. Pelican for their seamanship during the cruise. This research was made possible by a grant to the Gulf Integrated Spill Consortium from the Gulf of Mexico Research Initiative. Data are archived at and are publically available from the Gulf of Mexico Research Initiative Information and Data Cooperative (GRIIDC) at https://data.gulfresearchinitiative.org as data sets R1.x137.000:0004 (doi:10.7266/N7Z60M3Z) and R1.x137.131:0006 (doi:10.7266/N7M32ST2). NOSAMS is supported by NSF through Cooperative Agreement OCE-1239667.


