


INTRODUCTION
As a major atmospheric circulation system, the mid-latitude Westerlies (MLW) played an important role in climatic and environmental changes in the Northern Hemisphere, as well as in the evolution of civilization, especially in arid Central Asia and parts of the Tibetan Plateau (e.g., Chen et al., Reference Chen, Jia, Chen, Li, Zhang, Xie, Xia, Huang and An2016, Reference Chen, Chen, Huang, Chen, Huang, Jin and Jia2019; Ling et al., Reference Ling, Yang, Wang, Wang, Jin, Zhang and Chen2020). The MLW transport water vapor from the water bodies upwind (i.e., the Mediterranean Sea, Caspian Sea, and Black Sea), causing variations in modern precipitation (as well as during the Holocene) in arid Central Asia (An et al., Reference An, Lu, Zhao, Tao, Dong, Li, Jin and Wang2012; Wang et al., Reference Wang, Feng, Ran and Zhang2013; Chen et al., Reference Chen, Jia, Chen, Li, Zhang, Xie, Xia, Huang and An2016; Song et al., Reference Song, Yang, Nie, Zan and Song2021) and the southern Tibetan Plateau (Tian et al., Reference Tian, Yao, White, Yu and Wang2005; Hou et al., Reference Hou, D'Andrea, Wang, He and Liang2017; Sun et al., Reference Sun, Yuan, Hou, Ji, Li, Wang and Hou2020; Kumar et al., Reference Kumar, Ramanathan, Bakke, Kotlia, Shrivastava, Kumar, Sharma and Kumar2021). Numerous studies have tried to extract information about the intensity of the MLW from sedimentary grain-size distributions, because the MLW transports fine-grained particles to the regions downwind. The results of the grain-size analysis of aeolian deposits in the regions dominated by the MLW indicate that the fine-grained fraction (2–10 μm) is an index of the intensity of the MLW (Sun, Reference Sun2002; Vandenberghe, Reference Vandenberghe2013; Jia et al., Reference Jia, Liu, Gao and Xia2018, Wang et al., Reference Wang, Jia, Zhao, Liu, Duan, Xie, Zhang and Chen2019; Duan et al., Reference Duan, An, Wang, Herzschuh, Zhang, Zhang, Liu, Zhao and Li2020).
End members (EMs) with modal grain sizes of 11 μm (EM2 in the LJW10 section) and 5 μm (EM2 in the TLD16 section) were identified in loess deposits from the Tien Shan Mountains, in eastern arid Central Asia (Jia et al., Reference Jia, Liu, Gao and Xia2018, Wang et al., Reference Wang, Jia, Zhao, Liu, Duan, Xie, Zhang and Chen2019), which suggests that these fractions were transported by the MLW (in upper-level long-term suspension). Therefore, variations in the sedimentary contribution of the end-members was used to reconstruct past variations in the MLW, and on this basis weaker MLW occurred during the Early to Middle Holocene and stronger MLW during the Middle to Late Holocene. Although both of these studies revealed the trend of variation of the MLW during the Holocene, on an annually averaged basis, the seasonal variations of the MLW remain unclear, especially in winter. Modern meteorological observations and paleoclimatic records have suggested that variation of the MLW in winter makes an important contribution to precipitation in arid Central Asia (Wang et al., Reference Wang, Feng, Ran and Zhang2013; Long et al., Reference Long, Shen, Chen, Tsukamoto, Yang, Cheng and Frechen2017) and the southern Tibetan Plateau (Tian et al., Reference Tian, Yao, White, Yu and Wang2005; Schiemann et al., Reference Schiemann, Lüthi and Schär2009; Yang et al., Reference Yang, Xia, Gao, Wang, Li, Fan and Chen2021).
To address the issue of seasonal variations in the MLW, we studied a high-altitude aeolian sedimentary sequence from the Yarlung Zangbo River valley in the southern Tibetan Plateau, at an elevation >4000 m above sea level (a.s.l.), and then analyzed the modern atmospheric circulation in this region. Our aim was to determine the trend of variation of the winter MLW in the Northern Hemisphere during the Holocene. We extracted a signal of the winter MLW using end-member modeling analysis of the grain-size distributions of the studied sedimentary sequence, and combined with the published chronological framework for the section, we reconstructed the evolution of the winter MLW in the Northern Hemisphere during the Holocene. Finally, we discussed the possible driving mechanism behind the observed changes.
MATERIALS AND METHODS
Geographical setting
The Yarlung Zangbo River flows from west to east across most of the southern Tibetan Plateau (Fig. 1). Aeolian deposits are mainly distributed in the wide river valley at an average altitude of nearly 4000 m, including the Maquanhe wide valley, Shigatse wide valley, Shannan wide valley, and Mainling wide valley, from west to east, lying mainly within the area of 29.25–29.75°N and 88–92°E (Ling et al., Reference Ling, Jin, Wu, Liu, Xia and Chen2019; Yang et al., Reference Yang, Xia, Gao, Wang, Chen, Jia, Yang and Ling2020a). There is almost no aeolian accumulation in the narrow valleys due to the lack of sediment supply and the strong winds. The mean annual temperature in this region ranges from 1.5–8.8°C, and the mean annual precipitation ranges from 131.6–676.7 mm (Shen et al., Reference Shen, Li, Sun and Jiang2012). Aeolian activity occurs mainly in the winter and spring, and the mean annual near-surface wind speed ranges from 1.6–3.3 m/s (Yang et al., Reference Yang, Xia, Wang, Tian, Ma, Chen, Gao, Ling and Dong2020b).
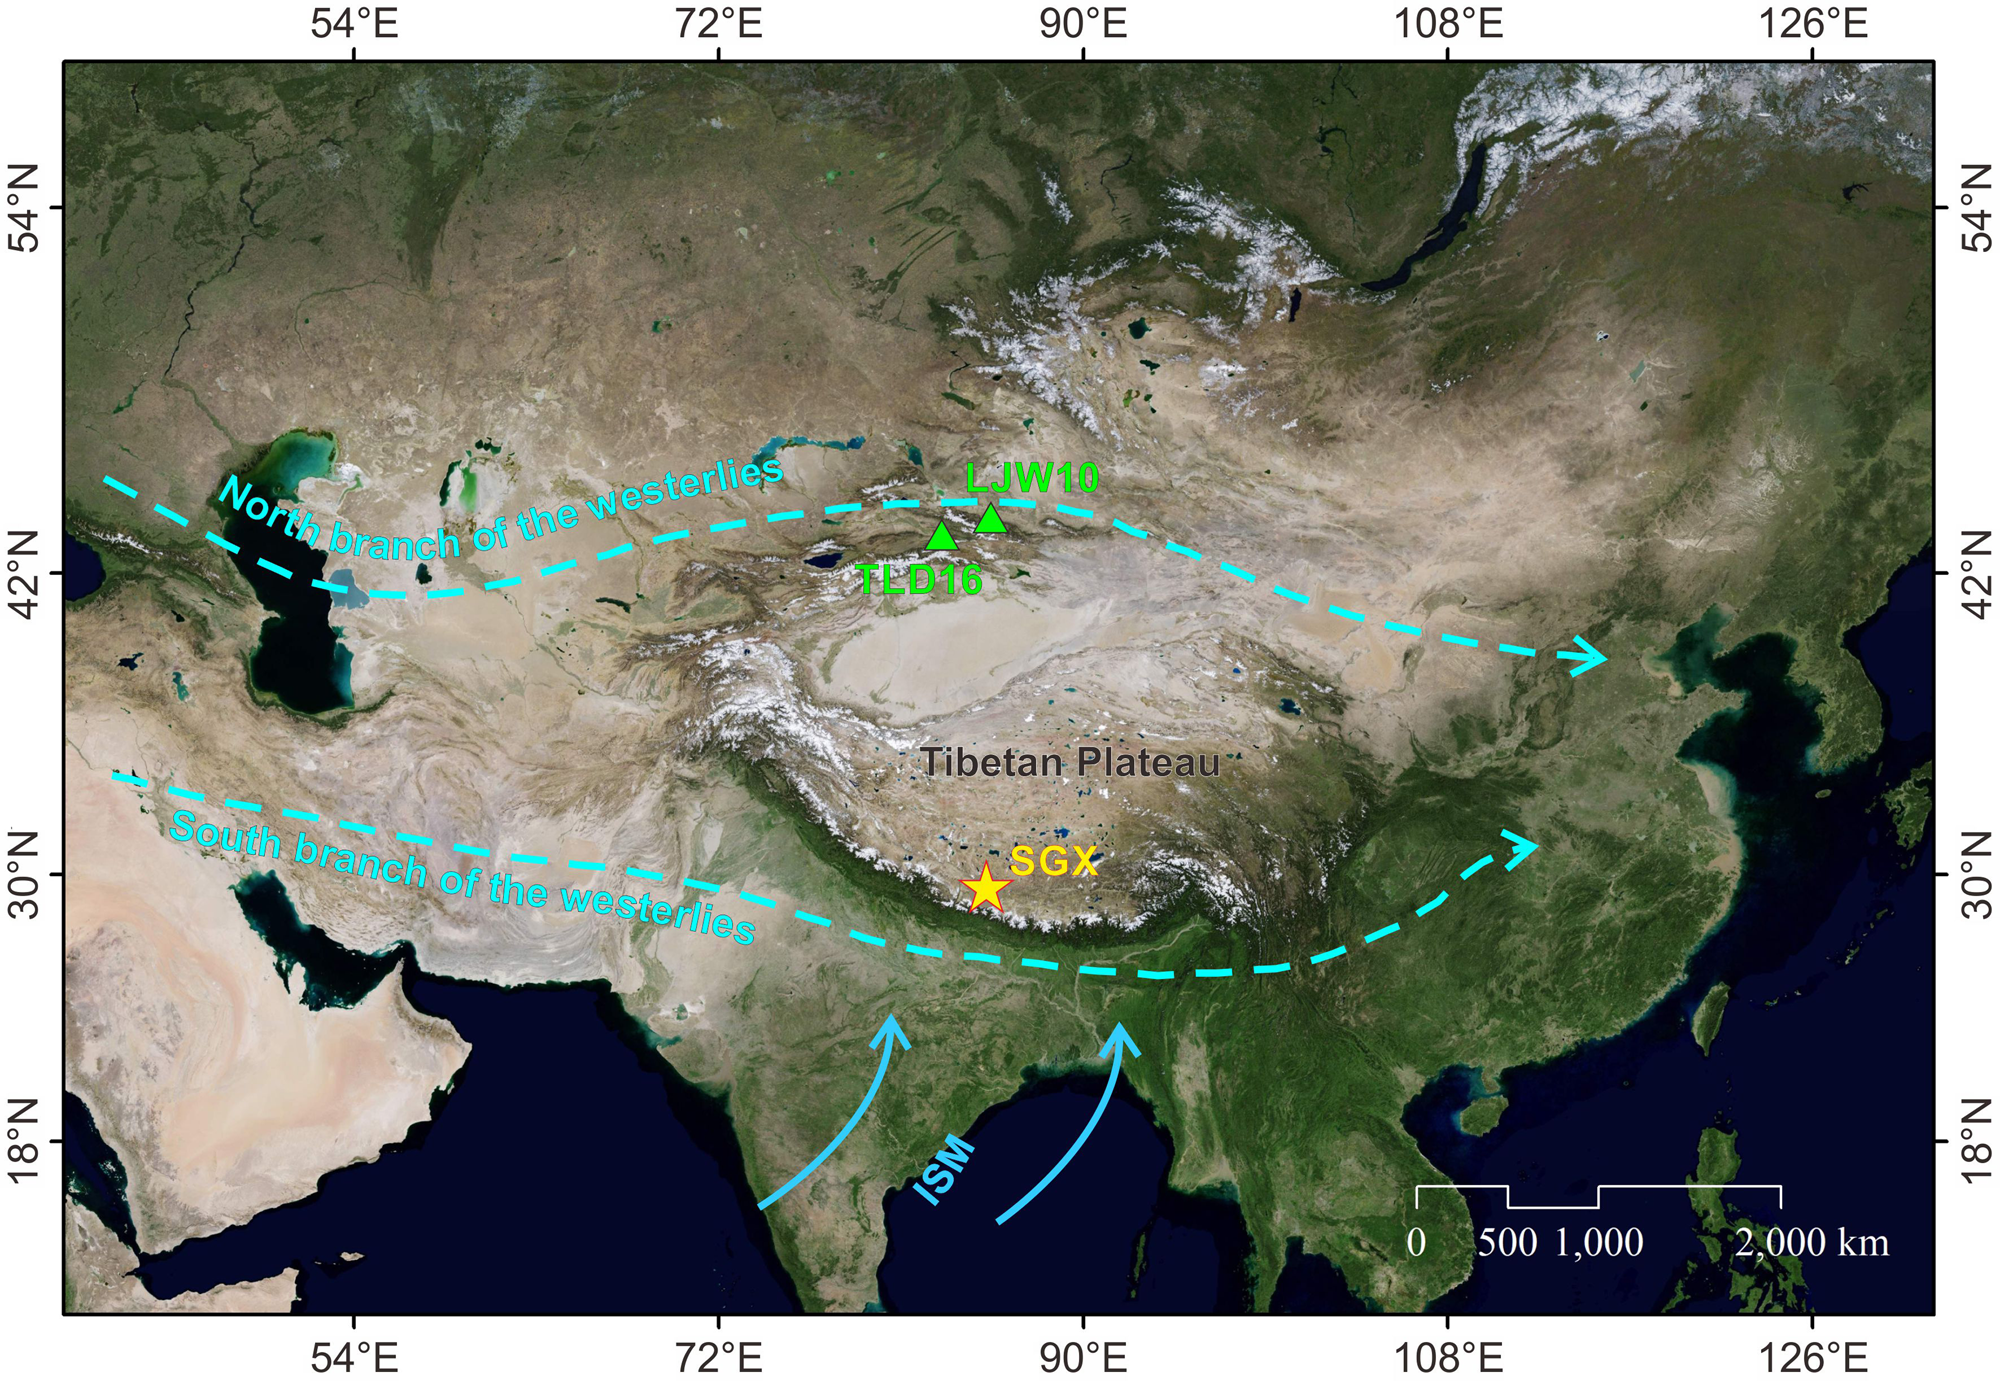
Figure 1. (color online) Location of the study area and the studied aeolian sedimentary sequence. The trajectories of the northern and southern branches of the mid-latitude Westerlies and the Indian summer monsoon are also shown. Abbreviations: ISM, Indian summer monsoon; SGX, Sagaxi section; TLD16, Talaide16 section; LJW10, Lujiaowan10 section.
Studied aeolian section
The Sagaxi (SGX) section (29°19′20.33″N; 85°10′3.93″E, 4452 m a.s.l.) is located in the upper reaches of Yarlung Zangbo River in the southern Tibetan Plateau (Fig. 1). The section is 360 cm thick, and the following stratigraphic units can be defined: 0–100 cm, compact light-yellow loess with calcareous cement and relatively fine particles, the uppermost 10 cm contains a small quantity of plant roots; 100–200 cm, loose gray-brown sandy loess with abundant white calcium mycelium and coarser particles; 200–360 cm, relatively loose gray-brown sandy loess, with two gravel layers at 290–300 cm and 310–315 cm (Fig. 2b). We collected 144 samples at a 2.5-cm interval for measurements of grain size and geochemical and magnetic proxies. Eleven optically stimulated luminescence samples were also collected to establish a robust chronology, using the single-aliquot regeneration method, which is reported in Yang et al. (Reference Yang, Xia, Gao, Wang, Li, Fan and Chen2021) (Fig. 2a).
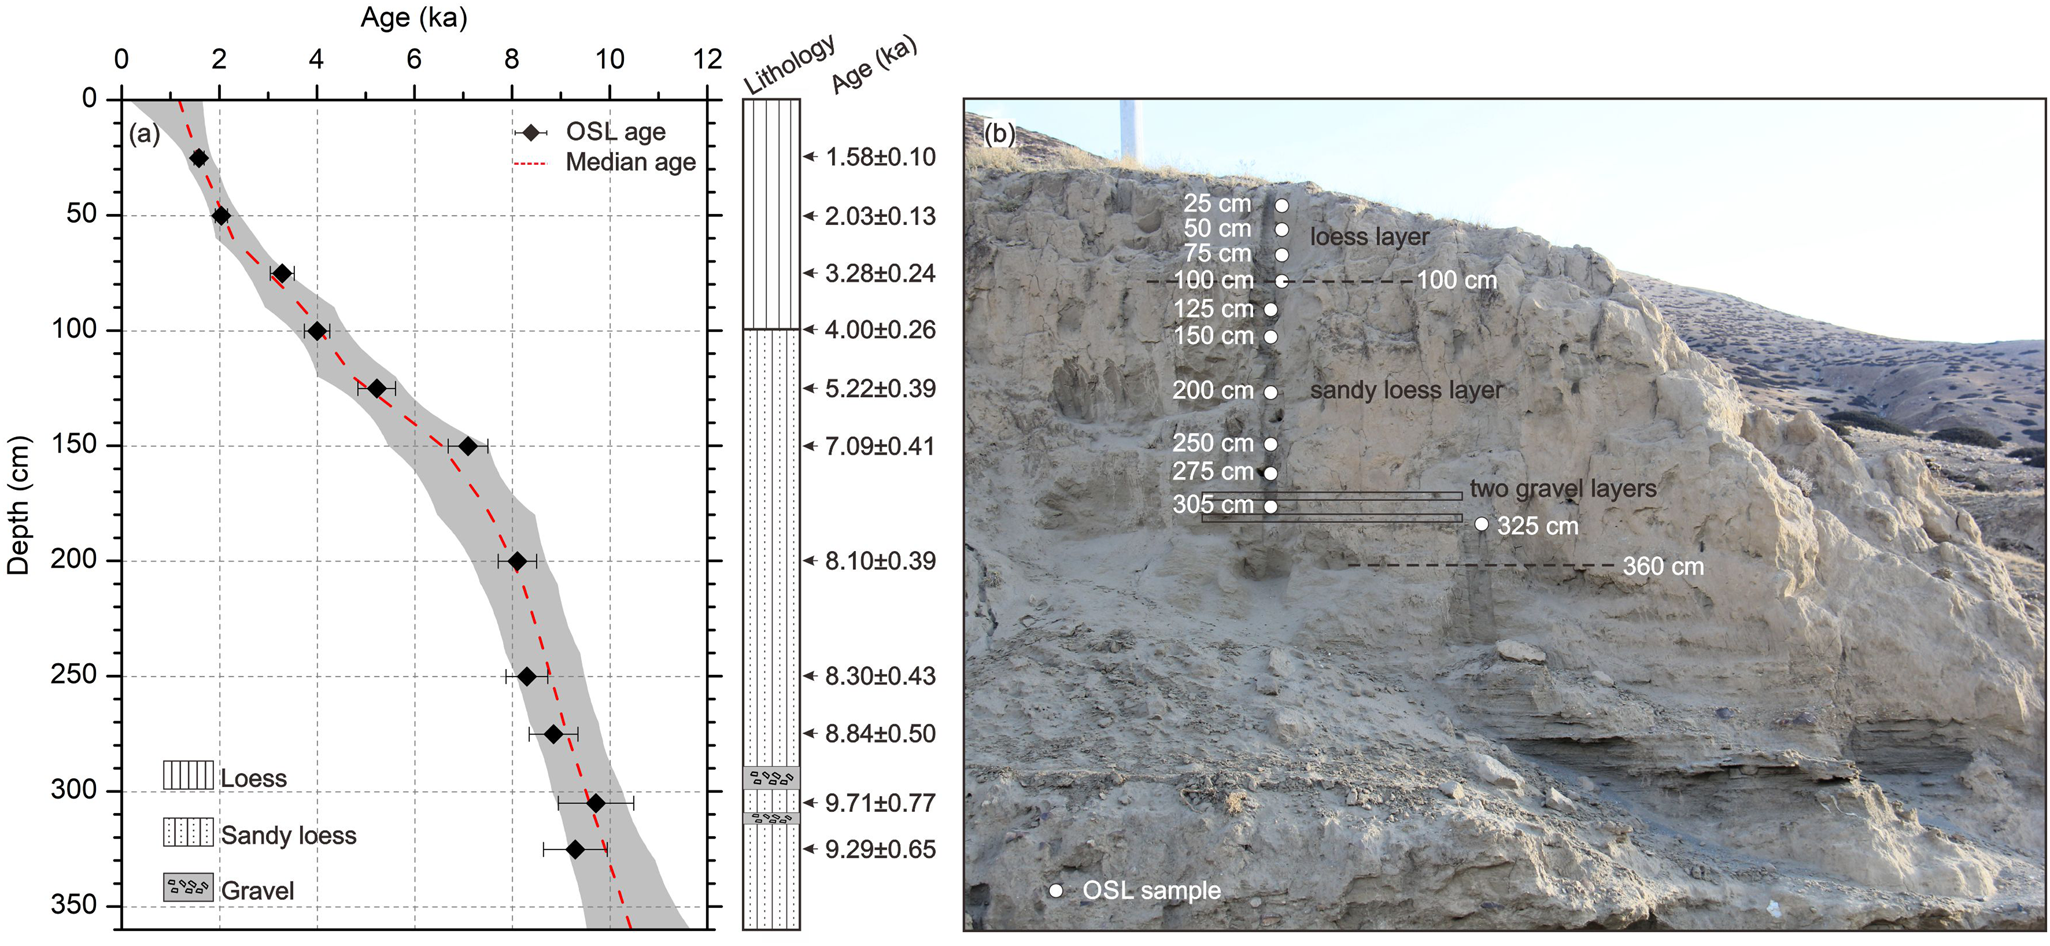
Figure 2. (color online) (a) Optically stimulated luminescence ages and (b) lithology for the SGX section. The chronological data are from Yang et al., Reference Yang, Xia, Gao, Wang, Li, Fan and Chen2021.
Grain-size analysis
We used the pretreatment methods of Lu and An (Reference Lu and An1998) for the grain-size samples. All samples of the SGX section were heated with 10 mL of 30% H2O2 and 10% HCl to remove organic matter and carbonate, respectively. To remove acid ions, the samples were suspended in deionized water for 12 hr. The samples were then dispersed by adding 10 ml of 0.05 mol/L (NaPO3)6 and treating them with ultrasound for 10 min. Grain-size frequency distributions were made with a Malvern Mastersizer 2000 laser-diffraction particle size analyzer, which has a measurement range of 0.02–2000 μm. The Mie model was used to calculate the grain-size distributions, the default refractive index was 1.52, and the absorption coefficient was 0.1.
Geochemical measurements
Measurements of the concentrations of geochemical elements were also performed on all samples. The samples were ground and passed through a 200-mesh sieve, and then 4 g of sediment were placed in a mold and boric acid added to the edge and base. The samples were then compressed into a disc with a diameter of 32 mm under 30 tons of pressure. Element concentrations were measured using a PW2403 X–Ray fluorescence (XRF) spectrometer.
The chemical index of alteration (CIA) has been widely used to evaluate the chemical weathering intensity of sediments, and is positively related to the weathering degree:
 $${\rm CIA} = [ {{\rm A}{\rm l}_2{\rm O}_3/( {{\rm A}{\rm l}_2{\rm O}_3 + {\rm CaO} ^{\ast} { + } {\rm N}{\rm a}_2{\rm O} + {\rm K}_2{\rm O}} ) } ] \times 100$$
Oxides in the formula are expressed in molar ratios, and CaO* refers only to CaO in silicates. Therefore, we calculated the CaO* by removing the CaO contained in carbonates using the method of McLennan (Reference McLennan1993), which assumes CaO/Na2O = 1 in silicates. If CaO/Na2O <1, then CaO* = CaO. However, if CaO/Na2O >1, then CaO* = Na2O. Changes in the weathering degree are closely related to climate change, with high CIA usually indicating a relatively warm and wet climate.
Magnetic measurements
Air-dried samples were ground and packed in 2×2×2 cm3 plastic boxes and used for measurements of low-frequency (470 Hz) and high-frequency (4700 Hz) magnetic susceptibility (χlf and χhf, respectively) using a Bartington MS2 magnetic susceptibility meter. The two parameters were used to calculate the frequency-dependence of magnetic susceptibility (χfd), which is defined as χfd = χlf − χhf.
All of the above experiments were performed at the Key Laboratory of Western China's Environmental Systems (Ministry of Education), Lanzhou University, China.
RESULTS
End-member analysis
The numbers of EMs for the grain-size distributions were set from 1 to 10 and the end-member models are illustrated in Figures 3 and 4 (Fig. 4a shows that the grain-size distributions of the samples from the SGX section are polymodal). The fitting precision and the number of end members were determined by the coefficient of determination (R 2, Fig. 3a) and the angular deviation (Fig. 3b). Generally, a better-fitting precision is indicated by both a higher R 2 and the lower angular deviation (Duan et al., Reference Duan, An, Wang, Herzschuh, Zhang, Zhang, Liu, Zhao and Li2020). When the number of EMs increases to four, R 2 is almost close to one and the angular deviation degree is <5, and at the same time, the correlation between the end members is relatively low (R 2 = 0.17). Therefore, four EMs were identified for the SGX section, with modal grain sizes of 8.1 μm (EM1), 66.4 μm (EM2), 127.0 μm (EM3), and 243.0 μm (EM4) (Fig. 4b). Combining the chronology of the SGX section with profiles of the EMs (Fig. 5) shows that the values of EM1 were lower before ca. 6 ka and that high values occurred during 6–1 ka. EM2 increased during 10.3–7.5 ka and high values occurred during 7.5–1 ka. EM3 gradually decreased, with fluctuations, during 10.3–1.0 ka. High values of EM4 occurred before 9 ka and lower values thereafter. Overall, the mean grain size gradually decreased during the Holocene (Fig. 5).
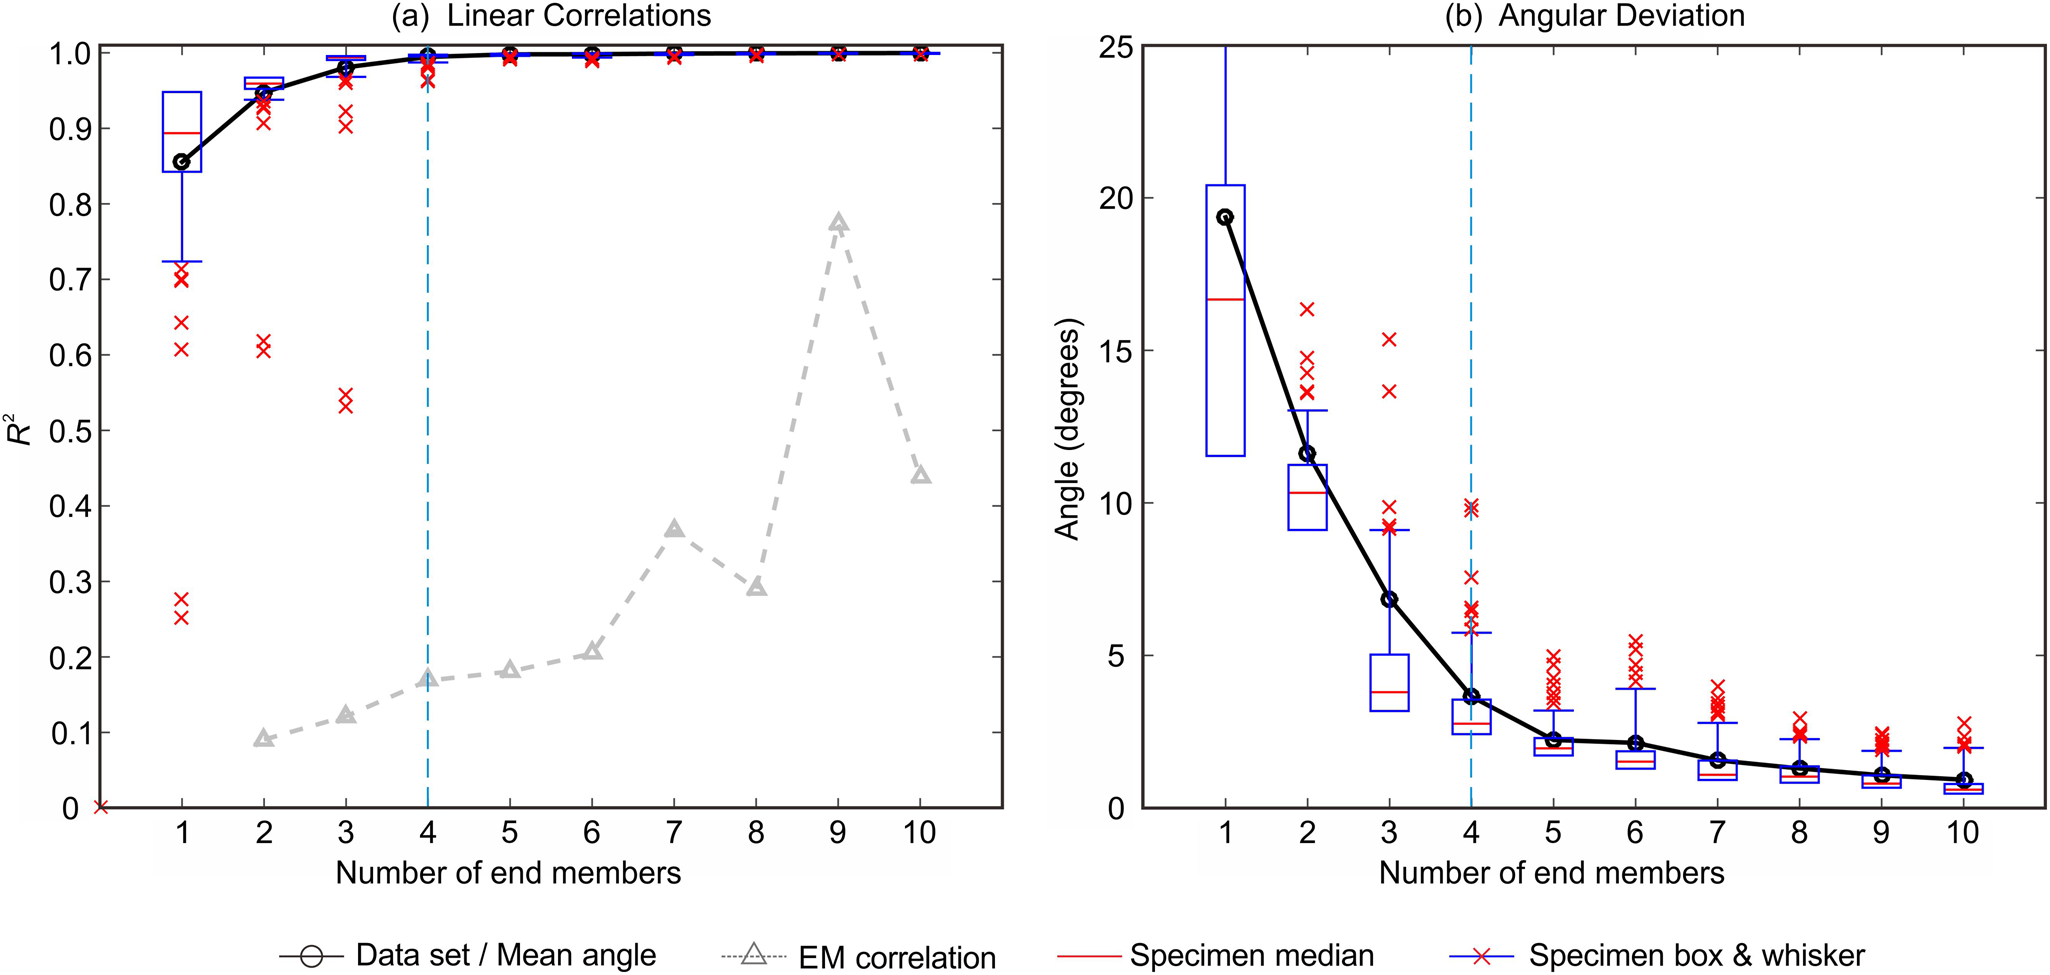
Figure 3. (color online) Linear correlations (a) and angular deviation (b) of the grain-size end members for the SGX section.
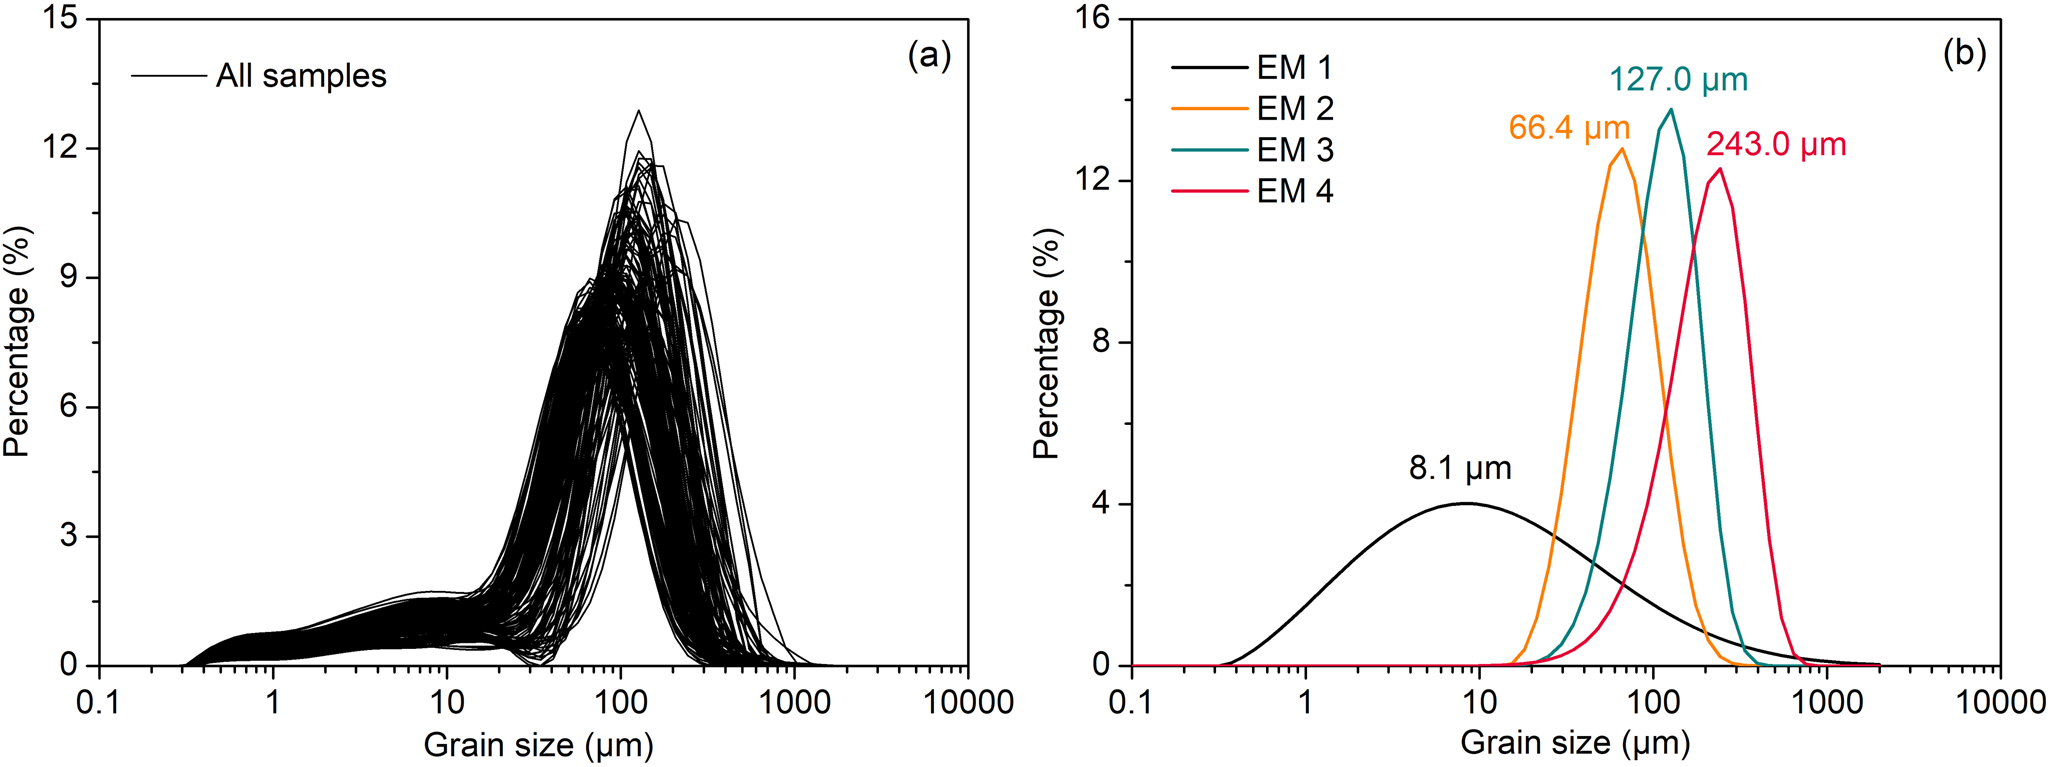
Figure 4. (color online) Grain-size frequency distributions for (a) all samples and (b) end members of the SGX section.
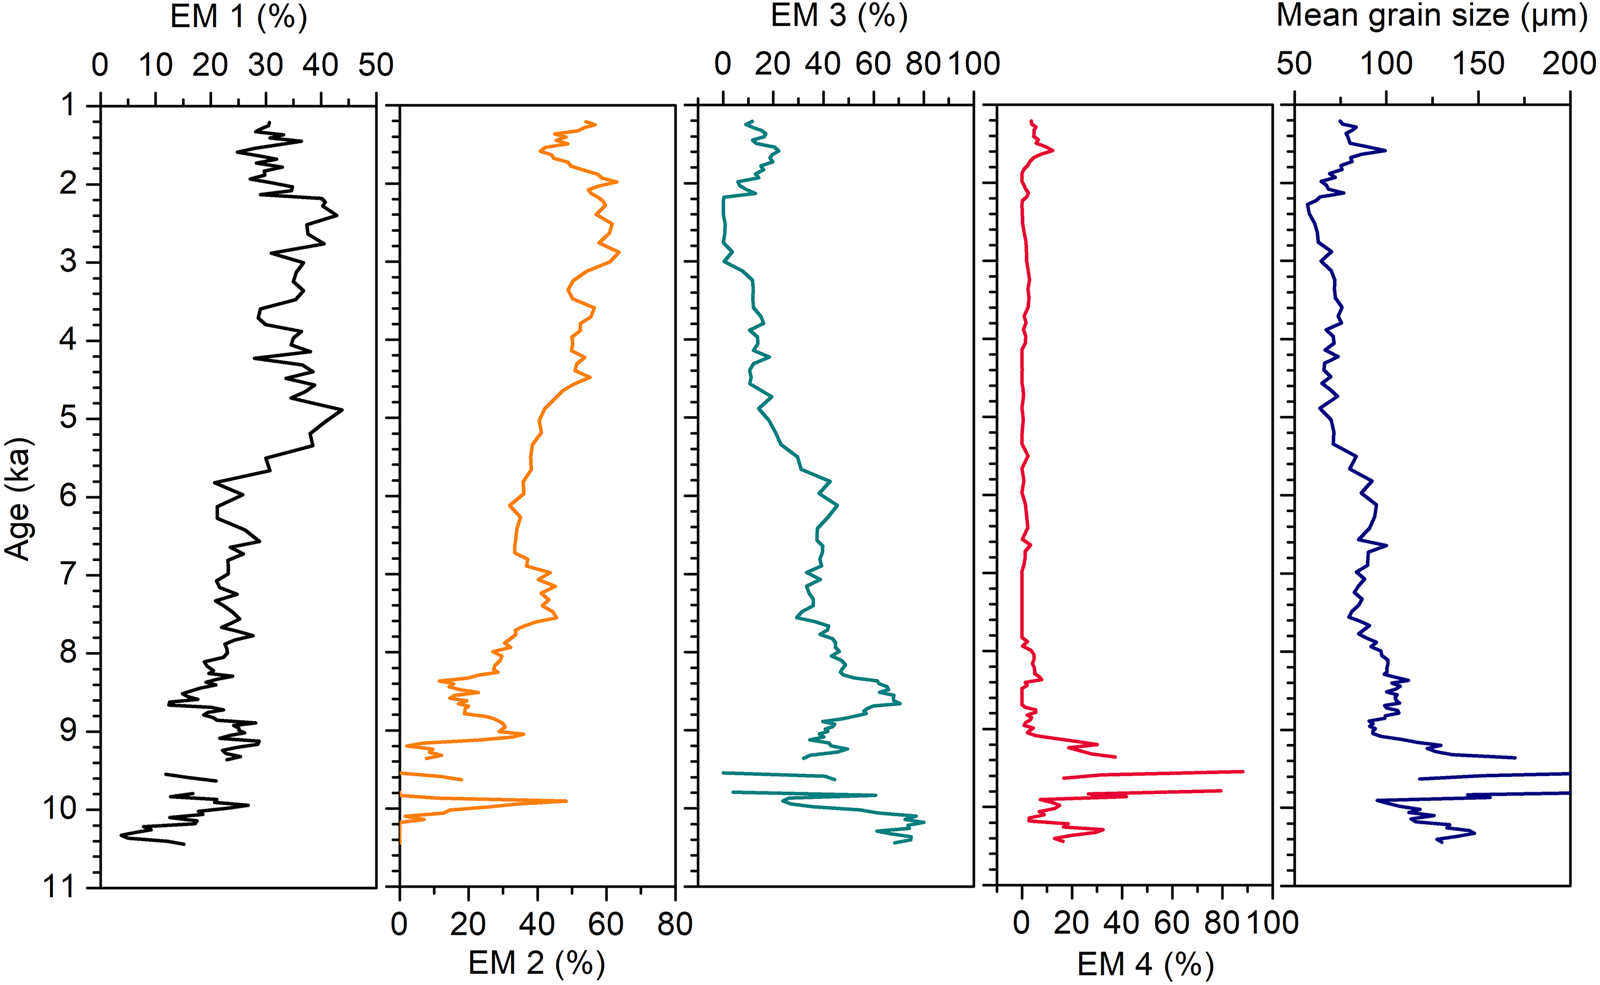
Figure 5. (color online) Time series of the four End members and the mean grain-size of the SGX section.
Seasonal differences in wind circulation
We used data from the National Center for Environmental Prediction/National Center for Atmospheric Research (NCEP/NCAR Reanalysis 1) for 1948–2016 to analyze seasonal changes in atmospheric circulation (Fig. 6). In summer, the southern Tibetan Plateau is influenced mainly by the Indian summer monsoon and rarely by the MLW, except at the 400 hPa level (~7000 m) (Fig. 6a, c, e). In winter, the southern Tibetan Plateau is influenced solely by the MLW at the 400 hPa, 500 hPa, and 600 hPa levels (Fig. 6b, d, f). The Tien Shan Mountains, in eastern arid Central Asia, are dominated by the MLW at the 400 hPa, 500 hPa, and 600 hPa levels, in both summer and winter. In addition, the MLW in winter were stronger than in summer.
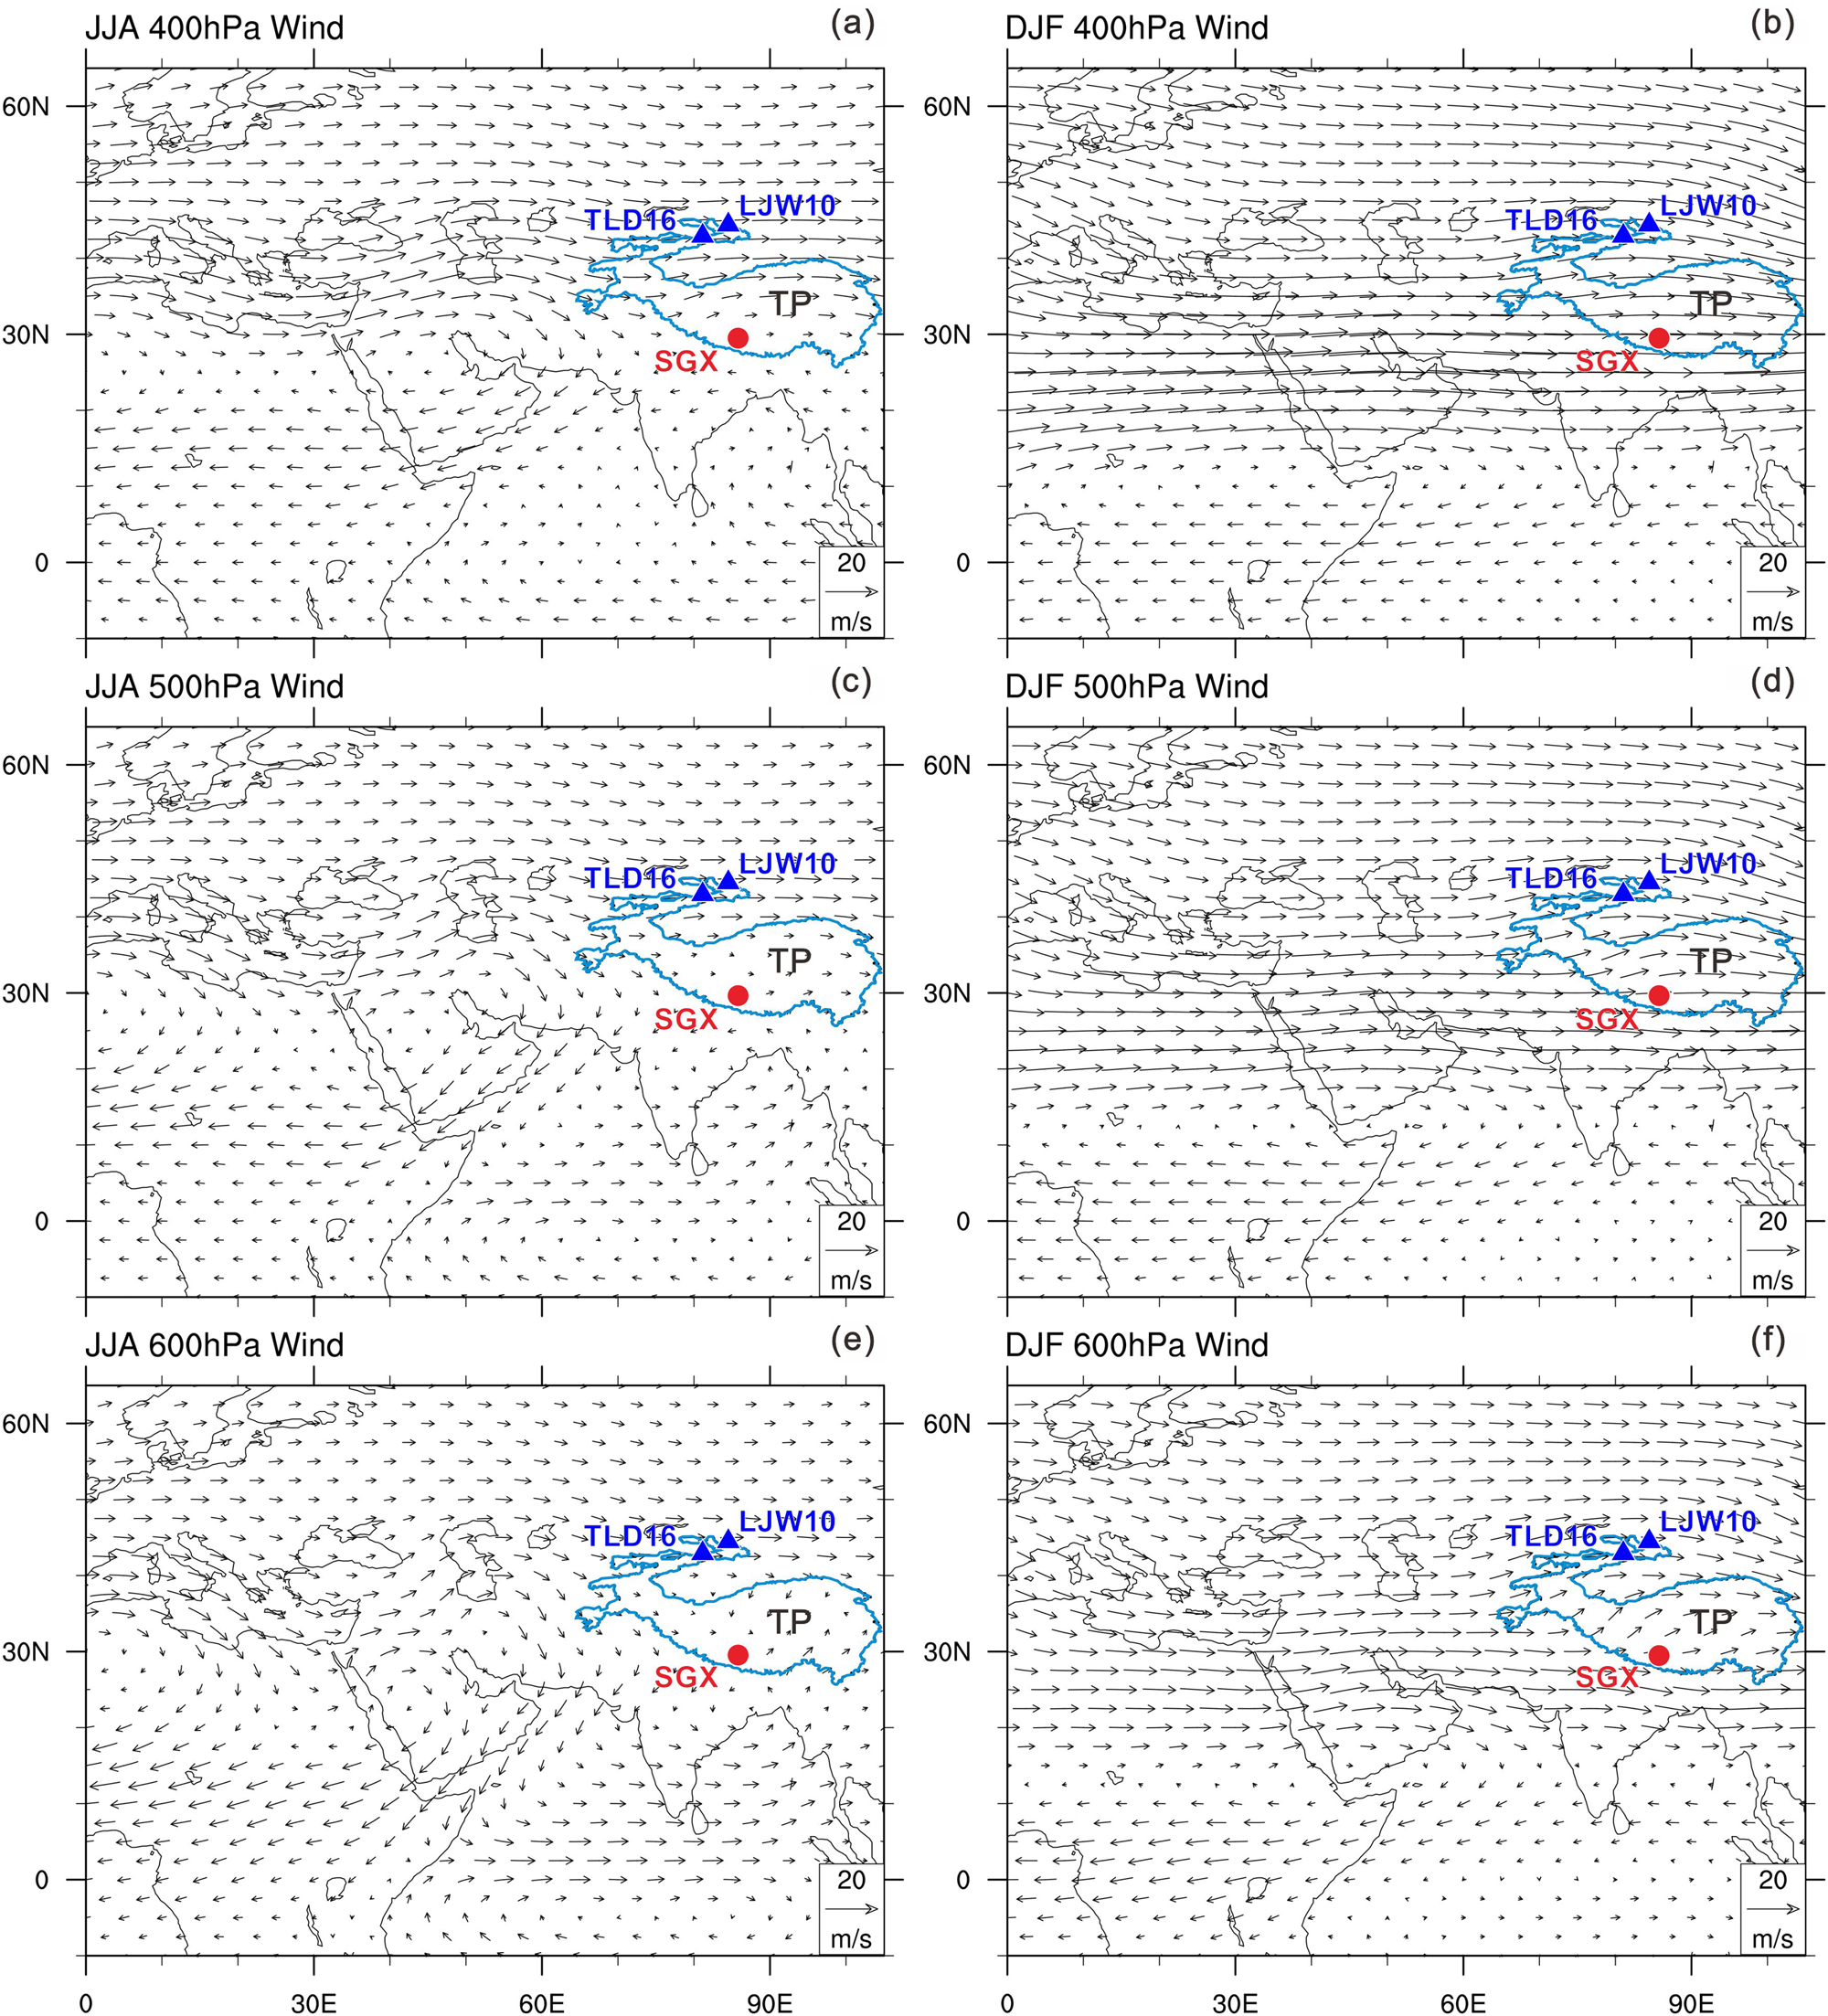
Figure 6. (color online) Atmospheric circulations over the Tibetan Plateau (TP) and the surrounding regions. Wind circulation at the 400, 500, and 600 hPa levels in (a, c, e) summer (JJA: June, July, and August) and (b, d, f) winter (DJF: December, January and February). Data are from the National Center for Environmental Prediction/National Center for Atmospheric Research.
DISCUSSION
Paleoclimatic implications of EMs in the SGX section
As a continuous background supply of atmospheric dust (Vandenberghe, Reference Vandenberghe2013), the 2–10 μm grain-size fraction has been widely applied to reveal variations in the strength of the MLW (Sun, Reference Sun2002; Jia et al., Reference Jia, Liu, Gao and Xia2018, Wang et al., Reference Wang, Jia, Zhao, Liu, Duan, Xie, Zhang and Chen2019; Duan et al., Reference Duan, An, Wang, Herzschuh, Zhang, Zhang, Liu, Zhao and Li2020). Grain-size analysis of a loess section (LJW10, 43°58′29″N, 85°20′10″E) in the northern Tien Shan Mountains, in eastern arid Central Asia, indicated that EM1 (modal grain size 1.6 μm) was produced by pedogenesis, and that EM2 (modal grain size 11 μm) was transported by the Westerlies (Jia et al., Reference Jia, Liu, Gao and Xia2018). End-member analysis of a loess section (TLD16, 43°20′99″N, 85°1′4.5″E) in the Yili valley, eastern arid Central Asia, indicated that EM1 (modal grain size 1 μm) was linked to pedogenesis, and that EM2 (modal grain size 5 μm) was closely related to the MLW (Wang et al., Reference Wang, Jia, Zhao, Liu, Duan, Xie, Zhang and Chen2019). Another end-member analysis of a loess section (SCZ17, 43°37′2.34″N, 89°45′31.67″E), also in the northern Tien Shan Mountains, indicated that EM1 (modal grain size 5.3 μm) and EM2 (modal grain size 10.5 μm) were likely transported by the MLW and then deposited by rainout (Duan et al., Reference Duan, An, Wang, Herzschuh, Zhang, Zhang, Liu, Zhao and Li2020). Therefore, we infer that EM1 (modal grain size 8.1 μm, in this study) is closely linked to pedogenesis and the MLW.
The chemical index of alteration (CIA) of the samples from the SGX section are between 50 and 65. A plot of the CIA versus Na/K indicates the occurrence of only weak chemical weathering intensity in the SGX section (Fig. 7). The χfd is a measure of the proportion of fine ferrimagnetic grains in magnetic mineral assemblages, and can be used as an indicator of the degree of pedogenic development of aeolian deposits (e.g., Chen et al., Reference Chen, Jia, Chen, Li, Zhang, Xie, Xia, Huang and An2016; Gao et al., Reference Gao, Jia, Xia, Lu, Lu, Wang, Liu, Ma and Li2019). We compared the χfd of loess-paleosol sequences from the Chinese Loess Plateau in northern China and the Tien Shan Mountains in northwestern China with the SGX section in this study. The results suggest that the χfd values of the SGX section (<2 × 10⁻⁵ m3/kg) are significantly lower than those of paleosols from the Chinese Loess Plateau and the Tien Shan Mountains, and are similar to the values of loess from the Tien Shan Mountains, which reflect extremely weak weathering and pedogenesis (Fig. 8). Both the geochemical and magnetic evidence suggest that the contribution of pedogenesis to EM1 is very limited, and therefore that EM1 is likely dominated by the MLW. We also compared EM1 with geochemical element ratios (i.e., Na/K and Rb/Sr, Fig. 9f, g) which also reflect weathering intensity in the region. The results show that high weathering intensity corresponds to low values of EM1 before 7.6 ka, which also indicates that EM1 is independent of variations in weathering and pedogenesis, and thus that it reflects the variation of the MLW.
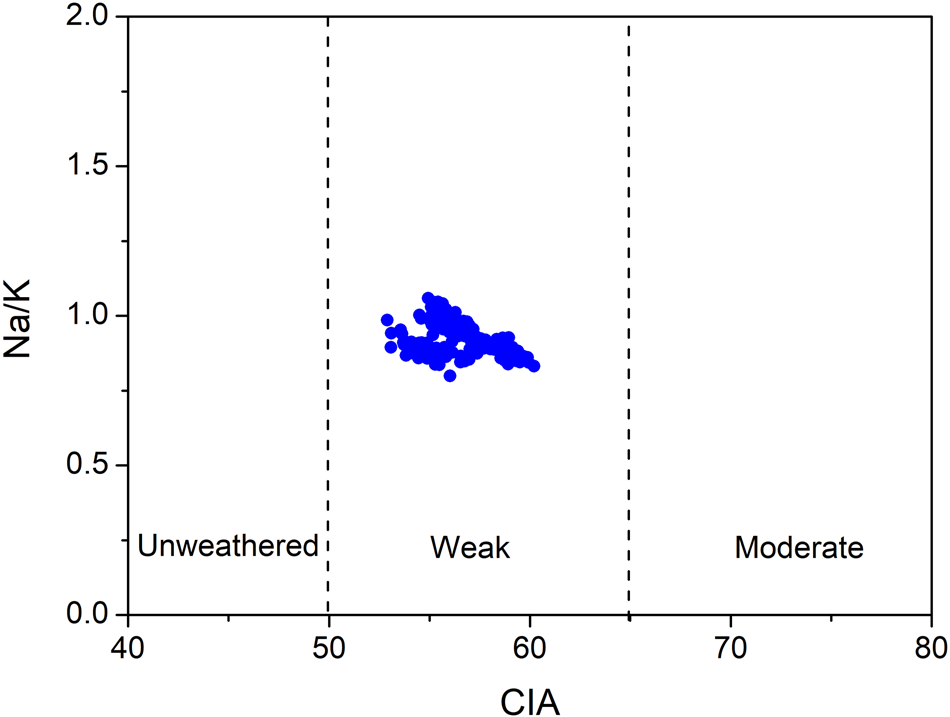
Figure 7. (color online) Scatter plot of the chemical index of weathering (CIA) versus Na/K of the aeolian sediments of the SGX section. The Na/K data are from Yang et al., Reference Yang, Xia, Gao, Wang, Li, Fan and Chen2021.
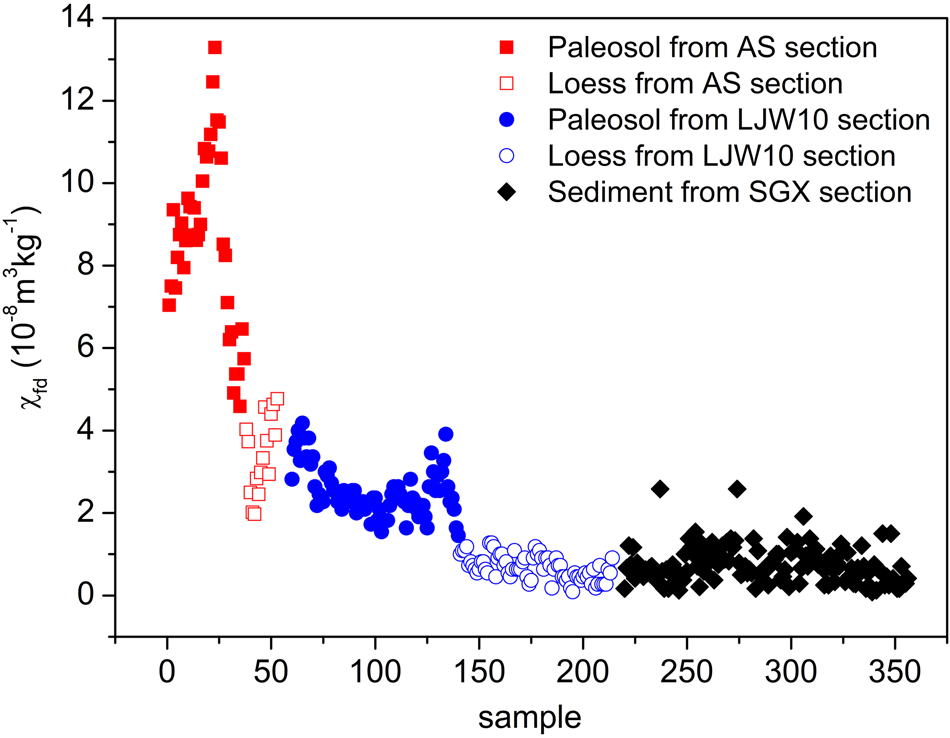
Figure 8. (color online) Comparison of the frequency-dependent magnetic susceptibility of the SGX section (this study), LJW10 section in the Tien Shan Mountains (Chen et al., Reference Chen, Jia, Chen, Li, Zhang, Xie, Xia, Huang and An2016), and AS section in the Chinese Loess Plateau (Gao et al., Reference Gao, Jia, Xia, Lu, Lu, Wang, Liu, Ma and Li2019).
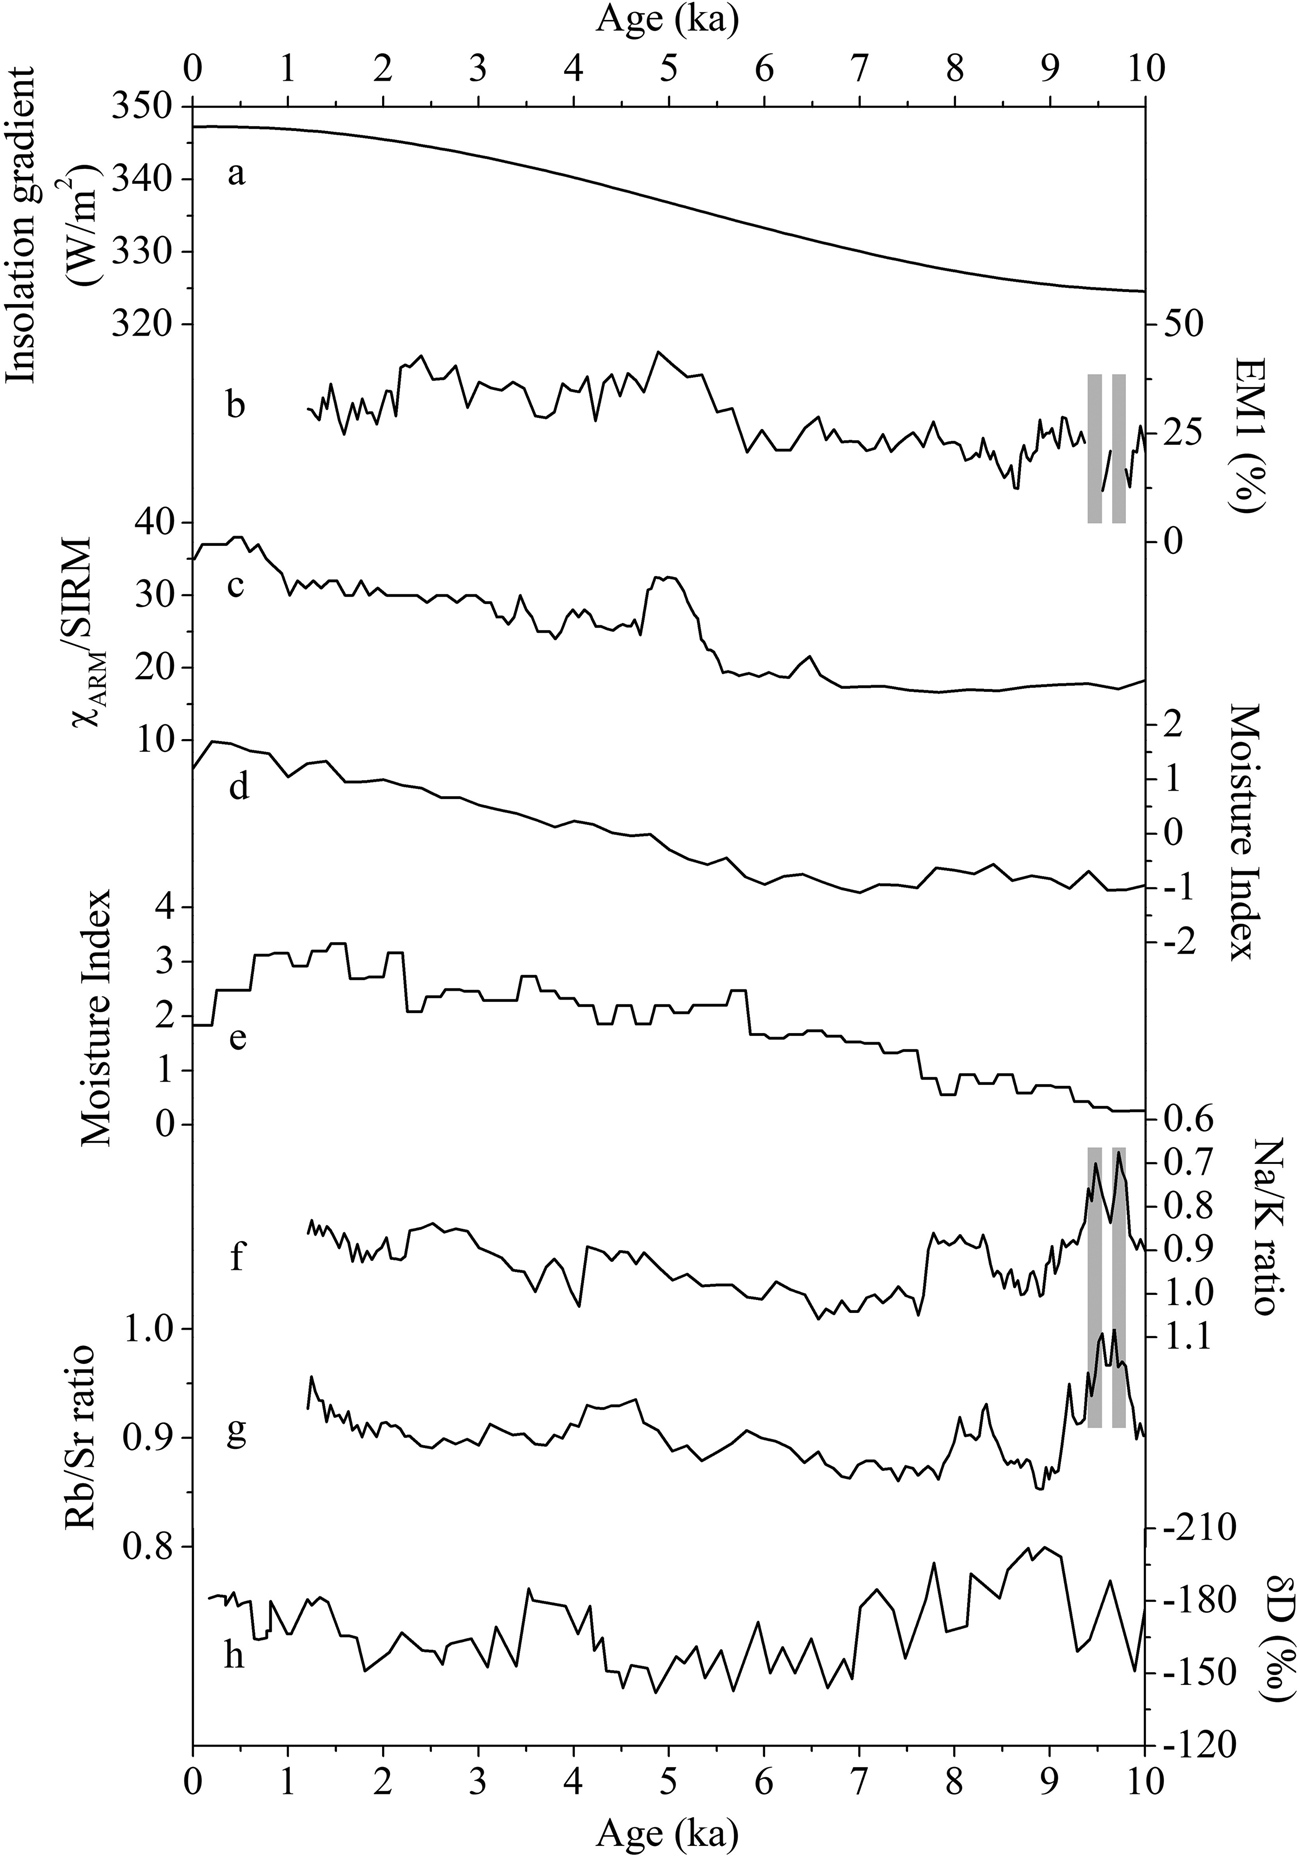
Figure 9. (a) Insolation gradient between low and high latitudes (low latitude insolation = average of the insolation at 0°N, 5°N, 10°N, 15°N, and 20°N; high latitude insolation = average of the insolation at 60°N, 65°N, and 70°N). (b) Variations in the winter mid-latitude Westerlies during the Holocene indicated by EM1 (this study). (c) Trend of moisture evolution during the Holocene recorded by the χARM/SIRM record of the LJW10 loess-paleosol section (Chen et al., Reference Chen, Jia, Chen, Li, Zhang, Xie, Xia, Huang and An2016). (d) Synthesis of records of moisture changes in the arid Central Asia (Gao et al., Reference Gao, Jia, Xia, Lu, Lu, Wang, Liu, Ma and Li2019). (e) Synthesis of records of moisture conditions in the Xinjiang region, China (Wang et al., Reference Wang, Feng, Ran and Zhang2013). (f, g) Changes in moisture conditions indicated by the Na/K and Rb/Sr records from the SGX section in the southern Tibetan Plateau (Yang et al., Reference Yang, Xia, Gao, Wang, Li, Fan and Chen2021). (h) Changes in moisture conditions indicated by the δD record from Linggo Co in the central Tibetan Plateau (Hou et al., Reference Hou, D'Andrea, Wang, He and Liang2017). The grey bars represent two gravel layers in the SGX section.
The patterns of wind circulation show that in summer, the MLW at different altitudes have little influence on the study area, which is dominated by the Indian summer monsoon, especially at the 500 hPa and 600 hPa levels (Fig. 6a, c, e). Previous studies have indicated that the strength of the Indian summer monsoon, linked to Northern Hemisphere summer insolation, decreased gradually from the Early Holocene to the Late Holocene (Wang et al., Reference Wang, Cheng, Edwards, He, Kong, An, Wu, Kelly, Dykoski and Li2005; Fleitmann et al., Reference Fleitmann, Burns, Mangini, Mudelsee, Kramers, Villa and Neff2007). It is likely that the Indian summer monsoon is able to reach the study area at present, and thus it may also have influenced the area during the Holocene. In winter, the study area is dominated entirely by the MLW at the 400 hPa, 500 hPa, and 600 hPa levels (Fig. 6b, d, f); moreover, the MLW are much stronger in winter than in summer. This evidence suggests that the contribution of the MLW in winter to EM1 is much greater than in summer, and thus we propose that EM1 can be used as a proxy of the winter MLW. An enhanced winter MLW would transport more fine-grained particles to the study area. Such fine-grained particles (mainly <10 μm) will be washed out of the atmosphere and deposited by precipitation (Pye, Reference Pye1987, Reference Pye1995), which would increase their proportion in aeolian deposits in the study area, resulting in an increase in EM1. Therefore, an increase in EM1 can be interpreted as an increase in winter MLW intensity.
EM2 (modal grain size 66.4 μm) is generally within the coarse-grained silt or fine-grained sand range, which is always derived from nearby, sandy sources, such as a river terrace, outcropping sandy substratum, dry interfluves, or even pre-existing sand dunes (Enzel et al., Reference Enzel, Amit, Crouvi and Porat2010). The source area of this component is local and the transport distance is short, in the range of hundreds of meters or a few kilometers (Vandenberghe, Reference Vandenberghe2013). EM3 and EM2 have a clear inverse relationship (Fig. 5), which implies that they are controlled by the same dynamic mechanism. EM4 is the coarsest sediment component, with the modal grain size reaching 243 μm; it is likely that in the southern Tibetan Plateau this component is transported by dust storms.
Change in the intensity of the winter mid-latitude Westerlies during the Holocene and its possible driving mechanism
In the SGX section, low values of EM1 occurred before ca. 6 ka, after which the percentages increased rapidly. This suggests that weak winter MLW occurred during the Early to Middle Holocene, and stronger winter MLW occurred during the Middle to Late Holocene (Fig. 5). We compared our results with those from loess sections in the Tien Shan Mountains, eastern Central Asia, which are dominated by the MLW at the 400 hPa, 500 hPa, and 600 hPa levels, in winter and summer. The results of grain-size analysis of loess deposits in the northern Tien Shan Mountains indicate weak MLW before 6 ka, but stronger MLW thereafter (Jia et al., Reference Jia, Liu, Gao and Xia2018). The results of grain-size analysis of Holocene loess deposits from the Yili valley in eastern Central Asia also suggest that the MLW were weak before 6 ka and stronger thereafter (Wang et al., Reference Wang, Jia, Zhao, Liu, Duan, Xie, Zhang and Chen2019). The results from eastern Central Asia are therefore very consistent with our results from the southern Tibetan Plateau, which is dominated by the MLW in winter. This consistency has two implications: first, our reconstruction is reliable; and second, the winter MLW made a large contribution to the overall changes in the MLW during the Holocene.
Based on the daily air-surface temperature data from 468 meteorological stations in mainland China for 1960–2013, the variations of the MLW during warm and cold periods in winter were analyzed (Liang et al., Reference Liang, Ding, Zhao and Sun2014). These results from meteorological data indicated that weak MLW occurred during cold periods and stronger MLW occurred during warm periods. This suggests that the variation of the winter MLW is closely linked to temperature, which in turn is closely related to variations in winter insolation in the Northern Hemisphere (Jin et al., Reference Jin, Schneider, Park, Latif, Khon and Zhang2014). Chen et al. (Reference Chen, Jia, Chen, Li, Zhang, Xie, Xia, Huang and An2016) suggested that the winter insolation at mid-latitudes in the Northern Hemisphere increased more rapidly than that at high latitudes from the early to the late Holocene, resulting in an increased insolation gradient. The insolation gradient between middle and high latitudes can be considered as a temperature gradient, and thus it represents the strength of the MLW (Jin et al., Reference Jin, Schneider, Park, Latif, Khon and Zhang2014). Therefore, relatively low winter insolation during the Early to Middle Holocene could have resulted in a smaller radiation gradient between middle and high latitudes. A smaller radiation gradient would in turn have led to a decreased temperature gradient, which would have further weakened the winter MLW (Jin et al., Reference Jin, Schneider, Park, Latif, Khon and Zhang2014; Chen et al., Reference Chen, Jia, Chen, Li, Zhang, Xie, Xia, Huang and An2016). From the Middle to Late Holocene, the relatively high winter insolation resulted in a larger radiation gradient between middle and high latitudes, which increased the temperature gradient and hence the intensity of the winter MLW.
The intensity of the winter MLW is also closely linked to the strength of the subtropical high, which is dominated by the pressure gradient force between low and high latitudes. The insolation gradient could be considered as a temperature gradient (Jin et al., Reference Jin, Schneider, Park, Latif, Khon and Zhang2014), and thus as a pressure gradient. Figure 9a shows that the winter insolation gradient between low and high latitudes increased gradually from the Middle to the Late Holocene; therefore, the temperature and pressure gradients between low and high latitudes and the strength of the subtropical high both increased from the Middle to the Late Holocene, causing the winter MLW to gradually intensify. Although we suggest that the variation in Northern Hemisphere winter insolation is the main factor controlling the winter MLW, the influence of Northern Hemisphere ice sheets and atmospheric CO2 concentration on past variations of the winter MLW cannot be completely excluded, which may also be the reason why the winter MLW (EM1) and the insolation gradient between low and high latitudes are not completely consistent. Therefore, the mechanism responsible for the variation in the winter MLW needs to be further studied in the future.
Influence of the winter mid-latitude Westerlies on regional climate change
Modern observations reveal that the MLW are the major source of precipitation in arid Central Asia (Karger et al., Reference Karger, Conrad, Bohner, Kawohl, Kreft, Soriaauza, Zimmermann, Linder and Kessler2017), and they also influence precipitation in the southern Tibetan Plateau (Tian et al., Reference Tian, Yao, White, Yu and Wang2005). The MLW transport water vapor from the water bodies upwind, such as the Mediterranean Sea, Caspian Sea and Black Sea, to regions downwind. Weaker winter MLW occurred during the Early to Middle Holocene (before ca. 6 ka), and stronger winter MLW occurred during the Middle to Late Holocene; therefore, the winter MLW transported more water vapor to the regions downwind during the Middle to Late Holocene compared to the Early to Middle Holocene. Thus, the precipitation in the downwind region during the Middle to Late Holocene was greater than that during the Early to Middle Holocene. Records from loess-paleosol sequences and lake sediments indicate a dry Early to Middle Holocene and a wet Middle to Late Holocene in arid Central Asia (e.g., Wang et al., Reference Wang, Feng, Ran and Zhang2013; Chen et al., Reference Chen, Jia, Chen, Li, Zhang, Xie, Xia, Huang and An2016; Gao et al., Reference Gao, Jia, Xia, Lu, Lu, Wang, Liu, Ma and Li2019; Fig. 9c–e). This finding is largely consistent with the variation of the winter MLW during the Holocene.
In the southern Tibetan Plateau, due to the influence of the winter MLW, the pattern of moisture variations during the Holocene is not completely consistent with the evolution of Indian summer monsoon. During the Early Holocene, moisture conditions were mainly influenced by the stronger Indian summer monsoon and the influence of the weaker winter MLW on moisture supply was negligible. The strong Indian summer monsoon resulted in humid conditions during the Early Holocene. Probably due to the weakening of the Indian summer monsoon and the weaker winter MLW, dry conditions occurred in the study area during the Middle Holocene. From the Middle to the Late Holocene, the water vapor carried by the enhanced MLW compensated for the decreased water vapor supply from the weakened Indian summer monsoon, resulting in an increase in moisture during the Late Holocene (Hou et al., Reference Hou, D'Andrea, Wang, He and Liang2017; Chen et al., Reference Chen, Chen, Huang, Chen, Huang, Jin and Jia2019; Yang et al., Reference Yang, Xia, Gao, Wang, Li, Fan and Chen2021).
CONCLUSIONS
Modern observations of wind circulation suggest that the southern Tibetan Plateau is influenced solely by the MLW in winter and mainly by the Indian summer monsoon in summer. To assess the seasonal variations of the MLW during the Holocene, we conducted detailed grain-size analyses of a well-dated Holocene aeolian sedimentary sequence from the Yarlung Zangbo River valley in the southern Tibetan Plateau. The results reveal the trend of variation of the winter MLW during the Holocene. Weak winter MLW occurred during the Early to Middle Holocene, and stronger MLW during the Middle to Late Holocene. We suggest that this pattern was closely related to the insolation/temperature/pressure gradient between low and high latitudes in the Northern Hemisphere.
Supplementary Material
The supplementary material for this article can be found at https://doi.org/doi:10.1017/qua.2021.65
Acknowledgments
We thank Dr. Jan Bloemendal for editing the English language. We are grateful to the journal's editors and two reviewers for their valuable comments and suggestions for improving the manuscript.
Financial Support
This work was supported by the Second Tibetan Plateau Scientific Expedition and Research Program (STEP) (2019QZKK0602), the Doctoral Research Fund of Lanzhou City University (LZCUBS2019-21), and the Open Foundation of MOE Key Laboratory of Western China's Environmental System, Lanzhou University, and Fundamental Research Funds for the Central Universities (lzujbky-2019-kb01).


