INTRODUCTION
The Aleutian subduction zone is oriented such that earthquake tsunamis from there pose a threat throughout the Pacific Ocean. However, the seismic history and associated tsunamis of the Aleutian Islands are relatively unstudied. The eastern Aleutian Islands are of particular interest to the United States because tsunamis from this area of the subduction zone can affect both Hawai’i and the west coast of North America. For example, the 1946 earthquake and tsunami (Fig. 1) destroyed infrastructure in Alaska, and Hawai‘i sustained 26 million (1946) dollars in damage (National Oceanographic and Atmospheric Administration [NOAA], National Geophysical Data Center [NGDC], 2017). The 1957 earthquake and tsunami (Fig. 1) caused 5 million (1957) dollars damage in Hawai‘i (Strover and Coffman, Reference Strover and Coffman1993), where two villages were destroyed; caused minor damage in San Diego Bay, California; and affected Chile, Japan, and El Salvador (NOAA, NGDC, 2017).

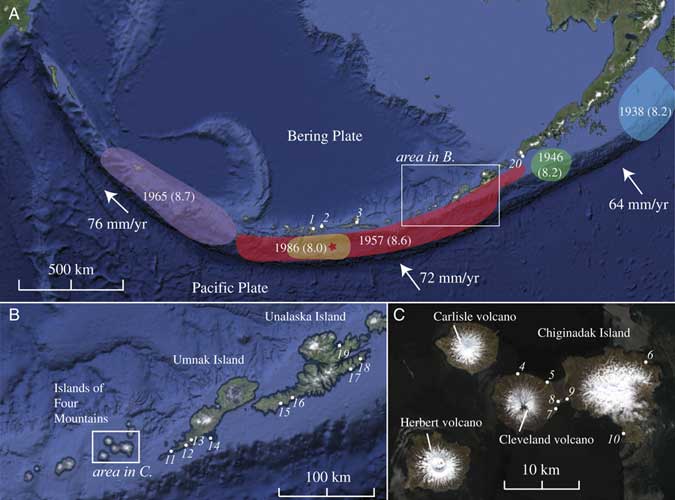
Figure 1 (A) Map of the Aleutian Island arc. Ovals denote aftershock zones of major historical Aleutian earthquakes, M w in parentheses; modified from Wesson et al. (Reference Wesson, Boyd, Mueller, Bufe, Frankel and Petersen2007). Star denotes 1957 epicenter. White dots and italic numbers refer to site locations in Table 1. Rate of convergence from DeMets et al. (Reference DeMets, Gordon and Argus2010). Image from Google Earth. (B and C) Maps and place names for the area of this study. Images from Google Earth (B) and WorldView (C). (For interpretation of the references to color in this figure legend, the reader is referred to the web version of this article.)
In addition to trans-Pacific effects, the near-field hazard of eastern Aleutian tsunamis affected local maritime Aleut peoples who occupied the region for at least 8500 yr (Black, Reference Black1974; Laughlin et al., Reference Laughlin, Laughlin and McDowell1975; Aigner, Reference Aigner1977). Assessing the degree to which tsunami inundation disrupted human and ecological systems can help reveal the ecodynamics involved in the westward human settlement of the Aleutians and the development of prehistoric human adaptations to tsunamis. These are important lessons for current inhabitants of the northern Pacific Rim.
Whether interested in the future or the past, near-field or trans-Pacific, the key variables in defining the tsunami hazard are the size and frequency of earthquakes and tsunamis in the eastern Aleutian archipelago (cf. Butler et al., Reference Butler, Frazer and Templeton2016). This study contributes new field observations of the 1957 tsunami and paleotsunamis in the Islands of Four Mountains (IFM) and Unalaska Island in the eastern section of the aftershock zone of the 1957 earthquake (Fig. 1). Field investigations included mapping inundation and run-up from wrack-line locations and geomorphic observations of the tsunami, and tracing tsunami deposits when present. Combining the new field observations with ongoing work of the U.S. Geological Survey (USGS) in the area (Witter et al., Reference Witter, Briggs, Koehler, Gelfenbaum, Engelhart, Nelson, Carver, Bender and Hemphill-Haley2014, Reference Witter, Carver, Briggs, Gelfenbaum, Koehler, La Selle, Bender, Englehart, Hemphill-Haley and Hill2016) and eyewitness accounts from 1957 (Lander, Reference Lander1996) creates a suite of 19 observations covering much of the rupture area (Table 1). By comparing these observations with simulations using GeoClaw, an open-source tsunami model (Mandli et al., Reference Mandli, Ahmadia, Berger, Calhoun, George, Hadjimichael, Ketcheson, Lemoine and LeVeque2016), we independently concur with the estimates of Witter et al. (Reference Witter, Carver, Briggs, Gelfenbaum, Koehler, La Selle, Bender, Englehart, Hemphill-Haley and Hill2016) and Nicolsky et al. (Reference Nicolsky, Freymueller, Witter, Suleimani and Koehler2016) of extensive slip in the 1957 rupture eastern extent from a higher-magnitude earthquake than the cataloged value.
Table 1. Tsunami wrack-line surveys (this study), geologic surveys, and historical accounts of the 1957 Aleutian tsunami run-up and inundation. Locations in italic are estimated positions based on descriptions. Numbers 12, 14, 15, and 17 and the unnumbered rows were not used to validate tsunami simulations.

BACKGROUND
The eastern-central Aleutian subduction zone
The volcanic arc of the Aleutian Islands is located where the Pacific plate is subducting beneath the Bering plate. In the east-central Aleutians, this occurs at a rate of ~70 mm/yr (Cross and Freymueller, Reference Cross and Freymueller2008; DeMets et al., Reference DeMets, Gordon and Argus2010; Fig. 1). Five major earthquakes in the past century, the 1938 Alaskan, 1946 Aleutian, 1957 Aleutian, 1964 Prince William Sound, and 1965 Rat Islands earthquakes have collectively ruptured nearly the entire length of the Aleutian arc (Fig. 1). In the east-central Aleutians, geodetic studies indicate that the subduction zone off Umnak Island and much of Unalaska Island is partially locked; however, the eastern end of Unalaska is currently creeping, and the west of Umnak and the IFM is unknown (Freymueller et al., Reference Freymueller, Woodard, Cohen, Cross, Elliott, Larsen, Hreinsdottir and Zweck2008).
Past events in the east-central Aleutians are known from paleotsunamis on Sedanka Island and the island of Kaua‘i, Hawai‘i. Six paleotsunami deposits in the past 1700 yr at Stardust Bay, Sedanka Island, indicate a recurrence of every 300–340 yr (Witter et al., Reference Witter, Carver, Briggs, Gelfenbaum, Koehler, La Selle, Bender, Englehart, Hemphill-Haley and Hill2016). A paleotsunami younger than 525–285 cal yr BP preserved in a sinkhole on the island of Kaua‘i is estimated to have been generated by a tsunami from a M w 9.25 earthquake from the eastern Aleutians (Butler et al., Reference Butler, Burney and Walsh2014).
The 1957 Great Aleutian earthquake parameters
The 1957 Great Aleutian earthquake occurred March 9, 1957, at 14:22:31.9 GMT (NOAA, NGDC, 2017). Solutions of the seismic moment are disputed (Oliver and Murphy, Reference Oliver and Murphy1971; Peterson and Hutt, Reference Peterson and Hutt2014; Nicolsky et al., Reference Nicolsky, Freymueller, Witter, Suleimani and Koehler2016), but magnitude estimates range from M w 8.3 (Sykes et al., Reference Sykes, Kisslinger, House, Davies and Jacob1980) to M w 9.1 (Kanamori, Reference Kanamori1977) based on the aftershock area; M w 8.6 is the currently accepted value for the NGDC. However, a M t (tsunami magnitude; Abe, Reference Abe1979) value of 9.0 is high compared with the earthquake magnitude. The epicenter was south of Atka Island, and the rupture extended ~350 km west and ~850 km east (Fig. 1), crossing from the central Aleutians into the eastern Aleutians. Herein we define the eastern part of this rupture zone as from the IFM to the east side of Unalaska Island.
A detailed slip distribution of the 1957 rupture is difficult to constrain because sparse records are available. Johnson et al. (Reference Johnson, Tanioka, Ruff, Satake, Kanamori and Sykes1994) calculated parameters of a source model from far-field tsunami tide-gauge observations and seismic-wave studies and concluded that the majority of the slip occurred in the western part of the aftershock zone with virtually no slip occurring in the eastern half. Recent work combining tsunami observations with modeling of Johnson et al.’s (Reference Johnson, Tanioka, Ruff, Satake, Kanamori and Sykes1994) source model to Stardust Bay and Dutch Harbor conclude that this solution is missing large seafloor displacement (estimated as slip at least 10 m at depths shallower than 30 km) offshore of Unalaska and Sedanka Islands (Nicolsky et al., Reference Nicolsky, Freymueller, Witter, Suleimani and Koehler2016; Witter et al., Reference Witter, Carver, Briggs, Gelfenbaum, Koehler, La Selle, Bender, Englehart, Hemphill-Haley and Hill2016).
Observations of the 1957 tsunami
The 1957 tsunami was registered at more than 150 tide gauges and has 326 run-up observations throughout the Pacific Ocean (NOAA, NGDC, 2017). Sites relevant to this study are summarized in Table 1. At the western end of the 1957 rupture area, reports from the protected sites of Sweeper’s Cove on Adak Island suggest a rise in water of 3.8 m. In Sand Bay on Great Sitkin Island, all structures below ~4 m were destroyed, and one report of an ~8 m wave exists (Lander, Reference Lander1996). In Nazan Bay, the main harbor on Atka Island, pilings were washed up to a height of 9 m (Lander, Reference Lander1996).
Eyewitness accounts in the eastern 1957 rupture area include Trapper’s Cove on Vsevidof Island (an island off the southwest coast of Umnak Island) where four sheep camps were washed away (Lander, Reference Lander1996) from a wave with reportedly 13.7 m run-up (NOAA, NGDC, 2017). Black (Reference Black1974, Reference Black1975) reports that many low-lying sites on Umnak Island, including Cape Sagak, Ogalodagh, and Driftwood, were all “overrun” by the tsunami; the tsunami completely overtopped the western tip of Umnak Island, which sits at ~10 m elevation. Lander (Reference Lander1996) reports that along the Pacific coast of Umnak, driftwood was washed about 400 m inland and generally to ~12–14 m elevation, but as high as 23 m; no specific locations are given. At the western end of Unimak Island, east of the rupture area, Scotch Cap lighthouse personnel reported the tsunami at 12 m. Finally, a tide gauge measurement of the tsunami from protected east-facing Dutch Harbor on Unalaska Island recorded 0.69 m with a positive first wave arrival (Salsman, Reference Salsman1959; Nicolsky et al., Reference Nicolsky, Freymueller, Witter, Suleimani and Koehler2016; NOAA, NGDC, 2017).
Field research on the 1957 tsunami at Umnak and Sedanka Islands used 137Cs dating methods to identify wrack lines and tsunami deposits as occurring from the 1957 tsunami. The results indicate 23 m run-up in Driftwood Bay, Umnak Island (Witter et al., Reference Witter, Briggs, Koehler, Gelfenbaum, Engelhart, Nelson, Carver, Bender and Hemphill-Haley2014), and 18.5 m run-up in Stardust Bay, Sedanka Island (Witter et al., Reference Witter, Carver, Briggs, Gelfenbaum, Koehler, La Selle, Bender, Englehart, Hemphill-Haley and Hill2016).
Far-field observations of the 1957 tsunami include tsunami deposits, eyewitness accounts, and post-tsunami survey data from throughout the Pacific (NOAA, NGDC, 2017). The tsunami inundated throughout the Hawai‘ian Islands, including in particular for this study, Anahola, Kaua‘i, on the northeastern side of the island (4.9 m) and Hanalei on the north shore of Kaua‘i (5.8 m) (Griswold et al., Reference Griswold, La Selle, Richmond, Jaffe, Gelfenbaum, Chague-Goff, LeVeque, Bellanova, Sugawara and Nelson2016; La Selle et al., Reference La Selle, Richmond, Arcos, Jaffe, Lunghino, Kane, Bishop and Habel2016; NOAA, NGDC, 2017).
TSUNAMI WRACK LINES AND DEPOSITS
Field methods
Field observations in the IFM were collected in 2014 by MacInnes and Griswold during the interdisciplinary project “Prehistoric Resilience in the Islands of Four Mountains” and observations on Unalaska by Higman in 2015. Site selection in the IFM included using satellite images to locate low-lying coastal areas, aerial reconnaissance via helicopter, and word-of-mouth reports of possible wrack lines. Sites on Unalaska were encountered along the walking and paddling route of Higman from Nikolski to Dutch Harbor.
Geologically, tsunami inundation is identified through two primary depositional features on land: a wrack line and a sediment deposit. Wrack lines are continuous lines of floatable driftwood and debris that record the farthest inland distance water traveled during the tsunami. Inundation is the maximum horizontal distance from the ocean that was flooded by a tsunami, and run-up is the elevation above mean sea level of the inundation point (International Tsunami Survey Team [ITST], 2014).
Most tsunami surveys involving wrack lines are conducted soon after the event; this study is unusual because the wrack line was 57 yr old at the time of measurement. In most places in the world, a wrack line is ephemeral because of human land-use practices, soil forming processes, or decomposition. However, the Aleutian Islands provide a location where tsunami survey methodology (ITST, 2014) can be applied to much older events because driftwood decomposition and burial rates are suppressed by climate and ecology. As such, the main difference between the tsunami survey methodology used here and that of modern tsunami surveys is the lack of eyewitness interviews. Because there are no trees in the Aleutians, every log found in a wrack line was originally driftwood.
Distinguishing tsunami from storm wrack lines and estimating the timing of deposition entailed using the following criteria. Based on these criteria, we determined that some locations did not definitively contain a 1957 wrack line.
1. Vegetation cover and decomposition: The vegetation covering and decomposition rate of logs can vary from site to site related to local climatic and biotic conditions. However, regardless of location, all logs within the same site deposited at the same time should indicate similar degrees of decomposition.
2. Inland position: Wrack lines should run roughly parallel to the current beach and storm ridge. The lateral distance between the wrack lines and the shoreline provides additional supporting evidence. Storm waves have short inland penetration (cf. Morton et al., Reference Morton, Gelfenbaum and Jaffe2007); thus storm wrack lines are closer to the modern shore position. If logs lie significantly beyond the modern beach, log deposition is more likely from tsunamis.
3. Date of manufacture: Wrack lines associated with the 1957 tsunami should contain only material manufactured before 1957, such as buoys, metal, and glass, with the possible exceptions of surficial debris light enough to become airborne in strong winds, such as Styrofoam and pieces of light plastic. The same amount of vegetation would not cover these lighter items as the driftwood logs and debris associated with the tsunami.
To calculate elevation and inland position of wrack lines at the IFM sites, we measured topographic transects with a transit level and rod from sea level to the wrack line at each site and traced the wrack line perpendicular to the transect. Wrack-line elevation measurements are not necessarily identical along the trace of the wrack line because of variations in topography, wave intensities, and geomorphology of the coastline. We reported the highest point of the wrack line as the official run-up for each location in Table 1.
Each transect experienced variable degrees of error based on visibility and weather conditions; cumulative error during fair weather conditions averaged 0.63 mm in elevation and 125 mm horizontal distance, and during poor weather conditions (transects Southeast Cleveland, Isthmus, Concord Point, South Cove, and West Applegate) averaged 4.2 mm in elevation and 840 mm horizontal distance. Elevations were corrected for tides using verified water-level data from the nearby Nikolski tide gauge; corrections ranged from −0.3 to −0.47 m (NOAA, 2017). No correction was made for the tide at the time of the tsunami.
The two new Unalaska wrack-line positions (Table 1), at Huddle Rock Bay and east of Riding Cove, were noted with a hand-held GPS, then later analyzed to determine elevation and distance inland using Google Earth, USGS topographic maps, and ArcticDEMs, which were created from DigitalGlobe Inc. imagery and funded under National Science Foundation awards 1043681, 1559691, and 1542736. The error associated with these two sites is based on the position error of the GPS location of the logs overlaid on the digital elevation model (DEM). In addition to the new Unalaska wrack-line sites, the near-surficial tsunami deposit was documented at an unnamed bay (site 17 in Table 1).
In the IFM, the coastal plain at South Cove preserves buried sand sheets indicative of paleotsunamis. We measured two topographic profiles and described the stratigraphy of 11 excavations. Tsunami deposits were identified as clean black/gray sand of similarly mixed mineral composition as beach sand sediment. Lahars were identified as poorly sorted silty gravel to boulders, many of which were angular (Supplementary Fig. 1). We also sampled soil for radiocarbon and sand for optically stimulated luminescence dating, but none of these samples were able to ultimately provide viable dates.
Field results: run-up and inundation
Soil development and log burial in wrack lines varied site to site, ranging from no burial to partial burial to complete burial by assorted meadow grasses and lichen, crowberries (Empetrum nigrum), and peat moss (Sphagnum sp.) (Fig. 2). Sections of exposed driftwood were often waterlogged and falling apart. In contrast, newer logs from recent large storms were still solid, and it was difficult to manually break them apart (Fig. 2). No debris found in the wrack lines indicated post-1957 manufacture, except a few empty plastic bottles lying on the surface. Old orange and metal buoys could be found in most wrack lines (Fig. 2), whereas other, more modern types of buoys were not. Concord Point in particular had several old orange buoys that were covered or buried comparable to the driftwood logs in the wrack line and had been chewed extensively by foxes (Vulpes vulpes). Although we were unable to determine the exact date of when these orange buoys were first used, discussions with members of the Puget Sound Maritime Historical Society indicate they were in use during 1950s.
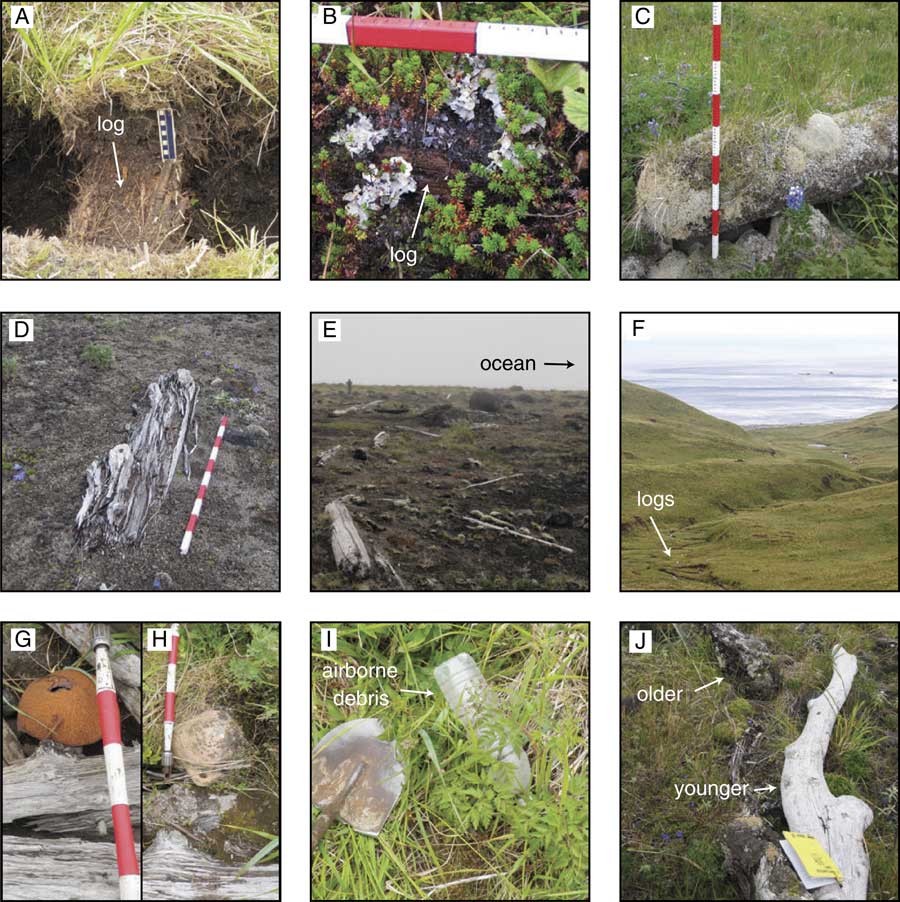
Figure 2 (color online) Example pictures. (A) Complete burial in meadow vegetation of a wrack-line log (log dug out); scale is 10 cm, with 1 cm increments. (B) Partial burial in tundra; scale’s upper tick marks are in centimeters. (C) Partial burial in meadow vegetation and lichen; measuring stick is painted in 10 cm increments. (D) No vegetation cover; logs are decomposing. (E) Wrack line (at Southeast Cleveland), person for scale. (F) Wrack line at east of Riding Cove. (G and H) Metal and orange buoys, respectively; scale interval is 10 cm. (I) Example of airborne debris with shovel head for scale. (J) Juxtaposition of younger and older logs together, indicative of a storm wrack line; field book is 17.5×11.5 cm.
Wrack-line measurements show tsunami run-up was higher on the Pacific side sites than on the Bering side (Table 1, Fig. 1), as expected for a subduction-zone earthquake. Highest observed run-up was east of Riding Cove (32±2 m), followed by Driftwood Bay (23 m) (Witter et al., Reference Witter, Briggs, Koehler, Gelfenbaum, Engelhart, Nelson, Carver, Bender and Hemphill-Haley2014), Stardust Bay (18.5 m) (Witter et al., Reference Witter, Carver, Briggs, Gelfenbaum, Koehler, La Selle, Bender, Englehart, Hemphill-Haley and Hill2016), and Concord Point (18 m). South Cove lacked a wrack line, but scattered logs and tsunami deposit studies indicated the wave reached at least 13 m high at the cliff at the distal end of the cove. Run-up on the Bering side of the IFM ranged from 7 to 9 m with a maximum at North Cleveland (Table 1). Although limited by the number of sites in this study, Pacific-side run-up appears to be higher overall in Umnak, Unalaska, and Sedanka Islands than in the IFM (Table 1).
At two sites, Concord Point and West Applegate Cove, the wrack line traced out a continuous arc centered around slight embayments in the coastline, with the highest elevation at the apex of the curve. Concord Point is a steep bedrock slope, and West Applegate Cove a steep erosional scarp. Our interpretation is that the shape of the coast combined with the steep slope caused focusing and created a locally enhanced “splash” of the tsunami at these sites.
Field results: tsunami deposits
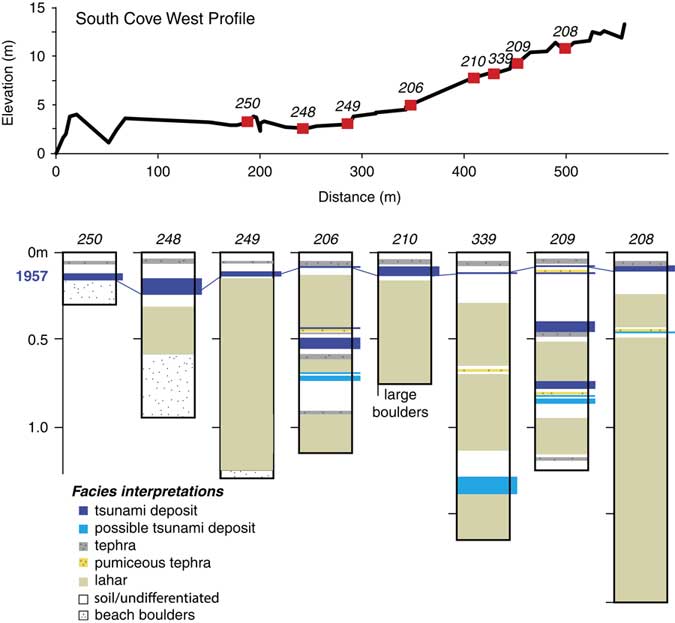
A clean sand deposit with an erosional base ~10 cm below the surface extended continuously to the back of the coastal plain in South Cove (Fig. 3). Sediment composition mirrored the sandy beach of the nearby isthmus; the modern proximal beach was composed of cobbles and boulders, and a grab sample of offshore sediment was finer grained, with a higher concentration of heavy minerals. We interpreted the upper deposit as being from 1957 based on its stratigraphic location below a tephra field—identified as being from the 2001 Cleveland eruption. The deposit does not exhibit the inland thinning often associated with tsunami deposits, but rather thickens at the landward extreme (Fig. 3), potentially because of reflection off the cliff at the distal end of the coastal plain (Higman, Reference Higman2007).

Figure 3 (color online) Topographic profile and excavations of the western transect in South Cove on Chuginadak Island. The upper tsunami deposit is interpreted as from the 1957 Aleutian tsunami. Correlation of paleotsunami deposits is challenging because of the interfingering of lahar deposits sourced from the volcano above. See Figure 4 for transect and excavation locations.
Similar clean sand deposits were found intercalated with soils, lahars, and other sands in excavations in the back northwest corner of South Cove. Although these deposits are difficult to correlate, at most five such deposits are visible in excavation 209, three interpreted as paleotsunamis with confidence, and one to four were present in other excavations (Fig. 3). These sand layers are interpreted to be paleotsunami deposits based on lack of soil development and their composition and grain-size similarities with the 1957 deposit and beach samples. Additionally, similar deposits were not present in upland sites overlooking South Cove at elevations higher than tsunamis typically inundate.
At a nameless bay along eastern Unalaska Island, a likely tsunami deposit and possible tsunami scour features suggest the 1957 tsunami was large in this area as well. Near 53°41.22'N, 166°20.76'W, sediment ranging from sand to 2 m diameter boulders was scattered hundreds of meters across a beach plain and small hill into a lake (Supplementary Figs. 2 and 3). The deposit is interpreted as the 1957 tsunami deposit because it is very recent (lightly vegetated), does not exhibit geomorphic forms typical of normal beach processes, and no other process would comingle angular cobbles and boulders derived from the hill with rounded cobbles and boulders from the beach (Supplementary Fig. 2). Though this deposit only vaguely constrains the size of the tsunami here, the large boulders in it suggest a strong flow at least several meters deep over the beach berm, and the angular fragments of bedrock from the hill show the wave exceeded beach plain elevations with a flow strong enough to entrain these clasts. Finally, the deposit was quite thick—the base was not reached after 25 cm of trenching in two locations. Sandy subduction-zone tsunami deposits are usually thinner than 25 cm, and thicker deposits are typically associated with >5 m flow depths (Goto et al., Reference Goto, Hashimoto, Sugawara, Yanagisawa and Abe2014). Given the beach berm height of about 5 m above mean sea level, this implies run-up over 10 m. Though this deposit occurs only at this bay, it is associated with tsunami-caused shore-parallel scour features (Supplementary Figs. 1B and 4) that are also seen elsewhere on Unalaska at 53°41.326'N, 166°22.62'W and 53°41.304'N, 166°22.71'W and can be seen on satellite imagery available through Google Earth farther west near 53°37.2'N, 166° 33.6'W (Supplementary Fig. 4).
Field results: coastal natural hazards
The geomorphology and stratigraphy of South Cove revealed a geologic history of a coastal plain controlled by local natural hazards. Lahars immediately west of South Cove and numerous lahars within the stratigraphy of South Cove (Figs. 3 and 4) give evidence of sudden impulses of sediment to the system. Young beach ridges, angled at 45° to the present beach and sandwiched between the modern beach ridge and an older beach ridge (Fig. 4) are indicative of rapid formation. Recent large eruptions from Cleveland, such as the 2001 and 1944 eruptions (Global Volcanism Program, Smithsonian Institution, 2013), are likely the source of new sediment to the coastal zone. Rapid shoreline changes attributable to sudden increased sediment loads are common on island coastlines from volcanic eruptions (Major et al., Reference Major, Pierson, Dinehart and Costa2000; Scott et al., Reference Scott, Nye, Waythomas and Neal2010; Ramalho et al., Reference Ramalho, Quartau, Trenhaile, Mitchell, Woodroffe and Ávila2013).

Figure 4 (color online) Map of South Cove geomorphology; image from Digital Globe. The change in slope at 300 m inland that corresponds to a change in stratigraphy is noted. The three images on the right show scours into the landward side of a relict beach ridge: the upper image is a satellite view (image from WorldView). The measuring stick is 1 m high.
Rapid shoreline change is further reflected in the stratigraphy within South Cove. Excavations seaward of 300 m showed thin sediment cover over beach boulders while excavations landward of 300 m contain numerous depositional events (Fig. 3). This dramatic change of stratigraphic cover isolates an abrupt juxtaposition of age, showing recent progradation. The location represents either a prolonged paleoshoreline or an erosional scarp from maximum transgression, with a relative age between the 1957 tsunami and the penultimate tsunami deposit. An important implication of this is that paleotsunami inundation distances cannot be known because the associated shoreline position is either not identifiable or not preserved.
Tsunami inundation has altered the surficial geomorphology of South Cove through erosion. Surficial scours into the landward side of relict beach ridges lay throughout the coastal plain (Fig. 4). Scours are defined by an area of missing stratigraphic cover where only bare boulders are exposed. Lichen growth on the exposed boulders was comparable to the growth on nonorganic material in 1957 wrack lines and covered greater areas than boulders associated with the modern beach ridge. The scour sides were steep on the seaward edge and shallow landward, with the deepest part on the seaward end (Fig. 4). These features are interpreted as being formed from tsunami inflow as it accelerated over the beach ridge (as in Kitamura et al., Reference Kitamura, Kodaka and Kataoka1961; MacInnes et al., Reference MacInnes, Pinegina, Bourgeois, Razhigaeva, Kaistrenko and Kravchunovskaya2009).
TSUNAMI MODELING
Modeling methods
With the combined wrack line and eyewitness accounts (Table 1) as a validation tool, we investigated characteristics of the 1957 earthquake rupture using the tsunami model GeoClaw version 5.3.0 (Clawpack Development Team, 2014). GeoClaw solves the two-dimensional, shallow-water wave equations using a finite volume method (Berger et al., Reference Berger, George, LeVeque and Mandli2011; Mandli et al., Reference Mandli, Ahmadia, Berger, Calhoun, George, Hadjimichael, Ketcheson, Lemoine and LeVeque2016) to propagate tsunamis from seafloor deformation. GeoClaw is an open-source software package that is approved by the United States National Tsunami Program for the modeling of tsunamis (LeVeque et al., Reference LeVeque, George and Berger2011). Inundation is fully integrated into the code. The depth-averaged nonlinear equations in GeoClaw show good agreement to validation studies, although as with any shallow-water wave tsunami model, the code only approximates the dynamics of wave breaking and overland flow (LeVeque et al., Reference LeVeque, George and Berger2011).
Required inputs for GeoClaw simulations are bathymetric and topographic data sets and earthquake parameters to create seafloor deformation. Instantaneous seafloor deformation is calculated from slip on a fault, or multiple faults, using the Okada (Reference Okada1985) equations. Available bathymetric data sets are low resolution in the Aleutians field area: the Small Southern Alaska (SAK) bathymetry (Lim et al., Reference Lim, Eakins and Wigley2011) is 24 arc-seconds, and the ETOPO1 Global Relief Model (Amante and Eakins, Reference Amante and Eakins2009) is 30 arc-seconds. We subdivided these grids in GeoClaw into 4 arc-seconds to allow for more robust representation of tsunami wave dynamics during simulation. Hawai‘i sites used high-resolution bathymetry cut from a 1/3 arc-second DEM of Kaua‘i (Friday et al., Reference Friday, Taylor, Eakins, Carignan, Love and Grothe2012) and ETOPO1 to cross the Pacific.
We created source models by varying slip on a subfault grid that divided the subduction zone into 24×2 subfaults in the western half and 24×4 subfaults in the eastern half of the rupture (Fig. 5; Supplementary Table 1). The locations of each subfault are originally based on those used by Johnson et al. (Reference Johnson, Tanioka, Ruff, Satake, Kanamori and Sykes1994), with one additional row of subfaults at the eastern end. The geometry for the strike and dip of the subduction-zone interface is from Slab1 (Hayes et al., Reference Hayes, Wald and Johnson2012). We held the rake constant at 90° because the eastern Aleutians have nearly arc-normal subduction (Johnson et al., Reference Johnson, Tanioka, Ruff, Satake, Kanamori and Sykes1994). Of note, there is overlap in subfaults 14C and 14D with 15C and 15D immediately west of the IFM (Fig. 5) because of a change in strike. However, the problem of a local doubling of slip in that location because of the overlap was not an issue because no source models had slip in row 14.
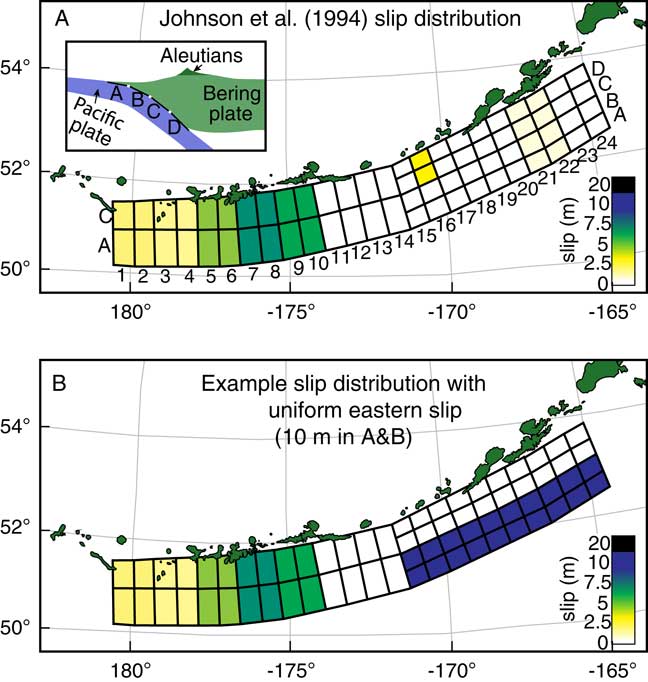
Figure 5 (color online) (A) Subfault geometry used in this study, populated with the values for the slip distribution by Johnson et al. (Reference Johnson, Tanioka, Ruff, Satake, Kanamori and Sykes1994). Inset shows a cross section through the subduction zone, with progressively deeper subfaults labeled A–D. (B) Example of a hypothetical slip distribution used in this study. Only subfaults 15–24, A–D were manipulated in hypothetical cases.
Forward-modeling techniques inherently result in a suite of possible solutions; thus our aim in comparing simulation results to field observations is to refine general characteristics of the 1957 rupture. To evaluate models, we used four methods: the difference between simulation and observation in meters, the percent difference at each site, the root-mean-square (RMS) of the percent differences, and a count of the number of sites with a percent difference between −25% and +25%. We calculated the percent difference by subtracting the observed run-up from simulated at each site and dividing by observed. We subdivided percent differences at intervals of±25%, ±25% to ±50%, and more than ±50%. These calculations directly determine if simulated run-up was too high or too low, which can be used to compare spatial patterns. When evaluating sites, we focused more on sites with post-tsunami survey observations rather than eyewitness accounts because post-tsunami surveys provide more reliable observations. In general, we also ignored sites where all models were routinely underestimated, possible reasons for which we discuss below.
Modeling results: Johnson et al. (Reference Johnson, Tanioka, Ruff, Satake, Kanamori and Sykes1994) source model
Simulations of the source model from Johnson et al.’s (Reference Johnson, Tanioka, Ruff, Satake, Kanamori and Sykes1994) solution did not produce run-up close to the observed values at any site (Fig. 6; Supplementary Table 2). At the three eyewitness locations in the western part of the rupture zone (sites 1–3), simulated run-up was all less than 2 m, with simulated run-up at the Nazan Bay site 93% too small. Highest simulated run-up values in the eastern part of the rupture were 1.3 m at the Isthmus site in the IFM and 1.6 m east of Riding Cove, with percent differences ranging from 88% to 100% too small for each (Fig. 6). No run-up was produced at Scotch Cap, where observers documented water reaching 12 m high. These results are similar to those obtained by Witter et al. (Reference Witter, Carver, Briggs, Gelfenbaum, Koehler, La Selle, Bender, Englehart, Hemphill-Haley and Hill2016) who modeled a tsunami from Johnson et al.’s (Reference Johnson, Tanioka, Ruff, Satake, Kanamori and Sykes1994) source as not overtopping the beach berm in Stardust Bay where observed run-up was 18.5 m. Our results at Stardust showed a wave only 0.5 m high.
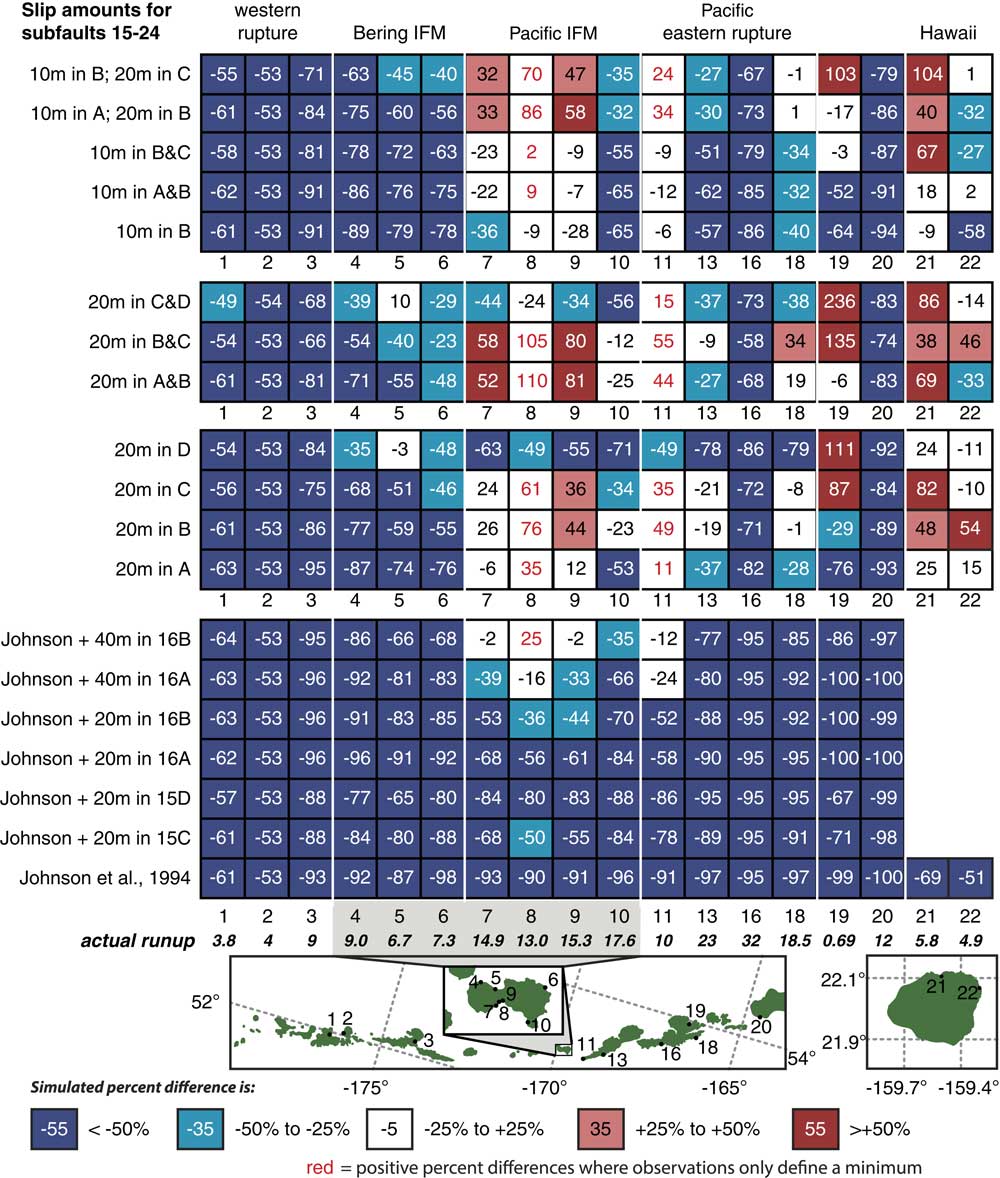
Figure 6 Tsunami simulation comparison to observations organized by source model. Numbers in colored boxes indicate the calculated percent difference between observation and simulation. Negative (blue) boxes are smaller simulated run-up than observed by ±25%, and red boxes are larger than ±25%. Subfault numbers for each source model can be found in Figure 5, and site location numbers can be found in Table 1 and Figure 1. IFM, Islands of Four Mountains. (For interpretation of the references to color in this figure legend, the reader is referred to the web version of this article.)
Because Johnson et al.’s (Reference Johnson, Tanioka, Ruff, Satake, Kanamori and Sykes1994) preferred solution included isolated 3.3 m slip on subfaults 15C and 15D near the IFM, we also modeled a few variations of that isolated slip. These variations included increasing the 3.3 m slip to 20 m on subfaults 15C or 15D, as well as 20 and 40 m on the shallow subfaults 16A or 16B, directly offshore of the IFM (M w 8.67 and 8.7, respectively). All of these modifications can be considered slight modifications to Johnson et al.’s (Reference Johnson, Tanioka, Ruff, Satake, Kanamori and Sykes1994) solution, or they could represent a possible local submarine landslide associated with the earthquake. The 20 m slip simulations slightly improved results in the IFM and Umnak, while the 40 m slip simulations were within or close to within±25% (Fig. 6). However, outside of the IFM and western Umnak Island, the results remained roughly similar to the original Johnson et al. (Reference Johnson, Tanioka, Ruff, Satake, Kanamori and Sykes1994) source simulation (Fig. 6), and thus localized extreme slip near IFM fails to reproduce our observations.
Modeling results: new earthquake source models
Clearly, greater tsunami excitation than was suggested by Johnson et al. (Reference Johnson, Tanioka, Ruff, Satake, Kanamori and Sykes1994) is necessary in the eastern half of the rupture zone. Our straightforward approach to increasing tsunami run-up was to add uniform slip along the subduction zone in the eastern portion of rupture, with slip varying along dip but not along strike (Fig. 5). Standard deviation of results on the western side of the rupture remained less than 10% from the original Johnson et al. (Reference Johnson, Tanioka, Ruff, Satake, Kanamori and Sykes1994) source model. We set slip in the east at either 10 or 20 m along a swath one or two subfaults wide, resulting in source model M w range of 8.8–9.0. Slip values were chosen as typical for earthquakes of this size; Witter et al. (Reference Witter, Carver, Briggs, Gelfenbaum, Koehler, La Selle, Bender, Englehart, Hemphill-Haley and Hill2016) and Nicolsky et al. (Reference Nicolsky, Freymueller, Witter, Suleimani and Koehler2016) both use 10 m for simulating tsunamis to Stardust Bay and the Dutch Harbor tide gauge.
RMS values for sites 4–18 were lowest for models with slip in row C, and for sites 7–18 in both B and C (Table 2). However, models with the most number of sites between −25% and +25% difference of simulated to observed run-up typically had slip in row B (Table 2). Earthquakes with slip in the deeper subfaults (C and D) produced simulations with wider wavelength tsunamis and larger values of subsidence in the islands (Supplementary Fig. 4).
Table 2. Evaluation of simulated run-up percent differences from observed run-up. Smaller root-mean-square (RMS) values are more accurate models.

Pacific side of the IFM (sites 4–7): Simulated run-up was close to the ~15 m observed in the IFM for source models with 20 m slip in subfault A, but it was too high if 20 m slip was in subfaults B or C, or too small if in subfault D (Fig. 6). The only other scenario with good agreement to Pacific side sites was 10 m slip in both subfaults A and B or B and C. No model came close to matching the Concord Point site, potentially supporting the field hypothesis that the wrack line there reflected a geomorphically enhanced wave.
Bering side of the IFM (sites 8–10) and Dutch Harbor tide gauge (site 19): Very few simulations produced the 6–9 m of run-up observed on the Bering Sea side of the IFM. The best-fitting source models all had slip on the deepest subfault, subfault D (Fig. 6). To a large degree, however, these deeper ruptures fit observations better because of subsidence (up to 2 m) associated with these earthquakes (Supplementary Fig. 4). Similarly, the Dutch Harbor tide gauge recorded only a 0.69 m tsunami; thus the percent difference was sensitive to changes in earthquake-induced subsidence—models with slip in rows C or D tended to exceed observations here primarily because the site subsided during simulation.
Pacific eastern rupture (sites 11–18) and Scotch Cap (site 20): The tsunami at Cape Sagak behaved similarly to the Pacific side of the IFM, with 20 m slip producing large run-up unless it was in the shallowest subfault A, and 10 m slip giving reasonably good results. Driftwood and Stardust Bays (sites 13 and 18) were similar to each other, with good agreement from 20 m slip in subfaults B and C, but a too small simulated tsunami from 10 m slip or 20 m slip in subfaults A or D (Fig. 6). No simulation came close to the observed run-up in the bay east of Riding Cove (site 16) or Scotch Cap (site 20) potentially because of bathymetric resolution problems discussed in the following section.
Kaua‘i, Hawai‘i (sites 21–22): Far-field simulations to Anahola and Hanalei on Kaua‘i, Hawai‘i, produce a tsunami with run-up on the order of the observations. Three source models were within ±25% of observations at both sites—10 m of slip on subfaults A and B, 20 m on subfault A, and 20 m on subfault D. Mid-depth rupture, in particular on subfault C, produced too large run-up in Hanalei, as did source models with 20 m slip on multiple subfaults. Interestingly, many cases with simulated run-up too high in Hanalei had run-up less than observed in Anahola.
DISCUSSION
Bathymetric problems
All of the sites on Bering side of the IFM, Nazan Cove, east of Riding Cove, Scotch Cap, and to some degree the splash at Concord Point on the Pacific side of the IFM proved problematic; few to no models were able to reach the observed run-up at these sites. Error in tsunami modeling is most commonly associated with bathymetric inaccuracy or too low bathymetric resolution (Pan et al., Reference Pan, Wang and Cai2010; MacInnes et al., Reference MacInnes, Gusman, LeVeque and Tanioka2013). We consider the low-resolution 24 arc-second SAK bathymetry (refined to 4 arc-second resolution in our simulations) to be the primary cause of our model underestimations. Preferred resolution for modeling studies are on the order of 1 to 1/3 arc-second (Berger et al., Reference Berger, George, LeVeque and Mandli2011; Lynett et al., Reference Lynett, Weiss, Renteria, De La Torre Morales, Son, Arcos and MacInnes2012; Arcos and LeVeque, Reference Arcos and LeVeque2015). The resolution of the SAK grid translates to one grid cell being 450 m and 750 m on a side. At such low resolution, the lack of details in the grid can cause run-up values to be either higher or lower, compared with observed results (MacInnes et al., Reference MacInnes, Gusman, LeVeque and Tanioka2013). Compared with reality, low-resolution bathymetry is oversimplified, each grid cell representing an average water depth, making the lower points higher and the higher points lower. This is a problem for the Bering side of the IFM because the passes between islands in the IFM are averaged to be shallower than in reality, which blocks much of the tsunami from passing through to the Bering side sites. The Concord Point splash, which at 60 m wide was smaller than a single grid cell in the SAK bathymetry, was not able to be reproduced because either the bathymetry did not have the detail necessary for the model to form a realistic representation of the coastal geometry or at our 4 arc-second resolution refinement, approximations in GeoClaw are not able to adequately reproduce highly complex tsunami flow patterns during shoaling and inundation at this site (Pan et al., Reference Pan, Wang and Cai2010). The same can be said for the narrow valley east of Riding Cove. Finally, quantitatively evaluating the SAK and ETOPO1 bathymetries used in this study against nautical maps shows there are discrepancies, such as submarine features not present in bathymetry, simplification of offshore bathymetry, and shallower deep water passes near the IFM.
Large slip in the east
Comparison of all model results indicates that the magnitude of the 1957 Great Aleutian earthquake must have been closer to M w 8.8–9.0 than the commonly accepted value of M w 8.6. The observations of run-up between >10 m and 32±2 m on the Pacific coasts of IFM, Umnak Island, Unalaska Island, and Sedanka Island spans 225 km. We can rule out a coseismic submarine landslide as the sole cause for the high run-up observations in a M w 8.6 scenario because run-up was high throughout the eastern Aleutians. Our source models of Johnson et al. (Reference Johnson, Tanioka, Ruff, Satake, Kanamori and Sykes1994) with local 20 or 40 m slip on only one subfault represented an isolated area of tsunami excitation, such as what a landslide would generate (Okal and Synolakis, Reference Okal and Synolakis2004). The spatially restricted high tsunami from these source models agrees with what is known about tsunamis from or enhanced by submarine landslides elsewhere and hypothetically (Okal and Synolakis, Reference Okal and Synolakis2004). A submarine landslide could locally enhance a wave on the adjacent island to high run-up elevations seen at a site, but not over all sites in the entire eastern rupture zone.
Extensive eastern high slip on the order of 10 to 20 m best reproduced the observed tsunami run-up heights. On the Pacific side of IFM (sites 4–7) 10 m slip source models were more accurate than those with 20 m slip; however, source models with 20 m slip produced better results at the other eastern Pacific locations (sites 11–18), suggesting that slip was likely higher near Unalaska. The models with 20 m slip in two subfault rows can be ruled out as being too large from results in the IFM (sites 4–10) and Hawai‘i (sites 21–22). The lack of tsunami observations west of IFM precludes analysis and interpretation of slip in the western half of the rupture zone.
The depth of the slip in the eastern Aleutians is more elusive, but our results indicate that near 15 km is most likely. In the near field, source models with slip in rows B or C (15–26 km and 26–41 km depth on average) tended to be slightly better than those with slip in row A or D. However, Hawai‘i sites can rule out subfault C (and B if slip is 20 m), as producing a too-high trans-Pacific tsunami. Although slip in row D resulted in simulations with good agreement to observations on the Bering-side near-field sites, it was because these models produced 1–2 m subsidence rather than a higher amplitude tsunami; such subsidence, however, was not observed. Slip on subfaults A (when 20 m) or A and B (10 m) both produced excellent results on Hawai‘i. Therefore, in sum of all simulated sites, slip during 1957 was most likely greatest in subfault B, near the A to B transition (15 km). Nicolsky et al. (Reference Nicolsky, Freymueller, Witter, Suleimani and Koehler2016) similarly concluded that slip was less than 30 km, most likely in the 5–15 km range. Interplate coupling models based on GPS data show that the eastern 1957 rupture zone is freely slipping today close to the trench but is partially locked from 14 to 47 km depth adjacent to Umnak and Unalaska (Cross and Freymueller, Reference Cross and Freymueller2008). If this pattern was similar prior to 1957, slip in our subfault B rather than A is more likely.
Implications for the local tsunami hazard
From an improved understanding of the 1957 Great Aleutian earthquake
The 1957 earthquake is recorded in earthquake databases as M w 8.6 and M t 9.0 (NOAA, NGDC, 2017). Both field observations and modeling support the large M t , and we suggest that the earthquake’s magnitude was closer to M w 8.8–9.0, which would make it one of the largest earthquakes in the past century. If this earthquake is greater than M w 8.6, it indicates the east-central Aleutian subduction zone can produce very large earthquakes. If, however, the seismic energy released was indeed M w 8.6, then lower magnitude earthquakes, which statistically occur more frequently than higher magnitude events, are capable of producing oversized tsunamis from this subduction zone, increasing the tsunami risk (from more frequent earthquakes) for coastal communities in the Pacific.
Today’s partial coupling of the mid-depth subduction zone (Cross and Freymueller, Reference Cross and Freymueller2008) shows the region has future potential for another large slip event. Paleotsunamis from Stardust Bay (Witter et al., Reference Witter, Carver, Briggs, Gelfenbaum, Koehler, La Selle, Bender, Englehart, Hemphill-Haley and Hill2016) and the IFM confirm repeated large events as the past behavior for the region. Large slip in the east portends that the eastern half of the 1957 rupture zone released more strain accumulation than the west during rupture; thus future small postevent earthquakes, such as the 1985 M w 8.0 and 1996 M w 7.9 events in the western half (Johnson et al., Reference Johnson, Tanioka, Ruff, Satake, Kanamori and Sykes1994), can be considered less likely in the east.
From interdisciplinary work in the IFM
Aleuts living in the IFM would have experienced tsunamis. Our observations of (undated) paleotsunami deposits preserved in the IFM indicate a regular recurrence of large events. Paleotsunamis at Stardust Bay on Sedanka Island, dated to between 300–175, 660–560, 1170–1010, 1380–1280, and 1680–1510 cal yr BP (Witter et al., Reference Witter, Carver, Briggs, Gelfenbaum, Koehler, La Selle, Bender, Englehart, Hemphill-Haley and Hill2016), should be expected to have run-up in the IFM, the height of which depends on the western extension of their rupture areas. On average, this is a tsunami every 300–340 yr, with some longer and shorter intervals, during a time that the islands were occupied (Hatfield, V., Krylovich, O., Bruner, K., Okuno, M., Savinetsky, A., Vasyukov, D., West, D., unpublished manuscript). Potentially, the penultimate tsunami was a larger magnitude event than 1957, based on Butler et al.’s (Reference Butler, Burney and Walsh2014) conclusion that a M w 9.25 eastern Aleutian simulation was the most likely earthquake scenario to explain a tsunami deposit (dated as younger than 525–285 cal yr BP) in Makauawahi sinkhole on the island of Kaua‘i in Hawai‘i.
However, would the Aleut villages in the IFM have been destroyed by a tsunami? The 1957 tsunami wrack line did not reach the elevation of any archaeological site previously known or studied as part of the “Prehistoric Resilience in the Islands of Four Mountains” project. Bering-side archaeological sites were typically >30 m elevation (elevations in Hatfield, V., Krylovich, O., Bruner, K., Okuno, M., Savinetsky, A., Vasyukov, D., West, D., unpublished manuscript). Unless sourced from the north (from nonsubduction-zone events such as submarine landslides or volcanic eruptions), the Bering sites were protected from past tsunamis. On the Pacific side, the 1957 wrack-line tsunami came within 5 m of the lowest part of one site. Our simulations of up to M w 9.0 earthquakes, with high slip adjacent to the IFM, show that these tsunamis could potentially have inundated this location, although unlikely the entire extent of the site.
CONCLUSIONS
Through applying modern tsunami wrack-line survey methods and field techniques to a historical event, we measured the run-up and inundation of the 1957 Great Aleutian tsunami. In the IFM, wrack lines from the tsunami indicated a maximum run-up of 18 m on the Pacific side and 9 m on the Bering side. South Cove, the only site in the IFM with paleotsunami deposits, preserved up to five possible paleotsunamis and a record of local natural hazards. Outside the IFM, additional wrack lines exceed 18 m on Umnak, Unalaska, and Sedanka Islands—up to 32±2 m on Unalaska east of Riding Cove. Using GeoClaw, an open-sourced tsunami model, we determined that for the 1957 tsunami to produce the observed wrack lines, the earthquake released at least two or more times the energy than M w 8.6; more likely it was M w 8.8–9.0. High slip is necessary in the eastern portion of the aftershock zone, on the order of 10–20 m at or near 15 km depth. Because field observations do not exist for the entire aftershock zone, and seismic and GPS data of the Aleutians are limited, the exact magnitude and depth is a nonunique solution.
The orientation of the Aleutian subduction zone creates a tsunami threat beyond local communities to countries throughout the Pacific Ocean. As characteristics of past earthquakes and dynamics of the subduction zone become better understood, the style of rupture and recurrence probability of the eastern Aleutian trench will become clearer. Paleotsunami deposits from Sedanka Island (Witter et al., Reference Witter, Carver, Briggs, Gelfenbaum, Koehler, La Selle, Bender, Englehart, Hemphill-Haley and Hill2016) and the island of Kaua‘i (Butler et al., Reference Butler, Burney and Walsh2014), combined with new paleotsunami deposits from the IFM, suggest that run-up from Aleutian earthquakes like 1957 and 1946 must be considered in trans-Pacific tsunami hazard assessments. The modern survey, paleotsunami study, and modeling work presented here constitute an important step toward developing a comprehensive representation of the hazard and risk presented by the Aleutian subduction zone and how tsunamis have affected past communities in the Aleutian Islands and across the Pacific.
ACKNOWLEDGMENTS
This material is based on work supported by the National Science Foundation under grant no. PLR-1301929 and by Central Washington University Graduate Studies. Lydia Loopesko, Kale Bruner, Anne Fulton, Tina Neal, and the Higman-McKittrick family provided field assistance. This manuscript was improved by editor Kirsten Nicolaysen and two anonymous reviewers.
SUPPLEMENTARY MATERIALS
To view supplementary material for this article, please visit https://doi.org/10.1017/qua.2018.39