


INTRODUCTION
Archaeologists have long recognized the value of long-term data sets—those that span centennial to millennial scales—for understanding contemporary human–animal–environment interactions (Lyman, Reference Lyman1996; Lyman and Cannon, Reference Lyman and Cannon2004; Newsome et al., Reference Newsome, Etnier, Gifford-Gonzalez, Phillips, van Tuinen, Hadly, Costa, Kennett, Guilderson and Koch2007; Wolverton and Lyman, Reference Wolverton and Lyman2012; Rick and Lockwood, Reference Rick and Lockwood2013), including freshwater and marine resources management (Steneck, Reference Steneck, Wallace and Braasch1997; Etnier, Reference Etnier2002, Reference Etnier2007; Butler and Delacorte, Reference Butler, Delacorte, Lyman and Cannon2004; Campbell and Butler, Reference Campbell and Butler2010; Bovy, Reference Bovy2011; Izzo et al., Reference Izzo, Doubleday, Grammer, Gilmore, Alleway, Barnes, Disspain, Giraldo, Mazloumi and Gillanders2016). As archaeological research grows increasingly collaborative and interdisciplinary, it has been used successfully to challenge existing conservation baselines that rely on modern data, which usually represent the mid-twentieth century to the present (Grayson, Reference Grayson2005; Rick et al., Reference Rick, Reeder-Myers, Hofman, Breitburg, Lockwood, Henkes and Kellogg2016; West et al., Reference West, Hofman, Ebbert, Martin, Shirazi, Dunning and Maldonado2016; Wolverton et al., Reference Wolverton, Nagaoka and Rick2016). Seminal work by Pauly (Reference Pauly1995) and Jackson et al. (Reference Jackson, Kirby, Berger, Bjorndal, Botsford, Bourque and Bradbury2001) introduced the value of retrospective data to a broader audience and to contemporary management contexts. This work challenged the assumption that small-scale, prehistoric fisheries could not influence animal populations or local environments, and pointed out the importance of long-term environmental data for understanding modern human–animal interactions.
Relative abundance indices and fish body size are used in contemporary stock assessment in combination with environmental data and catch estimates to understand the role that human harvesting pressure and changing environmental conditions have on the health and reproductive success of fish populations (Arreguín-Sánchez, Reference Arreguín-Sánchez1996; Cadrin and Secor, Reference Cadrin, Secor, Beamish and Rothschild2009; Barbeaux et al., Reference Barbeaux, Aydin, Fissel, Holsman, Palsson, Shotwell, Yang and Zador2019). Many zooarchaeological studies of fish size provide estimated mean length data for a population, which permits examination of both geographic and temporal variability in these statistics. On the other hand, these studies also demonstrate local variability in fish dynamics that may be masked by current measurement techniques, available data sets, and the limited temporal resolution available for most archaeological assemblages. Using mean length alone likely conceals changes in the relative abundance of large and small individuals. Instead, overall size distributions may be a better and more sensitive measure of how fish populations respond to external pressures, including environmental change, trophic structure, recruitment success, and exploitation pressure. For example, size distributions may reveal whether fish today are reaching the same maximum size as they have in the past. The presence or absence of the largest fish may be used to distinguish the external pressures that influence fish populations (Hsieh et al., Reference Hsieh, Reiss, Hunter, Beddington, May and Sugihara2006). Overexploitation by fisheries, for example, can truncate the upper limits of the age–size structure of a population, resulting in declining trends in average age and/or length (e.g., Ault et al., Reference Ault, Bohnsack and Meester1998; Hsieh et al., Reference Hsieh, Reiss, Hunter, Beddington, May and Sugihara2006; Hixon et al., Reference Hixon, Johnson and Sogard2014). This measure is used in an archaeological context, as well, wherein decreases in animal body size and the loss of the largest individuals are frequently interpreted as overexploitation by past people (e.g., Broughton, Reference Broughton1997). Average age and/or length can also be influenced by recruitment of smaller individuals into the fishery. Hence, overall size distributions can help inform the interpretation of changing average size.
In this paper, we detail the late Holocene history of Pacific cod (Gadus macrocephalus, hereafter “cod,” unless otherwise indicated) fishing in the North Pacific Ocean using size data from modern management contexts and archaeological sites across the North Pacific, from the northern Kuril Islands through the Aleutian Islands to Southeast Alaska (Fig. 1). Archaeological fish size data are arrayed against modern fish size data to (1) look for geographic and temporal variability in cod size, (2) test the hypothesis that cod length distributions from ancient contexts are consistent in size with those collected from the modern fishery, and (3) test the hypothesis that for each geographic location analyzed, fishery impacts are not seen in the form of truncated length distributions (or fewer large fish harvested).
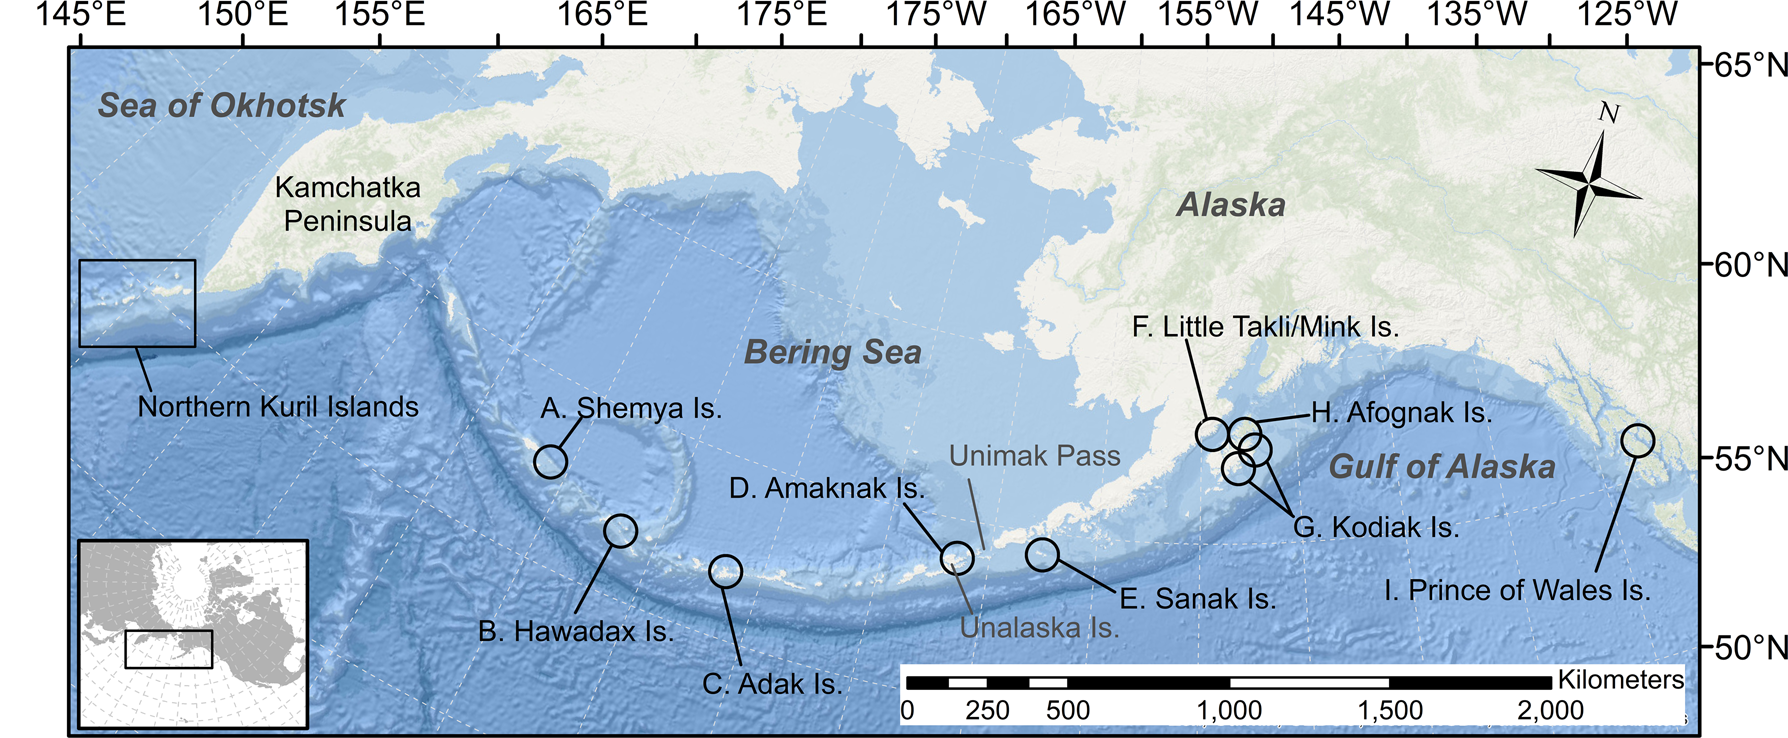
Figure 1. Map of the North Pacific Ocean showing geographic locations mentioned in the text. Circles show the 50-km-radius selection area for the modern data sets,: (A) Shemya Island; (B) Hawadax (Rat) Island; (C) Adak Island; (D) Amaknak Island; (E) Sanak Island; (F) Little Takli/Mink Islands; (G) Kodiak Island; (H) Afognak Island; and (I) Prince of Wales Island.
BACKGROUND
Body-size distributions
The distribution of fish body size within a species plays a dominant role in structuring marine ecosystems and influences trophic-level relationships, growth rates, recruitment, and productivity (Shin et al., Reference Shin, Rochet, Jennings, Field and Gislason2005). Fish size can be driven by a number of complex factors, which will be reflected in the fishery (Gulland and Rosenberg, Reference Gulland and Rosenberg1992; Hsieh et al., Reference Hsieh, Reiss, Hunter, Beddington, May and Sugihara2006). First, fish size is related to age, and biological processes will influence the range of fish sizes available to the fisheries. If recruitment is seasonal or if fish migrate, then length-frequencies should vary seasonally or annually depending on availability of fish or the timing and location of the fishery. Second, the fishery itself will influence length-frequency data: the selection method (the type of gear used) will determine the length of fish caught. Harvest pressure frequently reduces mean adult fish length in a population through time, primarily through the systematic removal of older, larger, and slower-growing individuals (Ricker, Reference Ricker1981; Hsieh et al., Reference Hsieh, Reiss, Hunter, Beddington, May and Sugihara2006; Hard et al., Reference Hard, Gross, Heino, Hilborn, Kope, Law and Reynolds2008). The selectivity of the fishing gear will influence the measured size distribution of a sampled population. For example, in commercial hook-and-line fisheries, larger hooks do not capture smaller fish, while weak fishing line will more frequently break when landing larger fish. Finally, in some situations, fish size may be more closely related to food availability, ocean conditions, or competition than to age (Gulland and Rosenberg, Reference Gulland and Rosenberg1992). Fish size can be, therefore, indicative of one or a combination of factors, including exploitation pressure and fisheries selectivity, environmental change, and changes in trophic structure.
According to Shin et al. (Reference Shin, Rochet, Jennings, Field and Gislason2005, p.384), size-based indicators (SBIs) are measurements that “summarize the size distribution of fish assemblages and populations … [and building] up time-series of size-abundance data allows one to trace the history of fished assemblages.” These SBIs are often expressed as a mean length to convey information about a larger population that can be compared across space and through time (for application in an archaeological context, see Betts et al., Reference Betts, Maschner, Clark, Moss and Cannon2011). Removal of large fish from a population through predation or increased mortality, for example, will reduce mean length. However, mean length would also be reduced if enhanced juvenile recruitment increased the relative contribution of small fish. Therefore, because both commercial and ancient fisheries are inherently size selective (see our “Selectivity” section), mean length data do not necessarily represent population structure.
In an archaeological context, estimated mean body length has been used extensively to understand the influence of human predation pressure on marine fish (Broughton, Reference Broughton1997; Butler, Reference Butler2001; Kopperl, Reference Kopperl2003; Masse et al., Reference Masse, Liston, Carucci and Athens2006; Carder et al., Reference Carder, Reitz and Crock2007; Ono and Clark, Reference Ono and Clark2012; Turrero et al., Reference Turrero, Garcia-Vazquez and Garcia de Leaniz2014) and the possible effects of changing climate on fish populations (Maschner et al., Reference Maschner, Betts, Reedy-Maschner and Trites2008; Betts et al., Reference Betts, Maschner, Clark, Moss and Cannon2011). While many studies acknowledge the potential value of such archaeological data to contemporary fish management, just a handful acknowledge the value of size distributions for understanding past fish populations (Leach et al., Reference Leach, Davidson and Horwood1997; Béarez, Reference Béarez2000; McKechnie, Reference McKechnie2007; Nakajima et al., Reference Nakajima, Nakajima and Yamazaki2010) and few apply connections between modern and ancient data (but see McClanahan and Omukoto, Reference McClanahan and Omukoto2011).
Pacific cod (Gadus macrocephalus)
Although Atlantic cod (Gadus morhua) has been fished commercially since the sixteenth century (Rose, Reference Rose2006), Pacific cod is a relatively recent commercial fishery, having only developed across the North Pacific since the nineteenth century (Bean, Reference Bean1890; Cobb, Reference Cobb1916; Fredin, Reference Fredin1987). Canada, Japan, Korea, Russia, and the United States all contribute to the global cod fishery, with Russia and the United States making the largest contributions (17.3% and 69.0% of total catch, respectively; Orlov et al., Reference Orlov, Stroganov and Buryakova2008). Alaska's modern Pacific cod fishery is ranked as one of the highest in value to the U.S. market, behind Pacific salmon (Oncorhynchus spp.), crab (primarily red king crab [Paralithodes camtschaticus]), and walleye pollock (Gadus chalcogrammus). In 2015–2016, annual U.S. cod landings were in excess of 700 million pounds with a total value of $580 million (ASMI, 2017). Thus, understanding the extent to which cod are susceptible to overfishing and environmental changes is of high management, economic, and social importance.
In contrast to the large-scale modern commercial fishery, archaeological midden samples reflect small-scale fisheries activity, but they provide great temporal depth, spanning the past 6000 yr. These data reveal that while salmon were an important resource in many places across the North Pacific, cod dominate the record in equal or greater numbers across the region (Moss and Cannon, Reference Moss and Cannon2011; see Supplementary Table 1). Archaeological data from the central Aleutian Islands (Orchard, Reference Orchard2003), Sanak Island (Maschner et al., Reference Maschner, Betts, Reedy-Maschner and Trites2008; Betts et al., Reference Betts, Maschner, Clark, Moss and Cannon2011), Kodiak Island (Kopperl, Reference Kopperl2003; West, Reference West2009; West et al., Reference West, Wischniowski, Johnston, Moss and Cannon2011), and the Prince of Wales archipelago (Moss, Reference Moss2004, Reference Moss, Moss and Cannon2011; Moss et al., Reference Moss, Hays, Bowers and Reger2016; Fig. 1) also hint at the possibility of using this record to understand cod responses to human harvesting and changing climate conditions over thousands of years in localized contexts.
Pacific cod is a cold-water, demersal fish found across the North Pacific Ocean from California to China (ADFG, 1985; NOAA, 2010). Cod may live up to 8 or 9 yr and adults may weigh as much as 25 kg and measure up to 120 cm in length and are generally found 25–550 m deep, depending on the season and location (Mecklenburg et al., Reference Mecklenburg, Mecklenburg and Thorsteinson2002). The distribution of adult cod is driven by water temperature, and in many places adult cod spend the winter in deeper (>100 m) waters where temperatures are more consistent than in shallower waters. Adult cod spawn in late winter and early spring, and in late spring they move to shallower, warmer waters near shore to recommence feeding. The distance and duration of these migrations can vary according to temperature, food availability, and bathymetry (Shimada and Kimura, Reference Shimada and Kimura1994; Stepanenko, Reference Stepanenko1995; Savin, Reference Savin2007). Datsky and Andronov (Reference Datsky and Andronov2014) and Barbeaux and Hollowed (Reference Barbeaux and Hollowed2018) suggest that there is an ontogenetic gradient with higher densities of smaller cod in shallower waters (<100 m) and higher densities of larger cod in deeper waters (>200 m). On the other hand, Davis and Ottmar (Reference Davis and Ottmar2009) suggest that cod are particularly adaptable to changing ecological conditions, which can complicate these vertical and horizontal movements. According to Cobb (Reference Cobb1927), cod stay relatively close to shore year-round in areas where seasonal water temperature varies less, including the central and western Gulf of Alaska.
It has long been assumed that cod are a single panmictic stock (e.g., Grant et al., Reference Grant, Zhang, Kobayashi and Ståhl1987); however, recent genetic research challenges this assumption and suggests management units and population structure may not align (Cunningham et al., Reference Cunningham, Canino, Spies and Hauser2009; Spies, Reference Spies2012). Alaska's cod are currently managed in three broad resource areas: the Bering Sea (BS), the Aleutian Islands (AI), and the Gulf of Alaska (GOA; Fig. 1). However, Cunningham et al. (Reference Cunningham, Canino, Spies and Hauser2009) use microsatellite data to argue that cod demonstrate an isolation-by-distance pattern that has resulted in “significant genetic divergence” among cod populations in Unimak Pass, Kodiak Island, and the Aleutian Islands, and further work using genetics may indicate greater resolution at the level of the spawning stock (Spies, I., personal communication, 2018).
Changing fish populations
Historical catch records are increasingly used to examine variability in fish populations around the world (e.g., Thurstan et al., Reference Thurstan, Campbell and Pandolfi2014), particularly among Atlantic cod populations (Rosenberg et al., Reference Rosenberg, Bolster, Alexander, Leavenworth, Cooper and McKenzie2005; Rose, Reference Rose2006). However, there has been relatively little historical work done on the effects of fishing pressure on Pacific cod populations, given the age and apparent health of the Pacific fishery. Annual stock assessments examine the response of fish populations to commercial fisheries and management efforts and indicate that cod have responded well to management efforts across the GOA, BS, and AI regions (e.g., Barbeaux et al., Reference Barbeaux, Aydin, Fissel, Holsman, Palsson, Shotwell, Yang and Zador2019).
On the other hand, significantly more research has been done on the effects of changing climate conditions on cod and other groundfish populations. The literature suggests that cod population sizes fluctuate in response to climatic regime shifts, including the Pacific Decadal Oscillation (PDO; Mantua et al., Reference Mantua, Hare, Zhang, Wallace and Francis1997) and the El Niño–Southern Oscillation (Hollowed et al., Reference Hollowed, Hare and Wooster2001). The relationships among climate, ecosystems, and biology are complex (Overland et al., Reference Overland, Rodionov, Minobe and Bond2008; Litzow et al., Reference Litzow, Mueter and Hobday2014), and the relationships among food availability, water temperature, habitat, predation, and juvenile gadid production and survival are poorly understood (Abookire et al., Reference Abookire, Duffy-Anderson and Jump2007; Poltev, Reference Poltev2008; Davis and Ottmar, Reference Davis and Ottmar2009; Laurel et al., Reference Laurel, Ryer, Knoth and Stoner2009).
However, recent research on the relationship between Pacific cod egg and larval survival and temperature has revealed that cod may have strict requirements for successful recruitment (Laurel et al., Reference Laurel, Hurst, Copeman and Davis2008; Laurel and Rogers, Reference Laurel and Rogers2020), suggesting potentially stringent temperature limits on Pacific cod larval production both at higher and lower temperatures. Trends in recruitment validate these findings: variability in juvenile cod abundance is commensurate with variability in water temperature in the Gulf of Alaska (Barbeaux et al., Reference Barbeaux, Aydin, Fissel, Holsman, Palsson, Shotwell, Yang and Zador2019; Laurel and Rogers, Reference Laurel and Rogers2020). Looking to the past few decades, these trends suggest that warm temperatures in the early 1980s led to increased recruitment when compared with the colder conditions preceding and following this period, while even warmer temperatures in the late 2010s resulted in recruitment collapse (Barbeaux et al., Reference Barbeaux, Aydin, Fissel, Holsman, Palsson, Shotwell, Yang and Zador2019). Studies on cod development show that growth is also dependent on temperature, with slower growth at suboptimal conditions that are either too warm or too cold (Hurst et al., Reference Hurst, Laurel and Ciannelli2010; Laurel et al., Reference Laurel, Hurst and Ciannelli2011). Modern temperature conditions in the region of this study have been below the optimum (Barbeaux et al., Reference Barbeaux, Aydin, Fissel, Holsman, Palsson, Shotwell, Yang and Zador2019), so increasing temperatures would lead to increasing growth rates until the optimum is exceeded and temperatures grow too warm. Therefore, a combination of environmental conditions could complicate the expected relationship between population abundance and mean size. Understanding these relationships has become particularly critical, as Gulf of Alaska cod have recently shown dramatic decreases in population, likely due to ocean warming, resulting in severe cuts in fishing quotas (~80%) in 2018 and 2019 and the closure of the directed fishery in 2020 (Barbeaux et al., Reference Barbeaux, Aydin, Fissel, Holsman, Palsson, Shotwell, Yang and Zador2019).
As described earlier, the limitations of using only historic or contemporary records for understanding ecosystem dynamics are clear, particularly in the context of intensive commercial fisheries activity (Pauly, Reference Pauly1995; Anderson and Piatt, Reference Anderson and Piatt1999; Jackson et al., Reference Jackson, Kirby, Berger, Bjorndal, Botsford, Bourque and Bradbury2001; Pinnegar and Englehard Reference Pinnegar and Englehard2008). There is both habitat and climate variability across the North Pacific Ocean (Mundy, Reference Mundy2005), and likely significant cod population variability as well (Cunningham et al., Reference Cunningham, Canino, Spies and Hauser2009; NOAA, 2010). Variability in fish populations extends to longer time periods, though few studies have employed long-term (i.e., >200 yr) data sets to understand the broader context of these shifts (e.g., Baumgartner et al., Reference Baumgartner, Soutar and Ferreira-Bartrina1992; Finney et al., Reference Finney, Gregory-Eaves, Douglas and Smol2002; Canino et al., Reference Canino, Spies, Cunningham, Hauser and Grant2010). Climate conditions have changed broadly across the North Pacific since the Pleistocene–Holocene transition, and these changes had variable effects on local environments (e.g., Mann et al., Reference Mann, Crowell, Hamilton and Finney1998). The early–middle Holocene (10–6 ka) was characterized by warmer conditions, which changed with the onset of the Neoglacial phase around 6 ka. This Neoglacial phase was characterized by overall cooling temperatures, but also interspersed with rapidly warming and cooling periods. Two of these phases are the late Holocene warm period (also called the Medieval Warm Period, ~1000 yr ago) and the late Holocene cooling period (also called the Little Ice Age or LIA, ~500 yr ago; AD ~1200 to AD ~1900). While these broader phases may show broad warming and cooling trends, they demonstrate centennial and decadal changes on a smaller scale as well. All of these time scales are relevant to the long history of interactions between people and cod in the North Pacific.
Zooarchaeological and paleoenvironmental data from the North Pacific offer the opportunity to examine cod variability over thousands of years. For example, West et al. (Reference West, Wischniowski, Johnston, Moss and Cannon2011) and Helser et al. (Reference Helser, Kastelle, Crowell, Ushikubo, Orland, Kozdon and Valley2018) demonstrate that variable conditions of the Late Holocene cooling period (LIA) were recorded in the chemistry of cod otoliths from the Gulf of Alaska. However, West (Reference West2009) finds no zooarchaeological evidence to suggest that the fish harvest on Kodiak Island was significantly influenced by this cooling period. On the other hand, Maschner et al. (Reference Maschner, Betts, Reedy-Maschner and Trites2008) and Betts et al. (Reference Betts, Maschner, Clark, Moss and Cannon2011) suggest for Sanak Island that both cod body size and harvest size decreased during this period. Kopperl (Reference Kopperl2003) finds that the intensity of the cod harvest increased over the last 6 ka on Kodiak Island with a possible corresponding decrease in body size, suggesting human harvesting pressure. The synthesis of this work suggests there may be local variability in cod dynamics that is critical for understanding both long-term and contemporary populations.
MATERIALS AND METHODS
Archaeological Sites
The archaeological assemblages used in this study were excavated across the North Pacific coastline from the northern Kuril Islands to southeast Alaska, and date from 5.4 ka through the eighteenth century (Fig. 1, Supplementary Table 2). The archaeological assemblages were selected for the following reasons: (1) each site includes substantial and previously identified faunal collections; (2) recovery of midden samples was accomplished with a minimum mesh size of 6.4 mm (1/4 inch);Footnote 1 (3) each site includes cod identified as G. macrocephalus (Supplementary Table 1); (4) each site has been radiocarbon dated and the dates have been calibrated (see Supplementary Table 2); and (5) together, the sites provide a wide geographic breadth and temporal depth.
To make meaningful comparisons between the ancient and modern data, we chose geographic boundaries based on geographic distance and the available published genetic data that show there are distinctive cod populations across the region: (1) the northern Kuril Islands; (2) the Aleutian Islands (west of Unalaska); (3) Unimak Pass (Unalaska/Amaknak and Sanak Islands); (4) the Kodiak archipelago (Afognak, Kodiak, and Sitkalidak Islands); (5) the Katmai coast (Little Takli and Mink Islands); and (6) Prince of Wales Island (Fig. 1). According to genetic data, cod spawning groups from the area around Unimak Pass and the Kodiak archipelago are each distinct populations, and the Attu, Amchitka, and Buldir Islands cod are part of the Aleutian Islands population (Cunningham et al., Reference Cunningham, Canino, Spies and Hauser2009; Spies, Reference Spies2012). While cod genetics from the northern Kurils are limited, we consider these populations distinctive, because the existing data do not suggest genetic connections to Gulf of Alaska or Aleutian Island stocks (Smirnova et al., Reference Smirnova, Orlova, Mugue, Mukhametov, Smirnov and Orlov2015). Genetic samples of cod from the Katmai coast (Little Takli and Mink Islands) and Prince of Wales Island have not yet been analyzed (Spies, Reference Spies2012), so those areas are treated separately. For each of the regions described, all archaeological samples within that region were combined to ensure adequate sample sizes for statistical comparison with modern data and to smooth the effects of seasonality or site-specific use (see our “Analyses of archaeological data” section). Site-specific data can be found in Supplementary Tables 2 and 3.
Archaeological measurements
Measurements of the archaeological specimens were taken following Orchard (Reference Orchard2003). Orchard (Reference Orchard2003) provides linear regression models for predicting cod fork length from individual skeletal element measurements (see fig. 5.4 and table 6.7 in Orchard Reference Orchard2003).Footnote 2 The regressions have strong predictive value (r 2 values range from 0.853 to 0.987; Orchard, Reference Orchard2003, table 6.7) and are based on measurements taken from 25 modern comparative cod skeletons that ranged in fork length from 26 to 88 cm. Data produced by Kopperl (Reference Kopperl2003) and Moss (Reference Moss, Moss and Cannon2011) were generated using other methods (see Supplementary Tables 4 and 5): Moss (Reference Moss, Moss and Cannon2011) follows Orchard's (Reference Orchard2003) measurements of the premaxilla, but also estimates fish length from otoliths, based on Harvey et al. (Reference Harvey, Loughlin, Perez and Oxman2000). The otolith regression is based on 110 cod specimens from the Bering Sea, ranging from 10 to 106 cm in fork length and with r 2 = 0.883 (Harvey et al., Reference Harvey, Loughlin, Perez and Oxman2000, supplementary table 4). Kopperl (Reference Kopperl2003, p. 93) selected jaw elements that are identifiable as G. macrocephalus, including the angular, dentary, maxilla, and premaxilla, and measured landmarks that would preserve on fragmentary specimens. To make Kopperl's (Reference Kopperl2003) data set comparable, we developed conversion equations using our own modern reference skeletal collections consisting of n = 4 specimens of known size. The correlations between (1) Orchard's measurements and fork length and (2) Kopperl's measurements of the premaxilla and Orchard's measurements are high (r 2 = 0.99; P < 0.01), allowing us to convert Kopperl's premaxilla measurements to fork length. Finally, we acknowledge that the fish skeletons Orchard (Reference Orchard2003) used to generate the regression equations were smaller (26–88 cm in length) than many of the fish measurements presented in this study, and the relationship between bone size and fish length for the largest fish (>90 cm) has not yet been tested; however, general allometric trends of fish growth suggest that this trend should hold beyond the limits of the comparative specimen range.
Modern fishery data
Modern fish are measured in terms of total length (TL), which is the greatest length of the whole body from the tip of the snout to the posterior point, or fork length (FL), which is the measurement of fish length from the tip of the snout to the end of the middle caudal rays. The modern data provided here are based on measured TL, while the archaeological data are based on the estimates of FL based on regression formulae derived by Orchard (Reference Orchard2003). For cod, these measurements are comparable, because a cod has a truncate tail and regression formulae provided by FishBase, where TL = 0 + 1*FL (www.fishbase.org), show the two measurements are identical. All modern Pacific cod length measurements were collected by fishery technicians (observers) on board the fishing vessels through a random sample of the catch as it was coming aboard (AFSC, 2020). By regulation, all Pacific cod are landed and retained, regardless of size, and therefore have an equal probability of being included in the sample.
For each of the geographic regions defined earlier, we compiled modern fish lengths from existing commercial harvest data. We chose modern fish length data from areas in proximity to the archaeological sites used in this analysis. This was done for two reasons: (1) the range of 50 km distance and 274 m (150 fathoms) accommodates the harvest areas for both the modern and ancient fisheries, and (2) although it may exceed the distance and depth that ancient fisheries accessed, smaller resolution would not provide adequate data for the modern fisheries in some locations. The Alaskan archaeological site locations were added to ARCGIS by latitude and longitude. The proximity-buffer tool was used to create 50-km-radius circles around the site locations, which were then saved as shape files. The 50 km site buffer shape files were imported into an R (R Core Team, 2018) workspace using the readOGR function from the rgdal R library (Bivand et al., Reference Bivand, Keitt and Rowlingson2017). Cod length measurements (TL) collected by at-sea fishery observers year-round from 1989 through 2017 during commercial fishing operations (AFSC, 2018) were queried from the AFSC NORPAC database with associated metadata, including depth, location, and date (see Cahalan et al. Reference Cahalan, Gasper and Mondragon2014 for additional details on sampling methods; technical details of the NORPAC database can be found at https://www.fisheries.noaa.gov/resource/data/data-collected-groundfish-observers-alaska). These data were imported into R and spatially merged with the 50 km site buffer polygons using the over function from the sp R library (Pebesma and Bivand, Reference Pebesma and Bivand2005; Bivand et al., Reference Bivand, Pebesma and Gomez-Rubio2013), such that each fish measured could be associated with one or more of the archaeological sites. Monthly PDO index values were retrieved (Joint Institute for the Study of the Atmosphere and Ocean (JISAO) February 20, 2018), added to the R workspace, and joined by year to the length data, such that each length measurement had the monthly PDO index values associated with the year in which it was collected. To most closely approximate the methods used by ancient fisheries described in our section on “Selectivity,” the data were filtered to include those data collected at depths less than 274 m (150 fathoms) and those collected by the hook-and-line fishery only. The statistical analyses described in this paper are, therefore, limited to the Alaska hook-and-line fishery data.
Selectivity
Gear selectivity and location of harvest are critical variables that influence the size of cod caught by both contemporary and ancient fisheries. Because all fishing gear is size selective, the overall catch composition will differ from the overall fished population (Hovgård and Lassen, Reference Hovgård and Lassen2000). Size selectivity is the ability of a fishing method or gear type to capture and retain sections of the fish population, which might be grouped by age, size, or behavior (Thompson and Ben-Yami, Reference Thompson and Ben-Yami1983; Hovgård and Lassen, Reference Hovgård and Lassen2000). The size selection of fishing gear can be described by a selection curve: this curve describes the proportion of the population in a given size group that is retained by a particular gear type, fleet, region, and/or time period. Assuming a gear type captures fish above a certain size proportional to the overall sampled population, the results produce an asymptotic selectivity curve (Fig. 2A). Fish whose body size falls below the asymptotic selectivity curve are caught at a rate lower than is represented in the overall sampled population, with that rate depending on specific characteristics of the gear (e.g., hook size) and the shape of the selectivity curve. The point of full selection (i.e., 100% selectivity) can differ among gear types and hook sizes. However, at a size greater than the fully selected size for all gear types (Fig. 2D), the proportions at a specific size in the sampled distributions will be identical, assuming the gear types are sampling the same population or sampling populations with the same statistical distributions (Fig. 2E and F).

Figure 2. Figures demonstrating differences in selectivity for different gear types and the resulting sampled distributions from a typical Pacific cod population. (A) Logistic (asymptotic) selectivity curves for three different gear types: the dashed light blue line is the modern longline selectivity curve from Barbeaux et al. (Reference Barbeaux, Aydin, Fissel, Holsman, Palsson, Shotwell, Yang and Zador2019), the dark blue dotted line is a similar hypothetical gear type selectivity curve but with a higher asymptotic point. (B) The overall Pacific cod population distribution at length (pink) and the resulting sampled distributions in numbers for the two selectivity curves. (C) The proportional sampled distributions from the two selectivity curves showing two different modes because of differences in selectivity. (D) These are the same curves as in A with the addition of the red line, which indicates length at the 60th percentile of sampled distribution from the most selective gear (highest asymptotic point). (E) The population and sampled distributions by number and (F) the population and sampled distributions by proportion when only considering the population and sample distributions to the right of the red line, where selectivity is 1.0 for both curves, showing no differences.
In terms of gear, the prehistoric cod fisheries relied on handheld gear used from shore or from small boats, and there is little evidence that nets or other capture methods were widely employed (Partlow and Kopperl, Reference Partlow, Kopperl, Moss and Cannon2011). Hooks are size selective today, and prehistoric composite fishhooks were also sized to target specific species of fish or even to select for larger fish within a species (Stewart Reference Stewart1982; Colley, Reference Colley1987; Knecht, Reference Knecht1995; Ames and Maschner, Reference Ames and Maschner1999; Stanek, Reference Stanek2000). Ethnohistoric evidence demonstrates that people would have been able to harvest cod from great depths (up to 300 m) using a composite fishhook secured to a kelp line (Berezkin et al., Reference Berezkin, Arndt and Fields2012; Holmberg, Reference Holmberg, Falk and Jaensch1985; Stanek, Reference Stanek2000). Similarly, it is generally thought that cod were harvested in the spring and summer, when larger fish migrate to shore, and the gear would have been designed to select for these largest fish (Partlow and Kopperl, Reference Partlow, Kopperl, Moss and Cannon2011). However, there may have been more seasonal variability than this: Jochelson's ethnographic work in the 1930s suggests people in the Aleutian Islands traveled almost 25 km (15 miles) from shore to fish for large, adult cod in the winter (Jochelson, Reference Jochelson2002), while historic documents and unpublished data from the Kodiak archipelago show that some populations of cod do not migrate long distances and are locally available year-round (Cobb, Reference Cobb1916).
Modern commercial fisheries employ multiple gear types to harvest cod in the North Pacific, including trawls, longlines, jig, and pots, which all select fish size differently. In an effort to make the modern and ancient data comparable, given the limitations of selectivity, we restricted the modern data to those collected by longline and jig (hook-and-line fisheries), which most closely approximate the methods used by prehistoric people. Modern hook-and-line fisheries operate year-round within about 80 km (50 miles) of shore, targeting a wide age and size distribution. The Gulf of Alaska Pacific Cod Stock Assessment (e.g., Barbeaux et al., Reference Barbeaux, Aydin, Fissel, Holsman, Palsson, Shotwell, Yang and Zador2019) models fisheries selectivities by length for the hook-and-line fisheries, using asymptotic logistic curves. Based on these curves, full selection in the modern Gulf of Alaska cod hook-and-line fishery occurs at the 55th percentile of the sample length distribution (67 cm TL) for that fishery (Barbeaux et al., Reference Barbeaux, Aydin, Fissel, Holsman, Palsson, Shotwell, Yang and Zador2019).
To examine evidence for truncation in the modern distributions when compared with the ancient distributions, we assumed the ancient hook-and-line fishery also had asymptotic selectivity. However, we do not know the shape of the ancient selectivity curve at smaller fish sizes, and we make the assumption that people selected for the largest fish, as discussed earlier. Therefore, we compared the upper portion of the length distributions only and assumed parity in selectivity for both data sets above the 60th percentile of the distributions for each site.
Analyses of archaeological data
For each region analyzed, the archaeological data from all sites and time periods were combined for statistical comparison with the modern data, resulting in broad comparisons between “ancient” and “modern” time periods. This was done for two reasons: first, Lyman (Reference Lyman1987) and Shipman (Reference Shipman1981) suggest a minimum sample size of 30 ageable specimens (irrespective of potentially duplicated individuals) for characterizing the age or size composition of an archaeological assemblage. Second, as McKechnie and Moss (Reference McKechnie and Moss2016, p. 472) argue, and we observe in our own data, many sites from this region “lack consistent and/or fine temporal resolution,” and collapsing the data into a single analytical unit “provides for and incorporates the cumulative human experience of harvesting certain animals in certain places … that helps identify consistency in human practices across time periods.” We recognize that flattening the archaeological data over a long time period eliminates short-term temporal variability: the details and effects of site seasonality, cultural change, changing environmental conditions, and potential localized effects of fishing may all be lost. However, as McKechnie and Moss (Reference McKechnie and Moss2016) suggest, combining the data across time periods allows for a broad picture of fish size across space and through time via robust samples that are comparable to contemporary fisheries data.
Analyses of modern fishery data
Generalized additive models (GAMs; Wood, Reference Wood2006) were used to examine the influence of covariates in the modern Alaska fisheries data as developed in the mgcv R library (Wood, Reference Wood2011) with fork length as the dependent variable. Independent covariates included in the examination were month (as a factor), the February PDO index (as a factor warm vs. cold), bottom depth (m), longitude, and location (as a factor). Thin-plate regression splines were used for year, bottom depth, and longitude when included in the model. To limit overfitting in the model, the number of knots was restricted to a maximum of four for the bottom depth spline. Location and longitude were never included in the same model.
Analyses comparing modern and archaeological collections
The comparison of the archaeological and modern length distributions was conducted using several methods. First, a type III factorial analysis of variance (ANOVA) was used to examine the relationship between the modern fishery and the archaeological data. This statistical process is used to assess the differences between means and analyzes the amount and sources of variance among samples; a type III ANOVA was used because the two data sets are unbalanced (they do not have the same number of observations). The ANOVA was conducted using the Anova function in the car R library (Fox and Weisberg, Reference Fox and Weisberg2011). Covariates included in these examinations were “collection” (archaeological vs. modern fishery) and “site location,” which were found to interact significantly (see Supplementary Table 6 for model details). Longitude was evaluated as a splined covariate in a GAM, but the linear model using site location provided a fit as good as the GAM and simplified the analysis. We recognize that the ANOVA evaluates differences in the means and does not take into account differences in gear selectivity or fish availability between the modern and archaeological collections, as discussed earlier. Therefore, to confirm the ANOVA results, K-sample Anderson-Darling permutation tests (Scholz and Stephens, Reference Scholz and Stephens1987) from the kSamples R library (ad.test function; Scholz and Zhu, Reference Scholz and Zhu2018) were performed for each geographic location. These tests evaluate whether the two distributions (archaeological and modern fishery data) for each site could have originated from a common, unspecified distribution function, captured with gear of similar selectivity. Significant (ɑ = 0.05) differences would suggest the two collections originated from different processes or from different populations.
As described earlier, to compare the length distributions for the largest fish only and to assess whether there has been truncation of the upper end of the length distribution, it was assumed that fish at greater than the 0.6 quantile (60th percentile) of the modern fishery data for each site (Supplementary Table 7) were fully selected in both collection types. To examine the upper tails of both the modern fishery and archaeological data, we employed a type III ANOVA on a generalized linear regression, assuming a log-linked gamma distribution (Venables and Ripley, Reference Venables and Ripley2002) using the stats R library (glm function; R Core Team, 2018; see Supplementary Table 7 for model details). K-sample Anderson-Darling permutation tests were also performed for each geographic location. These tests were used to compare the upper tails of the archaeological and modern fishery length distributions for each site. For this test, significant (ɑ = 0.05) differences resulting from longer or fatter upper tails in the archaeological data could be interpreted as truncation of the upper tail, or loss of the largest fish, in the modern distribution.
For the northern Kurils, the bulk of the modern data are derived from trawl surveys, which have a known size-selectivity bias toward smaller fish relative to hook-and-line fisheries (Huse et al., Reference Huse, Løkkeborg and Soldal2000). Longline data for the northern Kurils were available for a single year, 1957, from the areas adjacent to Zemleprokhodets Cape, Paramushir Island, and Kuril Strait, Shumshu Island (Elkina, Reference Elkina1957), although data on season and depth of capture were not available. The Kurils data were interval censored into 5 cm bins. Summary statistics can be calculated for interval-censored (or grouped) data using the midpoint of each bin, with a subsequent loss of resolution in the data that scales with the size of the bin.
RESULTS
Our filtering of the modern and archaeological fisheries data yielded 213,053 individually measured fish from the commercial fishery and length estimates for 5728 archaeological specimens (Supplementary Tables 3 and 4). Results of the GAM, which examines the modern fishery data alone, suggest that location, month, and depth exhibit the greatest influence on the size of cod harvested in the GOA, BS, and AI from 1989 to 2017 (Barbeaux et al., Reference Barbeaux, Aydin, Fissel, Holsman, Palsson, Shotwell, Yang and Zador2019; Fig. 3, Table 1). According to Figure 3C and Table 1, fishing location suggests that modern cod size is strongly patterned geographically: mean and maximum size of the modern commercial catch are greatest in the western and central Aleutian Islands. At a seasonal level, the largest fish are caught from January to June, and smaller fish from July to December, as larger, adult cod move offshore in the midsummer and fall (Fig. 3E). These data confirm that larger cod tend to spend more time at greater depths (Fig. 3B). There is a small, but significant, difference in length from warm to cold years, as measured by the February PDO, with larger fish harvested in the cold years (Fig. 3D), possibly indicating greater availability to the fishery as the distribution of larger fish shifts to shallower waters in colder years (Li et al., Reference Li, Hollowed, Cokelet, Barbeaux, Bond, Keller, King, McClure, Palsson, Stabeno and Yang2019; Yang et al., Reference Yang, Cokelet, Stabeno, Li, Hollowed, Palsson, Bond and Barbeaux2019).

Figure 3. Generalized additive modeling results showing the effects of each covariate on the intercept value in centimeters with 95% error bounds: for the smoothed terms bottom depth (A) and year (B); and for the factors site of harvest (C), February Pacific Decadal Oscillation (PDO) phase (D), and month of harvest (E). These data are for contemporary commercial longline and jig fishing data within 50 km of the archaeological sites.

a Abbreviations: PDO, Pacific Decadal Oscillation; edf, estimated degrees of freedom for the model terms; Ref.df., reference degrees of freedom used in computing test statistic and p-values.
b The adjusted R 2 is 0.0868, and deviance explained is 8.96%.
Like the twentieth-century longline data, the archaeological measurements are patterned geographically: the largest cod have been recovered from sites in the western and central Aleutians and the northern Kurils (Supplementary Tables 4 and 5). Meanwhile, in the eastern Aleutians and eastward to southeast Alaska, cod exhibit smaller means, modes, and overall size distributions (Fig. 4, Supplementary Tables 4 and 5). For the northern Kurils, we simply point out that both the modern and ancient distributions have identical ranges (within the limits of the interval-censored data; Supplementary Tables 3 and 4) and show a major mode at 75 cm and a minor mode around 55–60 cm (Fig. 4).
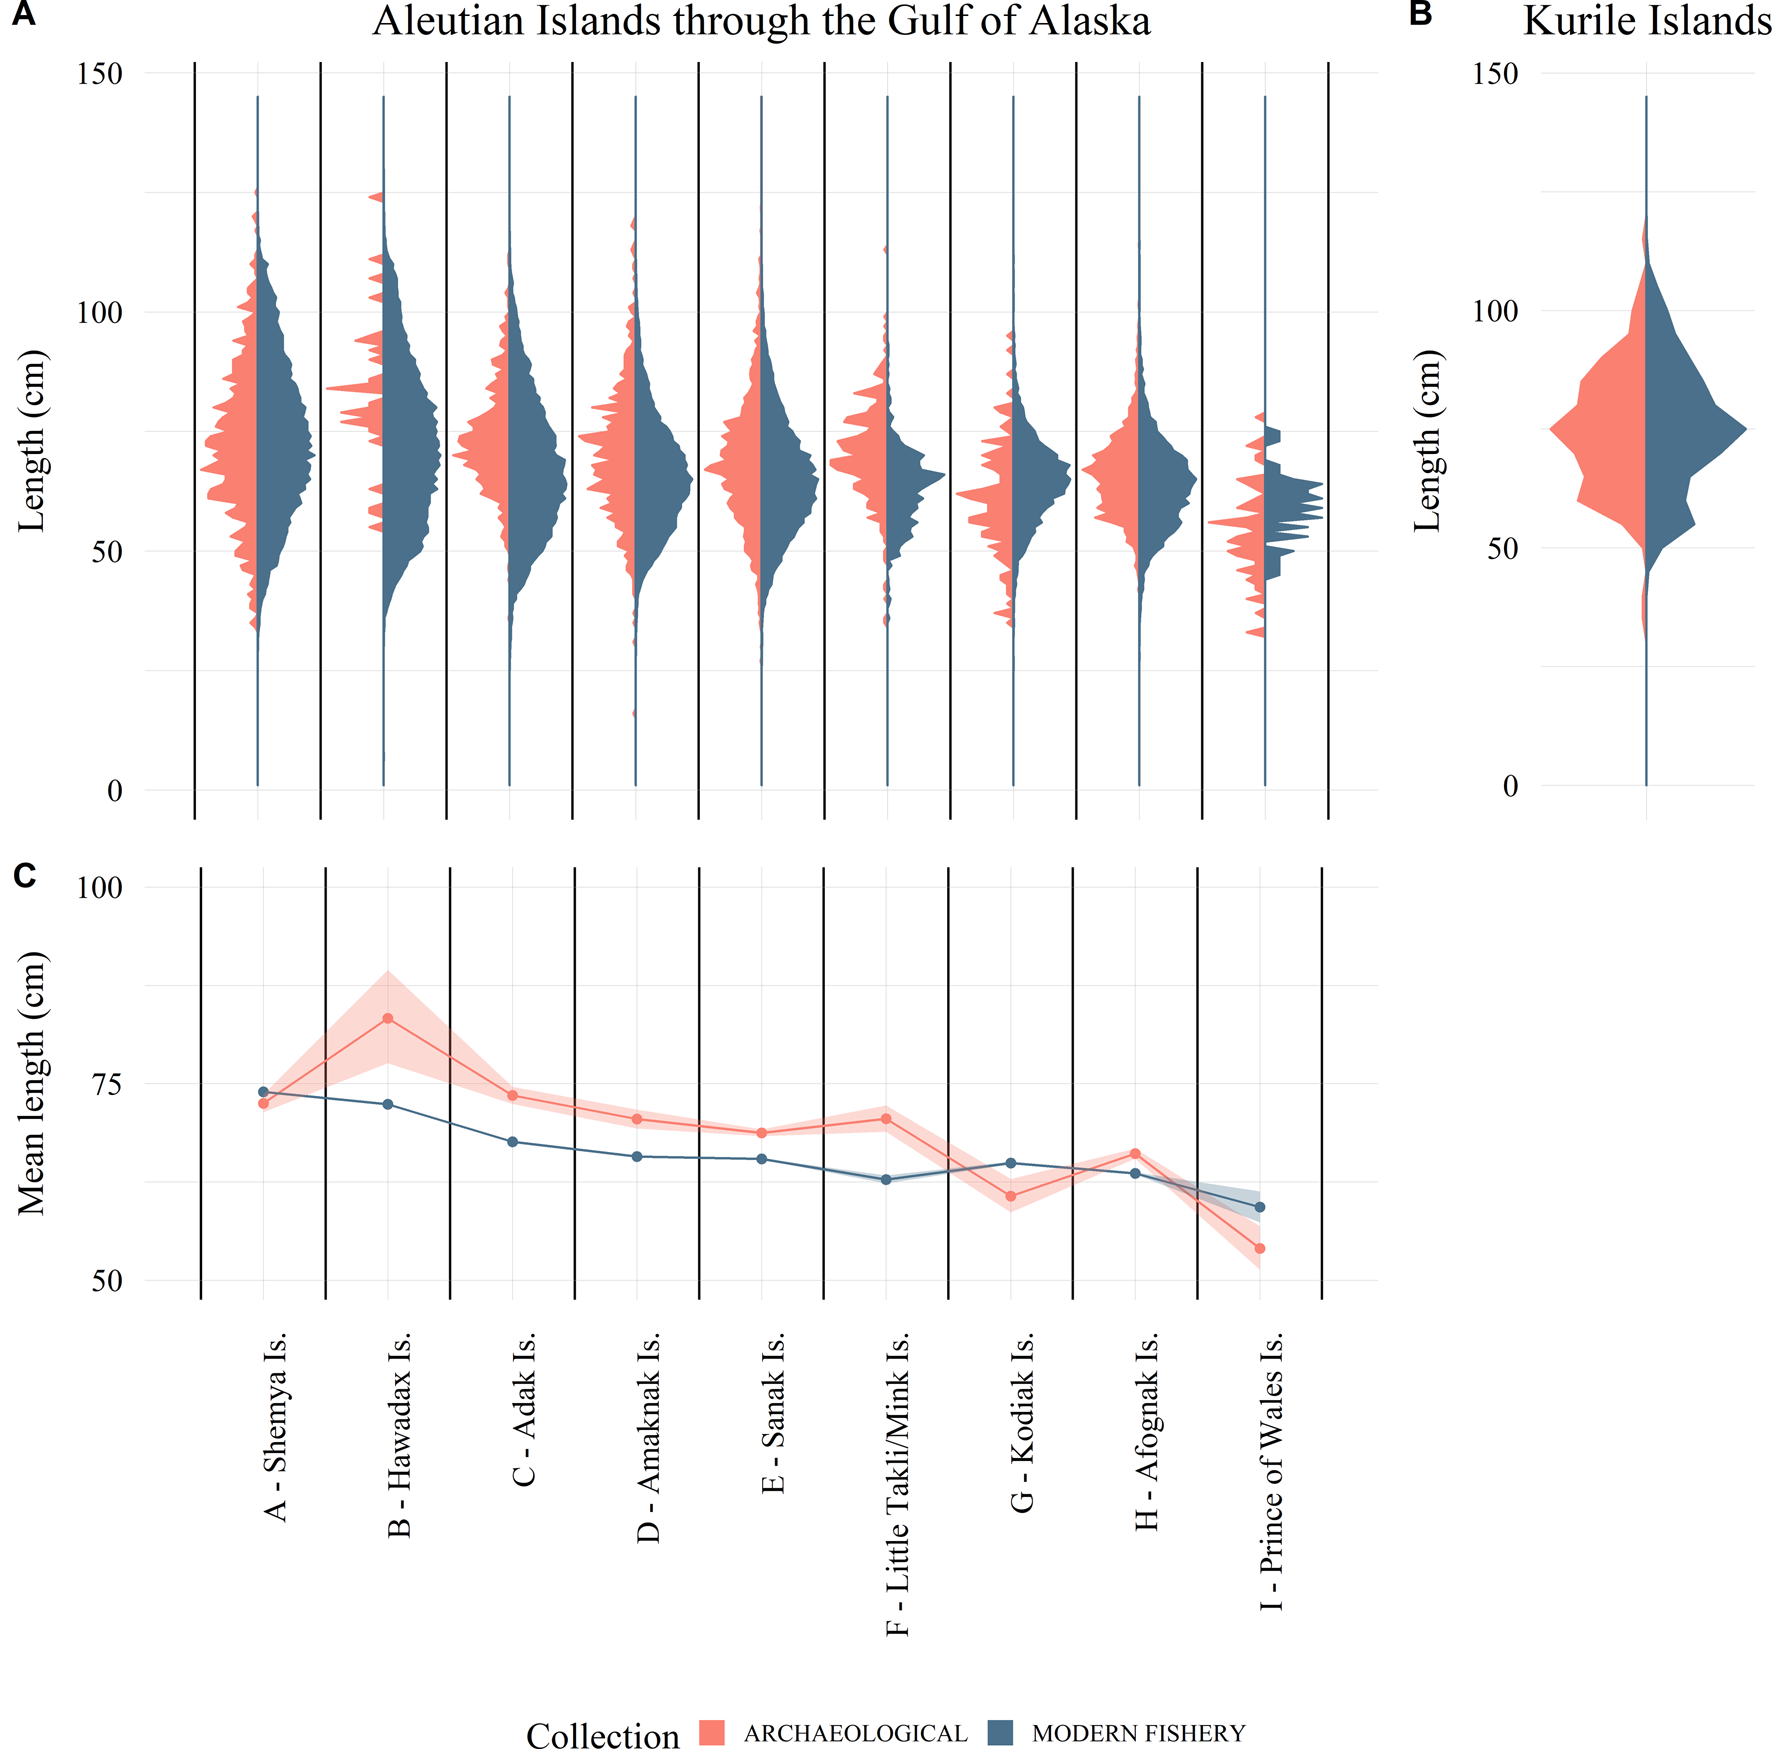
Figure 4. Length distribution of Pacific cod: (A) from the Alaska archaeological collections (red) and modern longline and jig commercial fishery data (blue) within 50 km of the archaeological sites; (B) the northern Kuril Islands archaeological collections (red) and 1957 longline fishery data (blue); and (C) simple linear regression results of Alaska modern fishery and archaeological collections by site showing means and 95% confidence intervals. These data show that the spatial trends in the ancient and modern distributions are generally consistent with both data sets having larger fish in the west and smaller fish in the east, but with significant differences in the means.
When comparing the archaeological and modern length data, the ANOVA concludes that both site (geographic location) and collection (archaeological or modern), as well as their interaction, are significant factors driving the mean length of fish (Fig. 4, Table 2, Supplementary Table 6). The Anderson-Darling tests show significant differences in the length distributions between the two collections (ɑ < 0.05) for every site, suggesting that the collections at each site were not drawn from a common distribution (Table 3).

a Abbreviations: ANOVA, analysis of variance; SS, sum of squares; DF., degrees of freedom.
b Significant factors (α = 0.05) are shaded.
Table 3. Values for the K-sample Anderson-Darling tests (AD test) and mean and coefficient of variation (CV) of month of collection. Significant differences (α = 0.05) for the AD tests are shaded.

We see a significant interaction term in the ANOVA, because the archaeological length data for six of the nine sites were larger on average than the modern fishery length data (Fig. 4, Table 2). The modern fishery data for the sites from Shemya Island, Kodiak Island, and Prince of Wales Island have a larger mean length, while the other sites show the opposite trend. However, we did not account for selectivity in these analyses, which leads to the conclusion that the data were either collected under different processes (e.g., selectivity, seasonal availability, etc.) or not drawn from a common distribution. Examining the collections side by side reveals a tendency for the modern fishery data at the majority of sites to include more small fish than the archaeological collections, which influences the mean length values (Fig. 4). It should be reiterated that regulations dictate that the onboard observers retain and measure all cod captured in the fishery, even those at smaller sizes and lesser economic value. Therefore, we expect the selectivity in the modern cod data presented here to skew more toward smaller fish than in those fisheries where retention of smaller, less valuable fish is not required. This selection is reflected in the comparisons here (Table 2).
When we limit the analyses just to the larger fish in the distributions, which should include only fish that are fully selected in both collections, the ANOVA tests reveal a significant (ɑ = 0.05) site effect but no significant collection effect (Fig. 5, Table 4). Anderson-Darling permutation tests of the larger fish suggest that modern fishery length data for five of the nine sites are drawn from the same distribution function as their corresponding archaeological data, while four are not (Table 3). These four sites (Adak, Amaknak, Sanak, and Little Takli/Mink Islands) do not correspond to the three sites identified in the full distribution analysis (Shemya, Kodiak, and Prince of Wales Islands). Examination of the inconsistent length distributions reveals that the reason for these differences are not the same for all four sites. The Adak Island modern fishery distribution has a higher proportion of large fish than the archaeological data, while for the Amaknak Island, Sanak Island, and Little Takli/Mink Island sites the opposite is true (Fig. 5). In the case of Prince of Wales Island, the archaeological sample size is small (n = 73), which results in low power in the statistical test. Although there is a possible difference for this site, it is not statistically significant at ɑ = 0.05.
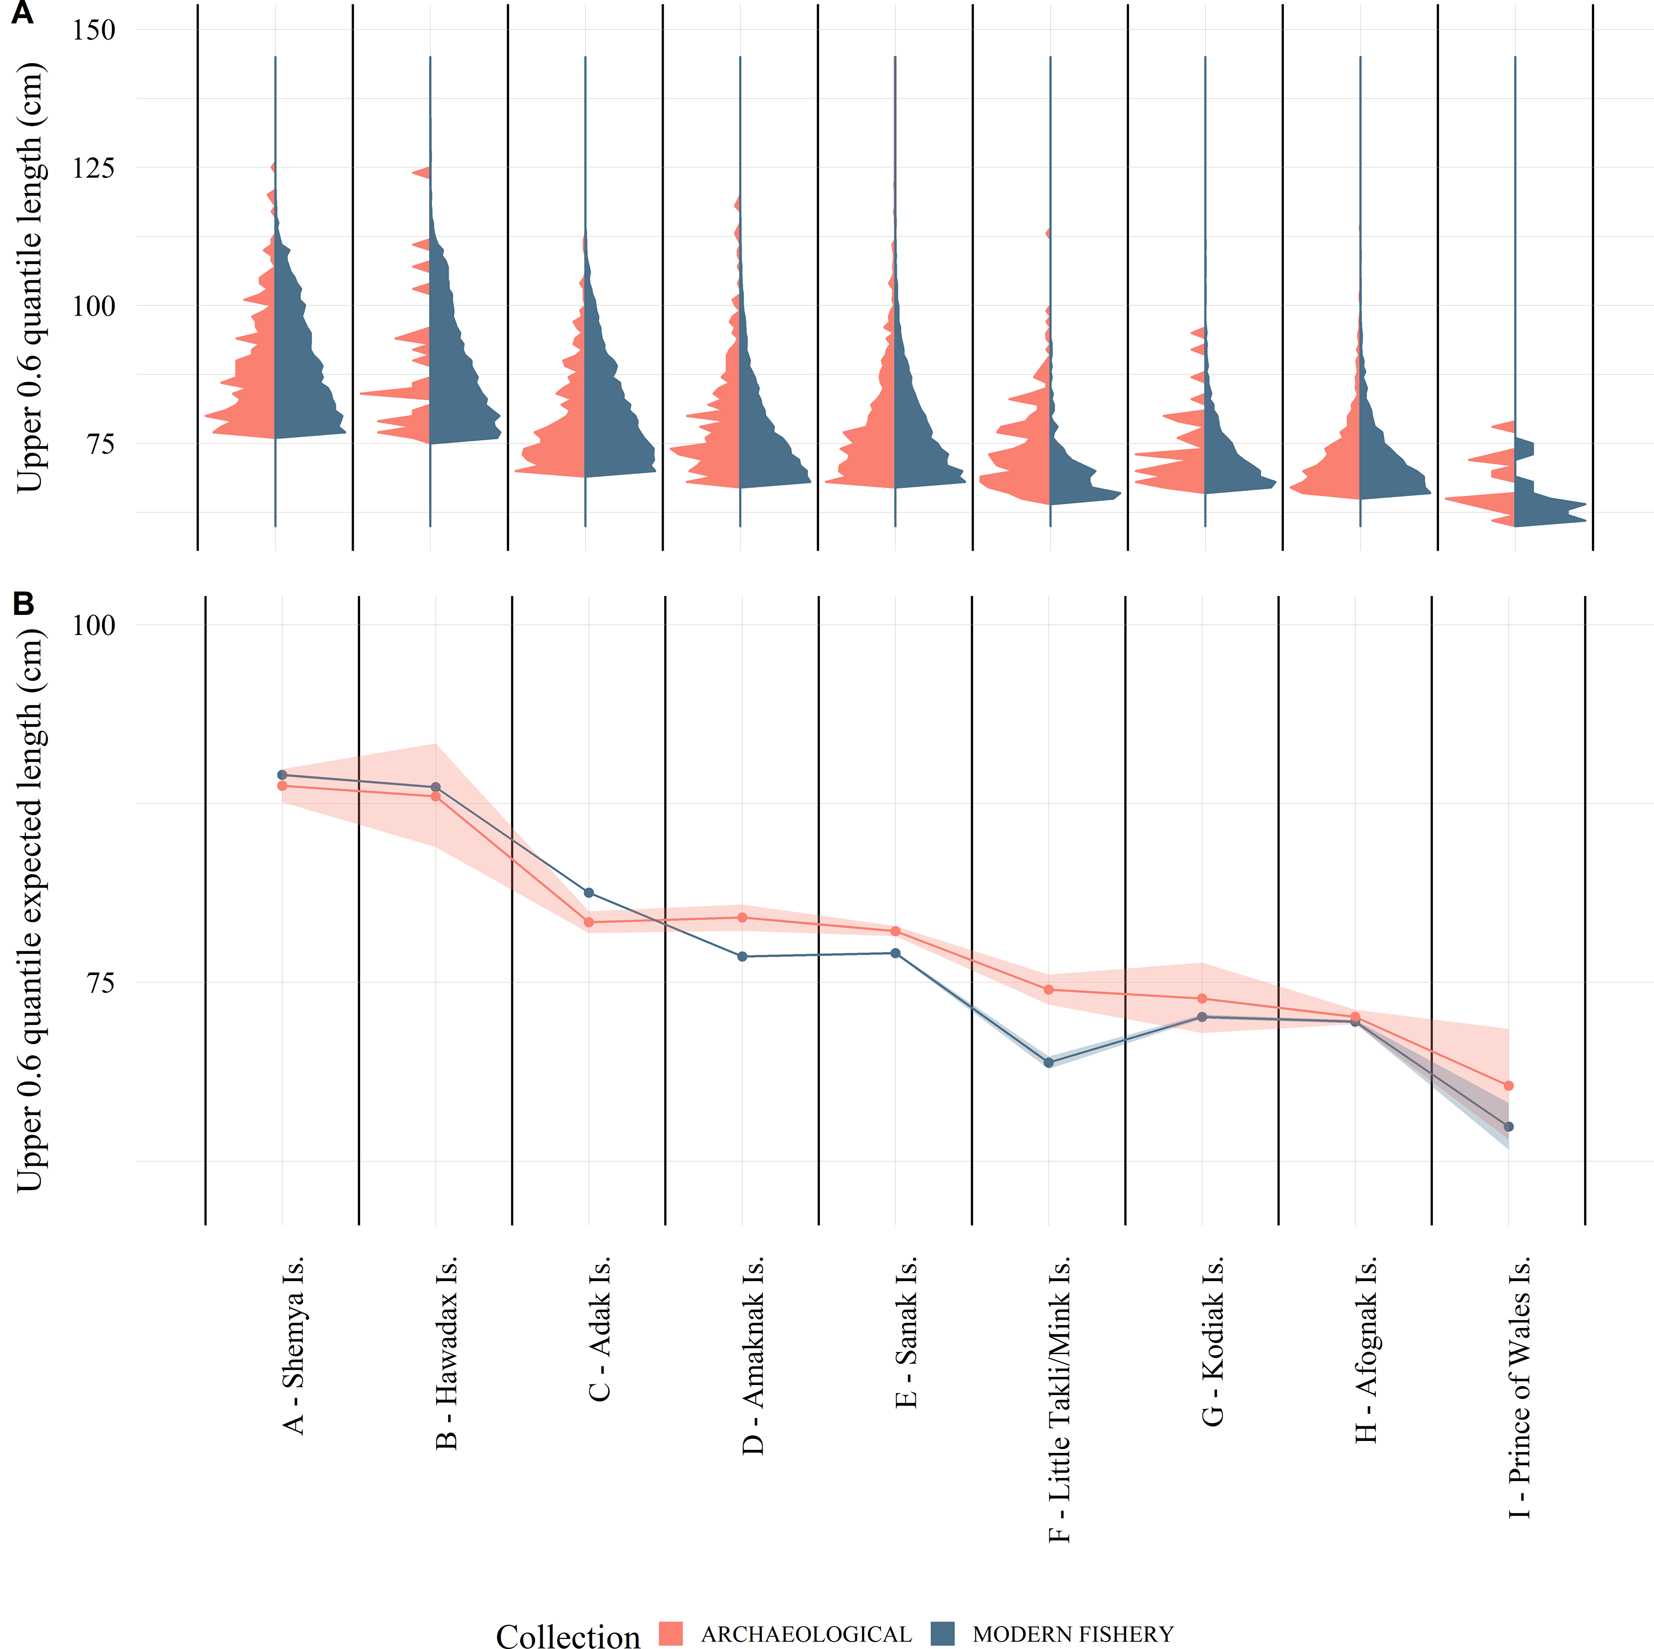
Figure 5. (A) The 0.6 quantile of the length distribution of Pacific cod from the Alaska archaeological collections (red) and modern longline and jig commercial fishery data (blue) within 50 km of the archaeological sites; and (B) log-linked gamma generalized linear regression results of Alaska modern fishery and archaeological collections by site showing expected lengths and 95% confidence intervals. These data show that the upper tail of the ancient and modern distributions are generally consistent and provide evidence to support a lack of truncation in the modern distributions.

DISCUSSION
When comparing the size distributions of the archaeological and modern data, there is variability in mean fish size between the two contexts. Comparison of the full size distributions of both data sets suggests this variability is driven by selectivity, specifically the inclusion of much smaller fish in the modern fishery that are missing from the ancient fisheries. As discussed earlier, we do not believe this is a taphonomic issue resulting from archaeological recovery bias, because other small fish taxa are present in these assemblages (Supplementary Table 1). Because we do not know the selectivity of the ancient fishery, it is difficult to say why smaller cod are absent from the archaeological assemblages. It is likely, however, that people were consciously choosing larger fish by engineering their gear (see earlier discussion and description in Ames and Maschner, Reference Ames and Maschner1999) or by retaining only large fish at the time of harvest.
Given that small fish seem to be driving the differences in the archaeological and modern fish distributions, it is more informative to limit our analyses to the largest fish in both the modern and ancient contexts. The analysis here demonstrates that the size distribution of the largest fish has been relatively consistent over this 6000 yr period in many areas, including Shemya and Hawadax Islands in the western Aleutians, Kodiak and Afognak Islands in the central Gulf of Alaska, and Prince of Wales Island in southeast Alaska. Cod size distribution from Adak Island in the western Aleutian Islands actually shows the modern fishery harvested a higher proportion of large fish than the ancient fisheries (Fig. 5). According to the Alaska Board of Fisheries, the fishery around Adak Island has been underutilized historically (Alaska Board of Fisheries, 2018), which may have influenced fish growth there. There are, however, three locations where fish were larger prehistorically than they are today: Amaknak Island, Sanak Island, and the Katmai coast (Little Takli and Mink Islands).
The historical record may shed light on these differences. Unfortunately, the scanty historical record for the Little Takli and Mink Islands fisheries does little to explain why we see a change in fish size here. On the other hand, the historical record from Sanak and Amaknak Islands provides more context: Sanak and Amaknak Islands were the initial center of the commercial cod fishery in the Gulf of Alaska and Bering Sea, and the fishery dates to the late nineteenth and early twentieth centuries. The early fishery was substantial and peaked in 1916 (Cobb, Reference Cobb1916; Alverson et al., Reference Alverson, Pruter and Ronholt1964). Catch in the Pacific cod fishery in this region dropped precipitously after the early twentieth century, and may have even collapsed by the 1940s (Opheim, Reference Opheim1994; Reedy, Reference Reedy2019; Mackovjak, Reference Mackovjak2020), and was not heavily exploited again until the 1980s (Barbeaux et al., Reference Barbeaux, Aydin, Fissel, Holsman, Palsson, Shotwell, Yang and Zador2019). Commercial fishery removals in this region steadily increased through the 1990s and 2000s. In the modern fishery, Amaknak and Sanak Islands show, by far, the highest concentration of nearby (within 200 km) fishery removals of all the Alaskan sites examined in this paper (Fig. 6). Given that the archaeological data in this region are derived from large samples over a long time frame, it is possible that the intensity of fishing in this region has had an influence on local fish size distributions, which is reflected in our comparison of ancient and modern data.
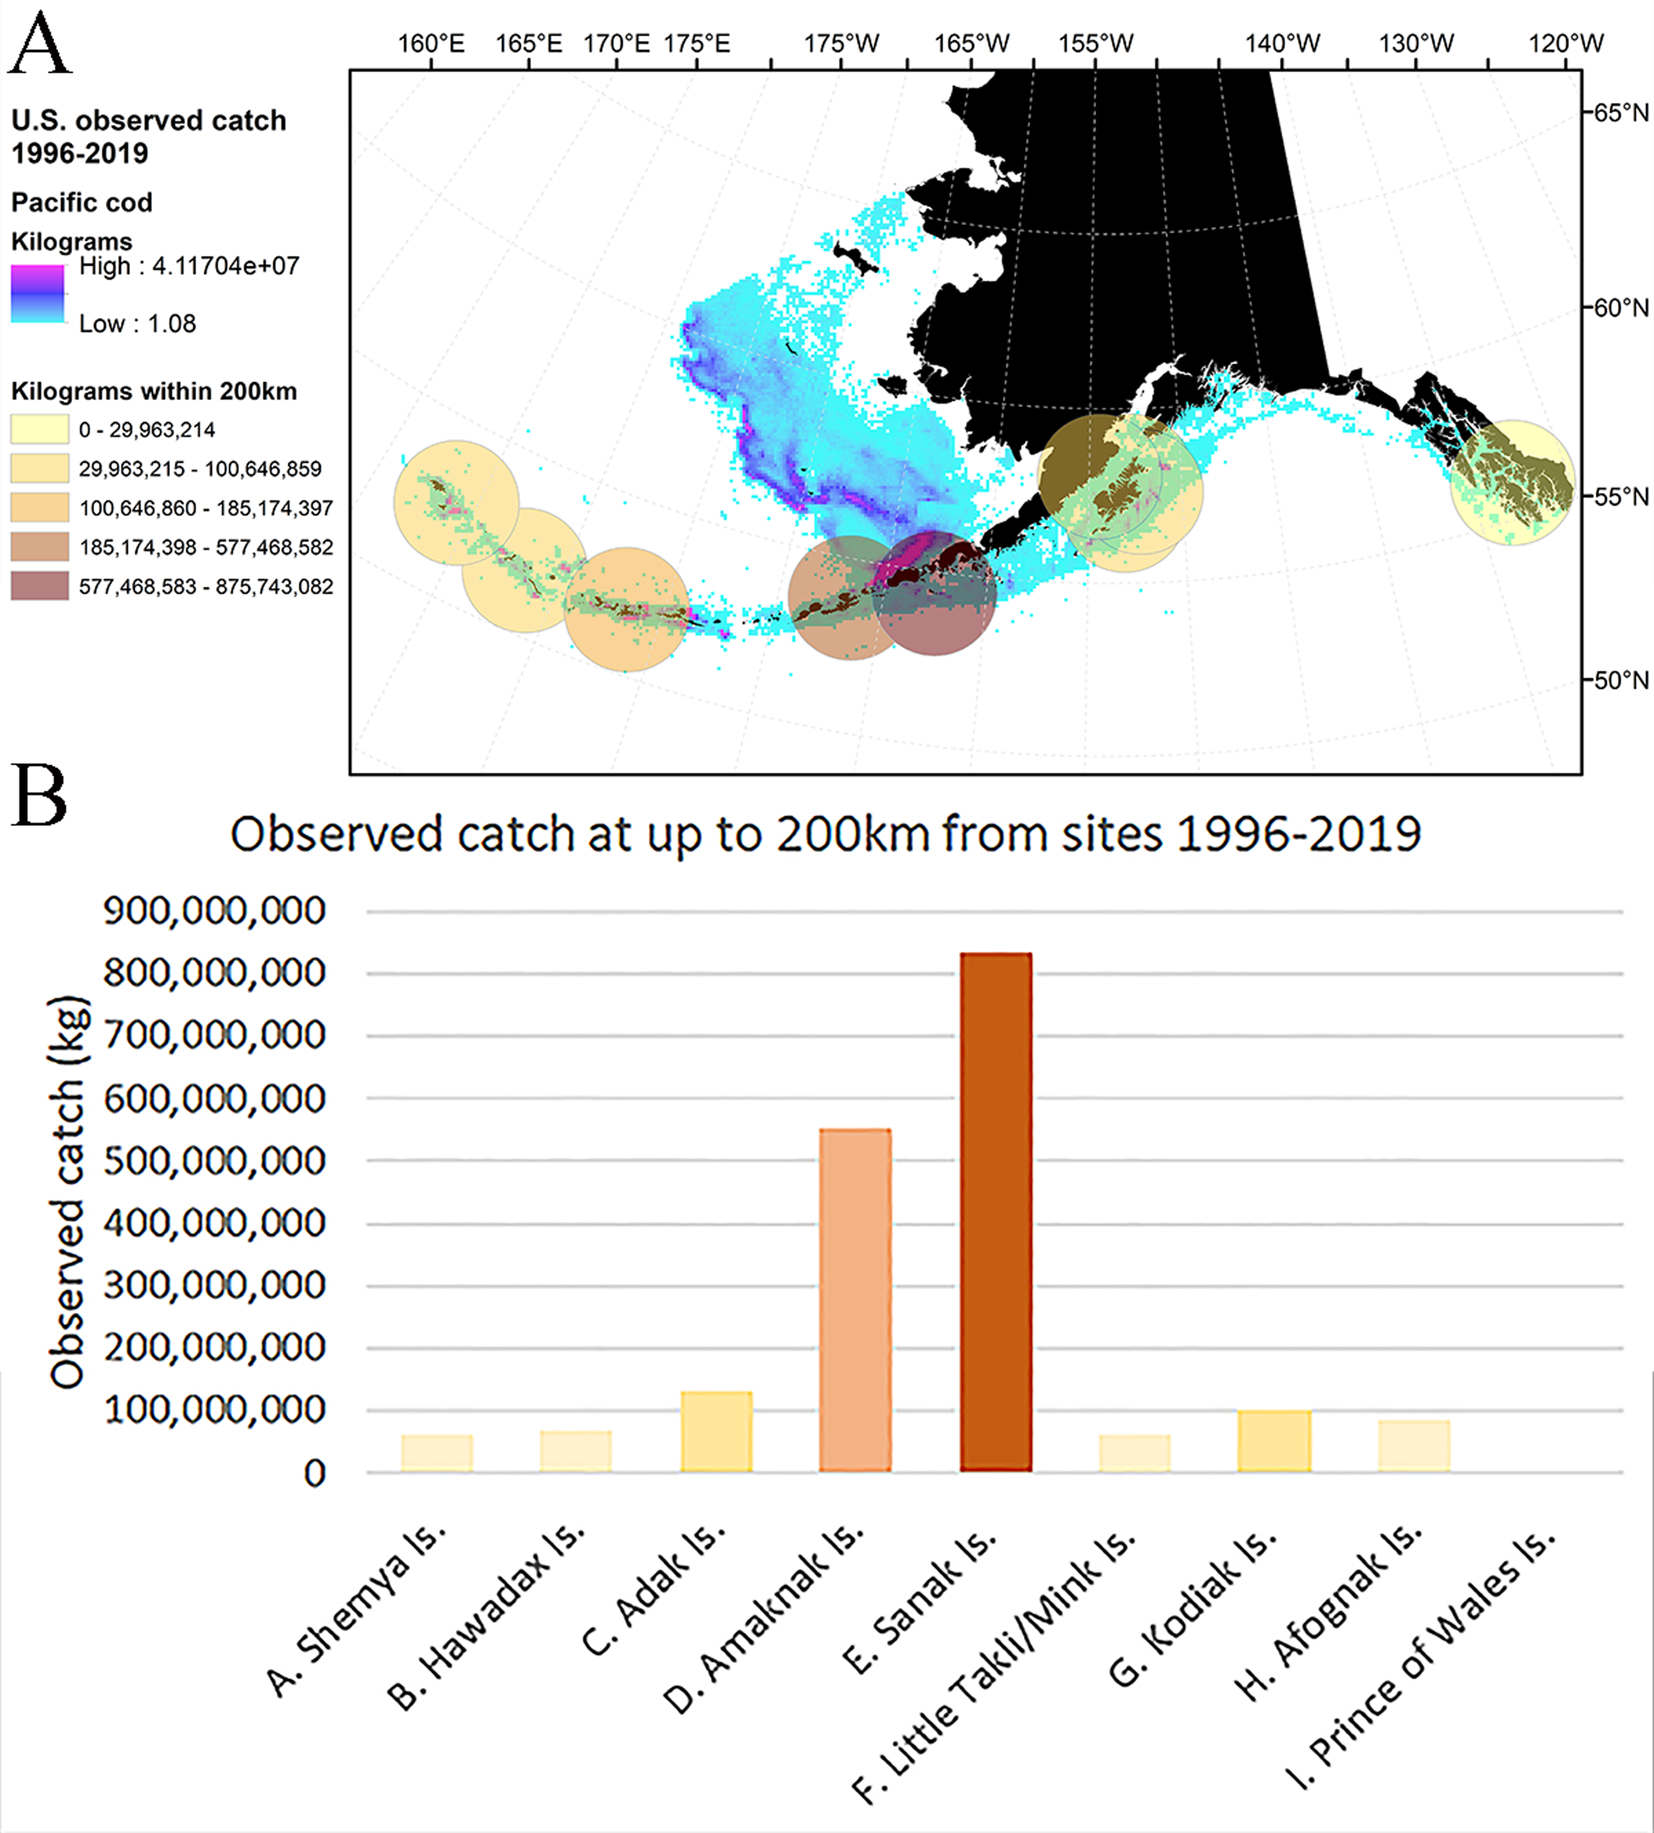
Figure 6. (A) Distribution and density of observed Pacific cod catch in the U.S. fisheries off Alaska for 1996 through 2019 with 200 km buffers around each of the archaeological sites colored to indicate concentration of catch (in kilograms); and (B) the sum of observed commercial Pacific cod catch within 200 km of each of the archaeological sites for 1996 through 2019. Note that not all catch is observed; however, the amount of catch in the Pacific cod fishery is proportional to the observed catch.
To examine whether long-term fishing activity has had an influence on local fish size distributions, we look at the archaeological record of these places in more detail. Using both regional and local data sets, we can examine the record for resource depression, or a decrease in cod size and relative abundance over a significantly longer time period. First, we look to the archaeological data set as a whole, using the number of identified specimens (NISP) to compare taxonomic relative abundances (Supplementary Table 1). Plotting both mean fork length and cod relative abundance for all of the archaeological sites over time suggests the following: Figure 7A does not show a clear pattern or continual decrease in cod size (FL) over 6000 yr, as expected, and Figure 7B does not show a clear relationship between time (cal yr BP) and cod relative abundance (%NISP). Furthermore, there is no statistical relationship between cod relative abundance and mean fork length across these data sets (R = 0.01, P = 0.09). However, we do note that we have significantly more data from the last 1000 yr and that these broad regional measures may gloss over both the regional differences in size that were discussed earlier and any temporal variability in local contexts.

Figure 7. (A) Mean cod fork length through time from all archaeological sites in this study and (B) cod relative abundance (%NISP) through time from all archaeological sites in this study. Ages are represented by the midpoint of calibrated radiocarbon dates at the 2-sigma range (Stuiver et al., Reference Stuiver, Reimer and Reimer2018). Data points are color coded to represent the different geographic regions represented by this study: orange, Kuril Islands; blue, western Aleutian Islands; red, Unimak Pass; green, Katmai coast and the Kodiak archipelago; purple, Prince of Wales Island. Shemya 2 (ATU-021) has not been included in these plots, because the site lacks taxonomic relative abundance data.
As described earlier, the Sanak Island, Katmai coast (Mink and Little Takli Islands), and Amaknak Island cod show a truncation of the largest fish in the modern samples. While Amaknak Island does not have a detailed diachronic archaeological record, careful examination of the archaeological data from Sanak Island and the Katmai coast is possible. As demonstrated in Supplementary Table 2, both of these archaeological data sets have lengthy and well-dated chronologies, as well as robust samples of measured cod bones in each dated component. Sanak Island cod have been discussed in two publications (Maschner et al., Reference Maschner, Betts, Reedy-Maschner and Trites2008; Betts et al., Reference Betts, Maschner, Clark, Moss and Cannon2011) in which the authors provide estimated length data and relative abundance data using well-established abundance indices. However, these abundance indices are limited to comparisons of cod with other individual fish species, which results in an inverse correlation between cod relative abundance and length (Betts et al., Reference Betts, Maschner, Clark, Moss and Cannon2011, p. 186). Here, we create a cod index that looks at the relative abundance of cod to all other fish species in each temporal period recorded on Sanak Island (Fig. 8). Using this index actually suggests a direct relationship between cod size and cod relative abundance: in periods when cod are more relatively abundant, they are also larger on average (R = 0.71, P < 0.01). On the other hand, the patterning is less clear for the Katmai coast sites (Fig. 8). When we combine data from the Mink Island and Little Takli Island sites (which are in very close geographic proximity), we observe that there is a mixed signal. Larger cod are found in components where cod are more relatively abundant between 4480 and 1600 cal yr BP, but after 1600 cal yr BP, an inverse relationship exists between cod size and relative abundance. The overall result is that there is not a strong graphical or statistical relationship between relative abundance and cod size (R < 0.01, P = 0.99) for the overall time series from the Katmai coast sites. Based on these data, we do not find a clear causal relationship between cod relative abundance and body size between sites. When looking at relative abundance alone, we do not see clear evidence for resource depression: while both regions suggest a possible peak in cod harvest between 3500 and 2500 cal yr BP, this peak is followed by fluctuations in cod relative abundance (Fig. 8). Maschner et al. (Reference Maschner, Betts, Reedy-Maschner and Trites2008) suggest this peak could be related to the cooler conditions of the Neoglacial phase, although examination of Figure 7B illustrates the variability seen in cod relative abundance through time and across space, which is difficult to link to specific climate conditions or weather patterns.

Figure 8. Comparison of the cod index (relative abundance of cod NISP to all fish NISP; open squares) and mean fork length (FL, black diamonds) through time for (A) the Sanak Island sites and (B) the Katmai coast sites (Little Takli and Mink Islands). Ages are represented by the midpoint of calibrated radiocarbon dates at the 2-sigma range (Stuiver et al., Reference Stuiver, Reimer and Reimer2018). See Supplementary Tables 1 and 4 for sample sizes.
While there is clearly some variability in fish size distribution across the region in the specific locations described, the North Pacific cod records contrast with the long-term patterns documented for Atlantic cod in the western North Atlantic, where resource depression has had a significant influence on cod populations across the region (Steneck, Reference Steneck, Wallace and Braasch1997; Rose, Reference Rose2004; Hambrecht, Reference Hambrecht, Feeley, Smiarowski, Hicks, Harrison, Brewington, Cesario and Gibbons2019). On a broad geographic scale, Atlantic cod have shown dramatic effects of overfishing and, more recently, strong responses to changing climate (Pershing et al., Reference Pershing, Alexander, Hernandez, Kerr, Le Bris, Mills and Nye2015). In comparison to the Pacific cod fishery, the commercial Atlantic cod fishery is much older, having begun as early as the eleventh century (Hutchinson et al., Reference Hutchinson, Culling, Orton, Hänfling, Handley, Hamilton-Dyer, O'Connell, Richards and Barrett2015), and archaeological data record cod fishing for thousands of years in the Gulf of Maine (Bourque et al., Reference Bourque, Johnson, Steneck, Rick and Erlandson2008). Biologically, Atlantic cod may live up to 25 yr, and this long-lived fish is therefore more vulnerable to harvest pressure than the shorter-lived Pacific cod. Combined, these factors appear to have resulted in very different fishing histories (Betts et al., Reference Betts, Maschner, Clark, Moss and Cannon2011).
There may be several reasons that we are not detecting a basin-wide size truncation, or loss of the largest cod, at many sites across the North Pacific: (1) human populations and harvest rates have not been large enough to depress the resource, so the resource has been used sustainably; (2) the resource is resilient to harvest pressure because of its biological and life-history characteristics, meaning it recovers quickly from disturbance; and (3) people have intentionally managed the resource to avoid overharvest. The complexity of the human–fish relationship is underscored by this last point, wherein sustainability is often conflated with intentional conservation (Smith and Wishnie, Reference Smith and Wishnie2000). Hunter-gatherer groups are known to conserve certain resources (Smith and Wishnie, Reference Smith and Wishnie2000), and archaeological, ethnohistoric, and ethnographic records point to Native management of some North Pacific fish resources. For example, McKechnie (Reference McKechnie2007) uses archaeological data to argue that the Vancouver Island rockfish (Sebastes spp.) fishery was sustainable for more than 1500 yr, and Campbell and Butler (Reference Campbell and Butler2010) provide ethnographic evidence for Pacific salmon management along the Northwest Coast. However, rockfish and salmon were usually harvested in circumscribed locations, meaning local populations were potentially vulnerable to overharvest or were capable of being managed. This is in contrast to the cod resource, which was generally harvested in larger bays and the open ocean, as described earlier. Both the distribution of this fish and how the population responds to fishing suggest that it may not have required careful management to maintain a sustainable fishery, with people and fish coexisting across this massive ocean basin for thousands of years. Unfortunately, while anthropologist Craig MishlerFootnote 3 notes that Native people have concerns about fish management in a contemporary and commercial context, traditional knowledge about ancient Alutiiq and Unangan fish management is extremely limited, and very little is known about how people may have approached different fisheries in the past. With the advent of the commercial fishery in the mid-nineteenth century and the growth of the commercial fishing industry into the twenty-first century, we have seen management decisions that allow for continued, sustainable use of this productive resource in many places.
Despite the broad trends illustrated by this data set, the archaeological record of fish use may be complicated by a number of factors. These include sample size effects, seasonality, technological change, specialized site function, changing environmental conditions, fishing location and fish behavior, and human decision making. While we acknowledge these potentially complicating factors, we see time averaging as the greatest challenge to our comparison with modern data. As described in our “Materials and Methods” section, we have combined time periods for the purposes of this study to provide a broad understanding of the cumulative record of human harvesting activity (e.g., McKechnie and Moss, Reference McKechnie and Moss2016). However, at the individual-site level, archaeological middens represent a series of discrete dumping events that can be very difficult to decipher. Therefore, archaeological samples necessarily average time by compressing seasons and broader cyclical environmental changes into single deposits (Stein, Reference Stein1992). For example, as described earlier, the modern cod size data suggest that access to cod of different sizes is strongly seasonal. However, if prehistoric fishing happened over multiple seasons at one site, then seasonal fishing activity and the related length-frequency data are likely to be compressed into a single deposit. Similarly, decadal or centennial changes in climate, productivity, or fish populations may have been conflated, because deposits typically contain hundreds of years’ worth of accumulated material, as we see in the Sanak Island and Katmai coast examples. As described earlier, the literature suggests that cod are subject to the “Goldilocks effect”: they are highly sensitive to temperature changes, with egg viability, recruitment, and growth all being optimized within a narrow temperature range. This suggests that, given the time-averaging nature of most archaeological samples of cod bones, the interaction between changes in population abundance and variability in distribution/availability would be combined in a single deposit. This problem can be addressed by excavating in tremendous detail (e.g., Stein, Reference Stein2000), by producing a large number of radiocarbon dates (e.g., Maschner et al., Reference Maschner, Betts, Cornell, Dunne, Finney, Huntly, Jordan and King2009), or by reconstructing season of harvest profiles (e.g., Hufthammer et al., Reference Hufthammer, Hoie, Folkvord, Geffen, Andersson and Ninnemann2010); however, these options are beyond the scope of most projects, and the assemblages used for this study represent up to hundreds or thousands of years of time (Supplementary Table 2).
CONCLUSIONS
The goal of this research has been to examine cod size distributions across space and between two vastly disparate time periods in the North Pacific. We compare data from ancient and commercial fisheries from the northern Kuril Islands through the Aleutian Islands to southeast Alaska to test whether there is truncation in fish length through time or loss of the largest fish from the fishery. The results suggest three major trends: first, the archaeological skeletal remains overall reflect the geographic variability in fish size seen in the modern fishery from the Kuril Islands to southeast Alaska, with the largest fish found in the western and central Aleutians in both contexts. This suggests that this pattern has been in existence for at least 6000 yr. Second, where modern fishery efforts have been relatively light, length distributions for the fully selected larger fish do not show evidence of truncation over the 6000 yr period represented by the archaeological and modern data sets. Third, where modern fishing has been the most intense, particularly around Amaknak and Sanak Islands, there is evidence indicating truncation of the length distributions, with fewer large fish in the modern populations than in the archaeological assemblages.
The overall results suggest that looking at fish size distributions is more informative than just reporting central tendencies, because the distributions show in detail that the largest fish are still being caught in most places across the region. From an archaeological perspective, these data reveal important long-term trends in fish size, but also underscore how critical it is to understand the nuances of local fishing activity. Variability in fish size may reflect taphonomic conditions, site formation processes, fishing location, season of harvest, the gear type used, or broader climate changes, all of which must be considered at the local level to understand the fishery in detail. From a management perspective, these results are significant: the climate conditions of the twenty-first century are unprecedented on a historic scale, and fish are responding unpredictably (e.g., Pershing et al., Reference Pershing, Alexander, Hernandez, Kerr, Le Bris, Mills and Nye2015). Similar to the Atlantic cod fishery, there have been declines in Pacific cod populations across the BS, AI, and GOA in recent years (Barbeaux et al., Reference Barbeaux, Aydin, Fissel, Holsman, Palsson, Shotwell, Yang and Zador2019, Thompson et al., Reference Thompson, Spies and Palsson2019a, Reference Thompson and Thorson2019b), and dramatic heat waves are blamed for shrinking year-classes (Schmidt et al., Reference Schmidt, Bograd, Arrizabalaga, Azevedo, Barbeaux, Barth and Boyer2019; Laurel and Rogers, Reference Laurel and Rogers2020). Because these conditions are predicted to persist, the perspective provided from the long-term archaeological record is now critical. In the face of extreme and abrupt warming climate conditions, cod populations may not be as resilient as previously assumed, and the integration of climate and harvesting signals over this long time period will now be essential to understanding how fish will respond.
ACKNOWLEDGMENTS
Thanks to Trevor Orchard, Jennifer Cahalan, Meaghan Bryan, and two anonymous reviewers, whose thoughtful and careful reviews greatly improved our work. This article pools data from a wide range of published and unpublished sources. Thank you to the North Pacific groundfish observers for their work in collecting the modern fisheries length data. Trevor Orchard provided unpublished size estimates for individual specimens that were the basis of his analysis of Aleutian cod. Likewise, Madonna Moss provided unpublished size estimates for individual specimens that were the basis of her analysis of cod from Coffman Cove. Herb Maschner and Nancy Huntly provided unpublished size estimates for individual specimens, as well as unpublished relative abundance data for cod and other fish taxa analyzed as part of the Sanak Biocomplexity Project. Rhea Hood provided unpublished size estimates based on her analysis of the Little Takli Island cod. Bob Kopperl provided raw measurements for individual specimens from his dissertation research on Kodiak fisheries. Susan Crockford and Iain McKechnie provided the raw data for the Amaknak Bridge site. Ilyas Mukhametov (SakhNIRO) provided data extracted from an unpublished report for the Kuril Islands.
SUPPLEMENTARY MATERIAL
The supplementary material for this article can be found at https://doi.org/10.1017/qua.2020.70


