


INTRODUCTION
Secondary calcite crystals that form within a host sand are called sand calcites. They were first described in the Fontainebleau area of the Paris Basin (France) by Lassone (Reference Lassone1775). Sand calcites have long been a mineralogical curiosity, as evidenced by the popularity of gem-quality samples. General information about sand calcite crystals in the Fontainebleau Sand and elsewhere in the world is available on the World Wide Web (Löffler, Reference Löffler1999, Reference Löffler2012). In addition to descriptions by the early naturalists (Lassone, Reference Lassone1775; Cuvier and Brongniart, Reference Cuvier and Brongniart1811; Delesse, Reference Delesse1853), the only scientific work devoted to sand calcites was the establishment of their mineralogical and crystallographic characteristics by Lacroix (Reference Lacroix1901).
Sand calcites with similar crystal forms to the original Calcite de Fontainebleau type (inverse rhombohedron) are known in sands infilling paleo-karst in SW France (Lacroix, Reference Lacroix1901; Löffler, Reference Löffler1999), in SE France (Mindat, Reference Mindat2016), and in Triassic sandstones from the eastern parts of the Paris Basin (van Werveke, Reference van Werveke1888). Several examples are known in Germany, the most “well-known” being in Cretaceous sands infilling a paleo-karst feature in Devonian limestone at Lange Riecke in Brilon (Dechen, Reference Dechen1856; Lottner, Reference Lottner1863; Delkeskamp, Reference Delkeskamp1903; Löffler, Reference Löffler2011). In addition, sand calcite crystals and concretions have been found in Poland, Austria, Hungary, and Romania (Löffler, Reference Löffler2012; Mindat, Reference Mindat2016). In the United States, sand calcite crystals in a deposit in California (Rogers and Reed, Reference Rogers and Reed1926; Harrison, Reference Harrison1969) and poikilitic calcite crystals from the Rolling Plains soils of Texas (Drees and Wilding, Reference Drees and Wilding1987) have habits similar to those in the Paris Basin, whereas specimens from Utah differ by their hexagonal scalenohedron crystal forms (Sargent and Zeller, Reference Sargent and Zeller1984). In Morocco, sand calcite concretions and crystals found at the foot of the Atlas Mountains and those from Taouz are quite similar to specimens in the Fontainebleau Sand (Löffler, Reference Löffler2012). Centimetric concretions with rhombohedral crystals occur also in infra-Cenomanian sandstone in the Boudenib area of Morocco (MT, personal observation, 1988).
Information about all these sand calcite occurrences is largely restricted to field descriptions. However, our own observations in the Fontainebleau Sand of the Paris Basin suggest that the nature and distribution of sand calcites is related to weathering processes in the regolith (e.g., as evidenced by bleaching and silica cementation; Thiry et al., Reference Thiry, Bertrand-Ayrault and Grisoni1988, Reference Thiry, Liron, Dubreucq and Polton2017). Because sand calcite formation may result from interactions between meteoric water and the host sand, their geochemistry should record aspects of past climate and environmental conditions. They therefore have the potential to serve as a novel paleoclimate archive.
To investigate this possibility, we used an array of field, microscopic, and geochemical observations (X-ray diffraction, radiometric, and stable isotope analyses) to examine samples from the Paris Basin. First, we describe the geologic setting and our methodology. Then we present the results and discuss sand calcite occurrence and mineralogy, their distribution through time, and the relationship between stable isotope composition (δ13C and δ18O) and environmental processes. We then develop a model for the conditions of formation of sand calcites, interpret our data in the context of previous paleoclimate studies, and discuss the implications for using sand calcites to reconstruct past climate and environmental conditions.
GEOLOGIC SETTING
The Tertiary formations of the Paris Basin have never been buried by more than 200 m of overburden (Cavelier et al., Reference Cavelier, Mégnien, Pomerol and Rat1980). Geomorphologically, they form stacked structural plateaus from north to south and are armored by limestone formations, forming cuestas (Fig. 1A and B). These structural platforms were exposed during the Pliocene through a combination of epeirogenic uplift and successive falls in sea level forcing river incision during glacial periods (Cojan et al., Reference Cojan, Brulhet, Corbonnois, Devos, Gargani, Harmand and Jaillet2007). Sand calcites occur in all Tertiary sand formations in the Paris Basin.

Figure 1. (color online) Geological setting of sand calcite occurrences in the Paris Basin. (A) Geologic map of the Paris Basin with location of the studied sand calcite occurrences. (B) Cross section (along the X–Y line marked on map A) through the superimposed limestone plateaus capping sand formations. (C) Cross-sectional sketch depicting geomorphology of the Fontainebleau-Nemours area with location of the main sand calcite occurrences. Section is somewhat distorted to incorporate main sites.
The Fontainebleau-Nemours area is the reference location for the present study because of the great abundance of sand calcites. These occur mainly in the Fontainebleau Sand, which is early Oligocene in age and sandwiched between upper Eocene and Miocene lacustrine limestones. The sand forms a 50-m-thick unit on the northern scarp of the Beauce plateau and contains discontinuous and superimposed quartzitic sandstone horizons that dip and lens out to the south (Fig. 1C). Both unconsolidated sands and quartzitic pans crop out in the northern parts of the Fontainebleau area, whereas in the south they are mainly hidden by limestone cover and crop out only along valley sides.
Sand calcites occur at relatively shallow depths (less than 10 m below the nearby actual plateau) in profiles in the northern Fontainebleau area, whereas in the southern Nemours area they are found at depths up to 50 m below the plateau surface (Fig. 1C). Thus, opportunities for collecting samples are much greater in the Fontainebleau area, where sand crystals are widely found, but considerably poorer in the Nemours area, where access to the sand profile is only possible in valleys and currently operating deep sand pits. It is possible that sand calcites occurred above the plateau in the northern area but have been eroded and lost as the plateau was subsequently lowered and the scarp retreated (Cholley, Reference Cholley1960).
The current hydrology of the area is characterized by an aquifer contained within the Fontainebleau Sand and overlying Miocene limestone in the south (Fig. 1C). Discharge occurs to the north at the foot of the main scarps in the Fontainebleau Sand in the valleys of the Loing and Seine Rivers (Thiry et al., Reference Thiry, Liron, Dubreucq and Polton2017).
STUDY METHODS
Sand calcites were mostly collected from sand pits and stone quarries, but a few were collected from natural outcrops. The depth at which sand calcites formed is assumed to be the depth of their occurrence beneath the modern plateau surface, as schematized in Figure 1C, presuming that erosion was low in the southern area but higher in the northern area at the escarpment front (due to epeirogenic uplift) where some of the sand calcites may have been lost. All sand calcite samples selected for analysis were thin-sectioned and screened by optical microscopy to ensure that they were devoid of primary sedimentary carbonate and to ensure that there were no successive precipitation or dissolution phases. Morphological and physical observations were used as qualitative geochronometers. A relative age of subsamples was assigned on the basis that the internal part of a sand calcite crystal or aggregate precipitated earlier than its outer rim, and that a sand calcite crystal aggregate that included or covered another was younger than the included or covered one. It was assumed that each crystal within an aggregate recorded a single precipitation event. Subsamples of specific forms were extracted using a 5 mm drilling tool (Dremel type) for more detailed analyses. All analyses were undertaken on freshly broken subsamples of about 2–3 g, ground in an agate mortar and then quartered.
X-ray diffraction analyses (XRD) of bulk powdered samples were performed at the Center of Geosciences–MINES ParisTech using a PANalytical X'Pert Pro MPD diffractometer with CuKα radiation (40 kV, 30 mA) over a diffraction angle range of 2°–60° (2-theta) to best characterize the calcite. Ca/Mg compositions were determined using a chart of linear diffraction line displacement between calcite and magnesite. The abundance of calcite in sand calcites was determined using Bruker DIFFRAC.SUITE EVA software. A comparison with the abundances derived from calcimetry by gas volumetry following acetic acid dissolution (Vatan, Reference Vatan1967) showed a good agreement (within ±5%) between the two methods.
The carbon and oxygen isotope compositions of sand calcites were measured to provide insights into their environment of formation. Sixty-four sand calcite samples were analyzed at the Center of Geosciences–MINES ParisTech on an IsoPrime 100 dual-inlet mass spectrometer coupled with an IsoPrime multicarb acidification device. The reference sample was IAEA CO-1 (δ13C = 2.4‰ VPDB; δ18O = −2.4‰ VPDB). Digestion by phosphoric acid was undertaken at 90°C to ensure rapid total dissolution of carbonates and best replicated carbonate/CO2 isotopic fractionation. The reproducibility of the measurements (standard deviation) was ±0.04‰ for δ13C and ±0.08‰ for δ18O. All analyses were made in triplicate on bulk powdered samples, and the results are expressed in per mille (‰) relative to the VPDB standard.
We used radiometric dating to test whether sand calcites were penecontemporaneous with the host sediment or had formed from late Pleistocene weathering processes. We initially screened samples with 14C analyses to find the youngest samples. We additionally dated samples via U-Th analyses if they had had no significant 14C activity. Radiocarbon dating of four bulk samples of sand calcites was undertaken at the Australian National University (ANU in the Radiocarbon laboratories list) during the 1980s. A further 16 samples were dated during the 2000s at the Poznan Radiocarbon Laboratory (Poz in the Radiocarbon laboratories list) according to the analytical procedure described by Goslar et al. (Reference Goslar, Czernik and Goslar2004).
A suite of 19 samples and subsamples was analyzed for U-Th dating at the isotope geochemistry laboratory of BRGM in Orléans. Sand calcites were screened for the presence of primary calcite and, if free, dissolved in dilute HCl to avoid leaching detrital minerals potentially present in some samples. Subsequently, U and Th were separated chemically and analyzed on a Neptune multicollector ICP-MS mass spectrometer. Details of chemical separation and mass spectrometry measurements can be found in Innocent et al. (Reference Innocent, Fléhoc and Lemeille2005) and Millot et al. (Reference Millot, Guerrot, Innocent, Négrel and Sanjuan2011). Pure calcite crystals with high U/Th ratios could be dated individually. Sand calcite crystals with initial Th bound to sand grains from the host formation were dated using the isochron method (see Supplementary File 1, Supplementary Fig. 1).
FIELD OCCURRENCE AND MINERALOGY
Forms and varieties of sand calcites
Several forms of sand calcites are now recognized in the Paris Basin, including crystals and crystal aggregates, spheroliths, and concretions. However, their mutual relationships have never been documented, and some forms, such as spheroliths, have never been described, although one early publication (Lassone, Reference Lassone1777) recognized that rhombohedral crystals and spheroliths were in fact the same form of sand calcite. Parts of our descriptions were previously presented for a local naturalist association (Thiry, Reference Thiry2016); this study expands on that work with new data and a complete discussion of the results.
The sand calcites are characterized by their intimate association with the host formation and the inclusion of its framework sand grains. In the Fontainebleau Sand, sand calcites occur mainly as large euhedral crystals (sand calcite crystals) or as spheroliths (sand calcite spheroliths) (Thiry, Reference Thiry2016). However, there are several combinations of these two endmember forms as well as some additional varieties. In this paper, “sand calcite” is the generic term for all varieties including crystals, spheroliths and concretions.
Crystals from the Paris Basin, especially the Fontainebleau Calcites, have an inverse rhombohedron form (Fig. 2A), which is (022¯1) in the Miller/Bravais indexing system (Lacroix, Reference Lacroix1901). They sometimes occur as single rhombohedrons but usually consist of interpenetrating well-defined euhedral rhombohedra (varying in size from a few millimeters to several centimeters) grouped together in so-called crystallaria (decimeter size). Perfect acute crystals may have slightly divergent axes resulting in “cockscomb” and sheaf arrangements (Fig. 2B) or they can be randomly intergrown. Large crystal faces are sometimes covered by smaller crystals.

Figure 2. (color online) Sand calcite forms. (A) Inverse rhombohedron, the characteristic habit of the Fontainebleau Calcites. (B) Large rhombohedra (in situ, Fontainebleau, Grotte aux Cristaux). (C) Coalescent spheroliths (Fontainebleau, Roche à Boule). (D) Spheroliths with surface studded with acute tips of calcite rhombohedra (arrows) (Fontainebleau, Rocher Carrosse). (E) Concretion including a crystallarium with tips of rhombohedra. Arrangement and elongation of successive concretions point to water flow direction during calcite precipitation (arrow) (Larchant, Gondonnières). (F) Translucent crystals (Larchant, Gondonnières), dated sample 8787. Figure (A) modified from fig. 17 in Lacroix (Reference Lacroix1901, vol. 3, p. 429) and Fig. (E) modified from fig. 2F in Thiry (Reference Thiry2016).
Spheroliths varying from millimeter to decimeter size (Fig. 2C) are common. They can occur as isolated structures or together with calcite crystallaria and can also be coalesced to form larger spheroliths. Small, centimeter-sized spheroliths generally have no distinct crystalline structure, but larger spheroliths (2–5 cm in diameter) are often studded with the acute tips of calcite rhombohedra on their surfaces (Fig. 2D). There is a continuum between spheroliths showing the tips of rhombohedra on their surfaces and crystallaria composed of euhedral individual crystals.
Concretions are formed of bulbous sandy calcareous structures that may overlap and can reach decimeter- to meter-sized, multilobed masses (Fig. 2E). Their morphology is similar to the “puppets” described in loess soils (Schoeneberger et al., Reference Schoeneberger, Wysocki, Benham and Broderson1998). They often encapsulate calcite crystallaria.
Translucent crystals are centimeter-sized euhedral calcite crystals of inverse rhombohedron form (Fig. 2F). They are devoid of sand grain inclusions and occur in dissolution features within limestone or fossiliferous horizons. While they do not include sand grains, translucent crystals have similar crystal forms to sand calcite crystals (inverse rhombohedron), and they are clearly secondary features and formed in close association with other types of sand calcite.
Field occurrence
Northerly Fontainebleau area
Sand calcite spheroliths in the Fontainebleau area form meter- to decameter-sized pillars of calcareous sandstone near the top of the sand formation, close to the limestone cover (Fig. 3). This array is best seen in outcrops in the Cuvier-Chatillon Road thalweg (Fontainebleau Forest, parcel 81) where there are a dozen pillars of about 2–10 m in diameter. In detail, the calcareous sandstone masses have a nodular appearance formed by the coalescence of individual spheroliths that range from 4 to 10 cm in diameter and often have a zoned internal structure. The pillars extend downward into the unconsolidated sand and do not show any dissolution features at their margins, suggesting that they formed in a vertical porous structure isolated from the surrounding sand at time of their formation. To the NW, clumps of sand calcite spheroliths intersect the limestone cover, fill pits in the quartzitic sandstone pan, and penetrate at least 2 m down into the underlying unconsolidated sand (Fig. 3). Where the lower part of the pillars is visible, spheroliths are less well cemented, and in places individual spheroliths appear to be “floating” in unconsolidated sand. Locally, equant-sized spheroliths can be aligned along secondary-cemented, millimeter-thick, white calcareous sandstone strips that mimic cross-stratification (see Supplementary File 2 for additional sample description).
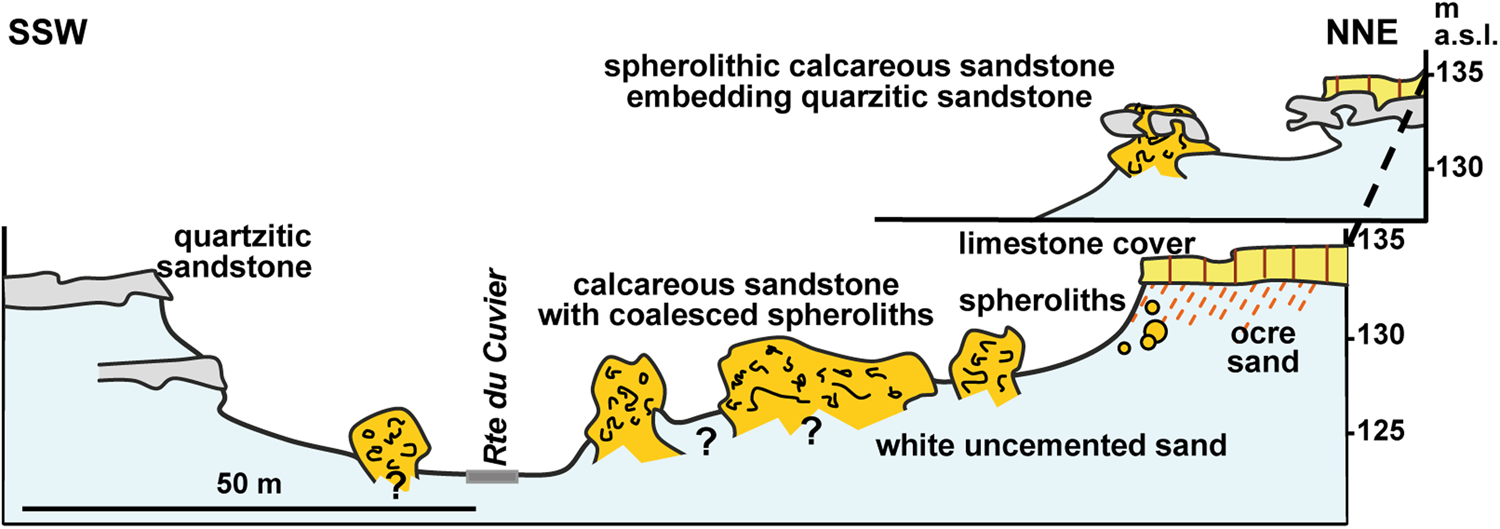
Figure 3. (color online) Schematic section showing the arrangement of spherolithic calcareous sandstone masses (Fontainebleau, Cuvier Chatillon Road thalweg). Calcite spheroliths form meter- to decameter-sized pillars standing in unconsolidated sand with no dissolution features at their margins, suggesting that they formed in a distinct, confined porous environment isolated from its surroundings at that time. Note that calcareous sandstone engulfs quartzitic sandstone pans, indicating that in this particular site the cementation of the quartzite preceded the development of the sand calcites. Modified from fig. 7 in Thiry (Reference Thiry2016).
Southerly Nemours area
Sand calcite crystals in the Gondonnières sand pit (which no longer exists) in the Larchant area occurred together with concretions in a particular horizon in a quarry face over a distance of about 100 m (Fig. 4): we estimate that several tons of sand crystals were recovered from here by collectors during the 1990s. The occurrence of some sand calcites in a 1.5-m-thick horizon about 2–3 m above the pit floor was more or less related to a fossil-bearing coarse sand horizon. The sand calcites were white to yellowish in color, similar in color to the host sand, and had several morphological forms (see Supplementary File 2 for additional sample description).

Figure 4. (color online) Sketch of the distribution of sand calcites in the Gondonnières sand pit (Larchant). The sand is bleached throughout the entire profile. A wide variety of sand calcites were linked to a weakly inclined fossil-bearing sand horizon that was mined out. The mining operation revealed an increasing sand calcite crystal size away from the fossil-bearing horizon, suggesting an evolution of calcite precipitation along a water flow path from this fossiliferous level toward the water table. Modified from fig. 14 in Thiry (Reference Thiry2016).
Subcontinuous slabs of coalescent crystallaria up to 4–8 cm thick and composed of rhombohedra with 2–4 cm edges and apical spikes occurred below the current pit floor about 1 m above the present-day water table. The largest rhombohedra were generally arrayed around the periphery of the crystallaria, while those at the base were generally smaller and more randomly arranged. Successive generations of crystallaria, recognized on basis of their spatial arrangement (mutual embedding and enclosure), generally differ in crystal size. Smaller crystallaria, 5–10 cm in diameter, have a spiky outer surface due to the pointed tips of embedded rhombohedra and were scattered throughout a relatively well-defined 1-m-thick sand unit below the fossil horizon. Concretions, some incorporating crystallaria, were restricted to the neighborhood of the fossil-bearing calcareous horizon. Masses formed by the amalgamation of several concretions were plentiful immediately below the fossil horizon (Fig. 2E). Concretions 5–10 cm in diameter reached 30–40 cm or even >1 m in length. The uppermost quartzitic pan was covered by millimeter-sized sand calcite spheroliths, particularly on slightly sloping surfaces but never on steeper surfaces.
Translucent euhedral crystals of inverse rhombohedral form (Fig. 2F), devoid of sand grains, amber colored, and <1 cm in size, occurred within the fossil-bearing sand unit as linings on dissolution voids and casts inside fossil shells. The fossiliferous sand unit was composed of masses of crystalline limestone with casts of shell fragments, indicating that the original calcareous sediment had dissolved and recrystallized. The translucent crystals do not exhibit any dissolution features, indicating that they precipitated after the fossiliferous sand unit was dissolved and recrystallized (see Supplementary File 2 for additional sample description).
Mineralogy
Sand calcites contain an average of 30% calcite. Given that the depositional intergranular volume (i.e., porosity) of sands texturally similar to the Fontainebleau Sand would typically be in the range of 30%–35%, the residual porosity could be filled by secondary calcite without major alteration. According to XRD analysis, calcite in the various forms of sand calcite is composed of pure calcium carbonate without any Mg substitution.
Petrographic examination of thin sections indicates that sand calcite crystals have a poikilitic texture characterized by large calcite crystals encapsulating quartz grains of the host sand (Fig. 5A). Euhedral rhombohedral crystals are occasionally developed in the porosity between the large crystals (Fig. 5B). The larger sand calcites are formed of single calcite crystals, some several centimeters in size. The calcite is never twinned and is always very clear with no visible fluid/solid inclusions. Sand calcite spheroliths are formed of individual calcite crystals, each embedding only two or three quartz grains. The centers of spheroliths show clear elongated sheaf arrangements, corresponding to the radial growth of calcite crystals, and have larger crystals toward the outer edges. Sand calcite crystallaria are devoid of porosity, whereas sand calcite spheroliths often display some residual porosity, especially in samples composed of the smallest crystals.

Figure 5. (color online) Thin sections of sand calcite crystallaria. (A) large poikilitic calcite crystals with included detrital quartz grains (Grande Garenne, Darvault), dated sample number 8931. (B) subeuhedral inverse rhombohedrons within spar cement in poikilitic crystal (Gondonnières, Larchant, 77), dated sample number 8940. Q, quartz; C1, C2, C3, individual calcite crystals of different orientation. Crossed Nicols.
GEOCHEMISTRY RESULTS
Radiometric age determination
The 14C and U-Th analyses of a total of 24 sand calcites from Tertiary sand units from various localities in the Paris Basin yielded Pleistocene ages (Table 1). None are pre-Pleistocene in age, but all samples are very young, and almost all date from the latest Pleistocene, more precisely centered on the Weichselian cold phase (Pleniglacial). The relative scarcity of somewhat older samples (in the range of 200–400 ka) is remarkable, and this could potentially be an artifact of sampling bias. For example, younger sand calcites occur in numerous sites and are accessible at relatively shallow depths in the northerly Fontainebleau area, whereas older samples (three samples, plus a Poligny sample that failed to provide any U-Th isochron) are located in the southerly Nemours area, where sand calcites occurring down to 50 m below the modern plateau surface are much less accessible for sampling (Fig. 1C). Alternatively, the scarcity of older samples could result from the erosion of the oldest sand calcites through lowering of the plateau level in the northern Fontainebleau area (Fig. 1C). The youngest ages were obtained for small spheroliths formed on top of tightly cemented quartzite lenses in the upper parts of the profiles in the Fontainebleau and the Auvers Sands.
Table 1. Radiometric dating of sand calcites and associated translucent calcite crystals from various Tertiary sand formations in the Paris Basin.a

a 14C dating (ANU, Australian National University; Poz, Poznan Radiocarbon Laboratory) and U-Th dating (BRGM laboratory, Orléans). 14C raw ages: uncalibrated ages; 14C cutoff ages: all raw ages >35 14C ka BP (likely indicate significant “dead carbon” due to a reservoir effect) have been discretionally adjusted to <35 ka; 14C cutoff ages labeled “activity-”: indicate that the sample had no significant 14C activity. Early results of 14C age determinations were reported by Thiry (Reference Thiry2016). The set here contains three additional 14C ages of sand crystals from the Fontainebleau Sand in the Fontainebleau-Nemours area; six 14C ages of sand crystals from older host sand elsewhere in the Paris Basin; and all new U-Th ages.
Carbon and oxygen isotope composition
The Paris Basin sand calcites have variable δ13C values ranging between −3.6‰ and −11.5‰ VPDB and δ18O values ranging between −3.5‰ and −5.8‰ VDPB (see Supplementary File 3 and Fig. 6). These values are slightly depleted in δ13C compared with soil calcites (Amit et al., Reference Amit, Enzel, Grodek, Crouvi, Porat and Ayalon2010; Quade et al., Reference Quade, Eiler, Daeron and Achyuthan2013; Kelson et al., Reference Kelson, Huntington, Breecker, Burgener, Gallagher, Hoke and Petersen2020) and may point to a pure C3 plant environment, which is expected, given the cool climate with summer growing season (Collins et al., Reference Collins, Street-Perrott, Metcalfe, Brenner, Moreland and Freeman2001; Huang et al., Reference Huang, Street-Perrott, Metcalfe, Brenner, Moreland and Freeman2001; Liu and Osborne, Reference Liu and Osborne2008). Thus, the Paris Basin sand calcites have δ13C values similar to those for karst speleothems from western and central Europe (Couchoud, Reference Couchoud2006; Žák et al., Reference Žák, Richter, Filippi, Zivor, Deininger, Mangini and Scholz2012) but quite different from δ13C in cryocalcites (Richter et al., Reference Richter, Schulte, Mangini, Erlemeyer and Erlemeyer2010; Žák et al., Reference Žák, Onac and Perşoiu2008; Lacelle et al., Reference Lacelle, Lauriol and Clark2006) precipitated from oversaturation of freezing water in what is referred to as the “icing process” (Fig. 6). Thus, the sand calcite samples largely overlap in isotope space with other paleoclimate archives like speleothems and soil calcites, as they should if sand calcites formed in near-equilibrium conditions from meteoric water.

Figure 6. (color online) Outlines of the domains of isotopic composition of superficial calcite types. Soil calcite: (S1) Amit et al. (Reference Amit, Enzel, Grodek, Crouvi, Porat and Ayalon2010), (S2) Quade et al. (Reference Quade, Eiler, Daeron and Achyuthan2013), and (S3) Kelson et al. (Reference Kelson, Huntington, Breecker, Burgener, Gallagher, Hoke and Petersen2020); karst cave speleothems: (K1) Couchoud (Reference Couchoud2006) and (K2) Žák et al. (Reference Žák, Richter, Filippi, Zivor, Deininger, Mangini and Scholz2012); cryocalcite: (C1) in caves, Richter et al. (Reference Richter, Schulte, Mangini, Erlemeyer and Erlemeyer2010), (C2) surface and near surface, Žák et al. (Reference Žák, Onac and Perşoiu2008), and (C3) aufeis, Lacelle et al. (Reference Lacelle, Lauriol and Clark2006); sand calcite in the Paris Basin (PB), this study. Additionally, specific isotope fractionation pathways that influence calcite isotopic composition in cold environments are shown as arrows and “classical” fractionating process are provided for those who are new to the literature. Among these are: temperature decrease (Kim and O'Neil, Reference Kim and O'Neil1997), icing environments (Žák et al., Reference Žák, Onac and Perşoiu2008), fast precipitation (Mickler et al., Reference Mickler, Banner, Stern, Asmerom, Edwards and Ito2004), and fast degassing (Hendy, Reference Hendy1971; Hansen et al., Reference Hansen, Dreybrodt and Scholz2013).
DISCUSSION AND INTERPRETATIONS
Sand calcite ages
Because sand calcites can acquire their carbon from several potential sources of non-atmospheric CO2 (among them organic matter and carbonate rocks), it is likely there is a reservoir effect. Consequently, the measured 14C ages will be variously older than the true age of the sand calcites. One may estimate the magnitude of this effect by considering two primary sources of CO2, namely soil respiration and dissolution of regional limestone. Based on a mixing line between presumed endmembers, calcite in equilibrium with soil CO2, and host lacustrine limestone, we roughly estimate that the dead carbon proportion could approach 50% in some sand calcite crystals (see Supplementary File 3). Thus, it would be reasonable to reduce to 35 ka the age of all 14C-dated samples apparently older than 35 14C ka BP to obtain a better estimate of the time range of formation of the sand calcites. Despite the uncertainty, radiocarbon dating clearly demonstrates that the sand calcites are completely dissociated from the encasing sands that are several tens of millions of years old.
The ages of the sand calcites in total are distributed over three periods that coincide with glacial cooling stages (Fig. 7), based on a time-calibrated record of the VOSTOK Antarctica ice core (Petit et al., Reference Petit, Jouzel, Raynaud, Barkov, Barnola, Basile and Bender1999). Except for 4 samples out of a total of 21, all sand calcites have ages within the Wechselian pleniglacial period coinciding with pre- or maximum last glacial maximum (LGM) conditions.

Figure 7. (color online) Frequency and timing of occurrence of sand calcites plotted on time-calibrated record of VOSTOK (Antarctica) ice core with δDice values, which are inversely proportional to ice volume on continents (after Petit et al., Reference Petit, Jouzel, Raynaud, Barkov, Barnola, Basile and Bender1999). The sand calcite ages match periods of maximum ice accumulation on continents and the youngest ages cluster within the last glacial maximum (LGM).
On the other hand, in the neighborhood of the Grotte aux Cristaux, raw ages of 33 and 44 14C ka BP were obtained for crystallaria sampled 50 m apart, although both have among the lowest δ13C values. While some of this variability could potentially be due to a variable reservoir effect, it is also possible that these age differences reflect the duration of calcite precipitation in this particular area or, alternatively, an instability and/or reoccurrence of conditions favoring calcite crystallization in different places at different times, particularly in terms of the stability of seepage pathways of waters that fed calcite precipitation. This is similar to the situation for speleothems that experience still stands or hiatuses in growth. The ages of sand calcites can even vary to a greater extent within a single location. For example, at the Gondonnières (Larchant) locality (Fig. 4), translucent calcite crystals older than 400 ka occur together with sand calcite crystallaria dated at around 30 14C ka BP and small calcite spheroliths near the top of the section dated at about 14 14C ka BP. The wide range of ages could be evidence that multiple generations of sand calcites formed in a single location during successive glaciations. Similarly, translucent calcite in geode structures in the lacustrine limestone cover at Chapelle-la-Reine registers two main sets of ages at 330 and 240 ka, respectively, for internal and outer crystals, (Table 1). Both ages coincide with glacial periods (Fig. 7) and could register the cessation and reoccurrence of particular hydrodynamic conditions in the landscape through the glacial stages.
The consistency of the Paris Basin sand calcite ages with Pleistocene glacial periods (Fig. 7) links their formation to cold soil or permafrost and periglacial environments that prevailed during these periods at that latitude (van Vliet-Lanoë and Lisitsyna, Reference van Vliet-Lanoë, Lisitsyna, Paepe and Melnikov2001).
Significance of the nature and arrangement of sand calcites
Sand calcites grew independently of primary sedimentary structures and formed as a result of postdepositional processes. Their nature and spatial arrangement provide clues about the ground-water environment. The carbonate source is likely to be the limestone overlying and/or occurring upgradient from the sand formation.
Calcareous sandstone pillars formed of coalesced sand calcite spheroliths do not have any dissolution features at their margins. This suggests that they formed in a confined porous environment from through-flowing solutions and that the surrounding sand was watertight. Glacial conditions at the time of sand calcite precipitation lead us to consider the possibility that the host sand was frozen and that the pillars were unfrozen pipes. Isolated regular spheroliths in these pillars point to radial growth in a homogeneous isotropic environment with regard to calcite precipitation mechanisms. We consider this to have been a saturated hydromorphic or slow-flowing ground-water environment. Oblique and cross-laminated structures, including cemented strips of spheroliths in the central part of the profile, point to hydrodynamics in a confined saturated zone (Fig. 8A). In addition, the geopetal organization of the pillars, with massive facies formed of spheroliths cemented by large crystals at the top and individual isolated spheroliths in unconsolidated sand at the base of the profile, suggests falling water table conditions.

Figure 8. (color online) Paleohydrologic interpretation of sand calcite characteristics. (A) Schematic model showing development of spherolithic calcareous sandstone pillars within an unfrozen pipe that pierces the surrounding impervious frozen sand. Spheroliths formed individually in loose saturated sand and then were progressively cemented by variable-sized sand calcite crystals along oblique layers that reflect paleo-water flows. Adapted from Rocher du Carosse section (Supplementary File 2). (B) Sketch of the characteristics, distribution, and growth of sand calcite crystallaria in relation to vadose and saturated hydrologic conditions. Multilobed crystallaria refers to sample 9021 from Larchant, for which the δ18O variation has been detailed in Fig. 9C. Modified from fig. 28 in Thiry (Reference Thiry2016).

Figure 9. (color online) Isotope composition. (A) Plot of δ13C of sand calcites vs. modern depth below surface. Sand calcite spheroliths occur in shallower horizons, whereas sand calcite crystals are from deeper layers. (B) δ18O and δ13C compositions of sand calcites relative to their geographic occurrence along the north-south dip of the Fontainebleau Sand Formation (see Fig. 1C). The northern and southern areas show opposite trends of δ13C and δ18O values, reflecting different hydrogeochemical behavior in the two geographic areas. (C) Schematic showing variations in δ18O and δ13C for subsamples within sand calcites. The overall evolution with time is toward precipitation of calcite with increasing δ18O values. Arrows and numbers indicate successive crystallization stages. Sketch is from sample 9021 (showing field orientation), and subsample numbers refer to relative ages according to geometric relationships in crystallaria.
Horizons characterized by layered slabs of multilobed and individual sand calcite crystallaria are considered to mark former paleo-phreatic surfaces of the local ground water (Fig. 8B). On the other hand, structures that extend vertically are likely to reflect preferential pathways along which infiltrating carbonate-charged water moved downward through the vadose environment toward ground water. Crystallaria that have coalesced in a vertical sense formed bulbs beneath horizontal slabs (comparable to stalactites in a cave and pendants in pedogenic carbonates) or are characterized by successively superimposed layers (in the style of stalagmite laminae or cappings in pedogenic carbonates), all symptomatic of seepage pathways. Cupules 1–2 cm in diameter and about 1–2 mm in depth that occur on the upper surfaces of some crystallaria (Fig. 8B) are presumably dissolution structures generated by localized and intermittent seepage (“dripping”) of water in a vadose environment, in the same manner as cupules at the top of cave stalagmites (Lachniet, Reference Lachniet2009). A noteworthy site is the historical Grotte aux Cristaux (Fontainebleau Forest, parcel 242). This was not a cave at time of its discovery, but a “pocket” of unconsolidated white sand beneath a pisolithic calcareous sandstone clump. Large sand calcite crystallaria about 5 cm in size (Fig. 2B) cover the ceiling of the structure. The orientation of rhombohedral sheaves shows that the crystals grew downward from the roof into the unconsolidated sand, like stalactites in a cave, and are testament to a vadose environment (Thiry et al., Reference Thiry, Liron, Dubreucq and Polton2017).
The arrangement and distribution of sand calcites points to periglacial environments with areas of frozen soil over more than 10 m depth and deeper unfrozen domains with a free water table that point to a significant positive thermal gradient with depth. This arrangement is typical of permafrost environments that are common and widespread in polar regions (Dobinski, Reference Dobinski2012).
Isotope composition interpretation
Besides the various mechanisms of isotopic fractionation classically considered in continental carbonate, there are fractionations specific to periglacial environments, particularly snowfall, and water freezing and thawing (Fig. 6). There is an overall increase of δ18Ocalcite VPDB with decreasing temperature assuming constant water (Friedman and O'Neil, Reference Friedman and O'Neil1977) and freezing generates an increase in δ18O VSMOW of up to approximately +3‰ in the ice and a consequent depletion in the residual liquid water (O'Neil, Reference O'Neil1968). Consequently, in glacial and periglacial environments, the effects of substantial icing, snowfall, and evaporation/sublimation of initial meteoric water on the δ18O content of surface and subsurface water must be considered. First, a shift of +1‰ VSMOW for rainfall during Quaternary periods of maximum ice volume is expected (Schrag et al., Reference Schrag, Adkins, McIntyre, Alexander, Hodell, Charles and McManus2002). Second, in periglacial environments there is a sharp contrast between δ18O composition of rainfall and snowfall, the latter being about −6‰ VSMOW compared with rainfall at the same site in midlatitudes (Tian et al., Reference Tian, Wang, Kaseke and Bird2018). As a result of snowfall and successive icing and thawing processes, supra-permafrost ground water in Siberia is about −3‰ in δ18O VSMOW values relative to local rainwater (Dereviagin et al., Reference Dereviagin, Chizhov, Meyer, Hubberten, Siegert, Phillips, Springman and Arenson2003).
δ13C values
The δ13C composition of meteoric waters changes in response to the effects of rock–water interaction and the uptake of both organically derived CO2 and inorganic CO2 from carbonate terranes (Lohmann, Reference Lohmann, James and Choquette1988). Variations in these factors make it possible to distinguish vadose and phreatic environments and mixed waters from δ13C values. The Paris Basin sand calcites plot along a mixing line between two carbon reservoir endmembers: (1) calcite precipitated from soil CO2–dominated surface waters and (2) calcite precipitated from ground water in which dissolved CO2 mainly originates from dissolution of host rock limestone. Two aquifers may be considered: the first is in a series of lacustrine limestones that frame the Fontainebleau Sand Formation and form the bulk of Nappe de Beauce aquifer that discharges in the Fontainebleau Sand; and the second is in chalk that also forms basal and distal parts of the Nappe de Beauce aquifer (Supplementary File 3).
In terms of δ13C composition, almost all samples fall between calcite precipitated from soil (organic) CO2 and from lacustrine limestone-derived CO2 (see Supplementary File 3). Only a few sand calcite samples slightly exceed the lacustrine limestone δ13C value. These could be interpreted as originating from either lacustrine limestone with slightly higher δ13C values than our reference limestone or ground water influenced by a chalk aquifer mixing with Beauce lacustrine limestone aquifer south of the study area. One sample (8787) that falls closer to the marine limestone δ13C is an old translucent calcite (U/Th age >400 ka) from a fossil-bearing marine beach-rock horizon within the Fontainebleau Sand. This particular sample probably inherited a marine C signature from the host layer. The distribution of δ13C values of sand calcites below or just above the δ13C value of the reference lacustrine limestone, with a significant gap up to δ13C value of the chalk, probably means that chalk influence is likely secondary to that of lacustrine limestone. The proportion of carbon derived from soils (and surface water) and from the dissolution of lacustrine limestone reflects the open- versus closed-system conditions of Hendy (Reference Hendy1971) and the vadose versus phreatic environments of Lohmann (Reference Lohmann, James and Choquette1988). This proportion can by estimated from the linear mixing model and CO2 inherited from dissolution of the encasing limestone and may approach 50% in some sand calcite crystals (Supplementary File 3).
Figure 9A shows that the δ13C values of sand calcites generally increase with their estimated depth of formation in the host sand profile (modern depth below the plateau surface; Fig. 1C). There is a clear partition between sand calcite spheroliths at shallower depths and sand calcite crystals and cystallaria at greater depths at around 13 m. It relates to a major geochemical change: almost all sand calcite spheroliths have δ13Ccalcite values below −8‰ VPDB, whereas most of the sand calcite crystals (at least those at depths >13m) have δ13Ccalcite values above −8‰ VPDB. This difference points to two reservoirs with specific δ13C values: a shallow reservoir with a large proportion of depleted δ13C of soil organic origin and a deeper reservoir linked to a ground-water limestone aquifer characterized by less depleted δ13C originating from limestone dissolution. Present-day ground water in the Fontainebleau-Nemours area has Dissolved Inorganic Carbon (DIC) δ13C values averaging −16‰ VPDB in shallow layers and −12‰ VDPB in deeper layers (see Supplementary File 4). A linear mixing model considering two source endmembers, on one hand soil water from the vadose zone (open CO2 system) and rainwater, and on the other hand δ13Ccalcite values from calcite precipitated from organically derived CO2 and calcite precipitated from rainwater, provides the basis for estimating δ13Ccalcite values corresponding to field-measured δ13CDIC values (see Supplementary File 4). Our estimated δ13Ccalcite values fall within the domain of Fontainebleau sand calcites. The trend of δ13Ccalcite from deeper to shallow ground water tallies with that observed in the Fontainebleau-Nemours area sand calcites. The decrease in δ13Ccalcite values from the deeper ground water toward more shallow areas confirms that the Nappe de Beauce had a ground-water supply and flow regime during the LGM comparable with that of the present day (Bariteau and Thiry, Reference Bariteau and Thiry2001).
δ18O-δ13C cross-plot
δ13C values of sand calcites show a regional increase along a north-south section sequentially from the northern Fontainebleau area, through the southern Fontainebleau area, the northern Nemours area (Larchant and Puiselet sites), and ending in the southern Nemours area (Fig. 9B). The increase in δ13C values along this section agrees with the southward dip of the Fontainebleau Sand formation (Fig. 1C). Three calcite samples seem to be out of context in terms of δ13C values. Samples 9100 and 9101 are from a very shallow depth (estimated to be 2 m below the modern plateau surface) but are nested within samples from greater depths, whereas the reverse is the case for sample 8935 from the southern Nemours area, which has δ13C and δ18O values near those of the shallower northern Fontainebleau samples. Samples 9100 and 9101, being embedded in quartzite lenses, crystallized before silica cementation (Thiry et al., Reference Thiry, Bertrand-Ayrault and Grisoni1988) and may be older than sand crystals in unconsolidated sand in this area. From this perspective, they would have formed at a greater depth and subsequent erosion would have brought them up to their current landscape position. Sample 8935, on the other hand, crystallized from water seeping through a fracture in a quartzite lens in a near-surface environment and thus postdates silicification. Thereby, the three samples do not deviate from the δ13C–depth correlation but instead reflect successive steps in landscape incision.
δ18O values of sand calcites show two distinct domains and behaviors (Fig. 9B): (1) sand calcites from shallower depths in the Fontainebleau area (mainly spheroliths) have a positive correlation (R +0.53 for 24 samples) between δ13C (~<−7‰ VPDB) and δ18O; and (2) sand calcites from greater depth from the Nemours area (mainly crystallaria) have a well-defined inverse relationship (R −0.81 for 32 samples) between δ13C (~>−8‰ VPDB) and δ18O. The opposite relationships between δ18O and δ13C values exhibited in the two groups of sand calcites are important.
The decreasing δ18O values with depth of precipitation of calcite in the Nemours area may correspond to an increase in temperature due to shallower ground water in the north being cold, while deeper ground water in the south was less impacted by a cold land surface condition. This situation makes sense in a permafrost context. Currently, the flow of ground water is from south to north, and it discharges along valleys and at the scarp of the Beauce plateau. There is no reason for this situation to have been different during the LGM. Hence, the lower δ13C values in the north may have resulted from a progressive input of organic-enriched infiltration water as ground water came closer to soil environments, as is the case today for the Nappe de Beauce ground water (Bariteau and Thiry, Reference Bariteau and Thiry2001). The samples actually stretch out along a temperature gradient in the host rock. All the sand calcites are crystals and crystallaria and are considered to have precipitated in a deep reservoir, as attested by higher δ13C values. It is conceivable that the temperature gradient corresponds to a surface temperature gradient, but that is quite unrealistic at the small regional scale. If it were so, the sequence of sand calcite would have to be a chronosequence that could be supported or disproved by accurate dating. The negative correlation has mainly paleomorphological significance, whereas the decrease in temperature when approaching the surface is typical of cold environments and has paleoclimatic significance.
The depleted δ13C values of sand calcites in the Fontainebleau area is characteristic of a surficial carbon reservoir influenced by proximity to soils. Calcites show decreasing organic influence from north to south and thus a gradual deepening and consequently a progressive increasing influence of a deep carbonate reservoir linked to ground water. This evolution is consistent with the dipping of the Fontainebleau Sandstone aquifer to the south. The positive correlation between δ13C and δ18O would point to a decrease in ground-water temperature with depth. Such a temperature decrease is the opposite to that of a permafrost pattern and to that shown by the sand calcite crystals of the Nemours area. Two assumptions can be made:
1. The positive correlation may correspond to a fast degassing (Hendy, Reference Hendy1971; Hansen et al., Reference Hansen, Dreybrodt and Scholz2013; and Fig. 6). Nevertheless, the shallowest sand calcites in the Fontainebleau north area have δ18O values similar to those of the deepest calcites in the Nemours south area and would therefore have formed at relatively high temperatures. Consequently, this assumption does not bring any coherency, nor continuity, between deeper and shallower areas.
2. An alternative scenario is to consider that depleted δ18O values in the shallow Fontainebleau north area are related to specific surface waters with depleted δ18O values in relation to a snowfall origin, snowfall typically being highly depleted relative to rainfall (Tian et al. Reference Tian, Wang, Kaseke and Bird2018). In polar areas, snowfall and the icing process result in supra-permafrost ground water being up to −3‰ δ18O VSMOW compared with regional rainwater (Dereviagin et al., Reference Dereviagin, Chizhov, Meyer, Hubberten, Siegert, Phillips, Springman and Arenson2003). Mixing of this depleted surface water with deeper ground water ultimately leads to a variation of the δ13C and δ18O values of the cold shallow ground water of the southern area.
The second scenario implies that during the LGM the Nappe de Beauce ground water retained the characteristics of temperate climate ground waters and was mainly inherited from the preglacial period. This is in line with the combination of a very dry climate during the LGM (Fuhrmann et al., Reference Fuhrmann, Diensberg, Gong, Lohmann and Sirocko2019) and permafrost behaving like a barrier for recharge by surface water (McEwen and de Marsily, Reference McEwen and Marsily1991). In the meantime, permafrost would have restricted ground-water discharge to unfrozen “windows” along river valleys, and these discharges would have been somewhat compensated by an increase in ground-water volume due to water freezing (Woo, Reference Woo2012), which in turn led to lateral flows from greater depths (Vidstrand, Reference Vidstrand2003). These processes would make the Nappe de Beauce behave like a confined fossil ground water during the LGM. That scenario could be tested by constraining the temperature of precipitation of sand calcites by means of clumped Δ47 isotope data that could also provide information about the characteristics of the Nappe de Beauce ground water.
In addition to geographic variation, a significant variation in stable isotope composition exists within a single sand calcite sample. Isotopic variations from internal to external parts of sand calcite bodies and slabs of multilobed crystallaria have been measured on subsamples extracted by 5-mm-diameter drillings (Fig. 9C). Intrasample δ18O values tend to increase up to 1‰ VPDB from older to younger parts of the crystals. The time interval between younger and older parts of sand crystals is likely to be quite short compared with the differences in age of isolated sand crystals, even though they may be close to one another. For example, proximal sand crystals from the Larchant Quarry have ages that are several thousand years apart. The isotope variations within single sand calcites are likely to indicate a homogeneous growth rate relating to a stable flow path of nourishing water. The varying δ18O values could be linked to changes in the composition of the parent water flow, but their systematic increase points rather to an internal regulation bound to hydrologic dynamics. The contrasting increase in δ18Ocalcite values from the internal to the external zones of spheroliths and along crystallization timelines for slabs of crystallaria may account for a consistent decrease in temperature of a few degrees induced by progressive cooling of the host sand by infiltrating water rather than changes in surface conditions that would be more erratic. On the other hand, changes in δ13Ccalcite values with calcite precipitation stage are not consistent and could rather relate to δ13C variations in DIC controlled by variations in local vegetation cover or simply to changes of the superficial water flow paths relative to periodic soil structure rearrangements.
Sand calcite isotopic compositions help to place constraints on ground-water regimes within the regolith. Flow rates and water volumes implied in the water flux set up thermal contrasts. Overall, the stable isotope signature of the sand calcites records the interactions between water fluxes and the host rock, thereby highlighting interactions between climate and landscape.
Calcite precipitation temperature
If the evolution scenario of δ18O values with depth (Fig. 9B) is retained, one may attempt to calculate the precipitation temperatures of the calcites linked to both the deep ground water and the upper horizons of the permafrost (active zone). To do this, the δ18O value of the most-depleted sand calcite crystals of the Nemours area (about −5.5 VPDB) have to be related to water with a δ18O value equivalent to that of the current Nappe de Beauce or Nappe de Brie ground water (−6.75‰ SMOW) (Guillon et al., Reference Guillon, Rivière and Flipo2017). For the shallow calcites, the average δ18O value of the sand calcites from the north Fontainebleau area (about −5.2 VPDB) can be linked to superficial water or shallow ground water in periglacial environments. For that, on the one hand, we selected a δ18O value for rainwater at Fontainebleau during the LGM by taking the current local precipitation δ18O value (−7.4‰ VSMOW) at Fontainebleau and nearby Boissy-le-Châtel survey stations (Guillon et al., Reference Guillon, Rivière and Flipo2017) shifted by +1‰ VSMOW (to reflect the general 18O enrichment that is expected for rainfall during Quaternary periods of maximum ice volume according to Schrag et al. (Reference Schrag, Adkins, McIntyre, Alexander, Hodell, Charles and McManus2002). On the other hand, we took as reference the results of Dereviagin et al. (Reference Dereviagin, Chizhov, Meyer, Hubberten, Siegert, Phillips, Springman and Arenson2003), according to whom supra-permafrost ground water in Siberia is about −3‰ δ18O VSMOW relative to the local rainwater due to snowfall and icing processes. However, because there is a smaller difference in δ18O values between rainwater and snowfall at middle latitudes than at high latitudes (Tian et al., Reference Tian, Wang, Kaseke and Bird2018), we opted for a ground-water depletion half that of the Siberian reference, which corresponds to −1.5‰ VSMOW in δ18O values between rainwater and supra-permafrost ground water. While this reasoning is clearly associated with significant uncertainty, we used a “reasonable” value of −7.9‰ for the shallow supra-permafrost ground water in our study area.
Precipitation temperatures were calculated using the calcite–water fractionation equation of Friedman and O'Neil (Reference Friedman and O'Neil1977). Calculations yielded a precipitation temperature of +9.2°C for the sand calcites of the deeper ground-water realm and +1.6°C for the calcites bound to surficial water or shallow supra-permafrost ground water. Given the high uncertainty on the assumed δ18O value of supra-permafrost water, it seems reasonable to adopt a temperature of 2°C for calcite precipitation in shallow LGM paleoenvironments. The two temperatures (+2°C and +9°C) make sense compared with the thermal pattern of permafrost and support an internally consistent argument to the δ18O–δ13C cross-plot diagram (Fig. 9B). The Δ47 clumped isotope thermometry may allow further validation of these estimates and refine temperature distribution along flow paths from shallow to deeper ground water.
Paleoenvironments
Permafrost hydrology
Here we look at the nature of frozen regolith, particularly permafrost, with emphasis on aspects of its hydrology as an aid to interpret sand calcite occurrences and their variability within the Fontainebleau Sand. Permafrost consists mainly of three units (Dobinski, Reference Dobinski2012): (1) a superficial layer called the “active layer,” because it undergoes seasonal freeze and thaw; (2) a permanently frozen (permafrost) deep layer; and (3) a nonfrozen sub-permafrost domain. The lower boundary of permafrost reflects a balance between climatic cooling from the surface down and geothermal heat from the depths upward (Fig. 10A). Permafrost is impervious and tends to slow or stop ground-water recharge (McEwen and de Marsily, Reference McEwen and Marsily1991; Lemieux et al., Reference Lemieux, Sudicky, Peltier and Tarasov2008): its presence restricts large-scale ground water flows to deep aquifers and forces lateral flows toward greater depths. Ground-water recharge or discharge is focused on rivers and lakes that are permeable unfrozen “windows” in the permafrost. Nonfrozen zones (“taliks”) may exist and persist within permafrost, and collapse of the land surface during periods of thaw may form vertical permeable zones (thermokarst) through the permafrost (Kokelj and Jorgenson, Reference Kokelj and Jorgenson2013). During cooling periods, ground water may rise through taliks toward the land surface in response to a pressure increase caused by water freezing (Woo, Reference Woo2012), whereas during warming periods, thermokarsts may engulf runoff waters and replenish the ground water (Yoshikawa and Hinzman, Reference Yoshikawa and Hinzman2003; French, Reference French2013).

Figure 10. (color online) Suggested paleoenvironments of sand calcite formation. (A) Sketch of the latitudinal character of permafrost. The frozen zones are impervious, but nonfrozen zones may form and persist, giving rise to water flow paths. Latitudes refer to present-day landscapes (cf. Siberia). Adapted from Dobinski (Reference Dobinski2012). (B) Conceptual model of precipitation of sand calcites in Pleistocene settings. Top inset shows the position of the lower sketch in relation to the sand scarp at the edge of the Beauce plateau. The temperature contrast at the bottom of permafrost causes the degassing of infiltrating water that in turn leads to the precipitation of dissolved carbonate. Calcite precipitation may occur at temperatures between those of surface water and ground water (i.e., between 2°C and 12°C) depending on factors such as flow rates, depth, and equilibrium between infiltrating water and host sand. Modified from fig. 32 in Thiry (Reference Thiry2016).
There are few direct data on intra- and sub-permafrost ground water. Most information is for water discharging from sub-permafrost ground water into rivers through taliks. Data have been recorded for water discharging at 16.8°C along a river (Clark et al., Reference Clark, Lauriol, Harwood and Marschner2001) and water discharging through 600-m-thick permafrost (Andersen et al., Reference Andersen, Pollard, McKay and Heldmann2002). Common spring water temperatures in northern Canada average 5°C–7°C (Yoshikawa et al., Reference Yoshikawa, Hinzman and Kane2007; Kane et al., Reference Kane, Yoshikawa and McNamara2013). During summer, shallow ground water at 1–2 m depth in the surficial active layer generally does not exceed 2°C–5°C (Boike et al., Reference Boike, Roth and Overduin1998; Ge et al., Reference Ge, McKenzie, Voss and Wu2011). A warming climate could progressively thaw permafrost over a time periods of a few years to millennia (Zhang et al., Reference Zhang, Chen and Riseborough2008).
Paris Basin in the Pleistocene
During Pleistocene glacial periods, the ground temperature in northern France was probably 18°C colder than today and extensive permafrost existed (van Vliet-Lanoë and Lisitsyna, Reference van Vliet-Lanoë, Lisitsyna, Paepe and Melnikov2001). The thickness of permafrost may regionally have reached 100 to 200 m between 30–20 ka (Bertran et al., Reference Bertran, Andrieux, Antoine, Coutard, Deschodt, Gardère and Hernandez2014). A marked temperature gradient also existed in the Paris Basin between surface waters around 2°C (mean value of the thawed active layer) and the deeper ground water with a temperature beneath the permafrost probably only slightly lower than at the present day, which is around 12°C. Our conceptual model shown in Figure 10B is in this paleoenvironment, where we propose that: (1) sand calcite crystallaria formed at the water table in the Fontainebleau Sand beneath infiltration pathways through discontinuous permafrost; and (2) spheroliths developed in nonfrozen permeable thermokarsts, consistent with the confined aspect of the spherolithic calcareous sandstone pillars we have described, and where cold water plumes plunged deeper into ground water due to density differences (Oostrom et al., Reference Oostrom, Hayworth, Dane and Güven1992).
The warming of cold water releases dissolved CO2 and initiates calcite precipitation (Dreybrodt, Reference Dreybrodt1982; Brasier, Reference Brasier2011). Thereby, infiltrating cold waters containing carbonate dissolved during their flow over and through surface limestone would have degassed upon reaching warmer zones in the subsoil and could have precipitated calcite at depths of 5–50 m below the plateau. This would be a rather efficient process for precipitating calcite. When water in equilibrium with atmospheric CO2 warms from 0°C to 10°C it loses approximately 25% of its dissolved CO2 by degassing, and 25% of the dissolved calcite will precipitate (Bethke, Reference Bethke2002). The deposits that result can be volumetrically significant if the flows of water repeat and/or continue over time. Our hypothesis requires that the permafrost is discontinuous and not too thick in order to allow water to infiltrate but also to maintain a relatively warmer temperature in the ground water than in the subsurface rocks.
Flow rate versus sand calcite growth
The mass balance of infiltrating water versus the volume of the host sand plays a major role in the development of sand calcite varieties. The manner in which water invades a host rock has a direct effect on the geochemical characteristics of the solution, whereas the development of crystallized masses influences hydraulic flow, which in turn acts on the geochemical characteristics of the solution.
The formation of large pillars of sand calcite spheroliths would have required substantial volumes of water. Under these conditions, large volumes of cold water flowing through karst-like structures could cause relatively rapid oversaturation and the formation of spheroliths devoid of crystalline form. The recurring development of microcrystalline and fibrous calcite in the cores of spheroliths versus larger equant crystal fabrics in the cortices is considered to be a response to the kinetics of calcite precipitation in relation to the inflow of carbonate-charged water during progressive cementation of the host sands (Gonzalez et al., Reference Gonzalez, Carpenter and Lohmann1992). At the start of cementation, porous sand with high porosity facilitated the renewal of flow-through water and rapid oversaturation with respect to calcite was achieved. Oversaturation favored the formation of a large number of nuclei, which ensured a high precipitation rate, leading to the formation of elongated and microsparite calcite (Gonzalez et al., Reference Gonzalez, Carpenter and Lohmann1992; Beck and Andreassen, Reference Beck and Andreassen2010). Later, the growth of spheroliths reduced porosity of the aquifer, infiltrating water flow was slowed, and its composition approached equilibrium with calcite. Consequent lower kinetics favored the formation of well-developed crystals on the surfaces of the spheroliths (Tracy et al., Reference Tracy, François and Jennings1998). Ultimately, large volumes of surficial cold water entering the thermokarst would probably cool the whole structure and thus progressively shift the precipitation front to deeper zones. This could be an alternative explanation for the geopetal organization of the spherolithic pillars, with a progressive lowering of the zone of spherolith formation followed by calcite cementation higher in the profile, together with or independent of a falling water table condition.
On the other hand, warming of water seeping through more subtle pathways would be more gradual and accompanied by a low degree of oversaturation that favors the growth of large crystals. Variations in sand calcite crystal habit reflect the geochemical evolution of the carbonate-rich solution along the flow path, with: (1) dissolution cupules at the top indicating that the infiltrating water was at times undersaturated with respect to calcite; (2) oversaturation-incurred crystallization of calcite while water flowed around crystallaria; and (3) formation of the most regular crystals on the equatorial plane of crystallaria and horizontal slabs when solutions were close to equilibrium with calcite. This behavior mimics the growth of stalagmite lamina with dissolution cupules at the top and a progressive change in the calcite saturation of the source water from the apex toward the basal flange of the lamina (Mickler et al., Reference Mickler, Stern and Banner2006; Couchoud, Reference Couchoud2008; Morale and Liu, Reference Morale and Liu2009). The similarity between these sand calcite structures and karst speleothems is noteworthy. The water table appears to have acted as a geochemical front where the greatest number of sand calcite crystals precipitated.
In conclusion, sand calcite crystals are considered to have developed in a stable hydrologic environment where oversaturation was low and the growth of large calcite crystals was favored. In contrast, sand calcite spheroliths appear to have formed in a hydromorphic environment with a higher degree of oversaturation where crystallization of calcite was more rapid. The increasing size of calcite crystals with progressive crystallization, for example, spheroliths studded with the acute tips of calcite rhombohedra on their surface and slabs of crystallaria with larger rhombohedra crystals at their rim, occurs in spatially separated sand calcites. It reflects some form of self-regulation or internal regulation of the hydrologic dynamics and is a response to progressive restriction of water flow paths and water flow rates by calcite cementation of the host sands.
In relation to the analogy with speleothems, it should be noted that kinetics and oversaturation proposed here as faster or more intense are probably much less contrasted than in cave environments. The saturated aquifer probably does not result in a very fast degassing process over seconds as occurs via the splash of dripping water in caves. Degassing within a large ground-water body will be buffered by equilibration with the surrounding pore water, in a somewhat closed system, whereas water films in caves are in contact with a large volume of air, and equilibration is almost instantaneous, consistent with a direct open system. This greater inertia of the ground water likely explains why large crystals can develop in ground water in contrast to the laminae in speleothems that are always microcrystalline. Moreover, kinetic effects during sand calcite precipitation should generate much less isotope fractionation than in speleothems.
Paleoenvironmental footprints
Landscape evolution
The location of sand calcites within former aquifers provides clues about paleolandscape reconstruction. For example, the formation of spherolithic sand calcite pillars requires a constant water supply to precipitate the bulk of the calcite. The pillars could not have formed on the sandy slopes where they currently occur, because the water would run off rather than enter the thermokarst. So the paleoenvironment had to be something like a low basin or depression on the plateau, probably 1–3 km behind the sand scarp. Based on the radiometric dating of the contained sand calcites, erosional retreat of the sand scarp on the order of 1 km/10,000 yr would be required to place the sand calcite pillars in their current geomorphic positions. These rates are a significant local benchmark compared with 100 to 1000 times slower erosion rates calculated for the whole Paris Basin (Cojan et al., Reference Cojan, Brulhet, Corbonnois, Devos, Gargani, Harmand and Jaillet2007).
Similarly, the ages of aligned sand calcite crystallaria are likely to record benchmarks of water table paleolevels, thus permitting estimates to be made of the location and rate of lowering of the water table since their formation and so helping to unravel some of the details of landscape evolution, process, and scale. There are at least two scales to be considered: (1) on the scale of a drainage basin and major drainage lines, the falling water table is primarily a response to a combination of sea-level change and epeirogenic uplift; and (2) at restricted local scales, like watersheds and thalwegs, the falling water table is also a response to the retreat of ground-water discharge (seepage) zones in the scarp foot zone and thus may offer a methodology for estimating the local rate of retreat (erosion) of the scarp.
Paleoclimatic markers
The link between sand calcites in the sand formations of the Paris Basin and periods of cold climate is clearly provided by the radiometric ages of the calcites. The presence of sand calcites with an inverse rhombohedron form linked to a water table is first and foremost an indicator of a temperature gradient resulting in the warming of infiltrating water. But the presence of permafrost is only indicated by the existence of the spherolithic calcareous sandstone pillars within unconsolidated Fontainebleau Sand. Permafrost is not an unequivocal prerequisite but simply a condition whereby the subsoil is a cold horizon with a relatively sharp temperature gradient at its base. In our study area, the youngest sand calcite spheroliths (8943, 8601, and 8604 in Table 1) precipitated at the top of quartzite pans in the Fontainebleau Sand under a relatively thin soil cover. This was perhaps during a short cooling event at the end of the last glacial period when the surficial soil cover was cold and the higher thermal conductivity of the nonporous quartzite, in comparison to that of the porous sand, generated a steep temperature gradient at the top of the pan and thus precipitated calcite from infiltrating water.
The decreasing δ18Ocalcite values of sand calcite from the surface to subsurface, indicating a positive temperature gradient with depth, could be considered an isotopic footprint of calcite formation in a cold environment. This is an inverse gradient to that shown by travertine calcite precipitation, that is, by warming of spring water at the land surface inducing CO2 degassing (Chafetz et al., Reference Chafetz, Rush and Utech1991; Griffiths and Pedley, Reference Griffiths and Pedley1995). Warming is still the process causing CO2 to evolve, but beneath the land surface, rather than at the surface.
Extent of glacial calcite archives
Apart from the localities known in the former periglacial zones of western Europe in Germany (Dechen, Reference Dechen1856; Löffler, Reference Löffler2011) and in Poland, Austria, Hungary, and Romania (Löffler, Reference Löffler2012; Mindat, Reference Mindat2016), sand calcites with forms similar to those in the Paris Basin have been described in more southerly regions that have never experienced true periglacial conditions. For example, similar sand calcites have been described in California and Texas in the United States (Rogers and Reed, Reference Rogers and Reed1926; Harrison, Reference Harrison1969; Drees and Wilding, Reference Drees and Wilding1987; Gell, Reference Gell1996) and in Morocco at the foot of the Atlas Mountains (Löffler, Reference Löffler2012). It is possible that they formed during climate cooling events that were not as strong as that of a periglacial climate. For example, global climate cooling could be sufficient to trigger a positive temperature gradient between surface and subsurface horizons in the regolith and thus facilitate precipitation of calcite in lower latitudes. It is possible that some sand calcites developed during glaciations older than the Pleistocene, for example during Oligocene and Miocene times (Katz et al., Reference Katz, Miller, Wright, Wade, Browning, Cramer and Rosenthal2008). Attention could also be paid to elongate concretions that were formed parallel to sedimentary strata and have been used as proxy of past ground-water flow in the host rock (Johnson, Reference Johnson1989; McBride et al., Reference McBride, Picard and Folk1994; Mozley and Goodwin, Reference Mozley and Goodwin1995; Quade and Roe, Reference Quade and Roe1999; McBride and Parea, Reference McBride and Parea2001; McCullough, Reference McCullough2003; Mozley and Davis, Reference Mozley and Davis2005). It may be interesting to investigate their ages and the conditions that prevailed at the time of their formation. Additionally, one could track powdery calcite lenses bound to thermokarst sink structures, as these may relate to periglacial calcite precipitation (Thiry et al., Reference Thiry, van Oort, Thiesson and van Vliet-Lanoë2013).
Furthermore, in addition to typical sand calcites, translucent calcites of inverse rhombohedral form within limestone host rocks could also be considered. For example, the geodic calcite crystals within karst dissolution features of sample 6790 record crystallization during two glacial stages (240 and 330 ka). Such geodic crystals are common in all Tertiary limestone formations in the Paris Basin, above as well as below the sand formations (see Fig. 7; Supplementary File 1). Similar calcites undoubtedly exist in other regions and in limestone formations of any age. Their recognition would extend the glacial calcite markers beyond the sand formations and provide a greater density of data linking paleolandscape reconstructions with paleoclimate chronologies.
The sand calcites assigned to glacial periods must also be related to the inverse rhombohedral crystals and spheroliths of cryogenic calcites that formed by freezing of water in karst caves in central Europe during the LGM (Žák et al., Reference Žák, Urban, Cilek and Hercman2004; Richter et al., Reference Richter, Felicitas and Riechelmann2008). These cryocalcites record the sinking of permafrost and are an archive of the minimum depth reached by permafrost (Žák et al., Reference Žák, Richter, Filippi, Zivor, Deininger, Mangini and Scholz2012). Some caves contain noncryogenic calcites that formed before and after cryogenic calcites, thus providing the basis for establishing a time bracket for the passage of the cave into the permafrost (Richter et al., Reference Richter, Schulte, Mangini, Erlemeyer and Erlemeyer2010). Such an archive is complementary to that for the sand calcites hosted in sand aquifers, and cross-linking the two records could establish the timing of initiation and thawing of the permafrost. One potential site in which to conduct such an investigation is at Brilon, where sand calcites hosted in sand infilling a paleokarst (Dechen, Reference Dechen1856) are in the area where cave cryogenic calcites have been described and dated (Richter et al., Reference Richter, Felicitas and Riechelmann2008). The two types of calcite probably occur in proximity in other sites and may provide synchronous archives in hydrologically contrasted host rock.
CONCLUSIONS
Radiometric dating (14C and U-Th) of sand calcites in Tertiary sands of the Paris Basin clearly demonstrates that they formed during Pleistocene glacial periods and have no association with deposition or diagenesis of the host Tertiary sand formations. They are, in fact, relatively young paleoweathering features within the regolith. Their morphologies and arrangements within the host sands reflect their juxtaposition to the surface of paleolandscapes and the position of paleo–water tables. Cemented sand calcite pillars within uncemented sand are considered to have formed from waters engulfing thermokarst features through permafrost. Horizontal arrays of sand calcite crystals mark the position of paleo–water tables and are evidence of former hydrologic conditions. Decreasing δ13C values of sand calcites with depth in host sand profiles provide complementary information about the depth of their formation.
There is a scarcity of markers of water tables in former landscapes, other than iron oxide bands that are assumed to match the position of phreatic surfaces. Sand calcites could be a valuable archive of paleo–water table position and age. The occurrence of successively arrayed sand calcite horizons in a profile could indicate changes to the water table in an aquifer due to changes in rainfall, while sand calcite horizons along river valleys may provide evidence of successive stages of river incision. Their ages could permit detailed reconstructions of landscapes and their evolution as well as quantify erosion rates and help to forecast future landscape evolution for location of sensitive site projects. Additionally, coupling temperature and depth of calcite precipitation according to δ13C value at a local or regional scale may lead to the drawing up of a thermal diagram of the regolith with temperature gradients and potential temperature fronts linked to heat transfers by ground-water flows. This would be a highly innovative research target for reconstructing the paleothermometry of the regolith during the ice ages.
As the Paris Basin sand calcites contain paleoclimatic markers that complement and perhaps supplement the range of continental paleoclimatic indices, investigations of sand calcites elsewhere may provide new information about past climates in regions where paleoclimatic records are not otherwise available. In particular, the development of cemented sand calcite structures could provide evidence for freezing conditions in the subsurface. Their occurrence within a profile points to increasing subsurface temperature and could be used to estimate the depth reached by freezing in periglacial environments. An increasing temperature with depth, indicated by decreasing δ18O values for sand calcites, could also be the marker of calcite formed in a cold environment, in contrast to other calcite accumulations in soils and continental surface waters that rely on near-surface heating. In addition, the presence of waters with depleted δ18O values could be a clue to glacial surface water fed by melting snow and/or unfrozen residual water from icing processes.
We suggest that future studies could enlarge the inventory of sand calcite occurrences in areas that experienced cold climates during the Pleistocene (plains and mountain areas) and, extending south of the periglacial latitudes, parts of North Africa, California, and elsewhere. Attention could be paid to identifying the forms and characteristics of sand calcites that are a proxy of past ground-water flow. As calibration studies are critical for the development of paleoarchives, finding sand calcite occurrences in iced landscapes (like northern Canada and Siberia) would be of prime importance in acquiring physicochemical parameters that come with calcite precipitation and composition variability. Erosion that accompanies current thaw in these areas may provide opportunities to find materials and sections. Additionally, Δ47 clumped isotope thermometry and fine-scale variations in O and C isotopes using Secondary Ion Mass Spectrometry (SIMS) analyses coupled with laser ablation U-Th dating in large crystals and spheroliths may uncover high-resolution continuous continental paleoclimate proxy records, including those for glacial and periglacial paleoenvironments. These could show hiatuses correlated with glacial events like Dansgaard–Oeschger events or even record global minor or trace elements, as do ice cores and speleothems (Genty et al., Reference Genty, Blamart, Ouahdi, Gilmour, Baker, Jouzel and van Exter2003; Wainer et al., Reference Wainer, Genty, Blamart, Daëron, Bar-Matthews, Vonhof and Dublyansky2011). Such records would complement the range of published paleoclimatic archives from studies of speleothems (e.g., Villars cave; Genty et al., Reference Genty, Blamart, Ouahdi, Gilmour, Baker, Jouzel and van Exter2003; Wainer et al., Reference Wainer, Genty, Blamart, Daëron, Bar-Matthews, Vonhof and Dublyansky2011), pedogenic carbonates (Oerter et al., Reference Oerter, Sharp, Oster, Ebeling, Valley, Kozdon and Orlande2016; Huth et al., Reference Huth, Cerling, Marchetti, Bowling, Ellwein and Passey2019), and lake levels (Blard et al., Reference Blard, Sylvestere, Tripati, Claude, Causse, Coudrain and Condom2011; Hudson et al., Reference Hudson, Quade, Huth, Lei, Cheng, Edwards, Olsen and Zhang2015).
In the Paris Basin, the Fontainebleau Sand Formation is deeply weathered in its outcrop area, resulting in bleaching and concomitant sand calcite development as well as silicification to form tight superimposed quartzite pans (Thiry et al., Reference Thiry, Bertrand-Ayrault and Grisoni1988, Reference Thiry, Millot, Innocent and Franke2015). Silicification and sand calcite precipitation occurred simultaneously in the same paleolandscape, as indicated by quartzite pans that include both sand calcites and sand calcites containing quartz sand grains that have silica overgrowths. This is an exceptional place where it is possible to integrate studies including dating and isotopic composition of secondary calcite, quartz, and iron oxides. Concomitant paleoweathering features certainly occur elsewhere in Pleistocene midlatitude landscapes but have been overlooked by “classical” geology until recently. Their study may open up new fields on subsurface (5–50 m depth) ground-water paleoweathering.
ACKNOWLEDGMENTS
MT is indebted to his colleagues Jean-Michel Schmitt and Isabelle Cojan for extensive and fruitful exchanges and discussions on the Fontainebleau issues. Special thanks to Nelly Martineau for performing isotope analyses, many of which were done beyond normal duty. Thanks also to Cristiano Ferraris from the Muséum National d'Histoire Naturelle in Paris for his diagnosis of the inverse rhombohedral form of several samples and to Folkert Van Oort from the Institut National de la Recherche Agronomique in Versailles for providing access to petrography facilities. The authors thank Jay Quade from University of Arizona and an anonymous reviewer for their thoughtful comments, which significantly strengthened the early version of the article, and Yeong Bae Seong, associate editor, for handling the article and revision suggestions.
SUPPLEMENTARY MATERIAL
The supplementary material for this article can be found at https://doi.org/10.1017/qua.2020.98.


