


INTRODUCTION
In northwestern (NW) Europe, the first millennium AD was characterised by large-scale landscape and vegetation changes, as well as significant cultural shifts. For example, in the Netherlands and Belgium, we see increased flooding in the coastal and delta region in the second half of the first millennium (e.g., Ervynck et al., Reference Ervynck, Baeteman, Demiddele, Hollevoet, Pieters, Schelvis, Tys, Van Strydonck and Verhaeghe1999; Toonen, Reference Toonen2013; Pierik et al., Reference Pierik, Cohen and Stouthamer2016). On a larger scale, across NW Europe the period AD 300 to 700 is characterised by widespread forest regeneration (e.g., Germany [Kalis et al., Reference Kalis, Karg, Meurers-Balke and Teunissen-van Oorschot2008], the Netherlands [Teunissen, Reference Teunissen1990], and the United Kingdom [Forster, Reference Forster2010]). The first millennium is further defined by a strong population decline after the fall of the Roman Empire, a period known as the Migration Period, and subsequent rapid increasing population numbers during the emergence of early medieval kingdoms (e.g., Germany [Dreßler et al., Reference Dreßler, Selig, Dörfler, Adler, Schubert and Hübener2006], France [Cheyette, Reference Cheyette2008], and NW Europe [Wickham, Reference Wickham2009]). Numerous climate reconstructions from the Northern Hemisphere indicate significant climatic shifts during this time interval (Larsen et al., Reference Larsen, Vinther, Briffa, Melvin, Clausen, Jones and Siggaard-Andersen2008; Ljungqvist, Reference Ljungqvist2010; Wanner et al., Reference Wanner, Solomina, Grosjean, Ritz and Jetel2011; Gräslund and Price, Reference Gräslund and Price2012; McCormick et al., Reference McCormick, Büntgen, Cane, Cook, Harper, Huybers and Litt2012; Büntgen et al., Reference Büntgen, Myglan, Ljungqvist, McCormick, Di Cosmo, Sigl and Jungclaus2016; Toohey et al., Reference Toohey, Krüger, Sigl, Stordal and Svensen2016), although these trends are less pronounced in global reconstructions (Rasmussen et al., Reference Rasmussen, Andersen, Svensson, Steffensen, Vinther, Clausen and Siggaard-Andersen2006; Vinther et al., Reference Vinther, Clausen, Johnsen, Rasmussen, Andersen, Buchardt and Dahl-Jensen2006; Wanner et al., Reference Wanner, Beer, Bütikofer, Crowley, Cubasch, Flückiger and Goosse2008). Available climate reconstructions for the Northern Hemisphere indicate that the first millennium AD can be divided into the Roman Warm Period (AD 1–300), the Dark Ages Cold Period (AD 300–800), and the Medieval Climate Anomaly or Medieval Warm Period (AD 800–1300; Ljungqvist, Reference Ljungqvist2010, and references therein).
Recent studies suggest a link between these landscape and vegetation changes, cultural shifts, and climatic variations (Tinner et al., Reference Tinner, Lotter, Ammann, Conedera, Hubschmid, van Leeuwen and Wehrli2003; McCormick et al., Reference McCormick, Büntgen, Cane, Cook, Harper, Huybers and Litt2012; Büntgen et al., Reference Büntgen, Myglan, Ljungqvist, McCormick, Di Cosmo, Sigl and Jungclaus2016; Pierik et al., Reference Pierik, Cohen and Stouthamer2016; Toohey et al., Reference Toohey, Krüger, Sigl, Stordal and Svensen2016). The extent of this influence, however, is unknown. The study of such climate impacts requires palaeoclimate reconstructions at annual to decadal resolution. However, detailed climate records covering the first millennium AD from many areas in NW Europe are at present not available.
Because the current climate in the whole of NW Europe is classified as a warm temperate, fully humid with warm summers (Cfb) after the Köppen and Geiger classification (Kottek et al., Reference Kottek, Grieser, Beck, Rudolf and Rubel2006), we assume that climate records from this wider region should to a larger extent reflect similar trends and thus might provide a first estimate for the climate fluctuations that occurred in regions from where climate records are not yet available.
In recent years, seven compilations of climate records have been established that include (parts of) NW Europe and cover the last two millennia. These studies, however, either cover large parts of the world or only a small region, and most compile proxy records for single climate parameters only and do not separate these into different seasons (Table 1). Thus, a review of high-resolution climate reconstructions differentiating the single climate parameters and seasons for NW Europe is still missing.
Table 1 Overview of regional and supraregional climate reconstruction review studies covering (parts of) northwestern Europe. BSi, biogenic silica; HC, historical records; NA, North Atlantic; NH, Northern Hemisphere; P, precipitation; s, summer; T, temperature; TA, testate amoebae; TOC, total organic content; TR, tree ring.

Most available climate reconstructions are based on single climate archives (e.g., chironomids, pollen, speleothems, Sphagnum mosses, testate amoebae, or tree rings) and/or represent small regions (Burns et al., Reference Burns, Matter, Frank and Mangini1998; Niggemann et al., Reference Niggemann, Mangini, Richter and Wurth2003; Büntgen et al., Reference Büntgen, Esper, Frank, Nicolussi and Schmidhalter2005; Mangini, Reference Mangini2005; Wilson et al., Reference Wilson, Luckman and Esper2005; Frisia et al., Reference Frisia, Borsato, Mangini, Spötl, Madonia and Sauro2006; Esper et al., Reference Esper, Frank, Büntgen, Verstege, Luterbacher and Xoplaki2007; Litt et al., Reference Litt, Schölzel, Kühl and Brauer2009; Kress et al., Reference Kress, Saurer, Siegwolf, Frank, Esper and Bugmann2010; Barber et al., Reference Barber, Brown, Langdon and Hughes2013). Because different proxies respond to different climatic factors and small local climate differences can occur, combining all available proxies on a continental scale may give the most complete overview of past regional climate change. In particular, terrestrial archives such as bogs, lake sediments, speleothems, and tree rings contain proxies that directly reflect climate. In addition, they allow for high-resolution reconstructions, and, therefore, they provide essential data to study short-term climate variations. To study the effects of climate on landscape, vegetation, and society, we analysed both temperature and precipitation records. Additionally, we addressed the seasonality of these climate parameters as reflected in the proxies. Helama et al. (Reference Helama, Jones and Briffa2017a) recently recommended this approach in their worldwide compilation of climate and environmental records covering the Dark Ages Cold Period. Furthermore, we critically evaluate site- and proxy-specific errors and the accuracy of each individual chronology per studied site.
The aim of this study is to assess whether proxy records across NW Europe reflect the pattern as described previously in climate trends during the first millennium AD and to evaluate which proxies provide the most accurate reconstructions of past climate fluctuations. For this purpose, we collected and compiled the existing climate reconstructions for this region (Fig. 1, Table 2), of which we evaluate the recorded changes in temperature and precipitation, as well as their mutual consistency. We included the northern Alps in this overview because of the availability of detailed reconstructions for this region, presuming that the fluctuations shown in these records were driven by the same climate as those recorded in proxies from adjacent areas north of the Alps.
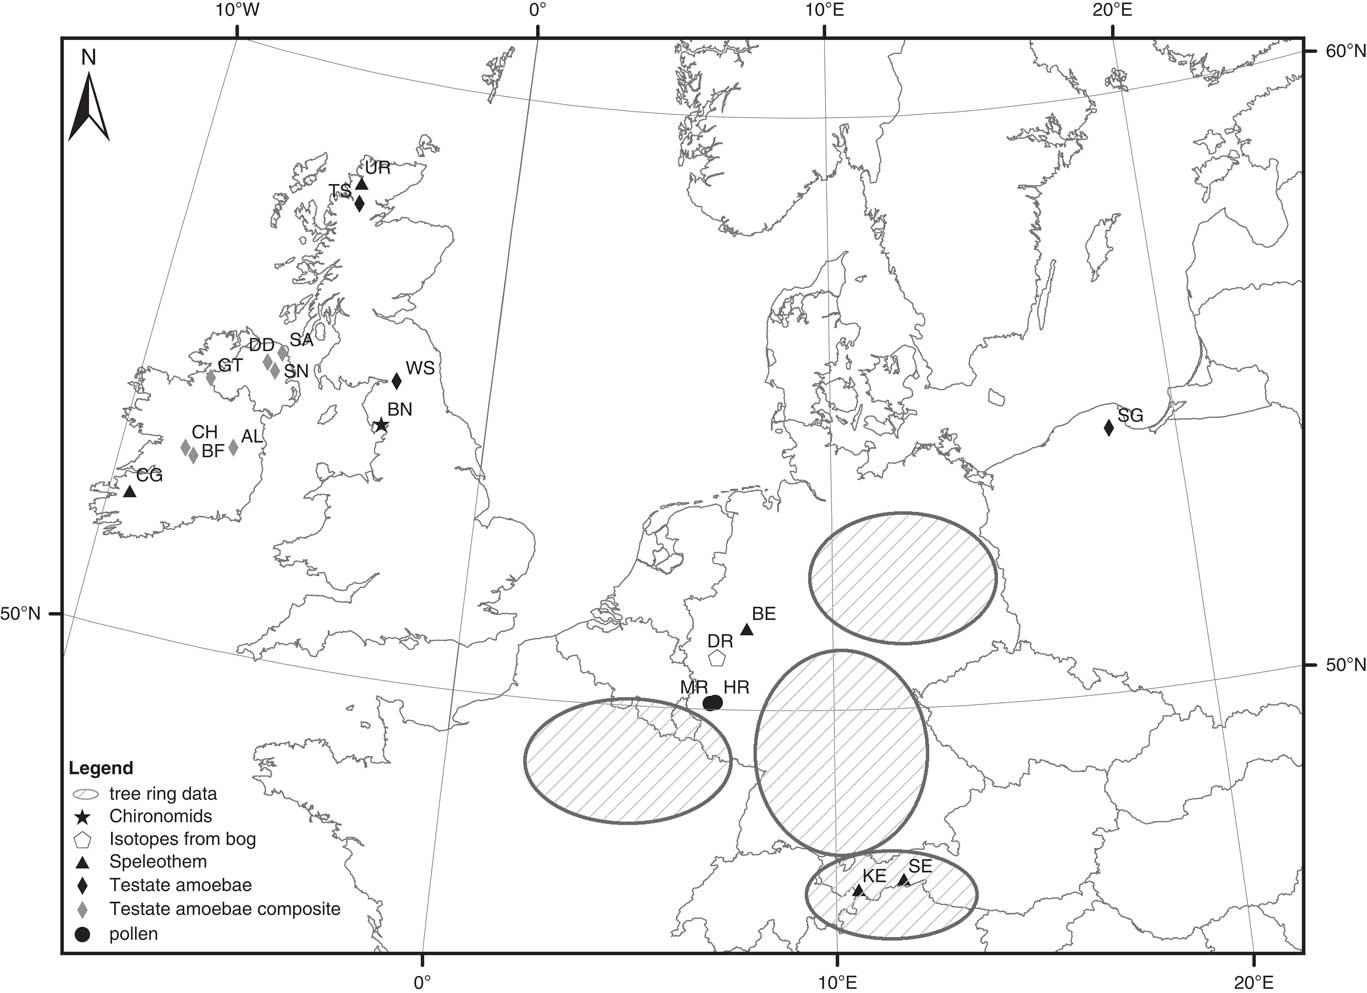
Figure 1 Map of northwestern Europe with locations of the different proxy records. See Table 2 for explanation of location codes.
Table 2 List of proxy records from terrestrial climate archives compiled in this study. AMJ, April, May, and June; DJF, December, January, and February; JJA, June, July, and August; m asl, meters above sea level.

a Part of composite record.
DATA COLLECTION AND DATA SETS
Data collection
The selection of climate reconstructions compiled in this study was based on the following criteria: (1) the proxy data were interpreted originally in terms of temperature or precipitation; (2) the sites are located in NW Europe or the northern Alps; (3) the records completely cover the time period of AD 1 to 1000; and (4) they have a temporal resolution of 50 yr or less. Chronological uncertainty was not a criterion for selection, because all records were dated. The chronological uncertainties range from 0 yr for tree rings and varve or layer counted chronologies to up to 520 yr 2σ-uncertainty for a 230Th/U age of one speleothem. The dating uncertainties of the different records will be discussed in detail in this study. We included compiled records when (nearly) all of the individual records used in the compilation met these criteria.
The climate reconstructions were compiled from literature and, if available, downloaded from public data servers such as the database of the National Oceanic and Atmospheric Administration (NOAA, National Centers for Environmental Information; http://www.ncdc.noaa.gov/data-access/paleoclimatology-data/datasets/climate-reconstruction [accessed 18 September 2013]; http://www.ncdc.noaa.gov/data-access/paleoclimatology-data/datasets/speleothem [accessed 8 December 2015]). If the data were not accessible through a public digital data repository, the authors were personally approached to provide the data series. The selected climate reconstructions are derived from (number of proxy records in parentheses) chironomids (1), pollen (6), speleothems (8), Sphagnum moss cellulose (1), testate amoebae (4), and tree rings (2). The records were separated into temperature and precipitation reconstructions, as well as into different seasons, using the interpretations of the related studies. For our compilation and comparison, we only used the records of inferred climate reported in previous studies; we did not reinterpret primary proxy data to a climate signal.
To enable comparison, each climate record was normalised by first subtracting the mean value of the first millennium AD and then dividing by the standard deviation of the original values covering this millennium. Furthermore, a fast Fourier transformation filter was used to perform a smoothing of the data to remove outliers and better visualise general trends. Büntgen et al. (Reference Büntgen, Tegel, Nicolussi, McCormick, Frank, Trouet and Kaplan2011) used a 60 yr smoothing filter, which was also applied to other unsmoothed records. Smoothing was not performed for records with a lower mean resolution than 25 yr. Both the normalised and smoothed data series were plotted. Shifts from warm to cold and from wet to dry were dated by defining the point where the curve crosses the AD 1 to 1000 mean value.
Uncertainties in the timing of these shifts thus depend on the dating uncertainties of the original proxy records. Subsequently, the resulting curves were compared visually. The different temperature records were subdivided into summer, winter, and annual temperature reconstructions. The precipitation records were subdivided into winter, spring, and annual precipitation reconstructions. This strategy was adopted because the selected records are both qualitative as well as quantitative records and are presented with different absolute values, some contain isotope data, some are calculated water-table depth, and others are absolute reconstructions for the different climate parameters. For qualitative records, which do not reconstruct absolute climate parameters, it is not known to what extent the amplitude of the signal reflects significant absolute temperature or precipitation shifts. If the data were compared on the basis of deviation of the mean and exceeding the standard deviation, it would be possible to under- or overestimate the climate trends.
The chronology or age-depth models of the original data sets were used to determine the end and start dates of identified climate phases. The maximum measuring error of the dates used for the construction of these age-depth models was used as an indication of the worst uncertainty in the chronology of the fluctuations. Age-depth models based on multiple dating techniques and especially absolute dating methods such as tephrochronology were assumed to be more reliable than age-depth models constructed using single dating techniques (following Swindles et al., Reference Swindles, Lawson, Matthews, Blaauw, Daley, Charman and Roland2013).
Data sets
Chironomids
One chironomid-inferred temperature reconstruction fulfils the requirements outlined under Data collection. This is a record from Bigland Tarn (Cumbria, UK; Fig. 1, Table 2; Supplementary Material) analysed by Barber et al. (Reference Barber, Brown, Langdon and Hughes2013), which constitutes a 5000 yr summer temperature record. The entire record was dated using 12 accelerator mass spectrometry 14C dates, and the age-depth model was constructed by linear interpolation between these dates. Absolute summer temperatures were calculated using the Norwegian transfer function of Brooks and Birks (Reference Brooks and Birks2000).
Pollen
We identified six suitable pollen-inferred climate records from two lakes in western Germany, Meerfelder Maar and Holzmaar, both located in the West Eifel volcanic field (Fig. 1, Table 2; Supplementary Material). Litt et al. (Reference Litt, Schölzel, Kühl and Brauer2009) collected two 10,400- and 11,000-yr-long varved records from these lakes, from which high-resolution pollen records were established. The chronologies were based on varve counting and tephrochronology and were corrected by a comparison with calibrated radiocarbon dates (Zolitschka, Reference Zolitschka1998; Brauer et al., Reference Brauer, Endres and Negendank1999; Zolitschka et al., Reference Zolitschka, Brauer, Negendank, Stockhausen and Lang2000). These two records each provide mean June, July, and August (JJA) temperature; mean December, January, and February (DJF) temperature; and annual precipitation reconstructions.
Speleothems
Speleothem records are available from Uamh an Tartair Cave (Scotland; Baker et al., Reference Baker, Hellstrom, Kelly, Mariethoz and Trouet2015), Crag Cave (Ireland; McDermott et al., Reference McDermott, Mattey and Hawkesworth2001), Bunker Cave (Germany; Fohlmeister et al., Reference Fohlmeister, Schröder-Ritzrau, Scholz, Spötl, Riechelmann, Mudelsee and Wackerbarth2012), Spannagel Cave (Austria; Mangini et al., Reference Mangini, Spötl and Verdes2005), and Klapferloch Cave (Austria; Boch and Spötl, Reference Boch and Spötl2011). The speleothems were dated with the 230Th/U method using thermal ionisation mass spectrometry or multicollector inductive coupled plasma mass spectrometry (MC-ICPMS; Richards and Dorale, Reference Richards and Dorale2003; Scholz and Hoffmann, Reference Scholz and Hoffmann2008), as well as layer counting when annual layers occurred in the speleothems.
Uamh an Tartair cave in northwest Scotland provides a mean bandwidth record from four stalagmites (Fig. 1, Table 2; Supplementary Material; Baker et al., Reference Baker, Hellstrom, Kelly, Mariethoz and Trouet2015). The bandwidths in this record show a strong negative correlation with precipitation during the period of instrumental climate data, indicating bandwidth to be a precipitation proxy. Moreover, the amount of precipitation at the location of the cave is influenced by winter North Atlantic Oscillation (NAO), making winter the dominant season for precipitation (Proctor et al., Reference Proctor, Baker and Barnes2002).
Crag Cave in southwestern Ireland provides a palaeotemperature record based on δ18O analyses of speleothem CC3 (Fig. 1, Table 2; Supplementary Material). The mean measuring resolution is 12 yr. Lower δ18O values appear during colder conditions and higher δ18O values during warmer conditions (McDermott et al., Reference McDermott, Mattey and Hawkesworth2001).
Speleothems from Bunker Cave, in western Germany, provide three proxy records based on Mg/Ca ratio, δ13C, and δ18O measurements (Fig. 1, Table 2; Supplementary Material; Fohlmeister et al., Reference Fohlmeister, Schröder-Ritzrau, Scholz, Spötl, Riechelmann, Mudelsee and Wackerbarth2012). The Mg/Ca ratio and δ13C records have been measured on a single speleothem with a mean measuring resolution of 3 yr. The third proxy record is a combined record of δ18O measurements, from two different speleothems, which have an average measuring resolution of 2 yr. Evapotranspiration in the summer months leads to a reduced contribution of summer rain to the water reservoir in the epikarst, resulting in a winter-dominated signal in the drip water. Furthermore, only interannual to decadal changes are recorded in the speleothems because the water is very well mixed in the epikarst (Riechelmann et al., Reference Riechelmann, Schröder-Ritzrau, Scholz, Fohlmeister, Spötl, Richter and Mangini2011). Therefore, Mg/Ca ratios and the δ13C record of the speleothem are decadal winter-dominated precipitation proxies with higher Mg/Ca ratios indicating drier conditions and vice versa. Also, the δ13C record shows higher values during drier conditions, and lower values during wetter conditions. The δ18O in the speleothems is a combined winter-dominated temperature and precipitation proxy, showing cold and dry conditions as high values, and warm and wet conditions as low values (Fohlmeister et al., Reference Fohlmeister, Schröder-Ritzrau, Scholz, Spötl, Riechelmann, Mudelsee and Wackerbarth2012).
Spannagel Cave in the northern Austrian Alps provides a palaeotemperature record based on δ18O measurements from a single stalagmite, which were measured with an average resolution of 3 yr (Fig. 1, Table 2). Based on correlations between lower alpine-winter temperatures and higher δ18O values in the speleothem (and vice versa), the δ18O of the speleothem has been identified as a winter temperature proxy (Mangini et al., Reference Mangini, Spötl and Verdes2005; Vollweiler et al., Reference Vollweiler, Scholz, Mühlinghaus, Mangini and Spötl2006). The age-depth model has been constructed by linear interpolation of the 230Th/U dates.
Klapferloch Cave, also in the northern Austrian Alps, provides δ13C and δ18O records derived from one annually laminated flowstone (Fig. 1, Table 2; Supplementary Material). Correspondence on a decadal time scale is observed between changing δ13C and δ18O values and the amount of precipitation recorded at the nearby meteorologic station Naudes. Therefore, the δ13C and δ18O values of the flowstone can be used as proxies for precipitation, providing a multiannual signal. Lower δ13C and δ18O values are the result of increased precipitation (and vice versa).
Sphagnum mosses
One record of δ13Ccellulose from Sphagnum moss cellulose is available from Dürres Maar in western Germany (Fig. 1, Table 2; Supplementary Material; Moschen et al., Reference Moschen, Kühl, Peters, Vos and Lücke2011). This radiocarbon dated record has a mean resolution of 6 yr. The age-depth model was constructed by linear interpolation between the radiocarbon dates. The bog sequence covering AD 1 to 1450 completely consists of Sphagnum capillifolium var. rubellum, whereas the upper part of the core mainly contains Sphagnum magellanicum (Moschen et al., Reference Moschen, Kühl, Rehberger and Lücke2009). Both species show a dependency of their δ13Ccellulose on growing season temperature (Ménot and Burns, Reference Ménot and Burns2001). Lower δ13Ccellulose values indicate warmer conditions, and higher values point to colder conditions. The transition to higher δ13Ccellulose values coincides with an increase in peat accumulation rate, which could be related to a high water table (Moschen et al., Reference Moschen, Kühl, Peters, Vos and Lücke2011). Therefore, reconstructed colder phases were probably also wetter phases.
Testate amoebae
Four testate-amoebae records were included in this review: single records from Scotland (Blundell and Barber, Reference Blundell and Barber2005), northern England (Barber and Langdon, Reference Barber and Langdon2007), and northern Poland (Galka et al., Reference Galka, Miotk-Szpiganowicz, Goslar, Jesko, van der Knaap and Lamentowicz2013) and a composite record from Ireland (Swindles et al., Reference Swindles, Lawson, Matthews, Blaauw, Daley, Charman and Roland2013).
Swindles et al. (Reference Swindles, Lawson, Matthews, Blaauw, Daley, Charman and Roland2013) have compiled a water-table depth record based on seven testate-amoebae records from Ireland (Fig. 1, Table 2; Supplementary Material). These records are from Ardkill, Ballyduff, Cloonoolish, Dead Island, Glen West, Slieveanorra, and Sluggan. The chronologies were constructed by radiocarbon dating, multiple tephra-layer analyses, and spherical-carbon particles analyses. The testate-amoebae records were transferred to water-table depths using the European (ACCROTELM) transfer function (Charman and Blundell, Reference Charman and Blundell2007). Using a locally weighted regression model with bootstrapping, these single records were used to construct a best estimate, composite palaeoclimatic reconstruction.
Tore Hill Moss, a raised bog in Scotland (Fig. 1, Table 2; Supplementary Material), was analysed for macrofossils, testate amoebae, and humification rates by Blundell and Barber (Reference Blundell and Barber2005). The chronology is based on radiocarbon dates and the Glen Garry tephra layer, which had been dated at the time of the study to 2139 ± 61 BP, corresponding to approximately AD 190 (Dugmore et al., Reference Dugmore, Larsen and Newton1995). The entire testate-amoebae record covers the period 850 BC to AD 2000. The age-depth model was based on a linear model covering the entire core, assuming a constant growth rate of the peat. Depth to water table was derived from the testate-amoebae assemblage using the transfer function of Woodland et al. (Reference Woodland, Charman and Sims1998).
Walton Moss, an ombrotrophic bog located in northern England (Fig. 1, Table 2; Supplementary Material), was analysed by Barber and Langdon (Reference Barber and Langdon2007). The chronology was constructed using radiocarbon dating and the Glen Garry tephra. The age-depth model was constructed by three linear regressions, which were related to changes in the macrofossil composition and possible changes in peat growth. The record covers the period 1050 BC to AD 1950. The transfer function of Woodland et al. (Reference Woodland, Charman and Sims1998) was used to convert the testate-amoebae assemblages to bog surface wetness (BSW).
In northern Poland, one ombrotrophic bog was analysed, Stążki bog (Fig. 1, Table 2; Supplementary Material), which is a continental raised bog, differing from the aforementioned Atlantic raised bogs in NW Europe in species composition, size, and shape (Charman et al., Reference Charman, Barber, Blaauw, Langdon, Mauquoy, Daley, Hughes and Karofeld2009). The chronology of Stążki bog is based on radiocarbon dates and covers the period 5500 BC to AD 1250. The age-depth model has been constructed using a free-shape age-depth model fitted through the radiocarbon dates. The testate-amoebae assemblages were converted to depth to water table using the northern Poland transfer function (Lamentowicz and Mitchell, Reference Lamentowicz and Mitchell2005; Lamentowicz et al., Reference Lamentowicz, Cedro, Galka, Goslar, Miotk-Szpiganowicz, Mitchell and Pawlyta2008). The clear correlation between pollen and testate amoebae in this record indicates a common forcing, probably climate (Galka et al., Reference Galka, Miotk-Szpiganowicz, Goslar, Jesko, van der Knaap and Lamentowicz2013).
Tree rings
Climate reconstructions from tree-ring width covering the period from AD 1 to 1000 are rare, in particular from NW Europe. Two reconstructions based on tree-ring width are available, one for JJA temperature from the Austrian Alps and adjacent areas and one for April, May, and June (AMJ) precipitation derived from wood from northeastern France and northeastern and southeastern Germany (Fig. 1, Table 2; Supplementary Material; Büntgen et al., Reference Büntgen, Tegel, Nicolussi, McCormick, Frank, Trouet and Kaplan2011). The past 2500 yr JJA temperature was reconstructed from 1809 stone pine (Pinus cembra) and 457 European larch (Larix decidua) ring-width series from subfossil, historical, and living material from high-elevation sites. The past 2500 yr AMJ precipitation was reconstructed from 7284 ring-width series from subfossil, archaeological, historical, and recent oaks [Quercus robur L. and Quercus petraea (Matt.) Liebl.]. Both reconstructions were calibrated using recent meteorologic data (Büntgen et al., Reference Büntgen, Tegel, Nicolussi, McCormick, Frank, Trouet and Kaplan2011).
RESULTS
Temperature reconstructions
Summer temperature
Five records represent summer temperature variability (Fig. 2). The proxy records cover a large part of NW Europe ranging in west–east direction from western England to western Germany and in north–south direction from central England to the Alps (Fig. 1). Except for the two pollen-inferred summer temperature records (Fig. 2c and d), all records were interpreted as reflecting summer temperature variations. The pollen-based records show minimal variations and/or no clear pattern during the period AD 1 to 1000 (Fig. 2c and d). This may be because of the low resolution of these records, 45 and 28 yr, respectively. Other contributing factors could be a low sensitivity of the pollen assemblage to small temperature changes during a relatively warm period and/or the impact of anthropogenic influences on the vegetation. The remaining records (Fig. 2a, b, and e) show similar summer temperature patterns within dating uncertainties of 80 to 190 yr, with higher summer temperatures at the start of the studied period, a change towards overall lower temperatures between AD 250 and 470, and a shift towards higher temperatures between AD 650 and 800. This is in good agreement with the starting and ending dates compiled by Helama et al. (Reference Helama, Jones and Briffa2017a), AD 395 and AD 764 for the Dark Ages Cold Period. Around AD 930, the chironomid record (Fig. 2a) shows a second period with lower summer temperatures, which is also reflected around AD 910 in the Sphagnum δ13Ccellulose record (Fig. 2b; albeit with only slightly above average values, consider the inverted y-axis). The tree-ring record from the Alps also shows a second colder period around AD 830 (Fig. 2e). The low temporal resolution of the chironomid record (about 44 yr) in addition to the overall dating uncertainties prevents accurate dating of the short colder period (Fig. 2a). Nevertheless, this chironomid record from Bigland Tarn corresponds well with two other chironomid records from Lochnagar and Talkin Tarn (Langdon et al., Reference Langdon, Barber and Lomas-Clarke2004; Dalton et al., Reference Dalton, Birks, Brooks, Cameron, Evershed, Peglar, Scott and Thompson2005), which do not meet the criteria outlined in Data collection and, therefore, are not included in this review. The differences between the timing of the onset of the colder and the warmer periods among the different records are most probably caused by dating uncertainties in the chironomid and Sphagnum δ13Ccellulose records. The chronology of the tree-ring data set is very robust, because of annual ring counting and its connection to present-day chronologies. The variations of the initiation dates are within the range of the dating uncertainties, making it likely that all records reflect the same cold period most accurately dated between AD 300 and 650 in the tree-ring data. It is, however, possible that the differences in initiation and end dates between the records are caused by an actual difference in timing and duration of this cold phase across Europe.

Figure 2 Summer temperature reconstructions arranged from north to south. All records are normalised to the period AD 1 to 1000; 1σ standard deviations are marked with grey lines; dating points and error bars are given in the lower part of the panels. Red colour indicates warmer temperatures; and blue, colder temperatures. (a) Chironomid-based summer temperature reconstruction (Bigland Tarn, England; Barber et al., Reference Barber, Brown, Langdon and Hughes2013). (b) Growing season temperature reconstruction from δ13C of Sphagnum cellulose (inverse), 10 point low-pass filter (Dürres Maar, Germany; Moschen et al., Reference Moschen, Kühl, Peters, Vos and Lücke2011). (c) Pollen-based June, July, and August (JJA) temperature (Holzmaar, Germany). (d) Pollen-based JJA temperature (Meerfelder Maar, Germany; Litt et al., Reference Litt, Schölzel, Kühl and Brauer2009). (e) Tree-ring–based JJA temperature, 60 yr low-pass filter (Austrian Alps and adjacent areas; Büntgen et al., Reference Büntgen, Tegel, Nicolussi, McCormick, Frank, Trouet and Kaplan2011). VPDB, Vienna Pee Dee belemnite. (For interpretation of the references to colour in this figure legend, the reader is referred to the web version of this article.)
We can conclude that these reconstructions show warmer summer temperatures during the Roman Warm Period, colder summer temperatures during the Dark Ages Cold Period, and again warmer summer temperatures at the beginning of the Medieval Climate Anomaly (Fig. 2a, b, and e).
Winter temperature
Three records from western Germany, two pollen and one speleothem record, and one speleothem record from the northern Alps show winter temperature variability (Figs. 3 and 4). The two pollen-inferred winter temperature records do not show pronounced temperature trends in the period AD 1 to 1000 (Fig. 3a and b). However, the pollen-inferred record from Holzmaar does indicate higher winter temperatures for the period AD 1 to 250, colder conditions until AD 550, and warmer conditions until AD 1000 (Fig. 3a). The winter temperatures derived from the Meerfelder Maar pollen-based record show small anomalies in the period AD 1 to 600. From AD 600 onwards, the values show larger fluctuations, with a tendency towards higher temperatures (Fig. 3b).

Figure 3 Winter temperature reconstructions arranged from North to South. All records are normalised to the period AD 1 to 1000; 1σ standard deviations are marked with grey lines; dating points and error bars are given in the lower part of the panel. Red colour indicates warmer temperatures; and blue, colder temperatures. (a) Pollen-based December, January, and February (DJF) temperature (Holzmaar, Germany). (b) Pollen-based DJF temperature (Meerfelder Maar, Germany; Litt et al., Reference Litt, Schölzel, Kühl and Brauer2009). (c) δ18O record of a speleothem (inverse), 20-point low-pass filter (Spannagel Cave, Austrian Alps; Mangini et al., Reference Mangini, Spötl and Verdes2005). VPDB, Vienna Pee Dee belemnite. (For interpretation of the references to colour in this figure legend, the reader is referred to the web version of this article.)

Figure 4 Winter temperature and precipitation reconstruction. The record is normalised to the period AD 1 to 1000; 1σ standard deviations are marked with grey lines; dating points and error bars are given in the lower part of the panel. Red colour indicates warm and wet conditions; and blue, cold and dry conditions. δ18O record of two speleothems (inverse), 30-point low-pass filter (Bunker Cave, Germany; Fohlmeister et al., Reference Fohlmeister, Schröder-Ritzrau, Scholz, Spötl, Riechelmann, Mudelsee and Wackerbarth2012). VPDB, Vienna Pee Dee belemnite. (For interpretation of the references to colour in this figure legend, the reader is referred to the web version of this article.)
The winter temperature record from Spannagel Cave is largely a reversal of the summer temperature trend. Cold conditions are inferred for AD 1 to 460 with a slightly warmer period around AD 370 (Fig. 3c). Between AD 470 and 690, winter temperatures were higher, whereas summer temperatures were lower. A second period of lower winter temperature anomalies was reconstructed for AD 690 to 800, whereas from AD 800 to 1000 reconstructed temperatures increased. This second cold phase may be coeval to a colder period in the summer temperature reconstructions dated at AD 830–900. It is also possible that the entire record is a reversal of the summer temperature and that the higher temperatures can be linked to this cold phase in summer temperature from AD 800 onwards (Figs. 2a, b, and e; 3c). The dating uncertainty of the Spannagel record is between 70 and 130 yr, making both explanations possible. The contrasting temperature pattern between summer and winter might be explained by a stronger seasonality during the Roman Warm Period with warmer summers and colder winters, followed by a lower seasonality during the Dark Ages Cold Period with colder summers and warmer winters. During the Medieval Climate Anomaly, both seasons were possibly warmer. Unfortunately, we have only one unverified record for winter temperature; therefore, its representability as a superregional signal cannot be verified. The Spannagel record is located in the northern Alps and could therefore be influenced by a more alpine climate. Still, the high-alpine Spannagel Cave record has been linked to the NAO indicating that this record is predominantly forced by NW European climate system. The link to NAO also indicates that precipitation could have an influence on the δ18O signal of the stalagmite as well (Mangini et al., Reference Mangini, Spötl and Verdes2005).
When compared to the other temperature reconstructions, the Bunker Cave δ18O record shows most similarities with summer temperature reconstructions, although it is originally marked as a winter precipitation and temperature proxy (Fig. 4). The dating uncertainties of this record are very high with a minimum of 280 yr and a maximum of 520 yr. Therefore, the complete record could, in the worst case, be shifted for half of the period of interest. This record shows climatic conditions ranging from cold and dry to average conditions between AD 1 and 720. These winter climate conditions are in agreement with the winter temperature reconstruction from Spannagel Cave (Figs. 3c and 4; Mangini et al., Reference Mangini, Spötl and Verdes2005). The change to warm and wet climate conditions around AD 720 is in good agreement with the summer temperature reconstructions (Figs. 2a, b, and e; 4). The short cold and dry period around AD 900 is also visible in the summer temperature reconstructions (Fig. 2a, b, and e). A lagging effect, in addition to the dating uncertainties, in the speleothem record of Bunker Cave is possible because of buffering and mixing of the rainwater signal in the epikarst (Riechelmann et al., Reference Riechelmann, Schröder-Ritzrau, Scholz, Fohlmeister, Spötl, Richter and Mangini2011, Reference Riechelmann, Deininger, Scholz, Riechelmann, Schröder-Ritzrau, Spötl, Richter, Mangini and Immenhauser2013). However, the dating uncertainties for this record are substantial, which hampers a detailed correlation to the other records.
The winter temperature records are not conclusive and either may confirm the trends in the summer temperature records or point to a reversal.
Annual temperature
The δ18O record of the speleothem from Crag Cave in Ireland (McDermott et al., Reference McDermott, Mattey and Hawkesworth2001) is considered as a proxy for annual temperature variability. This record agrees well with the summer temperature pattern with a cold phase from AD 70 to 770 and a slightly warmer period around AD 400 (Figs. 2a, b, and e; 5). The onset of the colder period occurs approximately 200 yr earlier in the record from Crag Cave compared with the summer temperature reconstructions. This might be because of poor age control, with only one dating point available in this part of the speleothem record. Another cause of this difference might be that this cold phase started earlier in Ireland than for example in western Germany (Fig. 2b) and the Alps (Fig. 2e). This is, however, contradicted by the chironomid record from England, which shows the onset of the cold phase only slightly earlier at AD 250, which is in the range of age uncertainty of the other summer temperature reconstructions (Fig. 2b and e). The end of the cold phase and the change to warmer conditions at AD 780 is placed later than the summer temperature reconstructions. Although a later end date was also found in winter temperature reconstructions from the stalagmite records of Spannagel Cave in Austria (Fig. 3c) and Bunker Cave in Germany (Fig. 4), the temperature record from Crag Cave shows large variations and only a slight decrease in temperature with a distinct drop at AD 240 to 380. The temperature record from Crag Cave might be influenced by local factors and therefore does not represent a supraregional temperature signal explaining the deviation in timing and amplitude compared with the other reconstructions.
We conclude that the overall changes in reconstructed annual temperature agree with those of the summer temperatures. The differences in the timing of the onset of cold and warm phases are most probably because of the poor age control of this record.
Precipitation reconstructions
Winter precipitation
Three speleothem records were interpreted as showing winter precipitation variability (Fig. 6). The record from Scotland (Fig. 6a) shows precipitation conditions fluctuating around average values from AD 1 to 240. Afterwards, a pronounced wet phase from AD 240 to 580 is observed, which is followed by a dry phase from AD 580 to 910 (Fig. 6a). The dry phase is interrupted by a wetter spell from AD 740 to 770. Wetter conditions were reconstructed again from AD 910 to 1000. The age control of this record is very robust because of layer counting, despite the maximum uncertainty of 402 yr in the 230Th/U dating (Fig. 6a).
The two records from the same stalagmite of Bunker Cave were originally interpreted as showing the same precipitation signal, whereas the smoothed curves show some contradicting patterns (Fig. 6b and c). The Mg/Ca record is interpreted as showing drier conditions from AD 1 to 300, whereas a wet phase (based on a lower Mg/Ca ratio, please consider the inverse y-axis) around AD 190 is not represented in the smoothed curve of the Mg/Ca record. This wet phase is still visible in the smoothed curve of the δ13C record, where this wet phase is visible from AD 120 to 290. Slightly wetter conditions were interpreted between AD 300 and 400 in the Mg/Ca record. A pronounced dry phase occurs between AD 400 to 760 in the Mg/Ca record and between AD 300 and 760 in the δ13C record. Between AD 760 and 900, both records show fluctuations around the average, and from AD 900 onwards, both records indicate wetter conditions. The dating uncertainties for these records are, with a minimum of 280 yr and a maximum of 520 yr, rather large. Despite these dating uncertainties, the overall trends of these records correspond with the record from Scotland, where average to wetter conditions were identified between AD 1 and 580 (Fig. 6a). The following drier period is visible in all records, placed at AD 300 to 760 in Germany and AD 580 to 910 in Scotland. Additional wetter conditions (AD 740 to 770) are visible in the record from Scotland and are also indicated in the other records with lower Mg/Ca ratios and δ13C values around AD 780 (consider the inverse y-axis). The last wet phase in the first millennium AD (AD 900–1000) similarly shows as good correspondence across all three records. The most probable reason for the later beginning of the dry phase in the record from Scotland is that the Uamh an Tartair Cave is covered by a bog, which causes a lag and smoothing effect, but also a higher sensitivity to dry periods (Proctor et al., Reference Proctor, Baker, Barnes and Gilmour2000, Reference Proctor, Baker and Barnes2002; Fuller et al., Reference Fuller, Baker, Fairchild, Spötl, Marca-Bell, Rowe and Dennis2008). We conclude that the record from Scotland is the most reliable record for winter precipitation because of robust age control through layer counting and its high resolution despite the buffering of the bog above the cave.
Spring precipitation
The tree-ring width record from eastern France and eastern and southern Germany (Büntgen et al., Reference Büntgen, Tegel, Nicolussi, McCormick, Frank, Trouet and Kaplan2011) shows AMJ precipitation (Fig. 7). This reconstruction is in relatively good agreement with the winter precipitation record from Uamh an Tartair Cave in Scotland (Figs. 6a and 7). Both records show predominantly wet conditions until AD 460 (tree-rings) and AD 580 (speleothem), respectively (Figs. 6a and 7). An additional dry phase from AD 220 to 350 in the tree-ring record is also visible in higher values (consider the inverse y-axis) around AD 210 in the speleothem record from Scotland (Baker et al., Reference Baker, Hellstrom, Kelly, Mariethoz and Trouet2015). A second dry phase lasted from AD 460 to 710 in the tree-ring record, and from AD 580 to 740 in the winter precipitation record from Scotland. This lag could be because of dating uncertainties or, more probably, to smoothing because of mixing and buffering effects in the karst aquifers and the bog-related lag in the speleothem record (Proctor et al., Reference Proctor, Baker, Barnes and Gilmour2000, Reference Proctor, Baker and Barnes2002; Fuller et al., Reference Fuller, Baker, Fairchild, Spötl, Marca-Bell, Rowe and Dennis2008). The last part of the millennium from AD 710 onwards is reconstructed as wet in the tree-ring record.
Annual precipitation
Eight records were interpreted as showing annual precipitation variability based on testate amoebae, pollen, and speleothems (Fig. 8). The two precipitation reconstructions derived from pollen from Holzmaar and Meerfelder Maar were identified as unreliable precipitation variability records for the period of AD 1 to 1000 (Fig. 8d and e). These records give a pronounced underestimation of the precipitation in recent times (Litt et al., Reference Litt, Schölzel, Kühl and Brauer2009).
The two British and one Irish testate-amoebae records show contradicting patterns (Fig. 8a–c), which cannot be explained by their age uncertainties only. It is assumed that testate-amoebae records on depth to water table mainly reflect changes in precipitation. It is, however, possible that the depth to water table is determined by changes in evapotranspiration and, therefore, reflects changes in temperature as well. It was also suggested by Barber and Langdon (Reference Barber and Langdon2007) that on longer time scales BSW was more closely controlled by temperature than by precipitation. This effect is probably stronger during warm periods when increased precipitation is counteracted by increased evapotranspiration.
The composite record from Ireland shows drier conditions from AD 1 to 500 (Fig. 8a). For the second half of the first millennium AD, this record shows wetter conditions. In the temperature reconstructions, the first period is inferred as relatively warm. The record from Walton Moss (Fig. 8c) also shows more similarities to the summer temperature reconstructions than to the other precipitation records. However, the speleothem record from Crag Cave in Ireland (Fig. 5) indicates lower temperatures, but the age control of this record is poor, with only one 230Th/U age in this millennium. Therefore, a conclusion about drier and colder or warmer temperatures is not straightforward for this time period. The strong fluctuations in the record from Tore Hill Moss (Fig. 8b) might also indicate local controls or a mixed response. During the reconstructed dry phase from AD 240 to 370 in this record, there is evidence that local fires occurred. From AD 430 to 820, there are shifts to wetter conditions while the peat accumulation rate was high. The dry phase reconstructed for the period AD 240 to 370 has been correlated by Blundell and Barber (Reference Blundell and Barber2005) to the Roman Warm Period. The period AD 430 to 820, which shows several wet shifts and overall high accumulation rates of peat, has been linked to the Dark Ages Cold Period (Blundell and Barber, Reference Blundell and Barber2005; Ljungqvist, Reference Ljungqvist2010). The last two wet shifts in this time frame (approximately AD 540 and AD 800) are also found in other peat records in Britain and Ireland: Bolton Fell Moss (Barber, Reference Barber1981), Burnfoothill Moss (Tipping, Reference Tipping1995), Talla Moss (Chambers et al., Reference Chambers, Barber, Maddy and Brew1997), and Fallahogy Bog (Barber et ontinuedal., Reference Barber, Maddy, Rose, Stevenson, Stoneman and Thompson2000; Blundell and Barber, Reference Blundell and Barber2005). Additional evidence for this double wet shift is found in a tree-ring record from Scandinavia (Briffa et al., Reference Briffa, Jones, Bartholin, Eckstein, Schweingruber, Karlén, Zetterberg and Eronen1992; Blundell and Barber, Reference Blundell and Barber2005). The last dry phase of the record is linked to the Medieval Climate Anomaly that was also recognized in Temple Hill Moss (Langdon et al., Reference Langdon, Barber and Hughes2003; Blundell and Barber, Reference Blundell and Barber2005). None of aforementioned records was included separately in this review because of too low resolution for the investigated time interval (testate amoebae) or because of not covering the complete time span (tree-ring record). We conclude that especially during warm periods, the BSW or depth to water table is strongly influenced by temperature and/or other regional environmental factors; therefore, testate amoebae should be used with caution for precipitation reconstruction, which was also discussed by Charman et al. (Reference Charman, Brown, Hendon and Karofeld2004).

Figure 5 Annual temperature reconstruction. The record is normalised to the period AD 1 to 1000; 1σ standard deviations are marked with grey lines; dating point and error bars are given in the lower part of the panel. Red colour indicates warmer temperatures; and blue, colder temperatures. δ18O record from a speleothem, 5-point low-pass filter (Crag Cave, Ireland; McDermott et al., Reference McDermott, Mattey and Hawkesworth2001). VPDB, Vienna Pee Dee belemnite. (For interpretation of the references to colour in this figure legend, the reader is referred to the web version of this article.)
The δ18O and δ13C records from Klapferloch Cave and the water-table depth reconstruction from Stążki Bog show wet climate conditions for AD 1 to 440 and AD 1 to 350, respectively (Fig. 8f–h), which corresponds well with the winter and spring precipitation reconstructions (Figs. 6a and 7). The two records from Klapferloch Cave show precipitation conditions varying around average conditions in the period AD 440 to 700 and drier conditions from AD 700 to 1000 (Fig. 8f and g). This contradicts the spring and winter precipitation reconstructions (Figs. 6a and 7). The contradicting pattern in the speleothem records from Klapferloch Cave might be because of dating uncertainties with a maximum of 170 yr and probably to buffering in the karst aquifer (Boch and Spötl, Reference Boch and Spötl2011). The water-table depth reconstruction from Stążki Bog further shows drier conditions from AD 350 to 790 followed by wetter conditions from AD 790 to 1000 (Fig. 8h). This corresponds, considering dating uncertainties, with the winter and spring precipitation records (Figs. 6a and 7). Therefore, this testate-amoebae record mostly seems to have been influenced by precipitation.

Figure 6 Winter precipitation reconstructions from west to east. The records are normalised to the period AD 1 to 1000; 1σ standard deviations are marked with grey lines; dating points and error bars are given in the lower part of the panel. Red colour indicates dry conditions; and blue, wet conditions. All records are inverse. (a) Band width record smoothed with a 60 yr low-pass filter of four speleothems (Uamh an Tartair, Scotland; Baker et al., Reference Baker, Hellstrom, Kelly, Mariethoz and Trouet2015). (b) Mg/Ca-ratio record smoothed with a 20-point low-pass filter of a speleothem. (c) δ13C record smoothed with a 20-point low-pass filter of a speleothem (both Bunker Cave, Germany; Fohlmeister et al., Reference Fohlmeister, Schröder-Ritzrau, Scholz, Spötl, Riechelmann, Mudelsee and Wackerbarth2012). VPDB, Vienna Pee Dee belemnite. (For interpretation of the references to colour in this figure legend, the reader is referred to the web version of this article.)

Figure 7 Spring precipitation reconstruction. The record is normalised to the period AD 1 to 1000, 1σ standard deviations are marked with grey lines. Red colour indicates dry conditions; and blue, wet conditions. April, May, and June (AMJ) precipitation reconstruction smoothed with a 60 yr low-pass filter from tree-ring width (eastern France, eastern and southern Germany; Büntgen et al., Reference Büntgen, Tegel, Nicolussi, McCormick, Frank, Trouet and Kaplan2011). (For interpretation of the references to colour in this figure legend, the reader is referred to the web version of this article.)

Figure 8 Annual precipitation reconstructions from west to east. The records are normalised to the period AD 1 to 1000, 1σ standard deviations are marked with grey lines; dating points and error bars are given in the lower part of the panels. Red colour indicates dry conditions; and blue, wet conditions. Records of panels a, b, f, g, and h are inverse. (a) Water-table depth reconstruction from testate amoebae (composite record, Ireland; Swindles et al., Reference Swindles, Lawson, Matthews, Blaauw, Daley, Charman and Roland2013). (b) Water-table depth reconstruction from testate amoebae (Torre Hill Moss, Scotland; Blundell and Barber, Reference Blundell and Barber2005). (c) Water-table depth reconstruction from testate amoebae (Walton Moss, England; Barber and Langdon, Reference Barber and Langdon2007). (d) Pollen-based annual precipitation (Meerfelder Maar, Germany). (e) Pollen-based annual precipitation (Holzmaar, Germany; Litt et al., Reference Litt, Schölzel, Kühl and Brauer2009). (f) δ18O record, 60 yr low-pass filter from a speleothem (Klapferloch Cave, Austria). (g) δ13C record, 60 yr low-pass filter from a speleothem (Klapferloch Cave, Austria; Boch and Spötl, Reference Boch and Spötl2011). (h) Water-table reconstruction from testate amoebae (Stążki Bog, Poland; Galka et al., Reference Galka, Miotk-Szpiganowicz, Goslar, Jesko, van der Knaap and Lamentowicz2013). VPDB, Vienna Pee Dee belemnite. (For interpretation of the references to colour in this figure legend, the reader is referred to the web version of this article.)
We conclude that some of the annual precipitation records do not contradict the patterns visible in the winter and spring precipitation records revealing a wet start of the first millennium, a drier or average middle part, and a wet last part. However, no real common spatial pattern is visible for NW Europe.
DISCUSSION
Temperature
Comparing all temperature proxies (Fig. 9), excluding the pollen-based records from Meerfelder Maar and Holzmaar, the timing of the changes differs among the reconstructions. This is most probably because of dating uncertainties in all records except the tree-ring record, with a maximum of 520 yr in the δ18O record of Bunker Cave. Despite this heterogeneous pattern, some common trends can be recognised: the first millennium AD in NW Europe started with warmer summer conditions that lasted until AD 340 (+130/−90), followed by colder conditions, which prevailed until AD 720 (+80/−70), and followed again by warmer conditions for the remainder of the first millennium AD (Fig. 9). The starting and ending of the colder period fits quite well with the findings of Helama et al. (Reference Helama, Jones and Briffa2017a), with AD 395 to AD 764 based solely on climate records, and also with the study of Ljungqvist (Reference Ljungqvist2010), who defined the Roman Warm Period from AD 1 to 300, the Dark Ages Cold Period from AD 300 to 800, and the Medieval Climate Anomaly from AD 800 to 1300 for the extratropical Northern Hemisphere (Fig. 9). Büntgen et al. (Reference Büntgen, Myglan, Ljungqvist, McCormick, Di Cosmo, Sigl and Jungclaus2016) defined the Late Antique Little Ice Age from AD 536 to around AD 660 (Fig. 9). This very pronounced cold phase within the Dark Ages Cold Period is visible in tree-ring width records from the Alps, which is also included in this review (Fig. 2e), and an additional tree-ring width record from the Altai Mountains. However, this very cold phase is not visible in the chironomid record (Barber et al., Reference Barber, Brown, Langdon and Hughes2013) and in the speleothem records from Ireland and the Alps (Figs. 2a, 3c, and 5; McDermott et al., Reference McDermott, Mattey and Hawkesworth2001; Mangini et al., Reference Mangini, Spötl and Verdes2005). A more pronounced cold phase during this time is recorded in the Sphagnum δ13C record (Fig. 2b), whereas cold and dry conditions were derived from the δ18O record of Bunker Cave (Moschen et al., Reference Moschen, Kühl, Peters, Vos and Lücke2011; Fohlmeister et al., Reference Fohlmeister, Schröder-Ritzrau, Scholz, Spötl, Riechelmann, Mudelsee and Wackerbarth2012). However, because of dating uncertainties and/or low resolution of these records, a precise conclusion about the Late Antique Little Ice Age is not possible. This was also shown by Helama et al. (Reference Helama, Jones and Briffa2017b) in an overview of tree-ring records from the Northern Hemisphere where no clear Late Antique Little Ice Age was visible.

Figure 9 Comparison of the temperature records compiled in this study with the studies of Büntgen et al. (Reference Büntgen, Myglan, Ljungqvist, McCormick, Di Cosmo, Sigl and Jungclaus2016), Luterbacher et al. (Reference Luterbacher, Werner, Smerdon, Fernández-Donado, González-Rouco, Barriopedro and Ljungqvist2016), Ljungqvist (Reference Ljungqvist2010), and Helama et al. (Reference Helama, Jones and Briffa2017a). Red indicates warmer conditions; blue, colder conditions; and white, average conditions. The maximum dating uncertainties are given below every record interpretation. The dating uncertainty for the tree-ring records is zero. (For interpretation of the references to colour in this figure legend, the reader is referred to the web version of this article.)
It has to be taken into account that 18 out of the 30 compiled climate records in the study of Ljungqvist (Reference Ljungqvist2010) represent summer temperature. There is only one record (Spannagel Cave) included in both our review and in the study of Ljungqvist (Reference Ljungqvist2010), so the findings are based on predominantly different data sets. The study from Helama et al. (Reference Helama, Jones and Briffa2017a) compiled 114 multiple proxy records for different climatic parameters worldwide, but the timing of the Dark Ages Cold Period is quite consistent for all. Out of a total of 13 sites in NW Europe, 5 sites—namely, Uamh an Tartair Cave (Baker et al., Reference Baker, Hellstrom, Kelly, Mariethoz and Trouet2015), Crag Cave (McDermott et al., Reference McDermott, Mattey and Hawkesworth2001), Klapferloch Cave (Boch and Spötl, Reference Boch and Spötl2011), Alpine tree-ring width (Büntgen et al., Reference Büntgen, Tegel, Nicolussi, McCormick, Frank, Trouet and Kaplan2011), and the composite record from Ireland (Swindles et al., Reference Swindles, Lawson, Matthews, Blaauw, Daley, Charman and Roland2013)—are included as well in our review. The agreement with the studies of Luterbacher et al. (Reference Luterbacher, Werner, Smerdon, Fernández-Donado, González-Rouco, Barriopedro and Ljungqvist2016) and Büntgen et al. (Reference Büntgen, Myglan, Ljungqvist, McCormick, Di Cosmo, Sigl and Jungclaus2016) showing summer temperature for Europe and Eurasia, respectively, also corresponds well with our findings (Fig. 9). This is partly because the same tree-ring data set has been considered in their reconstruction and the present compilation. Also, the record of McDermott et al. (Reference McDermott, Mattey and Hawkesworth2001) shows a similar pattern.
The present data do not allow for decisive conclusions about the exact timing and duration of colder and warmer periods, which was also discussed by Helama et al. (Reference Helama, Jones and Briffa2017a) for the Dark Ages Cold Period. This could primarily be resolved by improving the chronologies of existing and new records by independent and absolute dating such as tephra or a high number of precise 230Th/U dating by MC-ICPMS and layer counting. This is important with regard to the relation of climatic changes and changes in human societies. Further, the quantitative reconstruction of the temperature remains complex, and therefore, a precise conclusion about extreme cold periods such as the Late Antique Little Ice Age (Büntgen et al., Reference Büntgen, Myglan, Ljungqvist, McCormick, Di Cosmo, Sigl and Jungclaus2016) is difficult to establish. Based on the current state of research, it is impossible to identify leads and lags in spatial trends. However, we can conclude that the temperature shifts occurred across NW Europe making this a supraregional trend.
Precipitation
Three out of the 10 records interpreted as precipitation show a similar pattern, which is not as distinct as it is for temperature (Fig. 10). The remaining seven records show highly variable and often inverse patterns. We conclude that because most of these records are based on proxies that also are influenced by temperature and other environmental factors, and often by multiple factors simultaneously, they are unsuitable as pure precipitation proxies. Looking at the three most reliable records (speleothem: Uamh an Tartair Cave/Scotland; tree-ring width: France/Germany; testate amoebae: Stążki bog/Poland), we can tentatively indicate that the period from AD 1 to 500 (−150/+80) was relatively wet, whereas from AD 500 onwards drier conditions are indicated followed by wetter conditions from AD 800 (−90/+210) onwards. These climatic shifts probably have been dated most accurately in the tree-ring records, where they are visible at AD 460 and AD 710. The speleothem and tree-ring records indicate the occurrence of an additional drier phase around AD 210/220. The timing of the shifts in precipitation does not seem concurrent with the timing of the shifts in temperature. The shift to wetter conditions at the end of the first millennium could be synchronous to the start of the Medieval Climate Anomaly. The Dark Ages Cold Period (around AD 340) does not appear to be reflected in a shift in precipitation regime. Helama et al. (Reference Helama, Jones and Briffa2017a) see evidence of a cold and wetter Dark Ages Cold Period. However, with 14 sites indicating wet conditions and 9 sites indicating dry conditions, the evidence from this study is not conclusive.

Figure 10 Comparison of the precipitation records compiled in this study with the study of Charman (Reference Charman2010). Red indicates drier conditions; blue, wetter conditions; and white, average conditions. The maximum dating uncertainties are given below every record interpretation, except for Swindles et al. (Reference Swindles, Lawson, Matthews, Blaauw, Daley, Charman and Roland2013), where no dating uncertainty was provided for the composite record. (For interpretation of the references to colour in this figure legend, the reader is referred to the web version of this article.)
Studies compiling precipitation records from a wider area are rare. Sundqvist et al. (Reference Sundqvist, Zhang, Moberg, Holmgren, Körnich, Nilsson and Brattström2010) considered precipitation but only compared mid-Holocene conditions with preindustrial times (AD 1500) and offered no significant conclusion about precipitation differences in time and space. Only the study by Charman (Reference Charman2010) is available for comparison with the precipitation records presented here. In that study, wet climate conditions were reconstructed from bog oaks, BSW (testate amoebae), flood layers, a speleothem from Uamh an Tartair Cave (Proctor et al., Reference Proctor, Baker and Barnes2002), and sand dune activity. Comparing Charman’s (Reference Charman2010) synthesis to our three precipitation records (Figs. 6a, 7, and 8h; Büntgen et al., Reference Büntgen, Tegel, Nicolussi, McCormick, Frank, Trouet and Kaplan2011; Galka et al., Reference Galka, Miotk-Szpiganowicz, Goslar, Jesko, van der Knaap and Lamentowicz2013; Baker et al., Reference Baker, Hellstrom, Kelly, Mariethoz and Trouet2015), there are only a few similarities. However, this is a common occurrence when compiling and comparing precipitation records. This is illustrated by the study of Cook et al. (Reference Cook, Seager, Kushnir, Briffa, Büntgen, Frank and Krusic2015) who reconstructed droughts during the last millennium (AD 1000 to 2000) and found no corresponding precipitation trend over NW Europe, except during for some extreme years.
The British compilation indicates wetter conditions in the period AD 1 to 100 as seen in the speleothem record from Scotland and the tree-ring reconstruction. Furthermore, this composite record points to wetter conditions in the interval AD 300 to 570 as seen in the speleothem record from Scotland (Fig. 10). Furthermore, the composite record by Charman (Reference Charman2010) is primarily based on BSW records from testate amoebae. One testate-amoebae record (Ballyduff) from this study was included in the composite testate-amoebae record discussed in our review. It should be noted that testate amoebae as a proxy for precipitation has to be used with caution. Furthermore, proxies reflecting solely precipitation are rare; most proxies are to some extent influenced by other environmental factors with temperature as the dominant secondary influence. It is therefore, difficult to reconstruct precipitation in isolation from temperature. Nevertheless, the tree-ring record covering large parts of Germany and eastern France (Büntgen et al., Reference Büntgen, Tegel, Nicolussi, McCormick, Frank, Trouet and Kaplan2011) and the speleothem record from Scotland (Baker et al., Reference Baker, Hellstrom, Kelly, Mariethoz and Trouet2015) seem to provide reliable precipitation reconstructions. Both are annually resolved and have excellent age control because of layer or ring counting. These records come from completely different parts of NW Europe making it likely that these shifts occurred also across the whole of this region. Our study clearly shows that precipitation shifts are poorly reflected in proxy records, probably because of low sensitivity of the proxy to precipitation and strong regional precipitation differences. More high-resolution, precisely dated records and precipitation-seasonality proxies are needed to provide conclusive evidence about the timing and duration of dry and wet phases during the first millennium.
CONCLUSIONS
We investigated 17 single records and 1 composite record based on six different climatic proxies in order to detect similar climate variations in NW Europe during the first millennium AD. Chironomids, speleothems, Sphagnum mosses, and tree-ring width provide good to excellent records of past climate. However, climate records based on pollen and testate amoebae appear to be less reliable, because of low resolution (pollen) and the varying dependency on both precipitation and temperature (testate amoebae).
The period from AD 1 to 250 was relatively warm and can be correlated to the Roman Warm Period found in other reconstructions from the Northern Hemisphere. This period was followed by colder conditions lasting from AD 250 to 700, which can be correlated to the Dark Ages Cold Period. Warmer conditions were reconstructed from AD 700 onwards, corresponding with the Medieval Climate Anomaly.
The compilation of precipitation reconstructions yields a markedly heterogeneous pattern. Only the tree-ring width reconstruction of spring precipitation, the winter precipitation record from a speleothem from Scotland, and an annual precipitation testate-amoebae record from Poland show some indications for common changes in wetness with a wet first half of the millennium, a dry middle part, and a shift to wetter conditions at the end of the millennium. This translates to a wetter Roman Warm Period, a first wetter then drier Dark Ages Cold Period, and a wetter Medieval Climate Anomaly.
The identification of the exact timing of the shifts in precipitation and temperature is hampered by poor age control except for the two tree-ring records, where climatic shifts can be exactly dated to the year, and by the fact that in some cases the records only have a multidecadal resolution. It was therefore not possible to determine further differences in the timing and duration of the climate fluctuations across NW Europe. We can conclude that the shifts in temperature occurred across the whole of this region and are recognisable in multiple records and proxies, demonstrating that the Roman Warm Period, the Dark Ages Cold Period, and the Medieval Climate Anomaly also occurred as regional climatic events. The precipitation records indicate some similarities across NW Europe, which differ in timing from the temperature shifts.
SUPPLEMENTARY MATERIAL
To view supplementary material for this article, please visit https://doi.org/10.1017/qua.2018.84
ACKNOWLEDGMENTS
This work is part of the project “The Dark Age of the Lowlands in an interdisciplinary light: people, landscape and climate in the Netherlands between AD 300 and 1000” (The Netherlands Organisation for Scientific Research (NWO), section Humanities; 2012–2019: 360-60-110; www.darkagesproject.com). We thank the following people for providing data: F. McDermott: stalagmite CC3 from Crag Cave (Ireland); J. Fohlmeister: Bunker Cave (Germany); P. Langdon, K. Barber, and A. Blundell: Irish and British testate-amoebae data; M. Lamentowicz and M. Galka: Polish testate-amoebae data; S. Alastair Brown: chironomid data set; N. Kuhl: Sphagnum cellulose record. G. Swindles and J. Guiot are thanked for their useful input on selecting the correct records. W. Z. Hoek, E. Jansma, H. Middelkoop, R. L. van Lanen, and E. Stouthamer are thanked for many fruitful discussions and suggestions to this manuscript, and M. Veicht for graphic editing. ERASMUS (European Community Action Scheme for the Mobility of University Students) provided additional funding for the first author. We would like to thank S. Helama, G. Plunket, associate editor P. Langdon, and senior editor D. Booth for many useful comments and remarks on the manuscript.


