


INTRODUCTION
Aeolian dust deserves our attention, because it is a major contributor to both marine sediments and continental soils. It is closely linked to the global and regional climate state (Kohfeld and Harrison, Reference Kohfeld and Harrison2001; Maher et al., Reference Maher, Prospero, Mackie, Gaiero, Hesse and Balkanski2010; Mahowald et al., Reference Mahowald, Kloster, Engelstaedter, Moore, Mukhopadhyay, McConnell and Albani2010; Marx et al., Reference Marx, Kamber, McGowan, Petherick, McTainsh, Stromsoe, Hooper and May2018). Dust fluxes, trajectories, and source areas can be estimated from direct measurements (Nihlén and Olsson, Reference Nihlén and Olsson1995; Prospero, Reference Prospero1999; Ryder et al., Reference Ryder, Highwood, Rosenberg, Trembath, Brooke, Bart and Dean2013b) and/or satellite observations (Middleton and Goudie, Reference Middleton and Goudie2001; Prospero et al., Reference Prospero, Ginoux, Torres, Nicholson and Gill2002; Tegen et al., Reference Tegen, Harrison, Kohfeld, Prentice, Coe and Heimann2002; Washington et al., Reference Washington, Todd, Middleton and Goudie2003; Schepanski et al., Reference Schepanski, Tegen and Macke2012), and/or meteorological models (Tegen et al., Reference Tegen, Harrison, Kohfeld, Prentice, Coe and Heimann2002; Huneeus et al., Reference Huneeus, Schulz, Balkanski, Griesfeller, Prospero, Kinne and Bauer2011; Pausata et al., Reference Pausata, Messori and Zhang2016). Estimates on the annual worldwide dust production vary widely between 500 and 4300 × 106 t/yr, because of the limited number of observations and different, still-evolving methodologies (compilations by Tegen, Reference Tegen2003; Tegen and Schulz, Reference Tegen, Schulz, Knippertz and Stuut2014). About 25% of the dust produced worldwide reaches the oceans and settles there (Jickells et al., Reference Jickells, An, Andersen, Baker, Bergametti, Brooks and Cao2005). In some deep ocean basins, clay-sized mineral dust is the most important terrigenous sediment component (Kohfeld and Harrison, Reference Kohfeld and Harrison2001). The amount of dust is higher in the Northern than in the Southern Hemisphere, because most modern deserts are situated north of the equator, and the Intertropical Convergence Zone (ITCZ) is an effective barrier to southward dust transport (Rea, Reference Rea1994).
Aeolian dust has an important impact on global and regional climate mainly by reflecting the incoming short-wave radiation and absorbing the outgoing long-wave radiation (Tegen et al., Reference Tegen, Lacis and Fung1996; Kohfeld and Harrison, Reference Kohfeld and Harrison2001; Tegen, Reference Tegen2003; Mahowald et al., Reference Mahowald, Kloster, Engelstaedter, Moore, Mukhopadhyay, McConnell and Albani2010, Reference Mahowald, Albani, Kok, Engelstaeder, Scanza, Ward and Flanner2014; Boucher et al., Reference Boucher, Randall, Artaxo, Bretherton, Feingold, Forster, Kerminen, Stocker, Qin, Plattner, Tignor, Allen, Boschung, Nauels, Xia and Bex2013). Dust is also suspected to influence glacial–interglacial cycles (Bar-Or et al., Reference Bar-Or, Erlick and Gildor2008). However, these effects are still poorly understood both qualitatively and quantitatively. Changing dust fluxes are believed to affect cloud properties, storm development, sea-surface temperature, atmospheric and oceanic circulation, and precipitation, among other climatic phenomena (Harrison et al., Reference Harrison, Kohfeld, Roelandt and Claquin2001; Pausata et al., Reference Pausata, Messori and Zhang2016).
Aeolian dust also has substantial effects on atmospheric chemistry, oceanic and terrestrial biogeochemistry, and ecosystems (Guerzoni et al., Reference Guerzoni, Chester, Dulac, Herut, Loÿe-Pilot, Measures and Migon1999; Harrison et al., Reference Harrison, Kohfeld, Roelandt and Claquin2001). It is a major controlling factor for marine primary production, mainly by providing iron, which is as an essential micronutrient (Jickells et al., Reference Jickells, An, Andersen, Baker, Bergametti, Brooks and Cao2005; Mahowald et al., Reference Mahowald, Kloster, Engelstaedter, Moore, Mukhopadhyay, McConnell and Albani2010). Also, land ecosystems may benefit from the influx of wind-blown critical trace elements (Swap et al., Reference Swap, Garstand and Greco1992).
On the other hand, dust production is very sensitive to climate changes. Globally averaged, marine and terrestrial records document an approximately threefold higher dust flux during glacial periods than during interglacials (Rea, Reference Rea1994; Kohfeld and Harrison, Reference Kohfeld and Harrison2001; Mahowald et al., Reference Mahowald, Muhs, Levis, Rasch, Yoshioka, Zender and Luo2006; Maher et al., Reference Maher, Prospero, Mackie, Gaiero, Hesse and Balkanski2010), because of stronger winds. This is caused by enhanced aridity, reduced vegetation cover, reduced precipitation, and lowered sea level during cold periods. The increase in dust fluxes was distinctly higher directly downwind of active dust sources and in the high latitudes (Petit et al., Reference Petit, Jouzel, Raynaud, Barkov, Barnola, Basile and Bender1999; Kohfeld and Harrison, Reference Kohfeld and Harrison2001).
The Sahara Desert in northern Africa is at present one of the largest sand deserts and the most productive dust source in the world (Schütz et al., Reference Schütz, Jaenicke and Pietrek1981; d'Almeida, Reference d'Almeida1987). About two-thirds of the global annual dust production derives from northern Africa (Ginoux et al., Reference Ginoux, Prospero, Torres and Chin2004; Jickells et al., Reference Jickells, An, Andersen, Baker, Bergametti, Brooks and Cao2005), and about half of the amount of aeolian material supplied to the world's oceans is sourced from the Sahara (Middleton and Goudie, Reference Middleton and Goudie2001). The estimation of present-day Saharan dust production rates varies between 400 and 2200 × 106 t/yr (compilations by Goudie and Middleton, Reference Goudie and Middleton2001; Huneeus et al., Reference Huneeus, Schulz, Balkanski, Griesfeller, Prospero, Kinne and Bauer2011).
Saharan dust is distributed over thousands of kilometres by different wind systems. It can be traced westward to the Caribbean and the Americas, northward to Europe up to Scandinavia, and northeastward to the Eastern Mediterranean Sea and the Middle East (Yarincik and Murray, Reference Yarincik and Murray2000; Goudie and Middleton, Reference Goudie and Middleton2001; Engelstaedter et al., Reference Engelstaedter, Tegen and Washington2006; Stuut et al., Reference Stuut, Smalley and O'Hara-Dhand2009).
Changes in the influx of Saharan dust versus Nile suspension load document that North Africa underwent drastic climatic and environmental changes during the late Quaternary (Revel et al., Reference Revel, Ducassou, Grousset, Bernasconi, Migeon, Revillon, Mascle, Murat, Zaragosi and Bosch2010; Ehrmann et al., Reference Ehrmann, Seidel and Schmiedl2013, Reference Ehrmann, Schmiedl, Beuscher and Krüger2016, Reference Ehrmann, Schmiedl, Beuscher and Krüger2017; Beuscher et al., Reference Beuscher, Krüger, Ehrmann, Schmiedl, Milker, Arz and Schulz2017). The periodic precession-driven northward shift of the ITCZ during periods of high northern insolation led to a northward migration of the monsoonal rain belt, resulting in increased precipitation in northern Africa (Rossignol-Strick, Reference Rossignol-Strick1983). During these African Humid Periods, a dense vegetation cover developed and lakes and river systems formed in North Africa (Jolly et al., Reference Jolly, Harrison, Damnati and Bonnefille1998; Gasse, Reference Gasse2000; Kröpelin et al., Reference Kröpelin, Verschuren and Lezine2008; Drake et al., Reference Drake, Blench, Armitage, Bristow and White2011). This hampered the dust export out of North Africa (Skonieczny et al., Reference Skonieczny, McGee, Winckler, Bory, Bradtmiller, Kinsley, Polissar, Pol-Holz, Rossignol and Malaizé2019) and led to an increase of riverine sediment input to the adjacent sediment sinks like the Mediterranean Sea and the northwest African margin. In the Mediterranean Sea, especially in the eastern basin, the high input of nutrient-rich fresh water triggered increased bioproduction and interruption of the deep-water formation. This led to the deposition of sapropel layers due to anoxic bottom-water conditions (Rossignol-Strick et al., Reference Rossignol-Strick, Nesteroff, Olive and Vergnaud-Grazzini1982; Rohling, Reference Rohling1994; Cramp and O'Sullivan, Reference Cramp and O'Sullivan1999; Emeis et al., Reference Emeis, Schulz, Struck, Rossignol-Strick, Erlenkeuser, Howell and Kroon2003; Rohling et al., Reference Rohling, Marino and Grant2015). During the arid phases, the lack of vegetation, the desiccation of soils and lakes, and the stronger winds facilitated the aeolian emission of sediment particles towards the Eastern Mediterranean Sea.
The North African vegetation cover was not only controlled by precipitation but also by complex, nonlinear climate–vegetation feedbacks (Claussen et al., Reference Claussen, Bathiany, Brovkin and Kleinen2013). These feedbacks, or the existence of a precipitation-controlled threshold on plant growth, led to a fast decline of the vegetation cover in the most productive dust-source areas after the termination of the African Humid Periods. This, in combination with the simultaneous increase of wind speed, led to an abrupt intensification of dust emission from North Africa that is detectable in the sediment record. However, spatial and temporal differences in these landscape and climate transitions exist (Egerer et al., Reference Egerer, Claussen and Reick2018).
In a previous study, we applied endmember modelling on clay mineral, X-ray fluorescence (XRF), and grain size data from sediment core SL71, recovered southwest of Crete (Beuscher et al., Reference Beuscher, Krüger, Ehrmann, Schmiedl, Milker, Arz and Schulz2017). The endmember modelling proved to be a suitable tool to differentiate between different sediment input mechanisms and source regions and to document temporal variation in the fluvial and aeolian influx. We showed that clay-sized dust is strongly controlled by the availability of fine-grained sediments in the source regions, while silt-sized dust is more controlled by wind strength, because availability of sediment in the silt fraction is never an issue, while sources of clay-sized material deplete over time (Beuscher et al., Reference Beuscher, Krüger, Ehrmann, Schmiedl, Milker, Arz and Schulz2017; Ehrmann et al., Reference Ehrmann, Schmiedl, Beuscher and Krüger2017). The results of endmember modelling also indicated that during strong humid periods, fluvial sediments from the Nile River and/or Anatolian rivers were distributed over much greater distances than during arid phases.
In the present study, we reconstruct the export of northern African dust to the Eastern Mediterranean Sea in response to climate changes during the last ca. 180 ka by means of endmember modelling on the silt grain size fraction. We analyse nine sediment cores from the Aegean, Levantine, and Ionian Seas (Fig. 1, Table 1). The location of the core sites allows for evaluation of spatial contrasts and proximal to distal gradients in Saharan dust fluxes to the eastern Mediterranean region.

Figure 1. Location of the investigated sediment cores in the Eastern Mediterranean Sea (Mercator projection; after Grobe et al., Reference Grobe, Sieger and Diepenbroek2003). Light blue arrows indicate the simplified ocean surface circulation pattern (after Pinardi and Marsetti., Reference Pinardi and Masetti2000; Lykousis et al., Reference Lykousis, Chronis, Tselepides, Price, Theocharis and Siokou-Frangou2002). Framed yellow arrows schematically indicate main dust transport paths. Framed dark blue arrows indicate present-day fluvial sediment influx. Orange-shaded areas show potential dust source areas (PSA; after Scheuvens et al., Reference Scheuvens, Schütz, Kandler, Ebert and Weinbruch2013). (For interpretation of the references to colour in this figure legend, the reader is referred to the web version of this article.)
Table 1. Metadata of the sediment cores investigated.

MATERIALS AND METHODS
We investigate the sediment cores SL71, SL99, SL110, SL112, SL114, SL119, SL123, SL143, and SL148 (Fig. 1, Table 1), retrieved from the Eastern Mediterranean Sea during the cruises M40/4 and M51/3 of the German research vessel Meteor (Hieke et al., Reference Hieke, Hemleben, Linke, Türkay and Weikert1999; Hemleben et al., Reference Hemleben, Hoernle, Jørgensen and Roether2003).
Some of the sediment cores investigated were the object of earlier studies. The clay mineral compositions of sediment cores SL71, SL110, SL123, SL143, and SL148 had been previously published (Ehrmann et al., Reference Ehrmann, Schmiedl, Hamann, Kuhnt, Hemleben and Siebel2007, Reference Ehrmann, Seidel and Schmiedl2013, Reference Ehrmann, Schmiedl, Seidel, Krüger and Schulz2016, Reference Ehrmann, Schmiedl, Beuscher and Krüger2017; Hamann et al., Reference Hamann, Ehrmann, Schmiedl and Kuhnt2009). Grain size analyses had been carried out for sediment cores SL71, SL112, and SL148 (Hamann et al., Reference Hamann, Ehrmann, Schmiedl, Krüger, Stuut and Kuhnt2008; Beuscher et al., Reference Beuscher, Krüger, Ehrmann, Schmiedl, Milker, Arz and Schulz2017), whereas grain size data of cores SL99, SL110, SL114, SL119, SL123, and SL143 were not available. Sediment core SL71 had also been used for studies focusing on alkenone and stable isotope sea-surface temperatures and salinities (Emeis et al., Reference Emeis, Schulz, Struck, Rossignol-Strick, Erlenkeuser, Howell and Kroon2003), basin-wide water mass circulation, and sediment provenance using Nd and Sr isotopes (Weldeab et al., Reference Weldeab, Emeis, Hemleben and Siebel2002a, Reference Weldeab, Emeis, Hemleben, Vennemann and Schulz2002b). The faunal and stable isotopic composition of benthic foraminifera had been analysed in sediment cores SL112, SL123, and SL148 (Kuhnt et al., Reference Kuhnt, Schmiedl, Ehrmann, Hamann and Hemleben2007, Reference Kuhnt, Schmiedl, Ehrmann, Hamann and Andersen2008; Schmiedl et al., Reference Schmiedl, Kuhnt, Ehrmann, Emeis, Hamann, Kotthoff, Dulski and Pross2010).
The investigated cores show no evidence of sediment redistribution or hiatuses, except for core SL110, which comprises a hiatus of about 7 ka duration (126–119 ka) at the depth of 598 cm (Ehrmann et al., Reference Ehrmann, Schmiedl, Seidel, Krüger and Schulz2016). All sediment cores consist mainly of yellowish, brownish, and greyish foraminiferal–nannofossil ooze. Depending on the core length and the investigated core interval, they include sapropel layers S1 to S6.
The following sediment cores used for this study were dated previously: SL71 (Ehrmann et al., Reference Ehrmann, Schmiedl, Beuscher and Krüger2017), SL110 (Ehrmann et al., Reference Ehrmann, Schmiedl, Seidel, Krüger and Schulz2016; Beuscher et al., Reference Beuscher, Krüger, Ehrmann, Schmiedl, Milker, Arz and Schulz2017), SL112 (Hamann et al., Reference Hamann, Ehrmann, Schmiedl, Krüger, Stuut and Kuhnt2008), SL123 (Ehrmann et al., Reference Ehrmann, Schmiedl, Hamann, Kuhnt, Hemleben and Siebel2007), SL143 (Ehrmann et al., Reference Ehrmann, Seidel and Schmiedl2013), and SL148 (Ehrmann et al., Reference Ehrmann, Schmiedl, Hamann, Kuhnt, Hemleben and Siebel2007). The age models of these cores, except SL143, are based on stable oxygen isotope stratigraphy derived from surface-dwelling planktonic foraminifera (Globigerinoides ruber, Globigerina bulloides) and a graphical correlation of the δ18O records with the LR04 isotope stack (Lisiecki and Raymo, Reference Lisiecki and Raymo2005). They also used 14C accelerator mass spectrometer (AMS) datings of well-preserved shells of surface-dwelling planktonic foraminifera that represent the age of the surface water. In addition, the ages of the Minoan tephra, the Y-2 tephra, and the Y-5 tephra were used when present. The age model of sediment core SL143 is based on the Y-2 and Y-5 tephras and the basal ages of sapropel layers S1, S3, and S4 (Ehrmann et al., Reference Ehrmann, Seidel and Schmiedl2013).
To build consistent age models for cores SL99, SL114, and SL119, we applied tephrostratigraphy, 14C AMS datings on mixed surface-dwelling foraminifera, and stable isotope stratigraphy, based on the correlation of the planktic foraminiferal (G. ruber, G. bulloides) stable oxygen isotope records with the LR04 stack (Lisiecki and Raymo, Reference Lisiecki and Raymo2005; Supplementary Table S1, Supplementary Fig. S1). As in the other cores, the extents of the sapropel layers were defined on the basis of the core descriptions, assisted by laminations and the dark grey to black colour caused by the presence of organic matter, or the yellowish colour caused by postdepositional oxidation.
All previously published and new cores were passed through the same sample processing. The samples were treated with 10% acetic acid and 3% hydrogen peroxide to remove calcium carbonate and organic carbon, respectively. Then the clay fraction (<2 µm) was isolated from the coarser components in settling tubes and used for clay mineral studies (e.g., Ehrmann et al. Reference Ehrmann, Schmiedl, Hamann, Kuhnt, Hemleben and Siebel2007). Sieving through a 63 µm mesh separated the silt (2–63 µm) from the larger fractions (>63 µm).
In this study, we used the silt fraction for detailed grain size analyses with a laser particle sizer (Analysette 22, Fritsch GmbH). The clay fraction was excluded from the analyses because of its typically cohesive behaviour. The sand fraction was excluded because of its low share in the total sediment composition (ca. 0%–5%). We made four consecutive measurements of the grain size distributions and then calculated the mean. We measured 65 size classes within the silt fraction of cores SL99, SL114, and SL119; 31 size classes within the silt fraction of cores SL71, SL110, and SL143; and 18 size classes within the silt fraction of core SL123. For cores SL112 and SL148, the basic grain size data were taken from Hamann et al. (Reference Hamann, Ehrmann, Schmiedl, Krüger, Stuut and Kuhnt2008). Despite the different resolutions of the size classes, the modes are clearly expressed in all grain size distribution curves (Fig. 2).

Figure 2. Silt endmembers of the investigated sediment cores. The endmembers related to aeolian dust are highlighted in red and the respective grain size modes are given. All endmember modes are listed in Table 2. The core positions are shown in Fig. 1. (For interpretation of the references to colour in this figure legend, the reader is referred to the web version of this article.)
Table 2. Results of endmember modelling of the silt grain size distributions of the sediment cores investigated.

a Data from Beuscher et al. (Reference Beuscher, Krüger, Ehrmann, Schmiedl, Milker, Arz and Schulz2017).
b Data recalculated from Hamann et al. (Reference Hamann, Ehrmann, Schmiedl and Kuhnt2009).
The silt grain size data of each core were fed into the open-source R-based endmember modelling programme RECA (Seidel and Hlawitschka, Reference Seidel and Hlawitschka2015) to identify similarities and variation patterns within the data set and to group them into subpopulations (endmembers, EM). Before endmembers were calculated, samples from ash layers were removed from the data sets. The number of endmembers has been chosen based on the coefficient of determination (r 2) between the original data and the dimensionally reduced modelled matrices and considering the geological background information. If a higher number of endmembers led only to a minor increase of r 2, the lower number of endmembers was chosen (Weltje, Reference Weltje1997; Seidel and Hlawitschka, Reference Seidel and Hlawitschka2015).
To reveal periodicities in the data sets, wavelet analyses, using the Morlet basic function (Torrence and Campo, Reference Torrence and Campo1998), and REDFIT spectral analyses (Schulz and Mudelsee, Reference Schulz and Mudelsee2002), using the Welsh window, were performed on the data sets of sediment cores SL71, SL99, SL110, and SL143 using the programme package PAST (Hammer et al., Reference Hammer, Harper and Ryan2001).
The basic data used in this study are stored in the Pangaea database: https://doi.pangaea.de/10.1594/PANGAEA.898583.
RESULTS
The mean coefficients of determination (r 2 mean) for different numbers of potential endmembers and the coefficients of determination (r 2) for each grain size class for a three-endmember model are given in Figure 3. All data sets of the grain size distribution within the silt fraction of the terrigenous sediment components were modelled for three endmembers. The models explain between 87% and 95% of the variance of the data sets (Table 2). Additionally, in all cores the three-endmember model shows high r 2 for all size classes of the silt fraction. The modal grain sizes of the endmembers of the investigated sediment cores are shown in Table 2 and Figure 2.

Figure 3. Endmember modelling results: mean coefficients of determination (r 2 mean) versus the number of potential endmembers, and coefficients of determination (r 2) versus grain size classes for a three-endmember model.
The coarsest endmember of each core is labelled EM1. EM1 is unimodal in cores SL112, SL123, SL143, and SL148, but bimodal in cores SL71, SL99, SL110, SL114, and SL119. The coarser mode of the bimodal EM1 varies between 31 µm and 50 µm, the finer mode between 18 µm and 23 µm. EM2 is generally finer grained than EM1 and has modes between 13 µm and 20 µm, with the exception of EM2 in SL99, which has a mode of 40 µm. The finest endmember with modal grain sizes between 5 µm and 16 µm was labelled EM3. Again, coarser modes, 20 µm and 32 µm, were calculated for SL99.
The temporal variations of the loadings of the three endmembers in the investigated sediment cores are shown in Supplementary Figure S1. Generally, the loadings of the coarsest endmember EM1 in each core are low during times of sapropel formation and higher during periods in between. The finer endmembers EM2 and EM3 show an opposite trend, with generally enhanced loadings during the times of sapropel formation and reduced loadings during the phases in between. This pattern can be seen in all cores, but is less distinct in cores SL110, SL123, SL143, and SL148.
DISCUSSION
We discuss the spatial and temporal distribution of Saharan dust in the Eastern Mediterranean Sea based on endmember modelling of the grain size distribution in the silt fraction. A large amount of Saharan dust is also contained in the clay fraction, which was not investigated in this study. We refer to previous studies that reconstructed the influx of clay-sized dust to the Eastern Mediterranean Sea based on the proportion of the clay minerals kaolinite and palygorskite in cores SL71 and SL143 (Ehrmann et al., Reference Ehrmann, Seidel and Schmiedl2013, Reference Ehrmann, Schmiedl, Beuscher and Krüger2017; Beuscher et al., Reference Beuscher, Krüger, Ehrmann, Schmiedl, Milker, Arz and Schulz2017). These studies showed that the export of clay-sized dust from northern Africa into the Eastern Mediterranean Sea is strongly controlled by the availability of fine-grained material in the source area. Export of silt-sized dust, on the other hand, is mainly controlled by the intensity of the transporting winds, as availability of dust in this size class is never a limiting factor (Ehrmann et al., Reference Ehrmann, Schmiedl, Beuscher and Krüger2017).
Assignment of endmembers
The grain sizes of aeolian dust depend on several geological processes, such as emission, transport, and deposition, which are controlled by environmental factors like soil availability and properties, aridity and vegetation cover in the source region, wind speed and gustiness, turbulence, and precipitation rate in the deposition region (Mahowald et al., Reference Mahowald, Albani, Kok, Engelstaeder, Scanza, Ward and Flanner2014). A wide range of grain size data of Saharan dust were presented by previous studies and were derived from both dust traps and sediments in the wider Eastern Mediterranean Sea area. A general grain size range of 1–100 µm with modal values of 10–30 µm was given by Guerzoni et al. (Reference Guerzoni, Molinaroli and Chester1997) for Mediterranean aerosols, while Goudie and Middleton (Reference Goudie and Middleton2001) compiled modal and median dust grain sizes of 5–30 µm. Samples of recent Saharan dust from the island of Crete and the surrounding sea show typical median grain sizes of 16 µm (Pye, Reference Pye1992), 4–16 µm (Nihlén et al., Reference Nihlén, Mattson, Rapp, Gagaoudaki, Kornaros and Papageorgiou1995), and 8–30 µm (Mattsson and Nihlén, Reference Mattsson and Nihlén1996). Ganor and Mamane (Reference Ganor and Mamane1982) reported mean grain sizes of 20–50 µm for Saharan dust in Israel. Grain sizes from the coastal region of the Gulf of Sirte show a dominance of coarse silt to very fine sand with grain sizes of 60–70 µm (O'Hara et al., Reference O'Hara, Clarke and Elatrash2006).
In the distal Nile deep-sea fan, a coarse endmember with two modes of 15 µm and 30 µm was related to Saharan dust, while the finer endmembers with modes of 3–4 µm and 2 µm were interpreted as fluvial (Blanchet et al., Reference Blanchet, Tjallingii, Frank, Lorenzen, Reitz, Brown, Feseker and Brückmann2013). In roughly the same area, Revel et al. (Reference Revel, Ducassou, Grousset, Bernasconi, Migeon, Revillon, Mascle, Murat, Zaragosi and Bosch2010) identified Saharan dust with a modal grain size of 40 µm. Within the Nile suspension load at Cairo, 75% of the grains are smaller than 10 µm (Ball, Reference Ball1939). However, coarser sediment components are taken up from the Nile delta by the strong coastal current (Zviely et al., Reference Zviely, Kit and Klein2007) and are transported to the north within the Nile discharge plume along the coast of Asia Minor to Anatolia.
The wide spread of grain size modes represented in the literature may be partly due to different methodological approaches and different locations, which makes a direct comparison of absolute grain size values difficult. A graphic comparison of the literature data and our grain size modelling results is given in Figure 4. The relations between the grain size modes and their temporal variation patterns in the endmember models allow for a distinction between fluvial and aeolian modes of sediment delivery.

Figure 4. Comparison of grain size data from the literature and results of endmember modelling (this paper). Grain size data of aeolian sediments are shown by red dots, grain size of fluvially derived sediments by black crosses. (1) Guerzoni et al. (Reference Guerzoni, Molinaroli and Chester1997); (2) Goudie and Middleton (Reference Goudie and Middleton2001); (3) Pye (Reference Pye1992); (4) Nihlén and Olsson (Reference Nihlén, Mattson, Rapp, Gagaoudaki, Kornaros and Papageorgiou1995); (5) Mattson and Nihlèn (Reference Mattsson and Nihlén1996); (6) Ganor and Mamane (Reference Ganor and Mamane1982); (7) O'Hara et al. (Reference O'Hara, Clarke and Elatrash2006); (8) Blanchet et al. (Reference Blanchet, Tjallingii, Frank, Lorenzen, Reitz, Brown, Feseker and Brückmann2013); (9) Revel et al. (Reference Revel, Ducassou, Grousset, Bernasconi, Migeon, Revillon, Mascle, Murat, Zaragosi and Bosch2010); (10) Ball (Reference Ball1939). (For interpretation of the references to colour in this figure legend, the reader is referred to the web version of this article.)
Our endmember modelling of silt grain size distributions from the Eastern Mediterranean Sea revealed for each core, except SL99, two relatively fine-grained endmembers. The modes of EM3 (5–16 µm) fit with reported grain sizes of fluvial suspension (Fig. 4). The modes of EM2 (13–20 µm) are coarser than the reported fluvial gain sizes. However, because the proportion of EM2 generally increases during times of sapropel formation, we assume a fluvial source also for this endmember.
Differences in the modes of the fluvial endmembers are due to differences in the environment, like changes in river inputs and transport by oceanic currents. The much finer fluvial grain size reported by Blanchet et al. (Reference Blanchet, Tjallingii, Frank, Lorenzen, Reitz, Brown, Feseker and Brückmann2013) from the westernmost Nile deep-sea fan compared with our data from cores SL110 and SL112 may be due to the different core positions relative to the main delivery path of Nile sediments to the Eastern Mediterranean Sea. The main deposition of Nile sediment probably happens east of the Blanchet core position, leading to coarser grain sizes in the discharge plume to the east and northeast of the delta. Thus, there is a significant uptake of coarser sediment downstream of the Blanchet core position (Zviely et al., Reference Zviely, Kit and Klein2007).
EM1 is bimodal, has coarse modes between ca. 30 µm and 55 µm, and is interpreted as Saharan dust. This assignment of endmembers is supported by the temporal variation patterns of their loadings in the individual sediment cores (Supplementary Figure S1), which clearly indicate low loadings of the dust endmembers and high loadings of the fluvial endmembers during humid periods. However, that does not imply that the aeolian endmember has to be the dominant endmember during arid phases. The cores in proximal positions to fluvial sources will always be dominated by the fluvial endmember, but the aeolian endmember will increase during the arid phases relative to the fluvial endmember.
Endmember modelling of core SL99 resulted in distinctly coarser modes for all three endmembers compared with the other cores, with modes of 50 µm, 40 µm, and 32/20 µm (Fig. 2, Table 2). The coarsest endmember is indicative of a dust source in a proximal position to site SL99 (Schütz et al., Reference Schütz, Jaenicke and Pietrek1981; d'Almeida and Schütz, Reference d'Almeida and Schütz1983; Coudé-Gausssen, Reference Coudé-Gausssen1988, Reference Leinen and Sarntheim1989). The concentration patterns of terrigenous sand and silt fractions of core SL99 (Supplementary Fig. S3) correlate well with the loadings of this endmember. They show distinct minima during the humid phases and higher values during the arid periods (Fig. 5, Supplementary Fig. S3), thus indicating they are both controlled by dust influx. However, the modal grain sizes of EM2 and EM3 are also too coarse to be interpreted as fluvial suspension load. There is at present no fluvial source that could provide such coarse grain sizes to the core location (Walling and Moorehead, Reference Walling and Moorehead1989). Thus, all three endmembers are interpreted to represent Saharan dust. The fluvial/pelagic suspension load at this site probably is contained in the clay fraction, which was not included in the endmember modelling and comprises some 60%–75% of the terrigenous sediment fraction (Supplementary Fig. S3).

Figure 5. Temporal loading patterns of the dust endmembers (EM1) of all investigated sediment cores. Bold red lines: 7-point running average. The grey shaded areas mark the sapropels. The inset sketches the differences between humid phases (A) and arid phases (B) in northern Africa. (For interpretation of the references to colour in this figure legend, the reader is referred to the web version of this article.)
In several cores, the Saharan dust endmember is bimodal (Fig. 2). Bimodal/multimodal distributions for Saharan dust were also documented by other studies (Pye, Reference Pye1992; O'Hara et al., Reference O'Hara, Clarke and Elatrash2006; Blanchet et al., Reference Blanchet, Tjallingii, Frank, Lorenzen, Reitz, Brown, Feseker and Brückmann2013; van der Does et al., Reference van der Does, Korte, Munday, Brummer and Stuut2016). The bimodal character may be the result of any combination of factors like: multiple source areas with regard to composition and location, seasonal changes in wind direction and/or strength, and storm events (Schütz et al., Reference Schütz, Jaenicke and Pietrek1981; d'Almeida and Schütz, Reference d'Almeida and Schütz1983; Duce, Reference Duce, Charlson and Heintzenberg1995; Israelevich et al., Reference Israelevich, Ganor, Levin and Joseph2003). Finally, different transport heights of aeolian sediments may result in different grain sizes, with larger particles transported near the ground and finer particles transported at greater heights (Ryder et al., Reference Ryder, Highwood, Lai, Sodemann and Marsham2013a). However, our data do not allow us to distinguish between these alternatives.
The minor difference in the modes of the dust endmembers between the two neighbouring sites SL110 (55 µm) and SL112 (48 µm) may be due to the different investigated time intervals of 144 ka and 26 ka, respectively, or to the lower resolution of the study by Hamann et al. (Reference Hamann, Ehrmann, Schmiedl and Kuhnt2009) on SL112.
The endmembers in the uppermost few samples of each core represent the present-day pattern of sediment influx to the Eastern Mediterranean Sea, that is, we find a dominant fluvial endmember in cores SL112 and SL110 recovered from the Nile discharge plume, whereas the dust endmember dominates the core tops of SL99 and SL71, which at present-day are not in the reach of riverine sediment influx.
Spatial variation of dust grain sizes
Although the majority of Saharan dust is transported towards the North Atlantic Ocean by the northeast trade winds (Engelstaedter et al., Reference Engelstaedter, Tegen and Washington2006; Moreno et al., Reference Moreno, Querol, Castillo, Alastuey, Cuevas, Herrmann, Mounkaila, Elvira and Gibbons2006), some 100 × 106 t are blown to the Mediterranean Sea (Ganor and Foner, Reference Ganor, Foner, Guerzoni and Chester1996), of which ca. 25 × 106 t are deposited in its eastern basin (Ganor and Mamane, Reference Ganor and Mamane1982). The most important source regions for this material are (1) the central and eastern Libyan Desert; (2) northern Algeria and Tunisia, including the chotts; and (3) southern Egypt and northern Sudan (Scheuvens et al., Reference Scheuvens, Schütz, Kandler, Ebert and Weinbruch2013; Fig. 1). The dust is mainly transported by the sirocco that blows from southern directions towards the Eastern Mediterranean Sea. Dust transport occurs mainly in spring and early summer during short events (Pye, Reference Pye1992; Engelstaedter et al., Reference Engelstaedter, Tegen and Washington2006; Stuut et al., Reference Stuut, Smalley and O'Hara-Dhand2009; Scheuvens et al., Reference Scheuvens, Schütz, Kandler, Ebert and Weinbruch2013). Dust influx from the northern borderlands by the northwest Etesian winds is negligible compared with influx from other sediment suppliers (Chester et al., Reference Chester, Baxter, Behairy, Connor, Cross, Elderfield and Padgham1977), and dust influx from the eastern borderlands is also strongly limited by the prevailing wind systems.
The modal grain sizes of the dust endmembers in the investigated sediment cores from the Eastern Mediterranean Sea show a zonal distribution pattern (Fig. 6). The coarsest dust endmembers occur in the southern sediment cores, that is, SL99, SL110, and SL112, with coarse modes of 48–55 µm and finer modes of 20–23 µm. Medium-sized dust endmembers characterize sediment cores SL71, SL114, SL119, and SL123 in the central and northern Levantine and Ionian Seas. They have coarse modes of 38–40 µm and finer modes of 18–20 µm. The smallest dust grain sizes are found in the two Aegean Sea sediment cores SL143 and SL148, with modes of around 31 µm. Thus, as expected and shown for other regions (Stuut et al., Reference Stuut, Zabel, Ratmeyer, Helmke and Schefuß2005; Goudie and Middleton, Reference Goudie and Middleton2006; Mahowald et al., Reference Mahowald, Albani, Kok, Engelstaeder, Scanza, Ward and Flanner2014; van der Does et al., Reference van der Does, Korte, Munday, Brummer and Stuut2016), the grain size of Saharan dust transported to the Eastern Mediterranean Sea decreases gradually with increasing distance from the North African source area. A further distribution of dust particles by ocean currents is limited because of the relatively short retention time of the silt-sized particles in the water column. The consistent distribution pattern of dust grain sizes in the Eastern Mediterranean Sea, however, does not allow us to identify source areas in North Africa or dust trajectories.
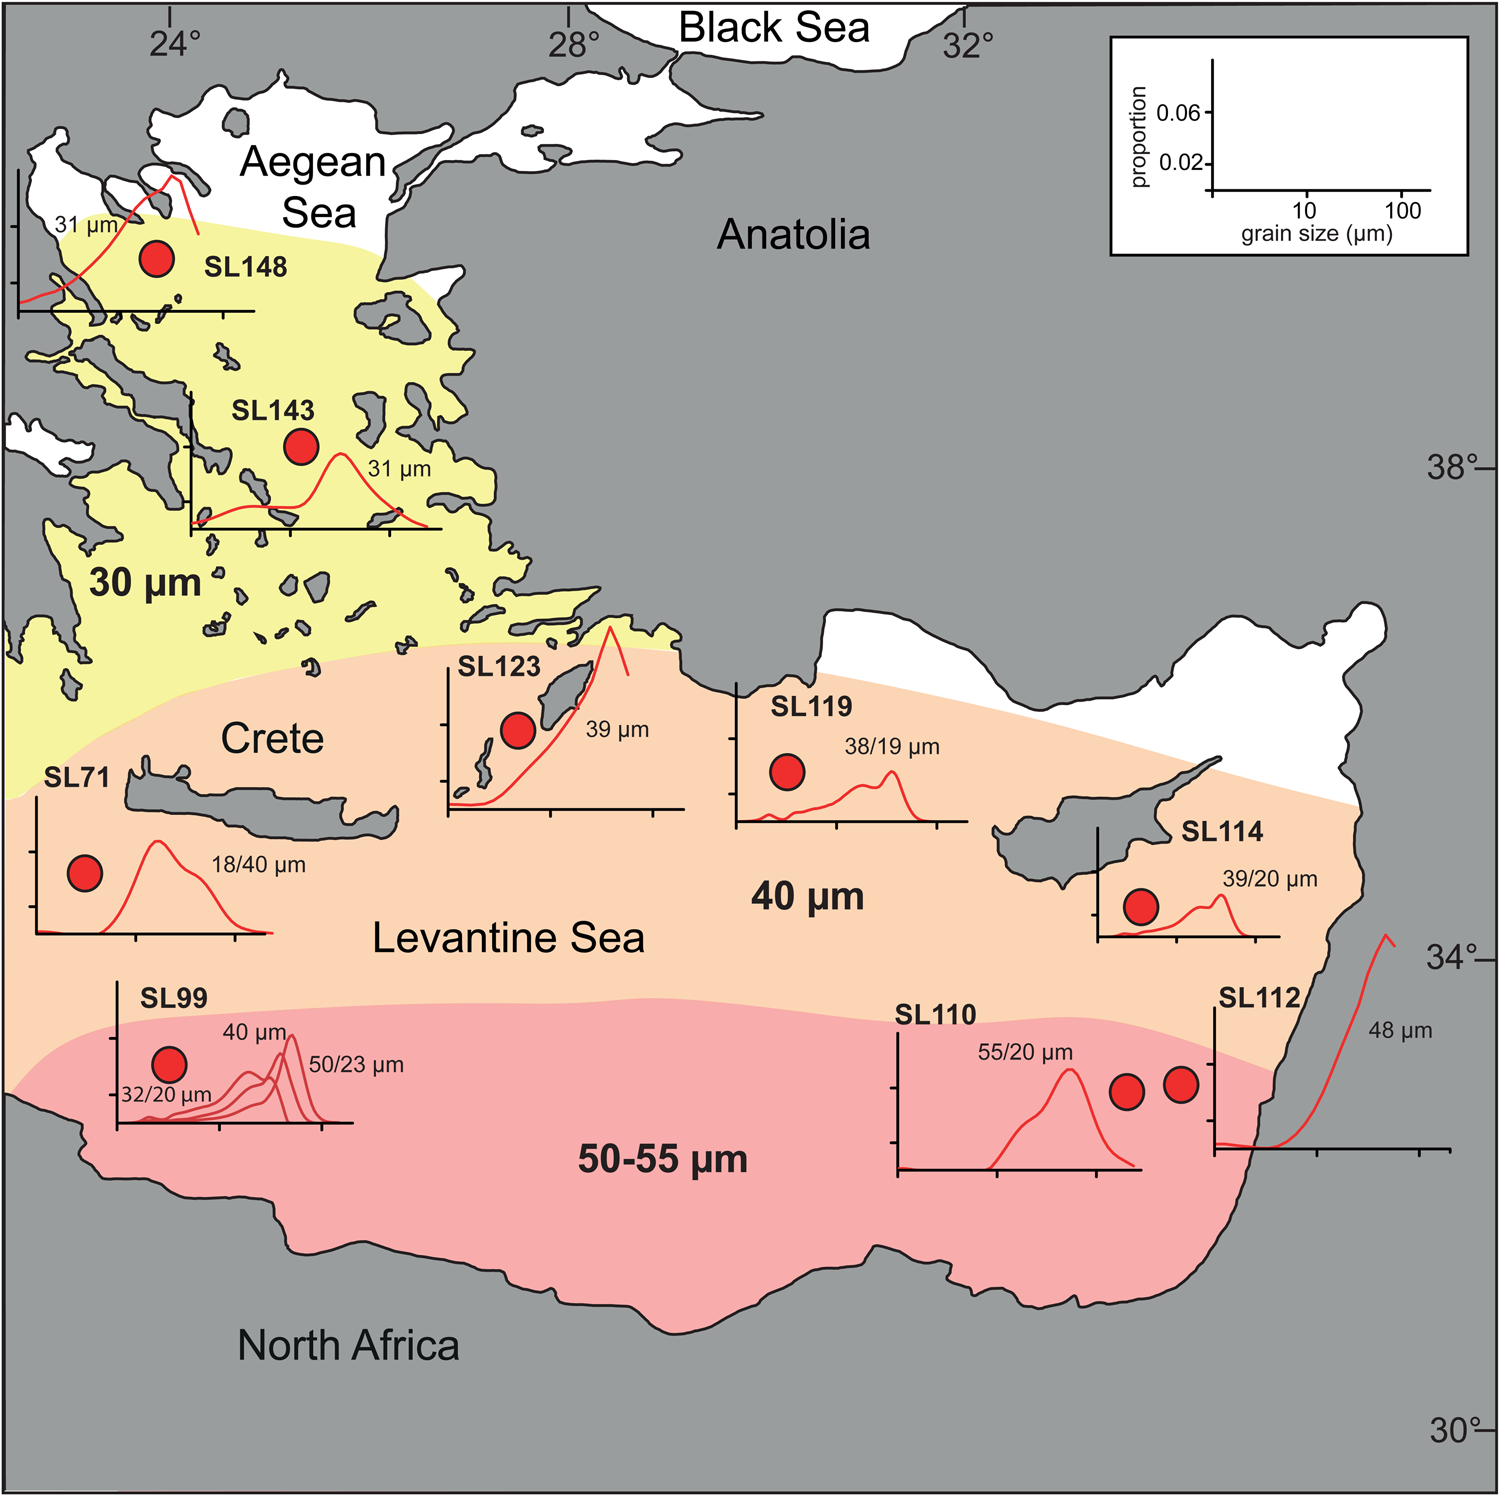
Figure 6. Spatial variation pattern of the dust grain size modes. Dust endmembers and respective grain size modes are plotted next to the core positions, which are marked with red dots. A legend for interpreting the endmember graphs is given in the upper right corner. The distribution pattern shows three zones: ca. 50–55 µm (red), ca. 40 µm (orange), and ca. 30 µm (yellow). (For interpretation of the references to colour in this figure legend, the reader is referred to the web version of this article.)
The overall range of the grain sizes of the dust endmembers remains relatively stable between ca. 10 and 100 µm, while the modes shift towards finer grain sizes further north (Fig. 6). The upper size limit of the dust endmembers at ca. 100 µm is no artefact of our restriction to the silt fraction, because including the sand fraction (<5%) would not significantly alter the trend of the curves.
Three dust endmembers could be distinguished in sediment core SL99 (Fig. 2). Each of them has a narrow size range, but taken together they comprise the same range as the dust endmembers of the other cores. The presence of three dust endmembers in SL99 is probably due to its proximal position to the Saharan dust sources, thus still preserving the fingerprint of each source. With growing distance from the sources, the three dust endmembers cannot be separated any more but merge to one population with a relatively broad and bimodal/multimodal grain size distribution. Thereby, the coarsest endmember generally becomes the most prominent grain size mode, while the finer endmember can only be recognized as a secondary mode of the dust endmember (Fig. 2). With growing distance from the Saharan source region, the dust endmember shifts towards finer modes because of successive deposition of coarser grains during the northward movement of the Saharan dust. Thus, the coarse endmember (50 µm) in core SL99 corresponds to the modes of ca. 40 µm in the northern Levantine Sea and to the modes of ca. 30 µm in the Aegean Sea (Fig. 2).
In the western and central Mediterranean Sea area, the grain sizes of Saharan dust are consistently and distinctly smaller than in the eastern regions. Dust grain sizes of 10–15 µm were reported from the Alboran Sea (Moreno et al., Reference Moreno, Cacho, Canals, Prins, Sánchez-Goñi, Grimalt and Weltje2002), 4–7 µm and 18–22 µm from Valencia in Spain (Sala et al., Reference Sala, Jorge Olcina Cantos and Chiva1996), 15 µm from Genoa in Italy (Ozer et al., Reference Ozer, Erpicum, Cortemiglia and Luccetti1998), 10–20 µm from the island of Corsica (Guieu et al., Reference Guieu, Loye-Pilot, Ridame and Thomas2002), and 4–10 µm from the Strait of Sicily (Bout-Roumazeilles et al., Reference Bout-Roumazeilles, Combourieu-Nebout, Desprat, Siani, Turon and Essallami2013). It is unlikely that the smaller grain sizes are caused by a greater transport distance, because probable source areas are situated just south of the Atlas Mountains (Scheuvens et al., Reference Scheuvens, Schütz, Kandler, Ebert and Weinbruch2013; Fig. 1). It is also unlikely that the parent material is much finer grained than that of eastern Mediterranean dust. We therefore assume that the smaller grain sizes are due to the Atlas Mountains acting as a topographic barrier and forcing the dust-laden winds to rise to higher altitudes and thereby lose the coarse particles.
Temporal variation of dust influx
Orbital variations
The main feature common to all investigated sediment cores is a reduction in the loadings of the Saharan dust endmembers during the insolation-driven African Humid Periods (Fig. 5). They are coherent with the precession cycle (Figs. 7 and 8). The most prominent changes occur in core SL99, closest to the dust sources in northern Africa. Although all three modelled endmembers of this core represent Saharan dust, only the coarsest EM1 shows a distinct pattern related to the alternating arid and humid phases in northern Africa (Supplementary Fig. S2). Hence, the coarse endmember is obviously sourced in an area strongly influenced by the insolation-driven northward shifts of the ITCZ and the associated rain belt, while the finer endmembers are sourced in areas less influenced by such changes. Therefore, a more southern source area for the coarse endmember is assumed, while the finer endmembers seem to be sourced farther north, where the shift of the monsoonal rain belt causes fewer or no changes in dust production. Also, the suggested patchy nature of the migration of the vegetated areas during humid phases (Drake et al., Reference Drake, Breeze and Parker2013; Egerer et al., Reference Egerer, Claussen and Reick2018) may have contributed to the different strength of the aridity signal in the finer endmembers of core SL99.

Figure 7. Results of the wavelet and frequency analyses of the dust endmember data sets of cores SL143, SL71, SL110, and SL99. Left, results of the wavelet analyses. The cone of influence and the 95% confidence interval are marked. Right, results of the frequency analyses. The 95% confidence interval (green curve), the 90% confidence interval (red curve), and the most distinct periods (in ka) are indicated. (For interpretation of the references to colour in this figure legend, the reader is referred to the web version of this article.)

Figure 8. (colour online) Temporal loading patterns of the silt dust endmembers of sediment cores SL71 (B) and SL99 (C) compared with the kaolinite/chlorite ratio of core SL71 (A), indicating the clay-sized dust input from the Sahara (Ehrmann et al., Reference Ehrmann, Schmiedl, Beuscher and Krüger2017). (D) North African humidity/aridity index (Grant et al., Reference Grant, Rohling, Westerhold, Zabel, Heslop, Konijnendijk and Lourens2017); (E) summer insolation at June 21, 65°N (Laskar et al., Reference Laskar, Robutel, Joutel, Gastineau, Correia and Levrard2004). Grey shaded areas mark sapropels. Darker lines in B and C: 7-point running average. Note that Grant et al. (Reference Grant, Rohling, Westerhold, Zabel, Heslop, Konijnendijk and Lourens2017) used a different age model.
Because only EM1 clearly documents the changes from arid to humid periods, which we want to examine in this section, only this endmember is considered in the following discussion. Both core SL99 and core SL71 show dust endmember loadings of ca. 0.15 in the sapropels S1, S3, S4, and S5, which are linked to strong insolation maxima (Fig. 8). In contrast, the maximum loadings in between the sapropels are ca. 0.45. Thus, we have threefold higher loadings during the arid phases than during the humid phases. The precession signal is strongest in the interglacial periods of sediment cores SL99 and SL71 but weakens/disappears during the last glacial period (Fig. 7). This can be explained by generally weaker African summer monsoon rainfalls during glacial periods, due to colder boundary conditions (Gallego-Torres et al., Reference Gallego-Torres, Martinez-Ruiz, Lange, Jimenez-Espejo and Ortega-Huertas2010).
The dust endmembers document quite well the major precession-driven humid and arid periods (Fig. 8). However, they do not show a detailed correlation with the humidity/aridity index of Grant et al. (Reference Grant, Rohling, Westerhold, Zabel, Heslop, Konijnendijk and Lourens2017), possibly because this index is based on XRF data of the bulk sediment, whereas we only regard the coarse silt fraction.
The coarse dust endmember of SL99 shows a minor reduction in its loadings from ca. 0.45 to ca. 0.30 around 60 ka (Fig. 5). The sand content exhibits the same trend (Supplementary Fig. S3). The minimum can be related to a subordinate humid phase linked to a weaker insolation maximum (Fig. 8). It cannot be seen in the dust endmember of SL71, probably due to the larger distance from the dust source. However, a somewhat reduced influx of windblown clay at around 60 ka was reported from this core and also from core SL143 in the Aegean Sea (Ehrmann et al., Reference Ehrmann, Seidel and Schmiedl2013, Reference Ehrmann, Schmiedl, Beuscher and Krüger2017). Additionally, this humid phase is indicated by only slightly enhanced Nile River discharge compared with other humid phases (Revel et al., Reference Revel, Ducassou, Grousset, Bernasconi, Migeon, Revillon, Mascle, Murat, Zaragosi and Bosch2010; Ehrmann et al., Reference Ehrmann, Schmiedl, Seidel, Krüger and Schulz2016) and by stronger rainfalls documented in the speleothem record of northern Libya (Hoffmann et al., Reference Hoffmann, Rogerson, Spötl, Luetscher, Vance, Osborne, Fello and Moseley2016). It was suggested that the corresponding sapropel layer S2 was primarily very thin and low in organic carbon content (Lourens et al., Reference Lourens, Antonarakou, Hilgen, Van Hoof, Vergnaud-Grazzini and Zachariasse1996), and it is not visible anymore in most sedimentary sequences due to postdepositional oxidation (Emeis et al., Reference Emeis, Sakamoto, Wehausen and Brumsack2000; Löwemark et al., Reference Löwemark, Lin, Chen, Yang, Beier, Werner, Lee, Song and Kao2006).
The weakest insolation maximum at ca. 38 ka is expressed neither in the dust endmember loadings (Fig. 8) nor in the influx of clay-sized dust (Ehrmann et al., Reference Ehrmann, Seidel and Schmiedl2013, Reference Ehrmann, Schmiedl, Beuscher and Krüger2017). However, it resulted in slightly enhanced Nile River discharge (Revel et al., Reference Revel, Ducassou, Grousset, Bernasconi, Migeon, Revillon, Mascle, Murat, Zaragosi and Bosch2010; Ehrmann et al., Reference Ehrmann, Schmiedl, Seidel, Krüger and Schulz2016) and rainfall in northern Libya (Hoffmann et al., Reference Hoffmann, Rogerson, Spötl, Luetscher, Vance, Osborne, Fello and Moseley2016).
To summarize, the two humid periods related to the weak insolation maxima during the last glacial period were much less distinct than those of interglacial time. It is suggested that under the glacial climate regime, the insolation-driven increase in precipitation was not strong enough to significantly alter/reduce the vegetation cover in North Africa to effectively hamper the dust emission.
The dust signal in sediment core SL110 from the deep continental slope off Israel is less distinct than in cores SL99 and SL71. It shows a decrease of the loadings during the humid phases, but this reduction is not as pronounced as in the previous cores (Fig. 5). The wavelet and frequency analyses confirm this result. The precession cycle just reaches the 95% significance level (Fig. 7). This is due to the position of core SL110 proximal to the Nile delta, within the Nile suspension plume. The Nile River transports large quantities of sediment from the African continent into the Eastern Mediterranean Sea. The suspension load is taken up by the counterclockwise surface current and transported towards the east and then farther north along the coast (Venkatarathnam and Ryan, Reference Venkatarathnam and Ryan1971; Milliman and Syvitski, Reference Milliman and Syvitski1992; Wehausen and Brumsack, Reference Wehausen and Brumsack2000). At the position of core SL110, some 80% of modern surface sediments are derived from the Nile River (Krom et al., Reference Krom, Michard, Cliff and Strohle1999). This dominance of fluvial sediments probably masks the Saharan dust signal. Nevertheless, a clear reduction in the dust loadings occurs in sapropels S1, S4, and S5. The decrease in loadings during S3 is less distinct. In contrast to SL99 and SL71, the dust influx does not increase after the termination of the latest sapropel but remains low throughout the Holocene.
The dust signal of core SL110 shows a general increase in its loadings from ca. 0.25 at 70 ka to ca. 0.42 at 15 ka. This could either indicate a general increase in dust input or a decrease in the riverine Nile input. As there is no such general increase in the dust loadings of SL71 and SL99 during this time span, the increase in dust loadings in core SL110 rather documents a reduction of fluvial input. This reduction can also be seen in the decreasing abundance of Nile-derived clay minerals in SL110 (Ehrmann et al., Reference Ehrmann, Schmiedl, Seidel, Krüger and Schulz2016).
In the Aegean Sea core SL143, the humid and arid phases are much less clearly expressed in the dust-loading patterns than in SL99 and SL71 (Fig. 5), and the precession signal does not reach a statistically significant level (Fig. 7). This is probably due to the distal position from the dust source and the large number of fluvial sources contributing to the sediment accumulation in the Aegean Sea (Fig. 1). In contrast to the silt-sized dust, the clay-sized dust of this core shows distinct patterns reflecting the humid and arid phases (Ehrmann et al., Reference Ehrmann, Seidel and Schmiedl2013). While the silt fraction settles out very rapidly from the dust plume, the clay-sized dust is only insignificantly removed during the first 5000 km of transport (Schütz et al., Reference Schütz, Jaenicke and Pietrek1981; van der Does et al., Reference van der Does, Korte, Munday, Brummer and Stuut2016).
The time span recorded in sediment cores SL112, SL114, SL119, SL123, and SL148 is too short to allow the identification of orbital variability using wavelet and frequency analyses. However, the temporal loading patterns show a reduction in the dust endmembers during the youngest humid period and higher dust loadings during the arid phase of the last glacial (Fig. 5). For the time span analysed, the observed dust signal from core SL112 displays a pattern similar to that of core SL110. Because the core locations are close together, they are controlled by similar sedimentation processes.
Core SL114 is located in the distal Nile suspension plume (Krom et al., Reference Krom, Michard, Cliff and Strohle1999). The dust signal at core SL119 shows a clear reduction during the humid period. The changes in the dust signal at the locations of core SL148 and SL123 are only weakly expressed. As for core SL143, this is probably caused by the distal position from the African dust source and the influence of fluvial sediment sources that dominate sedimentation at these locations (Ehrmann et al., Reference Ehrmann, Schmiedl, Hamann, Kuhnt, Hemleben and Siebel2007).
Suborbital variations
In cores SL71 and SL143, sapropel S4 occurs as two separate layers. The sapropel interruption is documented by both the clay-sized dust input (Ehrmann et al., Reference Ehrmann, Seidel and Schmiedl2013, Reference Ehrmann, Schmiedl, Beuscher and Krüger2017) and the loading patterns of the silt-sized dust (Fig. 5). It is also visible in other sediment cores from the Eastern Mediterranean Sea (Calvert and Fontugne, Reference Calvert and Fontugne2001; Grant et al., Reference Grant, Rohling, Bar-Matthews, Ayalon, Medina-Elizalde, Ramsey, Satow and Roberts2012). Corresponding patterns are also documented in speleothem records of Soreq Cave in Israel (Bar-Matthews et al., Reference Bar-Matthews, Ayalon and Kaufman2000, Reference Bar-Matthews, Ayalon, Gilmour, Matthews and Hawkesworth2003) and Kanaan Cave in Lebanon (Nehme et al., Reference Nehme, Verheyden, Noble, Farrant, Sahy, Hellstrom, Delannoy and Claeys2015).
The interruption was most probably caused by the Heinrich-like cold event C23 at ca. 104.5–103 ka (McManus et al., Reference McManus, Bon, Broecker, Johnsen, Labeyrie and Higgins1994; Grant et al., Reference Grant, Grimm, Mikolajewicz, Marino, Ziegler and Rohling2016). The interruption is not visible in the coarse endmember of core SL99 but in the abundance of the total silt fraction (Supplementary Fig. S3). This can be explained by the different source areas of the dust endmember of core SL99. The source of the coarse endmember is unaffected by this short-term event, while the sources of the finer dust endmembers are influenced.
Heinrich events are well documented in the clay-sized dust influx to site SL71 (Ehrmann et al Reference Ehrmann, Schmiedl, Beuscher and Krüger2017; Fig. 8A). They also can be seen in the coarse-grained dust influx to SL71 and SL99, although somewhat obliterated (Fig. 8 B and C, smoothed curves). The southward shift of the African rain belt during the Heinrich events led to a drying of North Africa (Mulitza et al., Reference Mulitza, Prange, Stuut, Zabel, Dobeneck, Itambi, Nizou, Schulz and Wefer2008), combined with stronger winds and dust production and transport.
In addition to the cs. 23-ka period, the wavelet and frequency analyses of SL71 show smaller, millennial-scale signals (i.e., 1.1-ka periodicity), especially during the last glacial period. They may represent Dansgaard-Oeschger cycles. Closer to the North African coast, the signal might be masked by high sediment input, with growing distance from the dust source, it becomes too weak to be recognized at all. Overall, the suborbital signals seem to be suppressed in the wavelet and frequency analyses by the strong precession signal. More analyses are needed to give a solid interpretation of these suborbital variabilities.
CONCLUSIONS
Endmember modelling of the terrigenous silt fraction in nine sediment cores from the Eastern Mediterranean Sea revealed detailed information about aeolian sediment transport from northern Africa into the Eastern Mediterranean Sea and how this transport was influenced by the climatic and hydrologic changes of the past ca. 180 ka in northern Africa.
The dust endmembers show decreasing modal grain sizes with growing transport distance. Modes of around 50 µm occur close to the North African coast. They decrease to around 40 µm in the central part of the Eastern Mediterranean Sea and to 30 µm in the Aegean Sea.
The endmembers indicating Saharan dust show an especially distinct pattern of dependence on climatic changes, with decreased contributions during the African Humid Periods and increased contributions during the drier phases in between. In the cores located close to the Nile delta, riverine sediments represent high contributions to the sediment record. They also reflect the changes between dry and humid phases, even partly masking the dust signal.
The influence of the insolation-driven African Humid Periods on the sediment record of the Eastern Mediterranean Sea can be shown by the use of wavelet and frequency analyses on the dust endmember data. Precession frequencies are observed in the proximal cores SL99, SL71, and SL110, which had an appropriate recovery. SL143 also documents a long time span, but is farthest from the African coast, and thus the precession signal is diluted by sediment input from northern sources. The time span covered by the other cores is too short to document orbital cycles.
The influence of the African Humid Periods diminishes with growing transport distance due to settling processes and mixing with sediments from other sources. This is also reflected in the results of the frequency and wavelet analyses. The precession cycle can barely be recognised in the northernmost cores.
In sediment core SL99, all modelled endmembers are interpreted as Saharan dust. At this position, close to the North African shore, the different dust endmembers can be separated, while they merge into one relatively broad and multimodal endmember with growing transport distance.
ACKNOWLEDGMENTS
We thank chief scientist C. Hemleben, the master and crew of RV Meteor, and core curator H. Schulz. S. Haeßner is acknowledged for perpetual and intensive support in the laboratory. Further technical support came from M. Seidel, S. Nebel, M. Haeßner, T. Claus, and D. Bunke. We thank the Deutsche Forschungsgemeinschaft (DFG) for funding. We also thank K. Grant, an anonymous colleague, and the editor for constructive reviews and advice.
SUPPLEMENTARY MATERIAL
To view supplementary material for this article, please visit https://doi.org/10.1017/qua.2019.71


