


Introduction
Marine terraces, formed during sea-level high stands and subsequently uplifted above sea level, represent the combined imprint of the glacioeustatic sea-level cycle and vertical uplift on coastal geomorphology (Lajoie, Reference Lajoie1986; Pedoja et al., Reference Pedoja, Husson, Johnson, Melnick, Witt, Pochat and Nexer2014). When terraces form along an uplifting coast, they can be correlated with known high stands, provided that the ages of the terraces can be determined. This study focuses on the North Canterbury region of New Zealand, where uplift related to active faulting and folding has produced extensive marine terraces along the coast. These terraces have been the subject of a number of previous studies (Jobberns, 1926, Reference Jobberns1928; Jobberns and King, Reference Jobberns and King1933; Carr, Reference Carr1970; Bull, Reference Bull1984; Yousif, Reference Yousif1987; Barrell, Reference Barrell1989; Ota et al., Reference Ota, Yoshikawa, Iso, Okada and Yonekura1984, Reference Ota, Pillans, Berryman, Beu, Fujimori, Miyauchi and Berger1996), many of which have proposed possible correlations with sea-level high stands, and estimates of their ages have been used in studies that address rates of deformation (Nicol et al., Reference Nicol, Alloway and Tonkin1994) and the level of seismic hazard (Barrell and Townsend, Reference Barrell and Townsend2012). Despite this body of work, the terraces remain poorly dated (Ota et al., Reference Ota, Yoshikawa, Iso, Okada and Yonekura1984, Reference Ota, Pillans, Berryman, Beu, Fujimori, Miyauchi and Berger1996), with little geochronological data to support proposed correlations with sea-level high stands. Previous workers have had few options for dating the terraces; most are too old for radiocarbon dating, and corals suitable for uranium series dating have not been found in New Zealand terraces (Pillans, Reference Pillans1990), despite the success of this technique in terrace studies in other parts of the world (e.g., Muhs et al., Reference Muhs, Rockwell and Kennedy1992). More modern techniques, such as luminescence dating and amino acid racemization (AAR), however, provide the opportunity to date the North Canterbury marine terraces and to test previous age estimates.
In this study, we report the results of infrared-stimulated luminescence (IRSL) and AAR analyses of sediments and shells from marine terraces. We use AAR analyses of shells from deposits of known age, predominantly from the Whanganui Basin of the southern part of the North Island, New Zealand, to calibrate the rate of AAR. This study expands on previous AAR studies in the region by analyzing the extent of AAR in multiple amino acids preserved within the intracrystalline fraction of the shell carbonate, and by using newly developed Bayesian statistical methods for developing an AAR age equation and calculating age uncertainties. We then apply this AAR age model in combination with IRSL to date marine terraces of unknown age along the coast of North Canterbury, South Island. We demonstrate the value of AAR and IRSL as independent, but complementary methods in establishing a terrace chronology, we provide new ages for the North Canterbury terraces that differ from previous estimates, and we develop an AAR chronology for the species Tawera spissa extending back to marine isotope stage (MIS) 17 in the region.
Background
AAR calibration sample sites
In order to calibrate the AAR age model, mollusk shells were collected from six previously studied sites, the ages of which are known independently from methods other than AAR. Four of these sites are in the Whanganui Basin (Fig. 1). The late Cenozoic marine sedimentary sequence that accumulated in near-shore Whanganui Basin was uplifted (Kamp et al., Reference Kamp, Vonk, Bland, Hansen, Hendy, McIntyre, Ngatai, Cartwright, Hayton and Nelson2004) and exposed along the coast. Bowen et al. (Reference Bowen, Pillans, Sykes, Beu, Edwards, Kamp and Hull1998) previously developed an aminostratigraphy for the Pleistocene beds of the sequence using the amino acids d-alloisoleucine/l-isoleucine (A/I) in the molluscan species T. spissa and Austrovenus stutchburyi. This work demonstrated the utility of the technique in combination with tephrochronology and MIS periodicity, and it showed that the two venerid bivalves racemize at similar rates.

Figure 1 Major features of the New Zealand plate boundary showing sampling sites. Haumuri Bluff, Motunau Beach, and Glenafric are the sites of marine terraces within the North Canterbury fold-and-thrust belt (NCFTB) that were dated in this study. Cape Kidnappers, Whanganui, and All Day Bay were sampled for the amino acid racemization calibration. The extent of basement rocks in the inset is from Rattenbury et al. (Reference Rattenbury, Townsend and Johnston2006) and Forsyth et al. (Reference Forsyth, Barrell and Jongens2008).
Our four Whanganui samples were collected from three locations along the coast.
-
1. Coastal bluffs along Castlecliff Beach (site 11 of Bowen et al., Reference Bowen, Pillans, Sykes, Beu, Edwards, Kamp and Hull1998) expose gently dipping early to middle Pleistocene marine strata whose ages are well constrained by multiple lines of evidence including tephrochronology (Kohn et al., Reference Kohn, Pillans and McGlone1992; Alloway et al., Reference Alloway, Pillans, Sandhu and Westgate1993; Shane et al., 1996; Pillans et al., Reference Pillans, Alloway, Naish, Westgate, Abbott and Palmer2005) and cyclostratigraphy (Beu and Edwards, Reference Beu and Edwards1984; Carter and Naish, Reference Carter and Naish1998; Naish et al., Reference Naish, Abbott, Alloway, Beu, Carter, Edwards and Journeaux1998). We collected T. spissa and other taxa from the Kupe Formation (MIS 17) and the Shakespeare Cliff Sand (MIS 11). Samples from several of the older formations at Castlecliff Beach were also analyzed for AAR (Supplementary Table 2), but no T. spissa shells were found and data are not included in the calibration.
-
2. Road and river cuts near the mouth of Whanganui River at Landguard Bluff expose a complicated stratigraphy of marine and terrestrial sediment (Pillans et al., Reference Pillans, Holgate and McGlone1988). We sampled T. spissa and other taxa from the Waipuna Delta Conglomerate (site 4 of Bowen et al., Reference Bowen, Pillans, Sykes, Beu, Edwards, Kamp and Hull1998), which is correlated with the Ngarino marine terrace (Beu and Edwards, Reference Beu and Edwards1984). An MIS 7c age for the conglomerate has been established by Pillans et al. (Reference Pillans, Holgate and McGlone1988) on the basis of stratigraphy, paleontology, and identification of a tephra of known age.
-
3. Also in the Whanganui area, sediments underlying the Hauriri marine terrace are exposed at Waverley Beach (site 2 of Bowen et al., Reference Bowen, Pillans, Sykes, Beu, Edwards, Kamp and Hull1998) where they have been correlated with MIS 5a (Pillans, Reference Pillans1983) based on their elevation relative to terraces of known age.
Our other samples were collected from two sites not within the Whanganui Basin.
-
1. Approximately 150 km to the east, an uplifted marine terrace at Cape Kidnappers (site 1 of Bowen et al., Reference Bowen, Pillans, Sykes, Beu, Edwards, Kamp and Hull1998) exposes Holocene marine sediment with T. spissa shells that were previously radiocarbon dated to around 2.5 ka (Hull, Reference Hull1987). Although we could not relocate T. spissa shells, we collected shells of Venerupis largillierti and analyzed them for both AAR and radiocarbon.
-
2. In the Otago region on the South Island, we collected T. spissa shells at about 3 meters above sea level (m asl) exposed in a coastal bluff at All Day Bay underlying a prominent terrace. Given its elevation, the fact that this segment of coast is tectonically stable (Pillans, Reference Pillans1990), and the presence of other MIS 5e terraces in this area (Pillans, Reference Pillans1990), an MIS 5e age is indicated for this sample.
North Canterbury marine terraces—tectonic setting and previous work
The North Canterbury terraces lie within the North Canterbury fold-and-thrust belt, a distinct structural domain within the larger Canterbury region (Pettinga et al., Reference Pettinga, Yetton, Van Dissen and Downes2001). The fold-and-thrust belt lies on the Pacific plate near the transition between the Hikurangi subduction zone, which forms the plate boundary to the north, and the transpressive Alpine Fault, which forms the plate boundary through most of the South Island (Fig. 1). It is bounded to the north by the strike-slip Hope Fault, to the west by the Southern Alps, and to the south by the Canterbury Plains (Pettinga et al., Reference Pettinga, Yetton, Van Dissen and Downes2001).
Marine terraces (Fig. 2) occur along much of the coastline within the fold-and-thrust belt, most prominently on the limbs of actively growing, basement-cored anticlines. Typically, there is one wide terrace, from several hundred meters to as much as 3.5 km in width (Fig. 2a and b), with two or three smaller, more dissected terrace remnants above it (Carr, Reference Carr1970; Yousif, Reference Yousif1987; Barrell, Reference Barrell1989). The marine terraces of North Canterbury were first systematically described by Jobberns (1926, Reference Jobberns1928) and Jobberns and King (Reference Jobberns and King1933). These early works established the marine origin of the terraces. Carr (Reference Carr1970) mapped terraces in the southern part of North Canterbury and proposed correlations with interglacial periods of Suggate (Reference Suggate1965). Bull (Reference Bull1984) correlated the terraces at Kaikoura Peninsula with the U-series-dated New Guinea terrace sequence of Bloom et al. (Reference Bloom, Broecker, Chappell, Matthews and Mesolella1974) and Chappell (Reference Chappell1983), based on the altitudinal spacing of the terraces. Yousif (Reference Yousif1987) used remote sensing to map terraces and assigned ages based on correlation to sea-level high stands, using relative elevation, relationships to fluvial aggradation gravels inferred to date from periods of glacial advance, and proposed correlations between knick points and terraces. Barrell (Reference Barrell1989) mapped and proposed ages for terraces in the vicinity of Motunau Beach based on elevation and correlation to sea-level high stands. Ota et al. (Reference Ota, Yoshikawa, Iso, Okada and Yonekura1984, Reference Ota, Pillans, Berryman, Beu, Fujimori, Miyauchi and Berger1996) were the first to apply numerical geochronological techniques (AAR and 14C) to the North Canterbury terraces, working in the northern part of the area. Most recently, terraces capped by marine deposits were mapped at 1:250,000 scale (Rattenbury et al., Reference Rattenbury, Townsend and Johnston2006; Forsyth et al., Reference Forsyth, Barrell and Jongens2008) and were assigned to MISs on the basis of elevation and degree of dissection. Table 1 summarizes the ages assigned to the terraces in these previous studies.
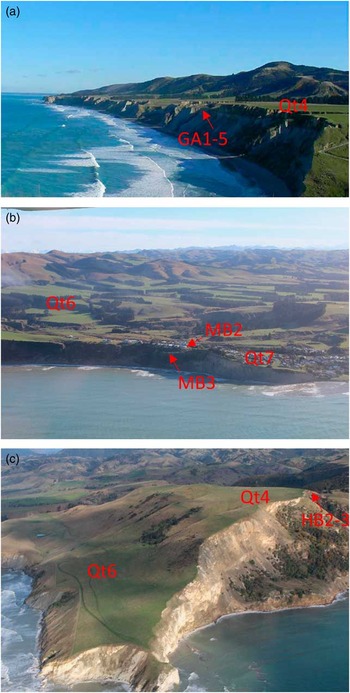
Figure 2 (color online) Aerial views of marine terraces at the following: (a) Glenafric; view is to the south. (b) Motunau Beach; view is to the west. (c) Haumuri Bluff; view is to the south. Sample sites (GA, MB, and HB) and terrace units (Qt) are labeled.
Table 1 Names and ages of marine terraces based on previous work and this study.

Notes: Gray boxes indicate that a terrace is not present in a given area or was not described by a given study. MIS, marine isotope stage.
a Terrace ages from Carr (Reference Carr1970) and Ota et al. (Reference Ota, Yoshikawa, Iso, Okada and Yonekura1984) use the glacial-interglacial stage names of Suggate (Reference Suggate1965). From youngest to oldest, the interglacials are Aranuian (present), Oturian, Terangian, and Waiwheran.
b QMAP (quarter million mapping program) geologic maps covering this area are Rattenbury et al. (Reference Rattenbury, Townsend and Johnston2006) and Forsyth et al. (Reference Forsyth, Barrell and Jongens2008).
The AAR dating by Ota et al. (Reference Ota, Pillans, Berryman, Beu, Fujimori, Miyauchi and Berger1996) and 14C dating by Ota et al. (Reference Ota, Yoshikawa, Iso, Okada and Yonekura1984) are the only numerical ages for the North Canterbury terraces (Table 1). Previous luminescence dating in the Canterbury region has focused on loess (Berger et al., 2001; Almond et al., Reference Almond, Shanhun, Rieser and Shulmeister2007) and glacial or glaciofluvial sediments (Rother et al., Reference Rother, Shulmeister and Rieser2010; Shulmeister et al., 2010; Rowan et al., Reference Rowan, Roberts, Jones, Duller and Covey-Crump2012), although IRSL dating has proved useful in dating marine sediments in North Westland (Rose, Reference Rose2011). The previous work in Canterbury has shown promise but also difficulties for the technique (Rowan et al., Reference Rowan, Roberts, Jones, Duller and Covey-Crump2012), including some age reversals in loess IRSL ages (Berger et al., 2001; Almond et al., Reference Almond, Shanhun, Rieser and Shulmeister2007). Feldspar IRSL, which we use in this study, does not suffer from the low signal intensities observed in quartz in this region (Rowan et al., Reference Rowan, Roberts, Jones, Duller and Covey-Crump2012). It can be susceptible to anomalous fading (Huntley and Lamothe, Reference Huntley and Lamothe2001; Huntley and Lian, Reference Huntley and Lian2006), but this phenomenon has not been observed in previous South Island studies (Almond et al., Reference Almond, Moar and Lian2001; Hormes et al., Reference Hormes, Preusser, Denton, Hajdas, Weiss, Stocker and Schlüchter2003; Preusser et al., Reference Preusser, Andersen, Denton and Schlüchter2005; Rother et al., Reference Rother, Shulmeister and Rieser2010; Shulmeister et al., 2010; Rose, Reference Rose2011). Given the scarcity of numerical ages for the North Canterbury marine terraces, we dated samples from three locations along the North Canterbury coast, where marine terraces are prominent: Glenafric, the Motunau Beach area, and Haumuri Bluff (Fig. 3).

Figure 3 (color online) Three North Canterbury field sites: Glenafric (a), Motunau Beach area (b), and Haumuri Bluff (c). Mapping of terraces is based on previous maps by Yousif (Reference Yousif1987), Barrell (Reference Barrell1989), Warren (Reference Warren1995), Pettinga and Campbell (Reference Pettinga and Campbell2003), Rattenbury et al. (Reference Rattenbury, Townsend and Johnston2006), and Forsyth et al. (Reference Forsyth, Barrell and Jongens2008); unpublished QMAP (quarter million mapping program) record sheets provided by GNS Science (http://data.gns.cri.nz/metadata/srv/eng/search); and interpretation of aerial photographs from Land Information New Zealand. The background is a hill shade of the 10 m DEMs (digital elevation models) from Rattenbury et al. (Reference Rattenbury, Townsend and Johnston2006) and Forsyth et al. (Reference Forsyth, Barrell and Jongens2008).
Glenafric
At the southern end of the North Canterbury fold-and-thrust belt near Glenafric Beach and the adjacent Glenafric farm, marine terraces are uplifted along the limb of a small anticline (Fig. 3a), named the Kate anticline (Wilson, Reference Wilson1963; Yousif, Reference Yousif1987). The most extensive marine terrace at this site (Qt4 in Fig. 3a) is termed the Tiromoana terrace after Carr’s (Reference Carr1970) name for the Quaternary sediments (marine and terrestrial) that overlie the wave-cut platform in this area. It is tilted up to the northeast (Fig. 2a), with the terrace tread rising from about 45 m to about 80 m in elevation over a distance of ~6 km. The bedrock strath is overlain by marine sand and gravel, alluvium, and loess (Fig. 4). Previous age estimates for the terrace have ranged from MIS 3 to 5 (Table 1), although it has not been numerically dated. Remnants of higher terraces form small notches and hilltops and have been grouped into two (Carr, Reference Carr1970) or three (Yousif, Reference Yousif1987) additional terraces on the basis of elevation.

Figure 4 (color online) Representative stratigraphy for the marine terraces dated in this study, showing the locations of samples relative to the bedrock surface. The thickness of stratigraphic units varies laterally on each terrace, including between sample sites. Stratigraphic columns are based on Carr (Reference Carr1970), Ota et al. (Reference Ota, Pillans, Berryman, Beu, Fujimori, Miyauchi and Berger1996), and this study. For uncertainties in ages, see Tables 2, 3, and 5.
We collected two IRSL samples from the principal terrace (Qt4), one from the marine sediment and one from the overlying loess (Fig. 4). We collected T. spissa shells for AAR analyses from the same site as the marine sediment IRSL sample and from an additional site on the same terrace and same stratigraphic position a few tens of meters away. Sample sites are shown in Figure 3a.
Motunau Beach
An extensive marine terrace occupies the coast from south of Motunau Beach north to Stonyhurst Creek (Figs. 2b and 3b, terrace Qt6), along one limb of the Montserrat anticline. At up to 3.5 km wide, this terrace is the widest in North Canterbury. The marine and terrestrial sediments overlying the wave-cut bench were termed the Motunau Formation by Carr (Reference Carr1970), and the terrace has been termed the Motunau Coastal Plain or Motunau Terrace (Jobberns and King, Reference Jobberns and King1933; Carr, Reference Carr1970; Barrell, Reference Barrell1989). Previous age estimates have varied, with most work assigning its formation to sometime in MIS 5 (Table 1), but again there has been no numerical dating. As at Glenafric, higher terraces are preserved as notches in the hillside, which were grouped into two levels by Yousif (Reference Yousif1987) and three by Barrell (Reference Barrell1989), but suitable materials were not found for dating.
We collected two IRSL samples from marine sand of the main terrace where the overlying sediments (Fig. 4) are exposed in road cuts. One sample (MB2) was taken near Motunau Beach village and the other (MB1) at Boundary Creek (Fig. 3b). T. spissa shells for AAR analyses were collected from four sites near the southwest end of the terrace (Fig. 3b), from between 0.3 and 2.8 km from the former sea cliff.
Haumuri Bluff
Haumuri Bluff is the northernmost of our three North Canterbury study sites. Two prominent marine terraces (Qt4 and Qt6 in Fig. 3c), capped by marine sediments and loess, are found at this location, and their correlatives have been mapped along the coast to the south (Ota et al., Reference Ota, Yoshikawa, Iso, Okada and Yonekura1984) on the flanks of the Hawkswood anticline. Ota et al. (Reference Ota, Pillans, Berryman, Beu, Fujimori, Miyauchi and Berger1996) dated the upper terrace (Tarapuhi terrace/Qt4) to MIS 5c on the basis of an AAR age of 135±35 ka and the presence of a cold-water molluscan fauna considered to be incompatible with MIS 5e. Correlating to the sea-level curve of Chappell and Shackleton (Reference Chappell and Shackleton1986), they gave this terrace an age of 100±3 ka and assigned the lower of the two prominent terraces (Amuri Bluff terrace/Qt6) to 59±3 ka, based on the same sea-level curve, given the presence of another terrace (Kemps Hill terrace) immediately to the southwest (Table 1 and Fig. 3c), which is between the Tarapuhi and Amuri Bluff terraces in elevation.
We collected samples for IRSL dating from the marine sediments on both Tarapuhi (Qt4) and Amuri Bluff (Qt6) terraces, and we collected shells for AAR analyses from the Tarapuhi terrace at the location sampled by Ota et al. (Reference Ota, Pillans, Berryman, Beu, Fujimori, Miyauchi and Berger1996) (Figs. 3c and 4). In addition, we found a small terrace at about 4.2 m elevation cut into the Torlesse basement rock northwest of Haumuri Bluff (Fig. 3c), which we call the Torlesse terrace. Leukoma crassicosta shells from this terrace were sampled for 14C and AAR analyses.
Methods
IRSL
IRSL samples were collected from sand and silt lenses or layers within the marine sand and gravel units of the terraces, or in the case of sample GA1, from loess. A metal tube was inserted into the sediment to collect each sample. The ends of the tube were then covered with aluminum foil, and the tube was wrapped in black plastic and taped shut to ensure darkness and moisture retention. For coastal and eolian sediments, the luminescence signal is generally reset by exposure to sunlight during deposition (Kaufman et al., Reference Kaufman, Forman, Lea and Wobus1996; Singarayer et al., Reference Singarayer, Bailey, Ward and Stokes2005), although incomplete resetting or nonresetting was considered for samples that produced anomalously old ages.
IRSL dating of feldspar grains was conducted by the Luminescence Dating Laboratory at Victoria University, Wellington, using the single aliquot regenerative method, as described by Murray and Wintle (Reference Murray and Wintle2000). The blue luminescence of fine-grained (4–11 μm) feldspar was measured during infrared stimulation. Preheating was done at 270°C for 30 s. Blue luminescence centered at about 410 nm was detected using an EMI 9235QA photomultiplier with Schott BG39 and Kopp5-58 filters. Preheating and the use of 410 nm blue luminescence overcomes the potential age underestimation caused by the thermally unstable 290 nm emissions peak (Krbetschek et al., Reference Krbetschek, Rieser and Stolz1996; Clarke and Rendell, Reference Clarke and Rendell1997), which has been an issue for some samples from Westland, New Zealand (Rose, Reference Rose2011), for which UV luminescence was measured instead. Fading tests were performed using the method of Huntley and Lamothe (Reference Huntley and Lamothe2001), but no anomalous fading was detected. Equivalent dose (D e ) values were determined for 8 or 12 aliquots, and the arithmetic mean of these was used for the age calculation.
Dose rates were determined from radionuclide content, water content, and a-value and from the expected dose rate from cosmic rays. Radionuclide contents were measured in the laboratory using gamma spectrometry. Gamma rays were counted for a minimum of 24 h, using a high-resolution, broad-energy gamma spectrometer. Spectra were analyzed with GENIE2000 software. U, Th, and K concentrations were determined by comparison to standard samples. The dose rate from radionuclides was calculated from the activity concentrations of 40K, 208Tl, 212Pb, 228Ac, 214Bi, 214Pb, and 226Ra, using the conversion factors of Guérin et al. (Reference Guérin, Mercier and Adamiec2011). Water content for each sample was calculated as the weight of water divided by dry weight of the sample, with an assumed 25% uncertainty. The a-value, a measure of the contribution of alpha radiation to the luminescence signal (Aitken and Bowman, Reference Aitken and Bowman1975), was estimated at 0.05±0.01 for all samples. The dose rate from cosmic rays was calculated from burial depth, geomagnetic latitude, and altitude, using the formulas and correction factors of Prescott and Hutton (Reference Prescott and Hutton1994).
AAR
Shells of marine bivalve mollusks of the family Veneridae were chosen for the analysis, with the species T. spissa used wherever possible. This species is common in New Zealand (Powell, Reference Powell1979) and has proved suitable for use in previous AAR studies (Ota et al., Reference Ota, Pillans, Berryman, Beu, Fujimori, Miyauchi and Berger1996; Bowen et al., Reference Bowen, Pillans, Sykes, Beu, Edwards, Kamp and Hull1998). Additional analyses were conducted on some other marine mollusk species, which provide a supporting data set for both the calibration and the previously undated samples (Supplementary Table 2). AAR analyses were conducted at the Northern Arizona University Amino Acid Geochronology Laboratory using reverse-phase high-performance liquid chromatography (HPLC) (Kaufman and Manley, Reference Kaufman and Manley1998). Ratios of right- (d) and left-handed (l) isomers were measured for eight amino acids: aspartic acid (Asp), glutamic acid, serine (Ser), alanine (Ala), valine, phenylalanine, isoleucine, and leucine (Leu). In contrast, Ota et al. (Reference Ota, Pillans, Berryman, Beu, Fujimori, Miyauchi and Berger1996) and Bowen et al. (Reference Bowen, Pillans, Sykes, Beu, Edwards, Kamp and Hull1998) used ion-exchange HPLC, which focuses entirely on A/I. Our results are not quantitatively comparable to the previously published results for this reason and because we pretreated the shells to isolate the intracrystalline fraction of amino acids, following the techniques of Penkman et al. (Reference Penkman, Kaufman, Maddy and Collins2008).
AAR calibration curves were calculated using the Bayesian fitting method and R scripts of Allen et al. (Reference Allen, Kosnik and Kaufman2013). We tested four different functions for relating sample age to d/l ratio: apparent parabolic kinetics (APK) (Mitterer and Kriausakul, Reference Mitterer and Kriausakul1989), simple power-law kinetics (SPK) (Goodfriend et al., Reference Goodfriend, Kashgarian and Harasewych1995), constrained power-law kinetics (CPK) (Manley et al., Reference Manley, Miller and Czywczynski2000), and time-dependent reaction kinetics (TDK) (Allen et al., Reference Allen, Kosnik and Kaufman2013). For each function, we tested two possibilities for the d/l value at time 0 (R 0): that it is fixed at 0 and that it is allowed to vary as a fitted parameter (denoted by 0 or 1, respectively, after the function name). For the uncertainty in the age predicted from the d/l ratio, we tested both lognormal and gamma distributions, as suggested by Allen et al. (Reference Allen, Kosnik and Kaufman2013). Of the eight amino acids measured, Ser was not used because its d/l ratio did not increase monotonically with age, and the TDK and CPK models were not tested for Ala and Leu because we measured d/l values greater than 1 for these amino acids. In total, 96 combinations of amino acid, age-d/l function, and probability distribution were tested. Following the methods described in Allen et al. (Reference Allen, Kosnik and Kaufman2013), we used the Bayesian information criterion (BIC) (Schwarz, Reference Schwarz1978) to identify a best-fit model and for Bayesian model averaging (Hoeting et al., Reference Hoeting, Madigan, Raftery and Volinsky1999), which included all models within 6 BIC units of the best-fit model (Allen et al., Reference Allen, Kosnik and Kaufman2013).
Radiocarbon
Holocene shells from two locations were analyzed for 14C in order to date the young terraces and to help calibrate the rate of AAR. These included analyses using gas proportional counting by Beta Analytic, and accelerator mass spectrometry (AMS) using both graphite targets for full-precision ages and carbonate targets for lower-precision ages (Bush et al., Reference Bush, Santos, Xu, Southon, Thiagarajan, Hines and Adkins2013) at the University of California, Irvine, Keck Carbon Cycle AMS facility. Radiocarbon ages were calibrated using Calib 7.0.4 and the Marine13 (Reimer et al., Reference Reimer, Bard, Bayliss, Beck, Blackwell, Ramsey and Buck2013) database. We used a ΔR value of 25±35 14C yr (http://calib.qub.ac.uk/marine/; Higham and Hogg, Reference Higham and Hogg1995) for the North Canterbury samples and −25.8±15 14C yr (Higham and Hogg, Reference Higham and Hogg1995) for the Cape Kidnappers samples.
Results
IRSL
The IRSL ages (Table 2) indicate the marine terraces formed during various stages of the last interglacial cycle, with most corresponding to substages of MIS 5 (Fig. 5) We use 2 standard error uncertainties in order to compare these results to the 95% confidence intervals for the AAR ages. For sample GA2, from the beach facies at Glenafric, the luminescence growth curve approached saturation, resulting in a minimum age estimate far older than any of the other samples. This indicates that the luminescence signal of the sediment had not been zeroed during transport and is unlikely to reflect the true age of the terrace. Sample MB1 showed disequilibrium in the uranium decay chain, which affects the estimated dose rate and thus the age of the sample. Three different ages (Table 2) have been calculated for this sample using three different estimates of uranium content, based on (1) 234Th; (2) 226Ra, 214Pb, and 214Bi; and (3) 210Pb.

Figure 5 (color online) Sample age estimates for the three study areas in relation to marine isotope stages. Interstadials are white; stadials are shaded. Stage boundaries are from Lisiecki and Raymo (Reference Lisiecki and Raymo2005), and substage boundaries are from Williams et al. (Reference Williams, McGlone, Neil and Zhao2015). Error bars represent 95% confidence intervals for amino acid racemization (AAR) calibration curves, 2 standard errors for infrared-stimulated luminesce (IRSL), and 2-sigma range of calendar-year calibrations for radiocarbon ages (14C). Labels next to points indicate the terrace designation in Table 1 for this study. Data are listed in Tables 2, 3, and 5.
Table 2 Analytical data used to calulate luminesence ages.

a U content was calculated in three ways: from 234Th; from 226Ra, 214Pb, and 214Bi; and from 210Pb. For samples for which the three values are within error of each other, only the median value is given here. For MB1, all three are given (in the order listed here).
b Uncertainties of 1 standard error (SE) were reported by the luminescence laboratory. However, we use 2 SE uncertainties in the text for comparison with the 95% confidence intervals on the AAR ages.
c This is a minimum age. The growth curve for sample GA2 trends toward saturation.
d Uranium decay chains were in disequilibrium for sample MB1. Three different ages are calculated based on three different uranium concentrations.
Radiocarbon
The 14C results (Table 3) support late Holocene ages for samples from the low-elevation terraces at Cape Kidnappers and Haumuri Bluff. At Cape Kidnappers, one shell from sample CK4 was dated at 529–455 and 515–325 cal yr BP and is significantly younger than the previously determined age of 2300 cal yr BP for the terrace (Hull, Reference Hull1987). We assume that the shells in our collection were deposited on top of the terrace following its abandonment, perhaps by storm waves. These shells were collected from sand about 1–2 m above the bedrock contact, so they may not be comparable to Hull’s (Reference Hull1987) samples, which were collected from within or immediately above the basal gravel. At Haumuri Bluff, we rejected the 14C age for sample HB5-D as it is inconsistent with samples HB5-B and HB4, which were collected from the same site and the same marine gravel unit, and it consisted of a small shell fragment, which was noted by the laboratory as being very small or nonhomogeneous.
Table 3 Results of radiocarbon analyses.

a CaCO3 targets analyzed at University of California, Irvine (UCI) using the procedure of Bush et al. (Reference Bush, Santos, Xu, Southon, Thiagarajan, Hines and Adkins2013) are considered range-finder ages and are not assigned a laboratory code.
b Beta Analytic code. Analyzed by beta counting. All other samples analyzed by accelerator mass spectrometry (AMS).
c UCI AMS code.
d Northern Arizona University Amino Acid Geochronology Laboratory identifier.
e Years before present, using AD 1950 as the present datum.
f This sample was very small and/or inhomogeneous.
g Two-sigma age ranges determined using Calib 7.0.4 and the Marine13 database.
AAR calibration and ages
Six collections of shells were used for the AAR calibration data set (Table 4). The age for the Cape Kidnappers sample is based on our 14C results (Table 3, sample CK4). Although younger than Hull’s (Reference Hull1987) age for the terrace, this age is paired with our AAR analyses. The ages for the other five samples are based on their independently determined MIS or substage as described previously, using the midpoint of the age range (Lisiecki and Raymo, Reference Lisiecki and Raymo2005; Williams et al., Reference Williams, McGlone, Neil and Zhao2015) as the best age and half the age range as the uncertainty, with assumed Gaussian distribution.
Table 4 Data set used for amino acid racemization calibration.

Note: All analyses on Tawera spissa except mollusks from Cape Kidnappers, which are Venerupis largillierti, which is in the same family as T. spissa. See Supplementary Table 2 for details of individual shells and all amino acids measured.
a Mean annual temperature. Data are from NIWA (the National Institute of Water and Atmospheric Research) for the period 1981–2010 from stations closest to the sample site, including Napier for Cape Kidnappers, Whanganui for Landguard, Shakespeare Cliff and Kupe Formation, and Dunedin for All Day Bay. For comparison, the MAT at Christchurch is 12.2°C (http://www.niwa.co.nz/sites/www.dev2.niwa.co.nz/files/sites/default/files/mean_monthly_air_temperature.xlsx).
b Number of individual shells analyzed and used to calculate sample mean.
c Marine oxygen isotope stages (MISs) based on ages assigned by previous workers, as described in the text.
d The 95% confidence, based on 14C results for Cape Kidnappers and MIS for the rest. See text for details.
The AAR calibration focuses on Asp d/l (Table 4) because the best-fitting models rely on this amino acid, which is among the most abundant in the shells and analytically the most reproducible. The best-fitting model (lowest BIC) is SPK1 with R 0=0.190 for Asp, with a lognormal distribution, and with coefficient a=1.53×10⁶ yr and exponent b=4.83 (Supplementary Table 3). The range of possible SPK models can be used to assign confidence intervals to the predicted ages (Fig. 6). Seven other models are within 6 BIC units from the best-fit model, the cutoff used for Bayesian averaging (Supplementary Table 3). Six of these models also use Asp, and one uses Leu. Four use SPK; two, TDK; and one, CPK. Four use lognormal distributions, and three use gamma distributions.

Figure 6 Amino acid calibration curve for racemization of aspartic acid (Asp) based on the best-fitting simple power-law kinetics 1 model and lognormal distribution (Supplementary Table 3). Dark shading represents 95% confidence intervals for mean age, and light shading represents 95% prediction intervals. Data are listed in Table 4.
None of the models within 6 BIC units of the best fit is an APK model. This is in agreement with the results of Allen et al. (Reference Allen, Kosnik and Kaufman2013), who generally found APK to provide a poor fit when using the Bayesian fitting procedure. It should be noted, however, that APK can provide a good fit to the three samples of MIS 5e age or younger. We prefer not to use a model that is such a poor fit to our complete data set, however, when the model that best fits the entire data set is still a good fit to the three youngest data points (Fig. 6). Moreover, we aim to generate an AAR age model that can be applied over as wide a range of ages as possible, and SPK provides this, whereas APK does not.
Differences in temperature history among the samples could account for some of the unexplained variance in the AAR calibration. Specifically, the sample from All Day Bay is from significantly farther south than the other samples and thus presumably experienced lower postdepositional temperatures, as indicated by the modern temperature (Table 4). Lower temperatures reduce racemization rates, and thus we would expect the d/l value for this sample to be lower than the trend that is largely determined by results from farther north. The best-fit model, in fact, essentially intersects the d/l value for the MIS 5e sample within errors (Fig. 6), so we conclude that the effect of the temperature difference is not significant, and that the calibration model applies to both islands of New Zealand. The sample from Cape Kidnappers likely experienced similar temperatures to Whanganui (Bowen et al., Reference Bowen, Pillans, Sykes, Beu, Edwards, Kamp and Hull1998; Table 4), but the shells are of the species V. largillierti, which along with T. spissa is in the family Veneridae. Differences in racemization rates among venerid bivalves are estimated at approximately ±10% (Lajoie et al., Reference Lajoie, Wehmiller and Kennedy1980). To test the sensitivity of the calibration model to possible taxonomic effects, we tried adjusting the d/l value of this sample by ±10%. The differences in predicted ages from these adjusted d/l values are minor compared with the uncertainties in the age prediction.
To calculate the age of each of the 10 previously undated samples, we used the average d/l measurements for that sample (n=5) and the Bayesian model averaging of age predictions from all models within 6 BIC units of the best-fit model. For each sample, a weighted mean age was calculated, along with a 95% confidence interval (Table 5). These uncertainties, which take into account the eight models with BIC values below the cutoff, are larger than the confidence intervals for SPK1 alone (Fig. 6).
Table 5 Amino acid racemization ages.

a Number of individual shells analyzed and used to calculate sample mean.
Discussion
Glenafric
The 99±9 ka IRSL age of sample GA1 for the loess on the Qt4 terrace suggests an MIS 5c age for the terrace (Fig. 5). Because the sample was collected from loess, at about 7 m above the top of the marine sediments, its age is a minimum for the terrace. About 5 m of alluvium separates the two layers. Although its rate of deposition is unknown, it was likely deposited rapidly following sea-level retreat, as the low slope of the abandoned terrace would likely have caused aggradation of streams flowing from the adjacent steep hills. Loess accumulation rates are also uncertain, but rates of up to 1 mm/yr have been reported elsewhere in Canterbury (Almond et al., Reference Almond, Shanhun, Rieser and Shulmeister2007). Given such rates of deposition and the uncertainties in the IRSL age and in the timing of sea-level high stands, this result is consistent with an MIS 5c age for the terrace. An MIS 5e age cannot be entirely ruled out, but there are no obvious stratigraphic unconformities within the cover sediments (Fig. 4), suggesting continuous deposition. The three AAR samples from the marine sand and gravel overlying the bedrock strath produce age estimates ranging from 111+42 −42 to 79+43 −29 ka (95% confidence intervals) (Table 5). The youngest (GA5) is most consistent with an MIS 5a age, although the uncertainty overlaps with MIS 5c or 5e as well. This sample exhibits unusually high intershell variability (Table 5), and moreover, MIS 5a is younger than the IRSL age of overlying loess. The other two age estimates lie between MIS 5c and 5e, with uncertainties large enough to encompass both substages. One possibility is that the samples date to MIS 5c but could include shells reworked from substage 5e. The Asp d/l values for this terrace (average of 0.568 for the three samples) are very close to those of the Tarapuhi terrace at Haumuri Bluff (average of 0.564), suggesting that they are the same age, and the age of the latter terrace is more confidently established at MIS 5c (see “Haumuri Bluff” section).
Given the evidence from both IRSL and AAR data, an MIS 5c age is most likely for the main terrace (Tiromoana terrace) at Glenafric. The 60 ka (MIS 3) age estimate of Yousif (Reference Yousif1987), which was based on elevation relative to other terraces, is therefore likely too young, and no MIS 3 terrace appears to be preserved at this location. If the youngest terrace was formed during MIS 5c, then higher terrace remnants identified by Carr (Reference Carr1970) and Yousif (Reference Yousif1987) may represent MIS 5e and MIS 7 (Table 1).
Motunau Beach
Both the IRSL data (Table 2) and AAR data (Table 5) suggest that at least two different ages of marine sediment are represented by the Motunau Beach samples (Fig. 5), despite the fact that they were all collected from the Motunau coastal plain, which appears nearly continuous on its surface. The 54±6 ka IRSL age for sample MB2 suggests an MIS 3 age for this marine unit (Qt7). AAR samples MB3 and MB4, which were collected near MB2, support this interpretation, with estimated ages of 53+41 −21 and 54+38 −24 ka. AAR samples MB5 and MB6, on the other hand, have estimated ages of 68+42 −26 and 83+43 −30 ka, which suggest MIS 5a, although MIS 3 or 5c cannot be ruled out given the range of error for those samples. IRSL sample MB1 gives a range of possible ages because of disequilibrium in the uranium decay chain (Table 2). Such disequilibrium can occur as a result of addition or removal of a mobile daughter product within the decay chain and can lead to overestimation of the sample age (Olley et al., Reference Olley, Murray and Roberts1996). This age range is consistent with an MIS 5e or 5c age for the sample. It is inconsistent with IRSL sample MB2 and AAR samples MB3 and MB4 (Fig. 5). The age for MB1 lies within the 95% confidence intervals of MB6 and MB5, but a younger age for the AAR samples is more likely. Given the AAR data for the other Motunau Beach samples, the youngest of the three possible ages calculated for MB1 (105±12 ka) is the most likely, but the discrepancy between the two dating methods is larger here than at our other sites.
The contrast in ages between the older samples (MB1, MB5, and MB6) and the younger samples (MB2, MB3, and MB4) suggests partial reoccupation of the seaward edge of an older (MIS 5) terrace during the MIS 3 high stand. In this scenario, the lowest, seawardmost part of the older terrace was transgressed during the MIS 3 high stand, but this transgression did not reach the previous sea cliff. Such partial reoccupation can occur when a sea-level high stand reaches the level of the lower part of a previously formed terrace but does not reach all the way to the previous inner edge (Kelsey and Bockheim, 1994). At Motunau Beach, reoccupation occurs only near the seaward edge of the widest terrace within North Canterbury. Alternately, a terrace may have been incised into the lower part of the MIS 5 terrace during MIS 3, but close enough in elevation to the older terrace tread that if any sea cliff formed, it was buried by subsequent colluvial processes and no riser was preserved. These interpretations are in agreement with Carr (Reference Carr1970), who first suggested that the Motunau coastal plain may preserve the record of two marine transgressions.
The older part of the terrace, before reoccupation or incision, would have formed during either MIS 5a (preferred age from AAR samples MB5 and MB6) or MIS 5c-e (IRSL age MB1). The IRSL age is suspect because of the disequilibrium of the U-decay chain, and even the youngest of our three age estimates for this sample might be too old. Further, given the reoccupation or incision of the terrace during MIS 3, an MIS 5c or MIS 5e age for the main terrace would be improbable, and MIS 5a would be more likely. Based on this consideration, the AAR results, and the problematic IRSL results from MB1, we prefer an MIS 5a age for the terrace.
Partial reoccupation of the seaward edge of an MIS 5a terrace during the MIS 3 sea-level high stand is surprising in an uplifting tectonic setting. In this case, however, it is possible given the slope of the MIS 5a terrace and the sea level at this time. The farthest inland MIS 3 sample, MB4, was collected at an elevation of 40 m, immediately on top of the wave-cut platform. Sample MB5, from the MIS 5a terrace, was at 70 m elevation, above a wave-cut platform at 67 m. (MB2 and 3 are offset by a small fault, and MB6 is slumped, so those samples are not useful for this analysis.) The two samples are 1.2 km apart as measured perpendicular to the terrace tread, for a slope of 1.3°, which is low enough to be the original slope of a marine terrace (Trenhaile, Reference Trenhaile2002), although some tectonic tilting cannot be ruled out. Extrapolating this slope inland to the terrace riser (600 m from MB5) would put the buried shoreline angle of the terrace at about 80 m. The actual elevation may be as high as 100 m because of a steeper slope near the inner edge (Carr, Reference Carr1970), but this has been attributed to tectonic warping (Carr, Reference Carr1970; Barrell, Reference Barrell1989), although control on the bedrock elevation near the inner edge is poor away from the Motunau River. Thus, the MB4 sample site was likely at ~40 m below the sea level at the peak of MIS 5a or about −60 m relative to modern sea level, possibly more if the steep slope near the inner edge is not tectonic in nature. Taking a typical age of about 80 ka for MIS 5a and assuming a constant rate of uplift, the sample site would then have been at about −35 m at 60 ka and −23 m at 50 ka. Estimates of MIS 3 sea levels vary widely, with extremes ranging from at or above present-day levels to −85 m (Rodriguez et al., Reference Rodriguez, Anderson, Banfield, Taviani, Abdulah and Snow2000). Our results are consistent with other evidence for relatively high sea levels of −20 to −35 m in New Zealand (Pillans, Reference Pillans1983; Berryman, Reference Berryman1993; Rose, Reference Rose2011) and southern Australia (Cann et al., Reference Cann, Belperio, Gostin and Rice1993; Murray-Wallace et al., Reference Murray-Wallace, Belperio, Gostin and Cann1993) and for similar sea levels in a number of locations worldwide (e.g., Cabioch and Ayliffe, Reference Cabioch and Ayliffe2001; Mallinson et al., Reference Mallinson, Burdette, Mahan and Brook2008; Wright et al., Reference Wright, Sheridan, Miller, Uptegrove, Cramer and Browning2009; Doğan et al., Reference Doğan, Koçyiğit, Varol, Özer, Molodkov and Zöhra2012; Wang et al., Reference Wang, Jones, Chen, Zhao and Zhan2013). They are, however, higher than MIS 3 sea levels inferred from the Huon Peninsula terrace record (Chappell et al., Reference Chappell, Omura, Esat, McCulloch, Pandolfi, Ota and Pillans1996; Yokoyama et al., Reference Yokoyama, Esat and Lambeck2001; Chappell, Reference Chappell2002), for which the highest MIS 3 sea level is −46 to −35 m at 51.8±0.8 ka (Chappell, Reference Chappell2002), as well as most oxygen isotope records (Siddall et al., Reference Siddall, Chappell and Potter2008). If MIS 3 sea level at Motunau Beach did not exceed these lower levels, then the simplest explanation for our results would be that uplift rates have been higher since MIS 3 than between MIS 5a and MIS 3.
The location of the inner edge of the Motunau Beach terrace appears to be lithologically controlled (Jobberns, Reference Jobberns1928), coinciding with the more resistant lower part of the Mt. Brown Formation and the Waikari Formation. As such, multiple sea-level high stands likely reached a similar extent inland, each eroding away previously formed terraces. The MIS 5a terrace may have overprinted the 5c terrace in this manner, whereas the lower sea level of MIS 3 was not able to reach as far inland. Above the main terrace, aligned notches and hilltops suggest older terrace remnants (Carr, Reference Carr1970; Yousif, Reference Yousif1987; Barrell, Reference Barrell1989). We tentatively correlate these with similar remnants at Glenafric (Table 1), which we have assigned to MIS 5e and 7.
Haumuri Bluff
Both IRSL and AAR data support an MIS 5c age for the Tarapuhi terrace (Qt4, Fig. 5), which is in agreement with Ota et al. (Reference Ota, Pillans, Berryman, Beu, Fujimori, Miyauchi and Berger1996). The difference between the two ages is only 1 ka, well within the error of both methods (Fig. 5 and Table 5). For the lower terrace (Amuri Bluff terrace/Qt6), however, Ota et al.’s (1996) estimated age of 59±3 ka is younger than our IRSL age of 74±9 ka. Although not coinciding with the peak of any major sea-level high stand (Siddall et al., Reference Siddall, Chappell and Potter2007), this age suggests deposition during the end of MIS 5a (Fig. 5).
The Kemps Hill terrace (Qt5), which lies between the Tarapuhi (Qt4) and Amuri Bluff (Qt6) terraces in elevation (Ota et al., Reference Ota, Pillans, Berryman, Beu, Fujimori, Miyauchi and Berger1984) must have formed sometime between the two. Most likely, it formed during the early part of MIS 5a because the Tarapuhi and Amuri Bluff terraces appear to be from the later parts of MIS 5c and 5a, respectively (Fig. 5), but a late 5c age cannot be ruled out.
For the low (4.2 m asl) Torlesse terrace northwest of Haumuri Bluff, both 14C and AAR give Holocene ages (Fig. 5). Two of the three 14C ages, HB4 (3.37–3.12 ka) and HB5-B (3.42–3.16 ka), agree, whereas HB5-D (6.99–5.41 ka) is outside the 2-sigma range of the other two (Table 3). Although the older age is closer to the AAR estimate, we rejected HB5-D because the 14C laboratory reported analytical issues as described previously. The younger 14C ages nonetheless overlap the 95% confidence intervals for the 6+16 −4 and 8+17 −5 ka age estimates for the two AAR samples (Table 5). The proportionately large uncertainty in the AAR age of Holocene shells likely reflects the difficulty in applying a calibration model based primarily on Pleistocene data, given the change in temperature and thus racemization rate at the close of the Pleistocene and, in this case, possible differences in racemization rate between T. spissa and L. crassicosta. Although we prefer the late Holocene 14C ages over the middle Holocene AAR ages for the shells of the Torlesse terrace, we note that the marine unit that forms the Conway Flat surface, located 6 km to the southwest at 12 m asl also dates to the middle Holocene (7.0–8.6 ka; Ota et al., Reference Ota, Yoshikawa, Iso, Okada and Yonekura1984). On the other hand, the AAR calibration curve seems to have overestimated the age of the Cape Kidnappers sample, which is likewise Holocene and not T. spissa, so the same effects may be responsible here.
Terrace correlations across the study areas
We have numbered the terraces in our three study areas as Qt1 to Qt8 from oldest to youngest (Table 1) using our geochronology to correlate terraces between localities. We correlate the Tiromoana terrace at Glenafric with the Tarapuhi terrace at Haumuri Bluff (both Qt4). Further, the Motunau terrace, which was previously thought to be the same age as or older than the Tiromoana terrace (Table 1), is now considered to be younger (Qt6) and is correlated with the Amuri Bluff terrace at the Haumuri Bluff locality.
The lack of an extensive MIS 5e terrace at all locations is surprising, considering the high stand was higher and lasted longer than subsequent high stands (Lambeck and Chappell, Reference Lambeck and Chappell2001; Siddall et al., Reference Siddall, Chappell and Potter2007; Dutton and Lambeck, Reference Dutton and Lambeck2012) and that 5e marine terraces are common globally (Pedoja et al., Reference Pedoja, Husson, Johnson, Melnick, Witt, Pochat and Nexer2014) and in other parts of New Zealand (Pillans, Reference Pillans1990). Nor do we find terraces of the same age at all three sites, with our best age estimates indicating MIS 5c terraces at Glenafric and Haumuri Bluff, MIS 5a terraces at Motunau Beach and Haumuri Bluff, and MIS 3 terrace reoccupation only at Motunau Beach. These observations can be explained by the destruction of older terraces by wave erosion during subsequent interstadial periods and by their dissection by fluvial processes during stadial periods. A stretch of cliffed coastline near Motunau Beach, for example, has retreated by 1.6 m/yr since 1950 (Barrell, Reference Barrell1989; Foster, Reference Foster2009), although it was stable before that time, so the long-term average rate is likely less. As noted previously, small terrace remnants above the main terraces at Glenafric and Motunau Beach likely date from MIS 5e, based on their position relative to dated terraces (Fig. 5). That they are so poorly preserved compared with the MIS 5c or 5a terraces suggests that under the right conditions (presumably of rapid erosion and uplift), an MIS 5e terrace can be largely destroyed during these subsequent sea-level high stands. Differences in lithology, exposure to wave attack, and uplift rates among the three sites may explain the differences in terrace preservation at each location. This local variability, the lack of extensive MIS 5e terraces, and the unusual MIS 3 partial reoccupation of the seaward edge of one terrace all present a picture of a complex regime of terrace formation and preservation. Because of this complexity, terrace ages in North Canterbury, and anywhere else in which similar conditions may prevail, can be difficult to discern without the aid of numerical dating.
Although the inner edge of each terrace likely formed during the peak of the corresponding sea-level high stand, there is some evidence that the sediments and shells that we dated were deposited as sea level regressed. The most probable ages for IRSL samples HB2 and HB1 at Haumuri Bluff are from the young ends of MIS 5c and 5a, respectively (Fig. 5), although this is not certain within 95% confidence. In addition, at Motunau Beach, the preferred ages for samples MB6, MB5, MB4, and MB3 are progressively younger with distance away from the terrace inner edge (Table 5 and Fig. 3b), suggesting that they were deposited as the sea level retreated during MIS 5a (MB6 and MB5) and again during MIS 3 (MB4 and MB3), although the uncertainties in the AAR results are large enough that the opposite cannot be completely ruled out. These two lines of evidence suggest deposition during regression, but further investigation is needed to confirm or refute this hypothesis.
Comparison of dating techniques
AAR and IRSL are independent and complimentary techniques for dating Quaternary marine terraces. The range of factors that are incorporated into AAR age uncertainties, including intershell variability and calibration statistics, tend to yield larger errors compared with those that are included in IRSL age uncertainties, which focus on analytical precision rather than geologic uncertainties such as incomplete zeroing of the luminescence signal. In this study, the conservative 95% confidence intervals on the AAR calibration estimated by Bayesian averaging span more than one MIS substage. In practice, our results show good agreement between the most likely stage or substage estimates from AAR and those of IRSL, except in the older part of the Motunau Beach terrace where the IRSL sample had analytical issues. Despite the differences in modern temperature among the sample sites (Table 4), the fit of the model to the calibration data did not show a temperature effect (Fig. 6), and the primarily North Island–based model proved applicable to the North Canterbury data set. AAR is also useful for correlating terraces independently of the errors associated with numerical-age calibration, such as the correlation of the Qt4 terrace from Glenafric with that from Haumuri Bluff. When IRSL and AAR results converge, we have considerably more confidence in the terrace age than if only one method were used. In this study, the methods agreed for terrace Qt4 at Glenafric and Haumuri Bluff and Qt7 at Motunau Beach. When the two methods do not agree, such as at terrace Qt6 in the Motunau Beach area, and when there is reason to doubt one of the results, as with the radioisotope disequilibrium in sample MB1, then we have additional evidence by which to exclude that result.
This study includes the first application of the Bayesian method of Allen et al. (Reference Allen, Kosnik and Kaufman2013) to develop an AAR calibration curve for a Pleistocene data set. It is also the first AAR study in New Zealand to analyze the intracrystalline fraction of amino acids. For Asp d/l, which correlates most strongly with sample age in the calibration data set, the intershell variability based on the intracrystalline amino acids was consistently lower than for shells analyzed using conventional techniques and A/I in previous studies. Specifically, for the four stratigraphic units that were analyzed both in this study and by Bowen et al. (Reference Bowen, Pillans, Sykes, Beu, Edwards, Kamp and Hull1998), the average coefficient of variation (x̅/σ) was 4% for intracrystalline (bleached) Asp d/l versus 9% for unbleached A/I.
Conclusions
Using infrared stimulated luminescence and AAR analyses, we have developed a new chronology for the marine terraces of North Canterbury, and we have developed an AAR age model for Asp racemization in T. spissa that is applicable over a range of latitudes within New Zealand. This work provides the geochronological context for subsequent neotectonic studies of the region, for which marine terraces serve as important markers of uplift rate. More specifically:
-
1. The method of Allen et al. (Reference Allen, Kosnik and Kaufman2013) proved successful in developing an AAR calibration curve for a mostly Pleistocene data set, using Bayesian model fitting and Bayesian averaging of different possible models.
-
2. IRSL and AAR work well together for dating Quaternary marine terraces. Estimated ages from the two methods agree sufficiently well in most cases for a reliable MIS assignment, and disagreement between them in one case helped to confirm the inaccuracy of a suspect IRSL result.
-
3. Numerical dating of terraces is necessary to establish reliable ages. Our results suggest that using elevation or degree of fluvial dissection to date and correlate terraces is insufficient in this region because terraces of different ages are preserved at different sites. Our terrace ages and correlations differ significantly from most previous work (Table 1), which was based on such methods. Where previous numerical dating did exist for Qt4 at Haumuri Bluff (Ota et al., Reference Ota, Pillans, Berryman, Beu, Fujimori, Miyauchi and Berger1996), however, our results agree with that previous work.
-
4. Our new geochronological results indicate that the Tiromoana terrace at Glenafric and the Tarapuhi terrace at Haumuri Bluff were both formed during MIS 5c. The Amuri Bluff terrace at Haumuri Bluff is assigned to MIS 5a. The Motunau coastal plain consists principally of an MIS 5a terrace, which is correlated with the Amuri Bluff terrace, but it has been partially reoccupied during MIS 3. This variety of ages for the widest, most continuous terrace at each site shows that terrace preservation is locally variable.
-
5. Unexpectedly, our results do not support an MIS 5e age for any of the terraces sampled, although this age is common for terraces worldwide. We attribute this to rapid erosion rates.
Acknowledgments
This research was funded by Geological Society of America Graduate Research grants, American Association of Petroleum Geologists Grants-in-Aid, Sigma Xi Grants-in-Aid of Research, a Shell Geosciences Energy Research Facilitation Award, and the Penn State Deike grant and Scholten-Williams-Wright Scholarship in Field Geology. The Amino Acid Geochronology Laboratory is supported by National Science Foundation award EAR-1234413. We would like to thank Mark Quigley, Peter Almond, and Uwe Rieser for assistance in the field; Alan Beu for identifying the mollusks; Ningsheng Wang for advice on interpreting the IRSL results; Katherine Whitacre for analyzing the AAR samples; and the many North Canterbury landowners who kindly allowed us access to their land. We would also like to thank two anonymous reviewers, whose comments have helped us to improve this paper.
Supplementary Materials
To view supplementary material for this article, please visit https://doi.org/10.1017/qua.2016.9


