INTRODUCTION
Many studies aim to quantify the rates of fluvial incision and denudation related to tectonic and climatic influences using geomorphological and/or cosmogenic methods (e.g., Schaller et al., Reference Schaller, von Blanckenburg, Hovius, Veldkamp, van den Berg and Kubik2004; Demoulin et al., Reference Demoulin, Hallot and Rixhon2009; Bétard, Reference Bétard2010; Craddock et al., Reference Craddock, Kirby, Harkins, Zhang, Shi and Liu2010; Godard et al., Reference Godard, Lave, Carcaillet, Cattin, Bourles and Zhu2010; Scherler et al., Reference Scherler, Bookhagen, Wulf, Preusser and Strecker2015). However, the morphological response of closed basins to drainage capture has only recently been studied in detail. Many field examples show the hydrological response of an entire drainage system to the drainage-capture process (e.g., Mather, Reference Mather2000; Stokes et al., Reference Stokes, Mather and Harvey2002; Clift et al., Reference Clift, Blusztajn and Nguyen2006; García, Reference García2006; Prince et al., Reference Prince, Spotila and Henika2010; Yenes et al., Reference Yenes, Monterrubio, Nespereira, Santos and Fernández-Macarro2015; Whipple et al., Reference Whipple, Forte, DiBiase, Gasparini and Ouimet2017). Furthermore, recent historical events illustrating river diversions through drainage capture and overspill display the potential dramatic erosional impact of these processes (Dzurisin, Reference Dzurisin1975; Snyder and Kammer, Reference Snyder and Kammer2008; Anton et al., Reference Anton, Mather, Stokes, Munoz-Martin and De Vicente2015; Shugar et al., Reference Shugar, Clague, Best, Schoof, Willis, Copland and Roe2017).
Sedimentary basins with closed drainage systems (i.e., endorheic basins) trap all the sediments eroded within the watershed. This characteristic feature means that they provide a valuable geologic reference point for estimating subsequent erosion. As closed systems, such basins do not respond to an external base level (e.g., the global ocean), and sedimentation is the dominant process. Therefore, the opening of an outward drainage involves a sudden lowering of the base level, and erosion becomes the dominant process. This leads to high dissection rates in response to the base-level drop, and thus an increase in denudation rates within intrabasinal areas (Sobel et al., Reference Sobel, Hilley and Strecker2003). The fluvial dissection triggered by the establishment of an outward drainage system determines the pattern and velocity of landscape change and the sediment fluxes to the oceans. Because of the links between silicate weathering and denudation rates, this fluvial dissection also influences fluctuations in atmospheric CO2 (e.g., Hilley and Porder, Reference Hilley and Porder2008). In that context, the processes that set the denudation rates on the earth’s surface are also key to understanding the feedbacks between erosion and climate (e.g., Willenbring and von Blanckenburg, Reference Willenbring and von Blanckenburg2010; Willenbring et al., Reference Willenbring, Codilean and McElroy2013). Thus, the manner in which the fluvial dissection progresses, the velocity of the wave of incision, and the way the erosion signals are transmitted upstream are interesting topics to explore.
Because of its intense intraplate deformation (De Vicente et al., Reference De Vicente, Cloetingh, Van Wees and Cunha2011), Iberia provides a unique setting for the study of large endorheic systems and their morphological response to basin opening. In central and northern Iberia, the development of the present-day drainage network and landscape is attributed to infilling during the Cenozoic, and subsequent opening of continental-scale closed fluvial systems (Duero, Ebro, Tajo, and Guadiana) probably during the late Tortonian to Gelasian (Vegas and Banda, Reference Vegas and Banda1982; Gutierrez-Elorza and Pérez-González, Reference Gutierrez-Elorza and Pérez-González1993; Mediavilla et al., Reference Mediavilla, Martin-Serrano, Dabrio and Santisteban1994; Santisteban et al., 1996a, Reference Santisteban, Mediavilla, Martín-Serrano and Dabrio1996b; Alonso-Zarza et al., Reference Alonso-Zarza, Armenteros, Braga, Munoz, Pujalte, Ramos and Aguirre2002; Alonso-Gavilán et al., Reference Alonso-Gavilán, Armenteros, Carballeira, Corrochano, Huerta and Rodríguez2004). The capture of the intrabasinal fluvial systems due to drainage basin opening resulted in a major fall (several hundred meters) of the base level of the basins master drainage lines. This change in base level triggered enhanced fluvial dissection that was progressively transmitted upstream to the entire basin. Existing studies illustrate the fluvial response to drainage-capture processes in southern Spain and other areas (Stokes et al., 2000, Reference Stokes, Mather and Harvey2002; Arboleya et al., Reference Arboleya, Babaut, Owen, Teixell and Finkel2008; Stokes, Reference Stokes2008). The tectonic control on landscape morphology and denudation rates is also widely documented in active tectonic settings (Finnegan et al., Reference Finnegan, Hallet, Montgomery, Zeitler, Stone, Anders and Yuping2008; DiBiase et al., 2010, Reference DiBiase, Heimsath and Whipple2012; Scherler et al., Reference Scherler, Bookhagen and Strecker2014; Rosenkranz et al., Reference Rosenkranz, Schildgen, Wittmann and Spiegel2018). But the quantification of landscape dissection due to drainage-capture processes is still unexplored, and relatively little is known about the rates of geomorphic response in areas of low tectonic activity, such as the Duero Basin. In this study we quantify fluvial dissection rates following basin opening in the Duero Basin for the first time.
Digital elevation models (DEMs) and geologic and geomorphological information from geographic information systems (GIS) provide a relatively easy and rapid way to obtain high-resolution, quantitative, and georeferenced databases to re-create ancient landscapes. Several approaches, using different gridding techniques, can be used to reconstruct previous landforms (Tew and Mancini, Reference Tew and Mancini1995; Leverington et al., Reference Leverington, Teller and Mann2002; Amato et al., Reference Amato, Aucelli and Cinque2003; Pérez-Peña et al., Reference Pérez-Peña, Azañón, Azor, Tuccimei, Della Seta and Soligo2009; Geach et al., Reference Geach, Stokes, Telfer, Mather, Fyfe and Lewin2014), to decipher paleo-shoreline positions (Elez et al., Reference Elez, Silva, Huerta, Perucha, Civis, Roquero, Rodríguez-Pascua, Bardají, Giner-Robles and Martínez-Graña2016) or erosional landscapes (Benito-Calvo and Pérez-González, Reference Benito-Calvo and Pérez-González2007; Benito-Calvo et al., Reference Benito-Calvo, Pérez-González and Pares2008), and to estimate the dimensions and morphology of bodies of water and landforms to constrain hydrological models (DeVogel et al., Reference DeVogel, Magee, Manley and Miller2004; García-Rodríguez et al., Reference García-Rodríguez, Antón and Martinez-Santos2014). In this paper, we apply these techniques to quantify past fluvial dissection and basin denudation.
This paper presents the first attempt to infer the spatial patterns of fluvial dissection and to estimate the volume of eroded material across the Duero Basin (Fig. 1). The Duero Basin is a high-elevation, low-relief basin, the largest in the Iberian Peninsula, with the best-preserved relict surfaces and geologic features from the former endorheic phase (Alonso-Zarza et al., Reference Alonso-Zarza, Armenteros, Braga, Munoz, Pujalte, Ramos and Aguirre2002; Alonso-Gavilán et al., Reference Alonso-Gavilán, Armenteros, Carballeira, Corrochano, Huerta and Rodríguez2004). The predissection topography was reconstructed by applying several gridding methods to the remnants of the deposits that represent the last stages of the basin infill. A comparison of the present and former topography enables the determination of the main erosional patterns for the entire basin and an estimation of the minimum volume of sediments eroded since basin opening. Eroded volumes can then be used to calculate denudation rates based on different postulated capture ages. Comparison of Duero erosion volumes and rates with data from other basins then allows a possible capture age for the Duero Basin to be proposed.
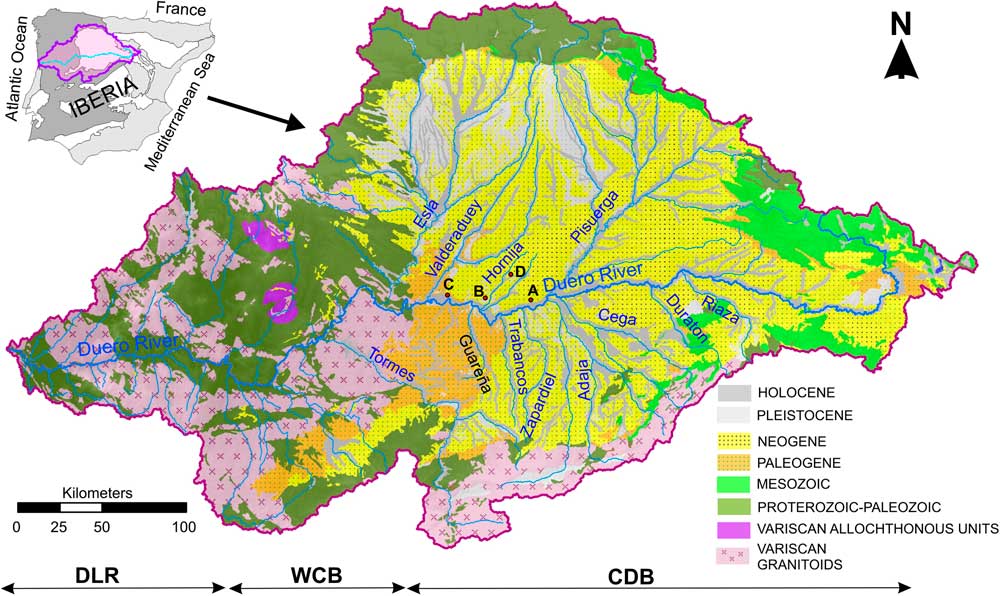
Figure 1. Geographic and geologic setting of the study area. Location of the Duero watershed within the Iberian and geologic maps of the Duero catchment. Main geologic units and fluvial network are displayed. Labeled rivers correspond to the catchments analyzed in this work. CDB, Cenozoic Duero Basin; DLR, Duero lower reach; WCB, Western fringe of the Cenozoic Duero Basin. Red dots (A–D) show the location of the photographs displayed in Fig. 3. (For interpretation of the reference to color in this figure legend, the reader is referred to the web version of this article.)
GEOLOGIC AND GEOMORPHIC BACKGROUND
The Cenozoic Duero continental basin (Alonso-Zarza et al., Reference Alonso-Zarza, Armenteros, Braga, Munoz, Pujalte, Ramos and Aguirre2002; Alonso-Gavilán et al., Reference Alonso-Gavilán, Armenteros, Carballeira, Corrochano, Huerta and Rodríguez2004) covers an area of more than 50,000 km2 (Fig. 1). It is a foreland basin located on the southern flank of the Pyrenean–Cantabrian orogen, at the northern sector of the Iberian microplate (Alonso-Zarza et al., Reference Alonso-Zarza, Armenteros, Braga, Munoz, Pujalte, Ramos and Aguirre2002). The Duero Basin is bordered to the west and south by thick-skin thrusts that uplifted a Paleozoic granitic and metamorphic basement and to the north and east by (partially) inverted rifts (Cantabrian–Pyrenean border and the Iberian Range) (Vegas and Banda, Reference Vegas and Banda1982; Corrochano and Armenteros, Reference Corrochano and Armenteros1989; Santisteban et al., Reference Santisteban, Mediavilla, Martín-Serrano and Dabrio1996b; Antón Lopez, Reference Antón López2003; De Vicente and Vegas, Reference De Vicente and Vegas2009; Antón et al., Reference Antón, Muñoz-Martin and De Vicente2010) (Figs 1 and 2). Like other large basins in Iberia (e.g., Tajo and Ebro Basins), it evolved as a continental sedimentary basin with closed (endorheic) fluvial systems during most of its depositional history, from the late Cretaceous to the late Neogene (Alonso-Zarza et al., Reference Alonso-Zarza, Armenteros, Braga, Munoz, Pujalte, Ramos and Aguirre2002; Vera, Reference Vera2004).

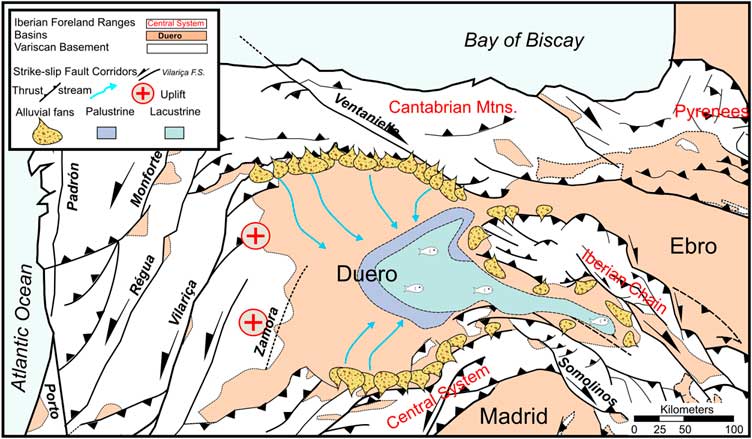
Figure 2. (color online) Tectonic setting and paleogeographic sketch illustrating the last stage of the endorheic evolution of the Duero basin (Vallesian–Turolian). Based on Vera (Reference Vera2004).
Subsequently, internal drainage was opened toward the Atlantic Ocean. The most probable and widely accepted driving mechanism of drainage modification is drainage capture by the Atlantic fluvial network coming from the Portuguese coast (Martin Serrano, Reference Martin Serrano1991). This induced a lowering of the base level by more than 700 m and resulted in a pronounced increase in incision and basin dissection rates that still propagate upstream from the capture area (Antón et al., Reference Antón, Rodés, De Vicente, Pallàs, Garcia-Castellanos, Stuart, Braucher and Bourlès2012). The basin is presently drained by the Duero River, which flows westward across the Cenozoic Duero Basin (CDB), the western fringe of the Cenozoic Basin (WCB), and the Duero lower reach (DLR) areas (Antón et al., Reference Antón, Rodés, De Vicente, Pallàs, Garcia-Castellanos, Stuart, Braucher and Bourlès2012) before reaching the Atlantic Ocean at Porto (Fig. 1).
The basin margins were active during periods of Cenozoic deformation, supplying sediment to the basin and controlling its geometry and structural development. Deposition of endorheic successions took place in alluvial flats with meandering channels and lacustrine environments (Armenteros, Reference Armenteros1991). The sedimentary deposits comprise marginal fluvial environments in the basin fringes and lacustrine environments in the inner basin zones (Corrochano and Armenteros, Reference Corrochano and Armenteros1989) (Fig. 2).
During the Eocene–lower Miocene, paleocurrent data indicate the presence of a northeast-flowing drainage system in the basin western fringe, into which prograding alluvial fans were deposited. The lacustrine systems were better developed in the eastern zone (Almazán Basin), although local lacustrine systems were also identified at the base of the sequence in the western fringe (Corrochano and Armenteros, Reference Corrochano and Armenteros1989). During the middle and upper Miocene, relatively stable conditions set in, and there was a major expansion of lake environments (Armenteros et al., Reference Armenteros, Corrochano, Alonso Gavilan, Carballeira and Rodriguez2002) pointing to a general tectonic decrease in the Cantabrian–Pyrenean orogen. Three main sequences, characterized by alluvial units at the base and lacustrine sequences to the top are defined for that period (Corrochano and Armenteros, Reference Corrochano and Armenteros1989). The first is represented by sedimentation in shallow lakes in the basin center and marginal fluvial systems at the basin fringes that developed during the Serravallian–lower Tortonian. Until the middle Tortonian, the subsequent sequence was characterized by fluviolacustrine deposits that progressively evolved to lacustrine systems (Hernández-Pacheco, Reference Hernández-Pacheco1915). This cycle ends with the deposition of shallow carbonates at the basin center that form an extensive and expansive limestone level known as Lower Páramo (Alonso-Gavilán et al., Reference Alonso-Gavilán, Armenteros, Carballeira, Corrochano, Huerta and Rodríguez2004). During the last sedimentary sequence (upper Tortonian–Messinian) similar conditions occurred, with the formation of the last calcareous level (Upper Páramo limestones) exposed only in the eastern half of the basin. The Upper Páramo sequence has several limestone units that today form plateaus, which become successively younger, higher, and better preserved to the east (Fig. 3). Mammal fossil ages yield a Vallesian age (11.3–8.7 Ma) in the southwest and a Turolian age (8.7–5.3 Ma) near the base of the sequence at the center of the basin (Armenteros et al., Reference Armenteros, Corrochano, Alonso Gavilan, Carballeira and Rodriguez2002). These late Neogene deposits, representing the last stages of basin infill, were used in this paper as markers for the paleotopographic reconstruction (Fig. 4).

Figure 3. (color online) Field imagery illustrating basin landscape and examples of the Páramo surface within the present topography. Photograph locations indicated by dots in Fig. 1A: (A) Hornija area; (B) Páramo surfaces north of Tordesillas; (C) Páramo remand east of Vega de Valdetronco; (D) landscape and relict topography south of Toro.
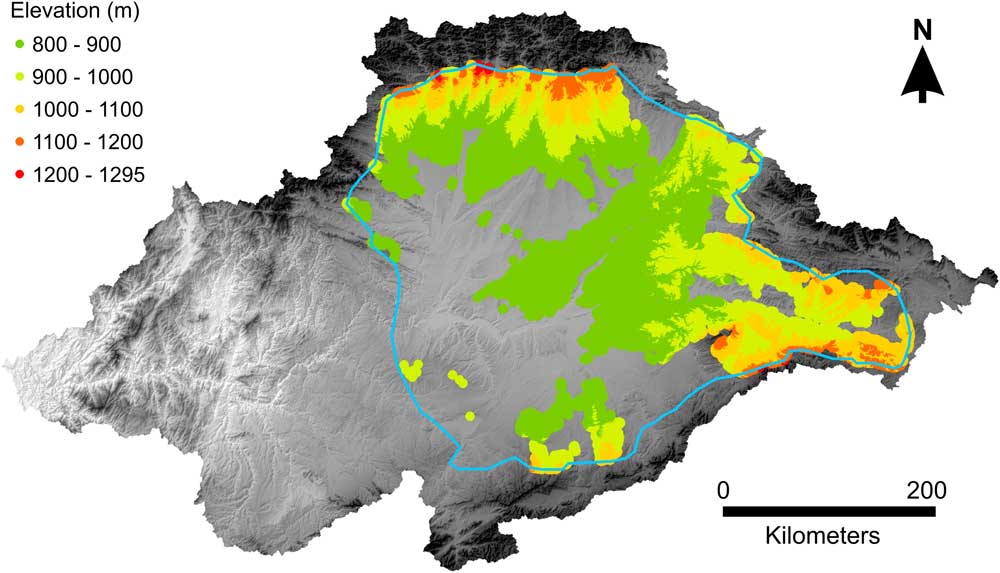
Figure 4. Duero watershed, digital elevation model, and, points (x,y,z) considered for the paleosurface reconstructions. Points, extracted from the present topographic position of the Tortonian deposits, are colored by elevation intervals. Polygon represents the gridding area. (For interpretation of the reference to color in this figure legend, the reader is referred to the web version of this article.)
The top of the late Neogene sedimentary infill of the basin is overlain by relatively thin but extensive alluvial fan platforms (rañas) that are assumed to be Pleistocene in age (Pérez-González and Gallardo, Reference Pérez-González and Gallardo1987; Baena Escudero and Díaz del Olmo, Reference Baena Escudero and Díaz del Olmo1997; Gallardo-Millan and Pérez-González, Reference Gallardo-Millan and Pérez-González2000; Pereira et al., Reference Pereira, Alves, Araújo and Cunha2000; Cunha, Reference Cunha2008). In the Duero Basin, the present-day drainage network is clearly dissecting the “raña surface.” This is interpreted as postdating the terminal filling of the Neogene basin but predating the fluvial downcutting under exorheic conditions (Martin Serrano, Reference Martin Serrano1991). Thus, the onset of fluvial incision in central and western Iberia may be assumed to have occurred during the Pleistocene. The exact timing of the transition from endorheic to exorheic conditions in the Duero Basin is still poorly constrained.
MATERIALS AND METHODS
The paleosurface of the formerly closed basin was reconstructed using geologic mapping, geostatistical tools, GIS, and DEMs. This reconstruction was based on recognition of the paleotopography associated with the last stages of infill of the endorheic Duero Basin. Additionally, hypsometric curves (Strahler, Reference Strahler1952) of main tributaries were calculated to evaluate the catchments’ maturity, through the analysis of the relationship between area and altitude within a catchment.
Topographic and geologic data
Digital elevation data (Fig. 4) were extracted from the Shuttle Radar Topography Mission, version 4 (Jarvis et al., Reference Jarvis, Reuter, Nelson and Guevara2008). Cells in this database have a latitude–longitude grid spacing of 90 m with a vertical accuracy of 6 m (Rodríguez et al., Reference Rodríguez, Morris, Belz, Chapin, Martin, Daffer and Hensley2005). This resolution, used for the DEM construction, is considered suitable for regional-scale topographic analysis. It is sufficiently fine to generate useful landscape reconstructions and sufficiently coarse to keep database sizes manageable. Smaller regions may be modeled using higher-resolution raster elevation data.
Geologic information was extracted from the Spanish Geological Survey’s (IGME) maps at scale 1:50,000 (Pineda et al., Reference Pineda, Huerta, Nozal, Montes and López Olmedo2011) (Fig. 1). The relevant formations for paleosurface reconstruction were the Tortonian sedimentary units (equivalent to the Upper Páramo limestones). These were selected and extracted in a shape file, which was subsequently used to obtain elevation values from the DEM. The cells inside the polygons (“Tortonian cells”) were assigned the elevation value for the center of the cell, and all cells outside the polygons were assigned “NoData” values. These values were collated in a new file containing the x,y,z coordinates, spaced at 90 m, for the remnants of these fragmented depositional surfaces that represent the last stages of the basin infill. However, in addition to these low-relief depositional surfaces, Tortonian deposits also crop out in contemporary hillslopes. To avoid the inclusion of misleading elevation data from the Tortonian deposits exposed in valleys that are not part of the reconstructed paleosurface, a cross-check was performed between the elevation of the mapped Tortonian deposits (z) and the current topographic slope. This indicated that most of the Tortonian outcrops below 800 meters above sea level (m asl) were located on hillslopes and do not correspond to the paleosurface. Accordingly, elevation values below 800 m were removed (Fig. 4). Elevation data were then imported into a surface-mapping system, Surfer® (Golden Software, 809 14th Street, Golden, CO 80401, www.goldensoftware.com), where the predissection surface reconstruction and later calculations were done.
Reconstruction of precapture topography
The reconstruction of the precapture paleotopography was focused on the central part of the Duero Basin (CDB). This area contains the sedimentary sequences developed during the final phase of the closed depositional history of the system (Fig. 1). The exact dimensions of this area (~47,000 km2) were obtained from the available elevation data on landforms and deposits, extracted as previously described (Fig. 4). The x,y,z data were then gridded to a 4500-m-cell-size continuous surface and subsequently resampled to the grid resolution of the 90 m DEM. The selected cell size (4500 m=50*DEM resolution) is big enough to represent medium- and large-wavelength topographic variations and at the same time small enough for the calculation of the fluvial dissection with enough resolution (90 m in this study).
Minimum curvature gridding (Smith and Wessel, Reference Smith and Wessel1990) and trend surface analysis (Draper and Smith, Reference Draper and Smith1981) were the selected methods for the paleosurface (Ps) reconstruction because they are not exact interpolators. This makes them good at reconstructing regional surfaces from remnants of widespread deposits because they can capture coarse-scale patterns in the data instead of being distorted by local anomalies (Davis, Reference Davis1986).
The minimum-curvature gridding method (MC) generates the smoothest possible surface while attempting to match the data as closely as possible. Minimum curvature is analogous to elastic plate flexure and approximates the shape adopted by a thin plate flexed to pass, under the influence of point forces, through the data points (Briggs, Reference Briggs1974; Smith and Wessel, Reference Smith and Wessel1990). The paleosurface obtained by minimum curvature interpolation (minimum-curvature paleosurface [Ps-MC]) is shown in Figure 5A.
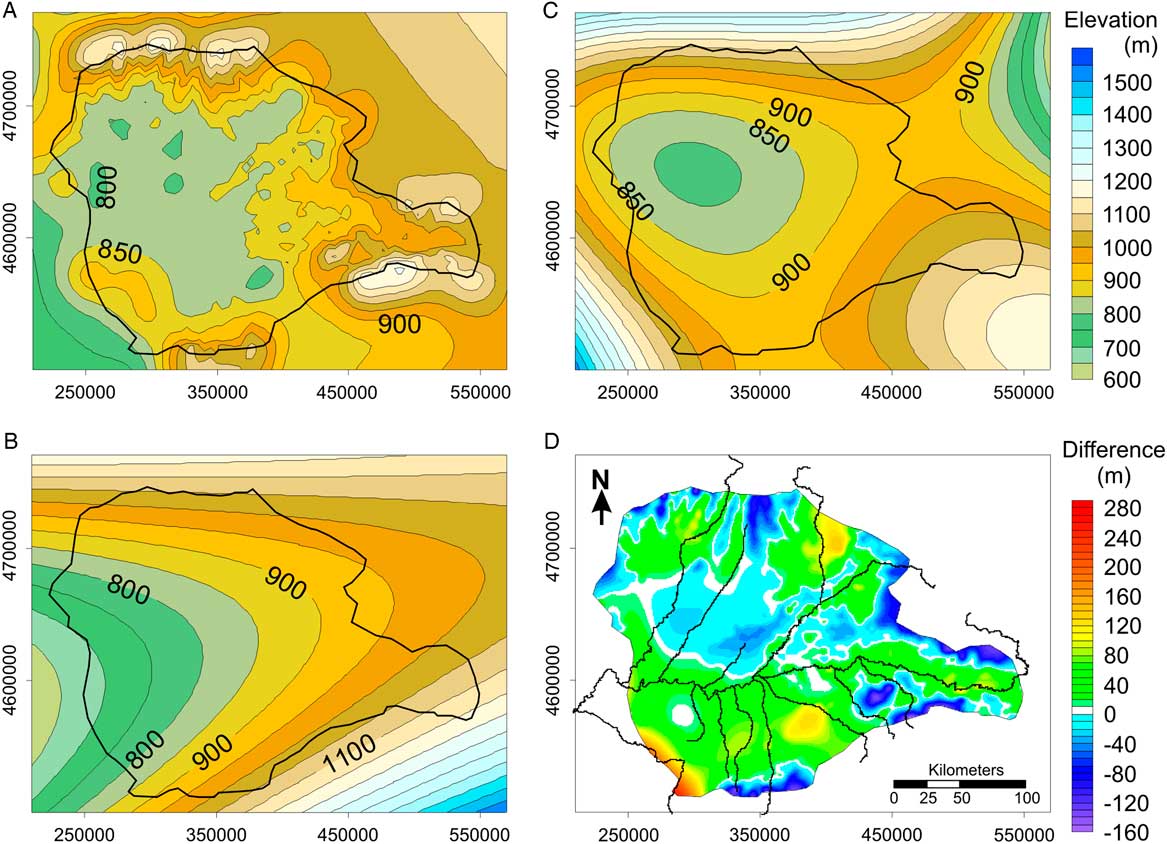
Figure 5. (color online) Paleotopography for the basin’s pre-opening stage. (A) minimum curvature surface (Ps-MC); (B) quadratic surface (Ps-QS); (C) cubic surface (Ps-CS); (D) differences in elevation between Ps-CS and Ps-MC. Coordinates in meters (WGS84, UTM H30N).
Trend surface analysis is a widely used surface-fitting procedure. It is a polynomial interpolation that fits a smooth surface defined by a mathematical function (a polynomial) to the input sample points. As the order of the polynomial is increased, the surface being fitted becomes progressively more complex (Draper and Smith, Reference Draper and Smith1981; Davis, Reference Davis1986). A first-order polynomial (linear) would result in a flat plane, while a second-order polynomial (quadratic) allows one bend, third-order (cubic) two bends, and so on. This study used quadratic (QS) and cubic (CS) trend surfaces. Higher-order polynomials were not used, as they would incorporate more complexity than is appropriate given the available geologic data on the distribution of the endorheic deposits in the Duero Basin. The paleosurfaces (quadratic paleosurface [Ps-QS] and cubic paleosurface [Ps-CS]) obtained are illustrated in Figure 5.
Quantification of eroded volumes and mapping of erosional patterns
Through comparison of the grids representing the former paleosurface (Ps) and present (DEM) topography, the quantification and spatial distribution of erosion was calculated both for the entire area and for individual stream catchments. A set of latitude, longitude, and ΔZ values was obtained by subtracting the modern elevation values (ZDEM) from the interpolated paleosurface (ZPS). Positive values of ΔZ represent erosion depth (surface lowering [sl]), while negative values are obtained in areas where remnant topography occurred above the paleosurface. These results enable quantification of the eroded volume (Ve) for each of the calculated paleosurfaces (Tables 1 and 2) and the construction of ΔZ maps illustrating landscape dissection (sl) throughout the basin (Fig. 6). To compare elevations and surface lowering obtained using the Ps-MC and Ps-CS, cross sections were extracted along the basin (Fig. 7).

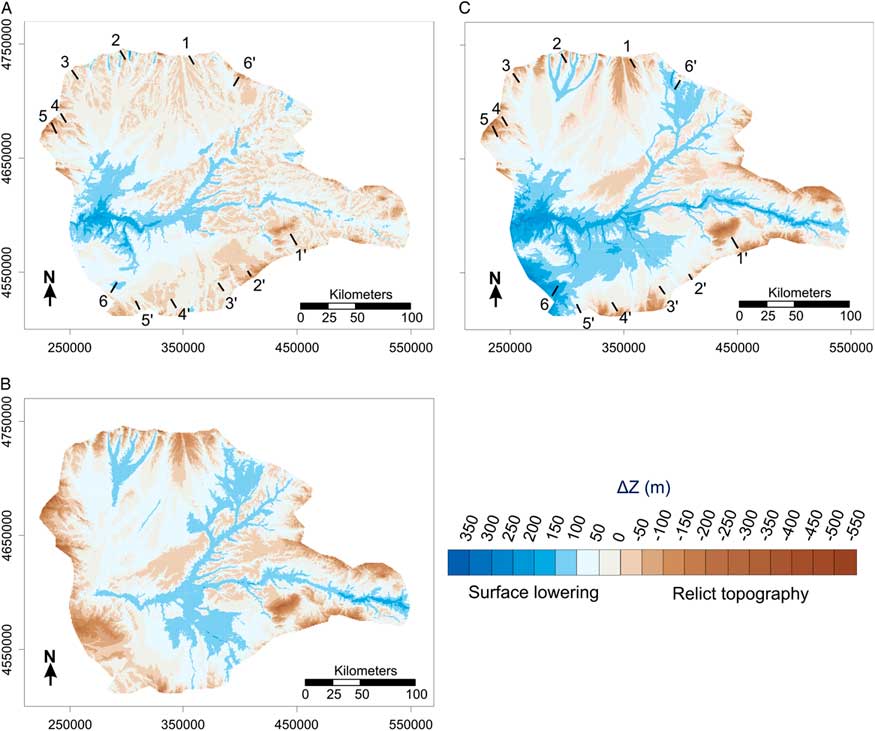
Figure 6. (color online) Landscape dissection maps (ΔZ) and location of sections displayed in Fig. 7. (A) MC; (B) QS; (C) CS. Positive ΔZ indicates landscape dissection (surface lowering [sl]); negative ΔZ indicates relict topography above the reconstructed paleosurfaces. Coordinates are in meters (WGS84, UTM H30N).

Figure 7. Cross sections illustrating the differences between the MC and the QS approaches (present topography, paleosurface elevation, and ΔZ). Brow line represents present topography (DEM); red line (dashed) corresponds to CS approach (Ps-CS); blue (dotted) line represents MC approach (Ps-MC). Blue arrows indicate the Duero River position (solid) and the Pisuerga River (dashed). Numbers indicate surface lowering (in meters) at position of arrow (Duero and Pisuerga channel location) for CS and MC, respectively. See Fig. 6. for cross-section location. (For interpretation of the references to color in this figure legend, the reader is referred to the web version of this article.)
Table 1. Values obtained by the reconstruction of the Duero Basin paleotopography. ΔZ represents the difference in elevation between the paleo-surface and present topography; the positive area is the area where paleo-surface dissection (cut) occurred, and the negative area indicates the area where relict topography is still preserved.Footnote a

a sl, surface lowering; Ve, volume eroded.
Table 2. Results for the first-order Duero tributaries’ watersheds (shown in Fig. 8).Footnote a

a CS, cubic surface reconstruction; Hi, hypsometric integral; MC, minimum curvature reconstruction; sl, surface lowering: Ve, volume eroded.
b Duero data correspond to the watershed area not shared with the catchments of tributaries.
The hypsometric integral (Hi)
The hypsometric integral (Hi) is a dimensionless parameter that represents the distribution of the elevation of the drainage area in a catchment (Strahler, Reference Strahler1952). The value (Hi) and the shape of the hypsometric curve express the volume of the basin that has not yet been eroded and thus aim to quantitatively express the “maturity” of a catchment (Strahler, Reference Strahler1952). A concave hypsometric curve with a low Hi value (<0.4) characterizes a strongly eroded catchment, while a convex hypsometric curve (Hi>0.6) represents a weakly eroded catchment. The Hi was computed for both the entire Duero Basin and its first-order tributaries’ catchments (Table 2).
RESULTS
Precapture topography
Three paleosurfaces representing the predissection topography were obtained using the different gridding approaches (Fig. 5). The Ps-MC shows a slightly irregular shape, locally resembling the present topography, because it is more conditioned by the original data (e.g., sections 1 and 2 in Fig. 7). Higher areas (above 850 m) correspond to the basin fringes and to the Upper Páramo units in the basin interior. However, most of the basin paleosurface elevations are between 800 and 850 m. For the Ps-QS, the geometry obtained is a smooth surface slightly dipping to the west-southwest, with an average topographic position around 800 to 850 m in the basin center, reaching 700 m in the WCB. The Ps-CS presents a basin-like geometry, with the lowest area situated in the northwest. Elevations are mostly above 950 m at the basin fringes and above 800 m in the basin center.
Eroded volumes (Ve) and land-surface lowering
Maps of ΔZ were constructed, illustrating the postcapture basin dissection (Fig. 6). On those, negative ΔZ (topography higher than the paleosurface) generally corresponds with “source” areas, mountain ranges and elevated topography within the basin. Negative ΔZ is also associated with younger alluvial fans (raña) located in the basin fringes, which postdate the terminal filling of the Neogene basin (Martin Serrano, Reference Martin Serrano1991). The calculated eroded volume (Ve) ranges between 1727 km3 for the Ps-MC and 2776 km3 for the Ps-CS (Table 1). The calculation of the ratio Ve/basin area provides a mean sl value ranging between 78 and 52 m for Ps-CS and Ps-MC, respectively (Table 1). To estimate sl, only the area where dissection occurred (positive ΔZ area, see Table 1) was considered.
As expected, maximum amounts of surface lowering are associated with the stream network, illustrating how fluvial incision progresses along the basin. For the Ps-MC and Ps-CS, the highest incision (~230±10 m) occurred in the WCB, decreasing upstream. In the Duero middle reach (profile 3 in Fig. 7) postcapture incision is ~160 m for the Ps-CS and ~140 m for Ps-MC (Figs 6 and 7). In contrast, the highest values for the PS-QS occur farther upstream, in the eastern part of the basin, while little erosion occurs in the WCB (Fig. 6B).
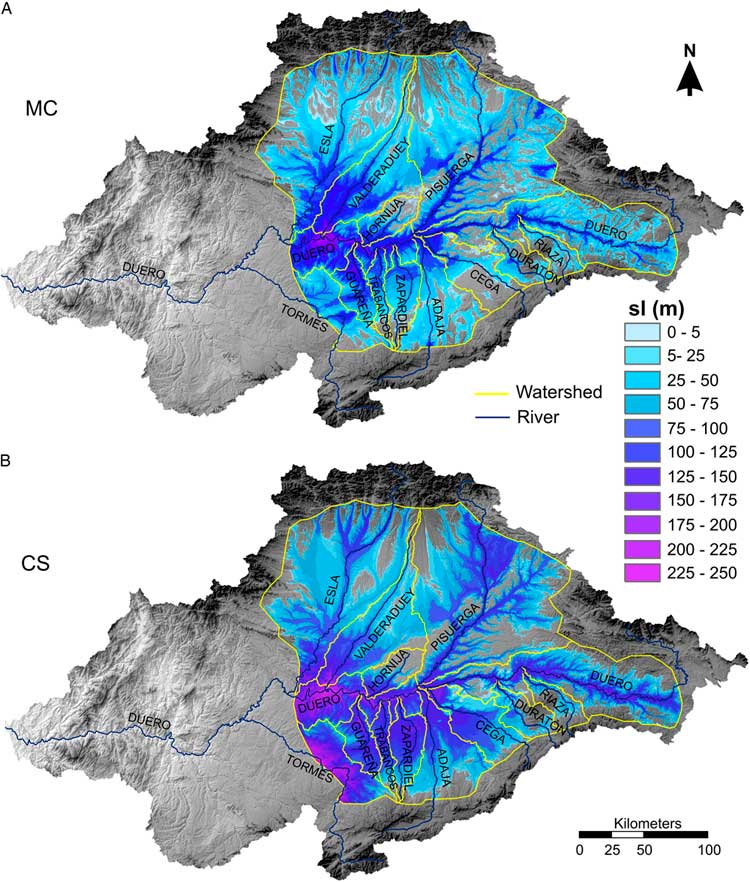
To determine how the establishment of the external drainage occurred in the basin, quantification of areas, eroded volumes, and surface lowering were performed in 12 individual watersheds for Ps-MC and Ps-CS (Fig. 8, Table 2). Ps-QS reconstructions were not used for this, because the dip to the west-southwest is inconsistent with the geometry of an endorheic basin. Ps-MC and Ps-CS provide minimum and maximum erosion values, respectively. Eroded volumes (Ve) vary from 508 km3 in the Pisuerga catchment to 20 km3 in the Riaza catchment for the Ps-CS; while in the Ps-MC approach, Ve values are 329 and 12 km3, respectively. Ve is clearly influenced by the watershed size, but the sl values point to a progressive decrease in landscape dissection moving upstream (Fig. 9). Ps-MC estimates mean sl from 134 m for the Tormes system (in the WCB), to 47 m for the Duratón watershed farther upstream (Fig. 8, Table 2). For the Ps-MC, sl ranges from 69 m in the Valderaduey watershed to 27 m in the Riaza catchment (Fig. 8, Table 2).
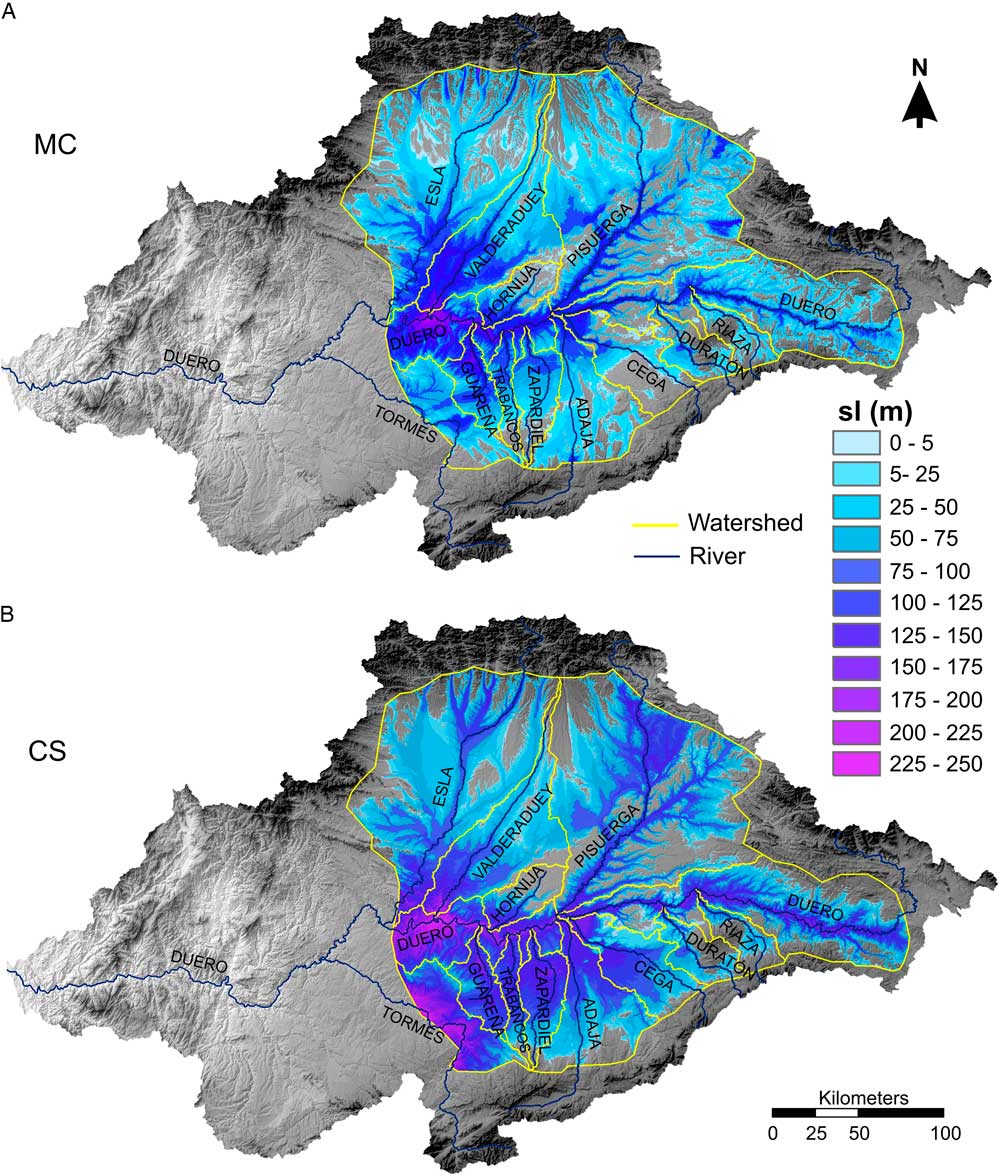
Figure 8. (color online) Maps illustrating the landscape dissection patterns. Surface lowering (sl) obtained for (A) minimum curvature surface (MC) and (B) cubic surface (CS). The catchments analyzed and the Duero River’s main tributaries are shown.

Figure 9. (color online) Relationship between mean surface lowering (sl) and distance upstream of the tributaries’ confluence. (A) Minimum curvature surface (MC) results; (B) cubic surface (CS) results. E, Esla; T, Tormes; V, Valderaduey.
Hypsometric integral
Hypsometric integral calculations provide values between 0.15 and 0.72 for the watersheds studied (Table 2). With the exception of the Guareña and Hornija watersheds, all Hi values are below 0.4, pointing to mature watersheds (strongly eroded catchments). Slightly higher values (0.29 and 0.35) correspond to the Tormes and Duero watersheds, whose mouths or confluences lay in the WCB and in the DLR (Fig. 1). Those confluences are located below 400 m asl and at sea level, respectively. In contrast, in the CDB area, all stream confluences are above 600 m asl, which is above the local base level that represents the Variscan basement in the WCB (Antón et al., 2012, Reference Antón, De Vicente, Muñoz-Martín and Stokes2014).
DISCUSSION
Former internally drained basin surfaces associated with predissection depositional sequences can be used to delineate relative “time lines” from which paleosurfaces can be reconstructed. These estimated paleosurfaces enable the quantification of spatial and temporal patterns of fluvial dissection and landscape change in response to capture-induced base-level drop. Similar methodology may be used in different geologic settings, for example, for hydrological quantifications (García-Rodríguez et al., Reference García-Rodríguez, Antón and Martinez-Santos2014) or fluvial terrace entrenchment (Geach et al., Reference Geach, Stokes, Telfer, Mather, Fyfe and Lewin2014).
In the Cenozoic Duero Basin, the deposition of lacustrine sequences related to the endorheic history of the basin ends with calcareous levels (Páramo limestones). These upper calcareous remnants are mapped as Tortonian (Pineda et al. Reference Navas2011). The deposits attributed to the Tortonian have been used to reconstruct the regional trends of the precapture paleosurface (Fig. 4). For that purpose, the present elevation of the preserved remnants is counted as the top of the basin infill and it is assumed that since the start of the exorheism, erosion of the reference deposits has been negligible. Although the Páramo sequences are generally well preserved, these assumptions almost certainly lead to underestimation of surface lowering and eroded volumes, because some erosion will have occurred. Hence, basin dissection values should be interpreted as minimum values.
Different gridding approaches (MC, QS, and CS) provide distinct paleosurfaces for the study area (Fig. 5). The grids represent pre-incision landscape, covering an area of 46,837 km2 in the CDB. Within those paleosurfaces, Ps-MC and Ps-CS seem to better resemble the topography of an internally drained basin. The Ps-QS is a smooth surface slightly dipping to the west-southwest, inconsistent with the minimum necessary topographic barrier in the western fringe. Accordingly, the landscape dissection map for this reconstruction (Fig. 6B) does not reconstruct a plausible erosional pattern for a capture-induced base-level lowering, because it does not show a pronounced increase in incision propagating upstream from the capture area.
Of the MC and CS methods, the Ps-MC is more conditioned by the original data, resulting in a more irregular shape (Fig. 5). This accounts better for both the remnants of the Páramo units and the present-day valleys (Fig. 7). The Ps-MC conserves the geometry of the valleys that have more than 9 km of wavelength, and the incision values in the narrow valleys are smaller than those obtained with CS gridding. Subtracting Ps-MC elevations from the Ps-CS elevations permits their differences to be better evaluated, both spatially and quantitatively (Fig. 5D). Ps-MC provides generally higher elevations in the basin fringes and in the north-central basin along the Esla, Valderaduey, and Hornija middle reaches (Figs 5D and 8), while it seems to underestimate the former elevation of the Duero southern margin and the upper reaches of the northern tributaries (Figs 5D and 7). At the Duero southern margin, those underestimations may be caused by the lack of relict deposits, which is consistent with a higher landscape dissection due to the Duero’s proximity to the WCB. This is evidenced by field observations, with fluvial terraces dominantly appearing at the southern margin of the Duero River, indicating northward migration of the main channel. Up to 14 terrace levels, including the modern floodplain, are described in this area (Pérez-González, Reference Pérez-González1982; Pineda et al., Reference Pineda, Huerta, Nozal, Montes and López Olmedo2011; Rodríguez-Rodríguez et al., Reference Rodríguez-Rodríguez, Antón, Pallàs, García-Castellanos, Jiménez-Munt and Pastor-Martín2017). On the other hand, Ps-CS slightly underestimates the Páramo units, providing lower values for those areas (Figs 5D and 7). Despite this, CS seems to be a better approach for the Duero basin reconstruction, as paleosurface and fluvial dissection are better represented because underestimation in the southern parts of the basin seen in the Ps-MC is not seen in the Ps-CS.
Landscape dissection maps based on MC and CS reconstructions are consistent with a wave of erosion that propagates upstream from the capture area (WCB) with higher dissection westward and surface lowering preferentially concentrated along main streams (Fig. 6). In the Duero Basin, the average minimum volume of 2251±524 km3 of sediment removed indicates a mean sl of 65±13 m. However, Ve and sl are both significantly higher for Ps-CS (Table 1), where the former paleosurface seems to be better reconstructed in the presently eroded areas (Fig. 7). The analysis of individual watersheds clearly shows the decrease in fluvial dissection moving eastward. Compared with Ps-MC, the Ps-CS reveals higher dissection, with the wave of incision transmitted farther upstream (Fig. 8, Table 2) and higher fluvial incision along the main rivers (Figs 7 and 8). To evaluate the data quality and reliability, control points were checked along the basin. In the central basin, the highest terrace level described for the Duero River along its southern margin is located ~144 m above the present riverbed and several tens of meters (40–50 m) below the Páramo remnants. Although slightly overestimated, the incision values provided for this area by the CS reconstruction (~60 m) fit the field observations better than MC values (~8 m) (section 3-3 in Figs 6 and 7). There is good correlation between the mean surface lowering and the upstream distance in the watersheds studied (Fig. 9, Table 2), despite stream erosive power being influenced by watershed size (discharge) and slope (Hack, Reference Hack1973). Anomalous values are detected in the Esla and Valderaduey catchments, whose middle reaches are apparently poorly represented by the reconstructed paleosurfaces, providing mean sl lower than expected. This is due to the lack of relict landforms in the lower areas of their catchments to provide constraint on the paleosurface (Fig. 4). Nevertheless, incision in their lower reaches is better constrained, as is the erosional pattern (Fig. 8). The Tormes watershed was only partially studied (Fig. 8), and eroded values and mean surface lowering should not be considered as representative.
Neither minimum curvature nor trend surfaces are ideal gridding methods for all applications. In this example, MC and CS paleosurfaces represent reliable approaches, with the Ps-CS better fitting the Duero basin endorheic conditions, as revealed by field observation and data. Erosional patterns obtained are consistent with a wave of erosion that propagated upstream from the capture area (WCB), with incision values in agreement with field observations and previous work (Antón and Muñoz-Martín, Reference Anton and Muñoz-Martín2007; Antón et al., Reference Antón, Rodés, De Vicente, Pallàs, Garcia-Castellanos, Stuart, Braucher and Bourlès2012), supporting the robustness of the methodology. In the Duero Basin, CS seems to provide more effective reconstructions in eroded areas where no reference points are available. However, other geologic settings or areas with different input-data distribution may be better approximated using MC or QS (e.g., García-Rodríguez et al., Reference García-Rodríguez, Antón and Martinez-Santos2014; Geach et al., Reference Geach, Stokes, Telfer, Mather, Fyfe and Lewin2014).
According to Demoulin (Reference Demoulin2011), the hypsometric integral is appropriate to describe the long-term response to a base-level change at the catchment scale. In the CDB (with the exception of Hornija, which seems to be an immature stream in the initial stages of the Páramo dissection; Fig. 8), hypsometric integral values suggest mostly mature watersheds (Table 2). This is in agreement with the present-day topography and the graded long profiles that characterized the CDB. However, the capture-related wave of incision has reached the WCB but has yet to propagate significantly farther upstream, as indicated by the knick zone located in the WCB (Antón et al., 2012, Reference Antón, De Vicente, Muñoz-Martín and Stokes2014). The CDB is still in an immature stage under postcapture base-level conditions. According to this interpretation, the Hi illustrates that the CDB is in a mature stage in relation to the former closed-basin base level, but it is still in an incipient evolutionary stage in relation to the new exorheic conditions, pointing to a recent capture age.
The tectonic control on landscape morphology and long-term denudation is largely documented for settings with high uplift rates (Finnegan et al., Reference Finnegan, Hallet, Montgomery, Zeitler, Stone, Anders and Yuping2008; DiBiase et al., 2010, Reference DiBiase, Heimsath and Whipple2012; Scherler et al., Reference Scherler, Bookhagen and Strecker2014; Rosenkranz et al., Reference Rosenkranz, Schildgen, Wittmann and Spiegel2018). However, relatively little is known about the rates of geomorphic response in areas of low tectonic activity. For this reason, the Duero Basin is a key site to study long-term topographic response to a fluvial capture–induced base-level fall at a continental scale in a tectonically quiescent region. Additionally, the establishment of the onward drainage within watersheds determines the pattern and velocity of landscape change and the contribution of sediment to the oceans (Willenbring and von Blanckenburg, Reference Willenbring and von Blanckenburg2010; Portenga and Bierman, Reference Portenga and Bierman2011). In this context, the interactions between fluvial sediment transport, sediment storage, and the global carbon cycle make the quantification of fluvial dissection an important issue for assessing feedbacks between erosion and climate.
Our data show that the Duero Basin retains much of the precapture topography with limited dissection compared with other Iberian basins (Anton et al., Reference Antón, Munoz Martin, De Vicente and Finnegan2017). In the Ebro Foreland Basin, similar in size to the Duero (~40,000 km2 in sediment area and ~86,000 km2 in catchment area), a range between 25,000 km3 and 45,000 km3 was estimated for the total volume of sediment eroded since the start of the exorheism (Garcia-Castellanos et al., Reference Garcia-Castellanos, Vergés, Gaspar-Escribano and Cloetingh2003; Babault et al., Reference Babault, Loget, Van Den Driessche, Castelltort, Bonnet and Davy2006; Anton et al., Reference Antón, Munoz Martin, De Vicente and Finnegan2017). For the timing of the Ebro Basin opening, some authors point to a post-Messinian age (<5.32 Ma; Babault et al., Reference Babault, Loget, Van Den Driessche, Castelltort, Bonnet and Davy2006). Others suggest a pre-Messinian opening (Evans and Arche, Reference Evans and Arche2002; Garcia-Castellanos et al., Reference Garcia-Castellanos, Vergés, Gaspar-Escribano and Cloetingh2003), pointing to a capture age between 12 and 7.5 Ma (Garcia-Castellanos and Larrasoaña, Reference Garcia-Castellanos and Larrasoaña2015). Those estimations yield denudation rates for the Ebro Basin between 80 and 47 mm/ka (Fig. 10).
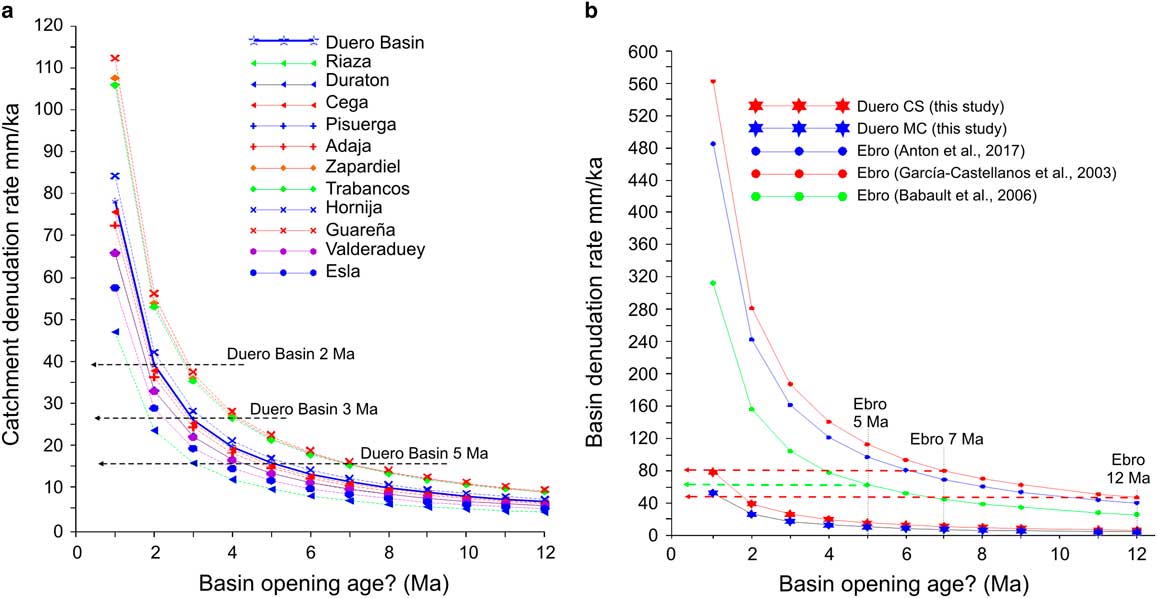
Figure 10. (color online) Estimated denudation rates for potential capture ages ranging from 12 to 1 Ma. (A) Average denudation rates for the Duero Basin and tributary catchments, derived from Ps-CS mean surface lowering; (B) Duero and Ebro Basins averaged denudation rates. Duero Basin rates derived from mean surface lowering calculated in this study (MC and CS approaches). Ebro Basin denudation rates calculated from published estimations on postcapture eroded volumes and surface lowerings (Garcia-Castellanos et al., Reference Garcia-Castellanos, Vergés, Gaspar-Escribano and Cloetingh2003; Babault et al., Reference Babault, Loget, Van Den Driessche, Castelltort, Bonnet and Davy2006; Anton et al., Reference Antón, Munoz Martin, De Vicente and Finnegan2017).
In the Duero Basin, our estimates based on the CS approach yield a minimum erosion of ~2800 km3, one order of magnitude lower than the Ebro. Capture age is not established in the Duero Basin, and chronological data are only available for some terrace levels. These are interpreted as formed by Quaternary fluvial downcutting, most likely since the Early Pleistocene (Silva et al., Reference Silva, Roquero, López-Recio, Huerta and Martínez-Graña2017 and references therein). Because of the uncertainty of capture age, we have calculated denudation rates for the studied catchments for capture ages ranging from 12 to 1 Ma (Fig. 10A). As with sl values, for any given capture age, catchment on the Duero southern margin shows higher average denudation rates, while upstream catchments (e.g., Duraton and Riaza) show the lowest rates. Overall, denudation patterns in the tributary catchments show incision progressing from west to east, and a more efficient denudation in the southern margin irrespective of assumed capture age. In the Duero Basin, a capture occurring 2 Ma ago would yield average denudation rates of ~40 mm/ka compared with 26 mm/ka for 3 Ma and 16 mm/ka for 5 Ma (Fig. 10A).
For similar capture ages (12–7 Ma), denudation rates estimated for the Ebro Basin are ten- and fourfold bigger, respectively, than those obtained for the Duero (7 and 11 mm/ka); to yield similar denudation rates to the Ebro, the Duero Basin would require a much younger capture age (Fig. 10B). However, it is possible to determine from field study whether similar denudation rates are plausible. In contrast with the Duero Basin, the Ebro Basin fluvial morphologies and long profile shapes strongly suggest that the Ebro catchment as a whole displays geomorphic characteristics typical of a mature, moderate to highly erosional area (Soria-Jauregui et al. in this volume), which would be in agreement with an older capture age.
The denudation of landscapes is affected by temporal and spatial variations in tectonics, climate, and vegetation. However, paleoclimatic curves for the Spanish continental Neogene display common climatic conditions for the main Iberian basins (Ebro, Tajo, and Duero; Calvo et al., Reference Calvo, Daams, Morales and Lopez Martinez1993) despite their seemingly different dissection histories. Since almost the middle Miocene, the Iberian Peninsula experienced a warm and dry climate in its southern part and a warm and wetter climate in its northern part (Jiménez-Moreno et al., Reference Jiménez-Moreno, Fauquette and Suc2010). Hence, no significant climatic variations can be used to explain such a large difference in denudation rates. There is also no evidence for major differences in tectonic activity since the late Miocene (e.g., Muñoz et al., Reference Muñoz, Arenas, González, Luzón, Pardo, Pérez and Villena2002; Casas-Sainz and de Vicente, Reference Casas-Sainz and de Vicente2009; De Vicente and Vegas, Reference De Vicente and Vegas2009; De Vicente et al., Reference De Vicente, Cloetingh, Van Wees and Cunha2011; Garcia-Castellanos and Larrasoaña, Reference Garcia-Castellanos and Larrasoaña2015).
To determine a plausible capture age for the Duero Basin, we can compare denudation rates not only with the Ebro Basin but also from 10Be erosion rate data from around the world. Global data sets indicate that, on average, drainage basins erode at 218±35 mm/ka with a median erosion rate of 54 mm/ka (Portenga and Bierman, Reference Portenga and Bierman2011). In the Duero Basin, calculated cosmogenic nuclide-derived paleo-denudation rates from the Esla catchment vary between 33±3 and 56±7 mm/ka (Schaller et al., Reference Schaller, Ehlers, Stor, Torrent, Lobato, Christl and Vockenhuber2016). Other data in the Iberian Peninsula, from catchments in the Betic cordillera, yield denudation rates of 64±54 mm/ka (Bellin et al., Reference Bellin, Vanacker and Kubik2014). In middle European rivers, long-term erosion rates based on terrestrial cosmogenic nuclide (TCN) 10Be are between 20 and 100 mm/ka (Schaller et al., Reference Schaller, von Blanckenburg, Hovius and Kubik2001), while data in the French Massif Central provide denudation rates ranging between 40 and 80 mm/ka (Olivetti et al., Reference Olivetti, Godard and Bellier2016). Comparing these denudation rates with those calculated for the Duero (Fig. 10) therefore allows us to suggest a possible capture age. This comparison largely rules out older capture ages of 3 Ma and older, because the low denudation rates (e.g., 26 mm/ka at 3 Ma) are not comparable with other similar systems or with measured denudation rates within the basin (Schaller et al., Reference Schaller, Ehlers, Stor, Torrent, Lobato, Christl and Vockenhuber2016). Hence, quantitative data clearly suggest a recent capture age for the Duero Basin, probably during the Quaternary.
CONCLUSIONS
We use a case study from the Duero Basin to evaluate multiple gridding methods in the reconstruction of former landforms and erosion quantification and to provide a first quantification for this tectonically quiescent region. The methodology allows the reconstruction of paleosurfaces based on minimum curvature interpolation and trend surface construction (second- and third-order polynomial regressions), using relict geologic deposits and landscapes dating from the precapture time period. The third-order polynomial approximation (CS) was found to yield the most reliable results for the Duero Basin. These results indicate that in the Duero Basin, ~2800 km3 of sediments have been eroded since the opening of the internally drained basin, leading to a mean surface lowering of ~78 m. Erosion estimates and landscape dissection patterns are plausible, as they are consistent with the progressive establishment of an outward drainage system in the Cenozoic Duero Basin. Surface lowering results enable the calculation of denudation rates. These have been estimated for multiple different capture ages. Comparison with cosmogenic-derived denudation rates in other basins indicates a very recent capture age (<3 Ma) for the Duero Basin. The overall applicability of the methodology is strengthened by the close correlation of volume data and surface lowering with field observations and previous studies, and the procedure is useful in terms of gaining a quantitative understanding of erosional responses to the onset of external drainage on a continental scale.
ACKNOWLEDGMENTS
This study was supported by Comunidad Autonoma de Madrid through the project CARESOIL and by Spanish Ministry of Economy and Competitiveness (MEC) through the project MITE (CGL2014-59516). GIS technical support was funded by MEC grant PEJ-2014-A-93258. We appreciate the thorough and constructive reviews by Becky Briant and two anonymous reviewers.