


INTRODUCTION
The hyperarid core of the Atacama Desert in northern Chile was populated ~13,000 years ago, partially coinciding with the timing of the earliest widespread cultures elsewhere in the Americas (Goebel et al., Reference Goebel, Waters and O'Rourke2008; Grosjean et al., Reference Grosjean, Núñez and Cartajena2005; Latorre et al., Reference Latorre, Santoro, Ugalde, Gayo, Osorio, Salas-Egaña, De Pol-Holz, Joly and Rech2013; Smallwood and Jennings, Reference Smallwood and Jennings2015; Santoro et al., Reference Santoro, Gayo, Capriles, de Porras, Maldonado, Standen and Latorre2017). The timing and paleoenvironments of this early human occupation at the end of the Pleistocene have been well established by previous studies (Núñez et al., Reference Núñez, Grosjean and Cartajena2002; Grosjean et al., Reference Grosjean, Núñez and Cartajena2005; Latorre et al., Reference Latorre, Santoro, Ugalde, Gayo, Osorio, Salas-Egaña, De Pol-Holz, Joly and Rech2013; Joly et al., Reference Joly, Santoro, Gayo, Ugalde, March, Carmona, Marguerie and Latorre2017; Santoro et al., Reference Santoro, Gayo, Capriles, de Porras, Maldonado, Standen and Latorre2017; Santoro et al., Reference Santoro, Gayo, Capriles, Rivadeneira, Herrera, Mandakovic and Rallo2019). Paleoindian sites in the region remain on or close to the surface of old, abandoned alluvial fans and terraces, often embedded in what seem to be desert pavements (Springer, Reference Springer1958; McFadden et al., Reference McFadden, Wells and Jercinovich1987; Wells et al., Reference Wells, McFadden, Poths and Olinger1995; Wood et al., Reference Wood, Graham and Wells2005; Adelsberger and Smith, Reference Adelsberger and Smith2009; Dixon, Reference Dixon, Abrahams and Parsons2009; Dietze et al., Reference Dietze, Dietze, Lomax, Fuchs, Kleber and Wells2016) and contain occupational palimpsests spanning up to 1000 years. This results in a poor understanding of the activities, social life, and potential cultural differences of these groups, in spite of the excellent preservation of organic materials (Gayo et al., Reference Gayo, Latorre, Jordan, Nester, Estay, Ojeda and Santoro2012a; Latorre et al., Reference Latorre, Santoro, Ugalde, Gayo, Osorio, Salas-Egaña, De Pol-Holz, Joly and Rech2013), which is also unusual in sites of this antiquity.
For this project we studied two of these archaeological sites, Quebrada Maní 12 (QM12) and Quebrada Maní 35 (QM35) in the hyperarid core of the Atacama Desert (Figs. 1 and 2). Additionally, we dug geological test pits (Test Pit-T1, Test Pit-T2, and Test Pit-T3) on undisturbed alluvial terraces of the same ages as the sites in order to understand the development and structure of the desert pavements.
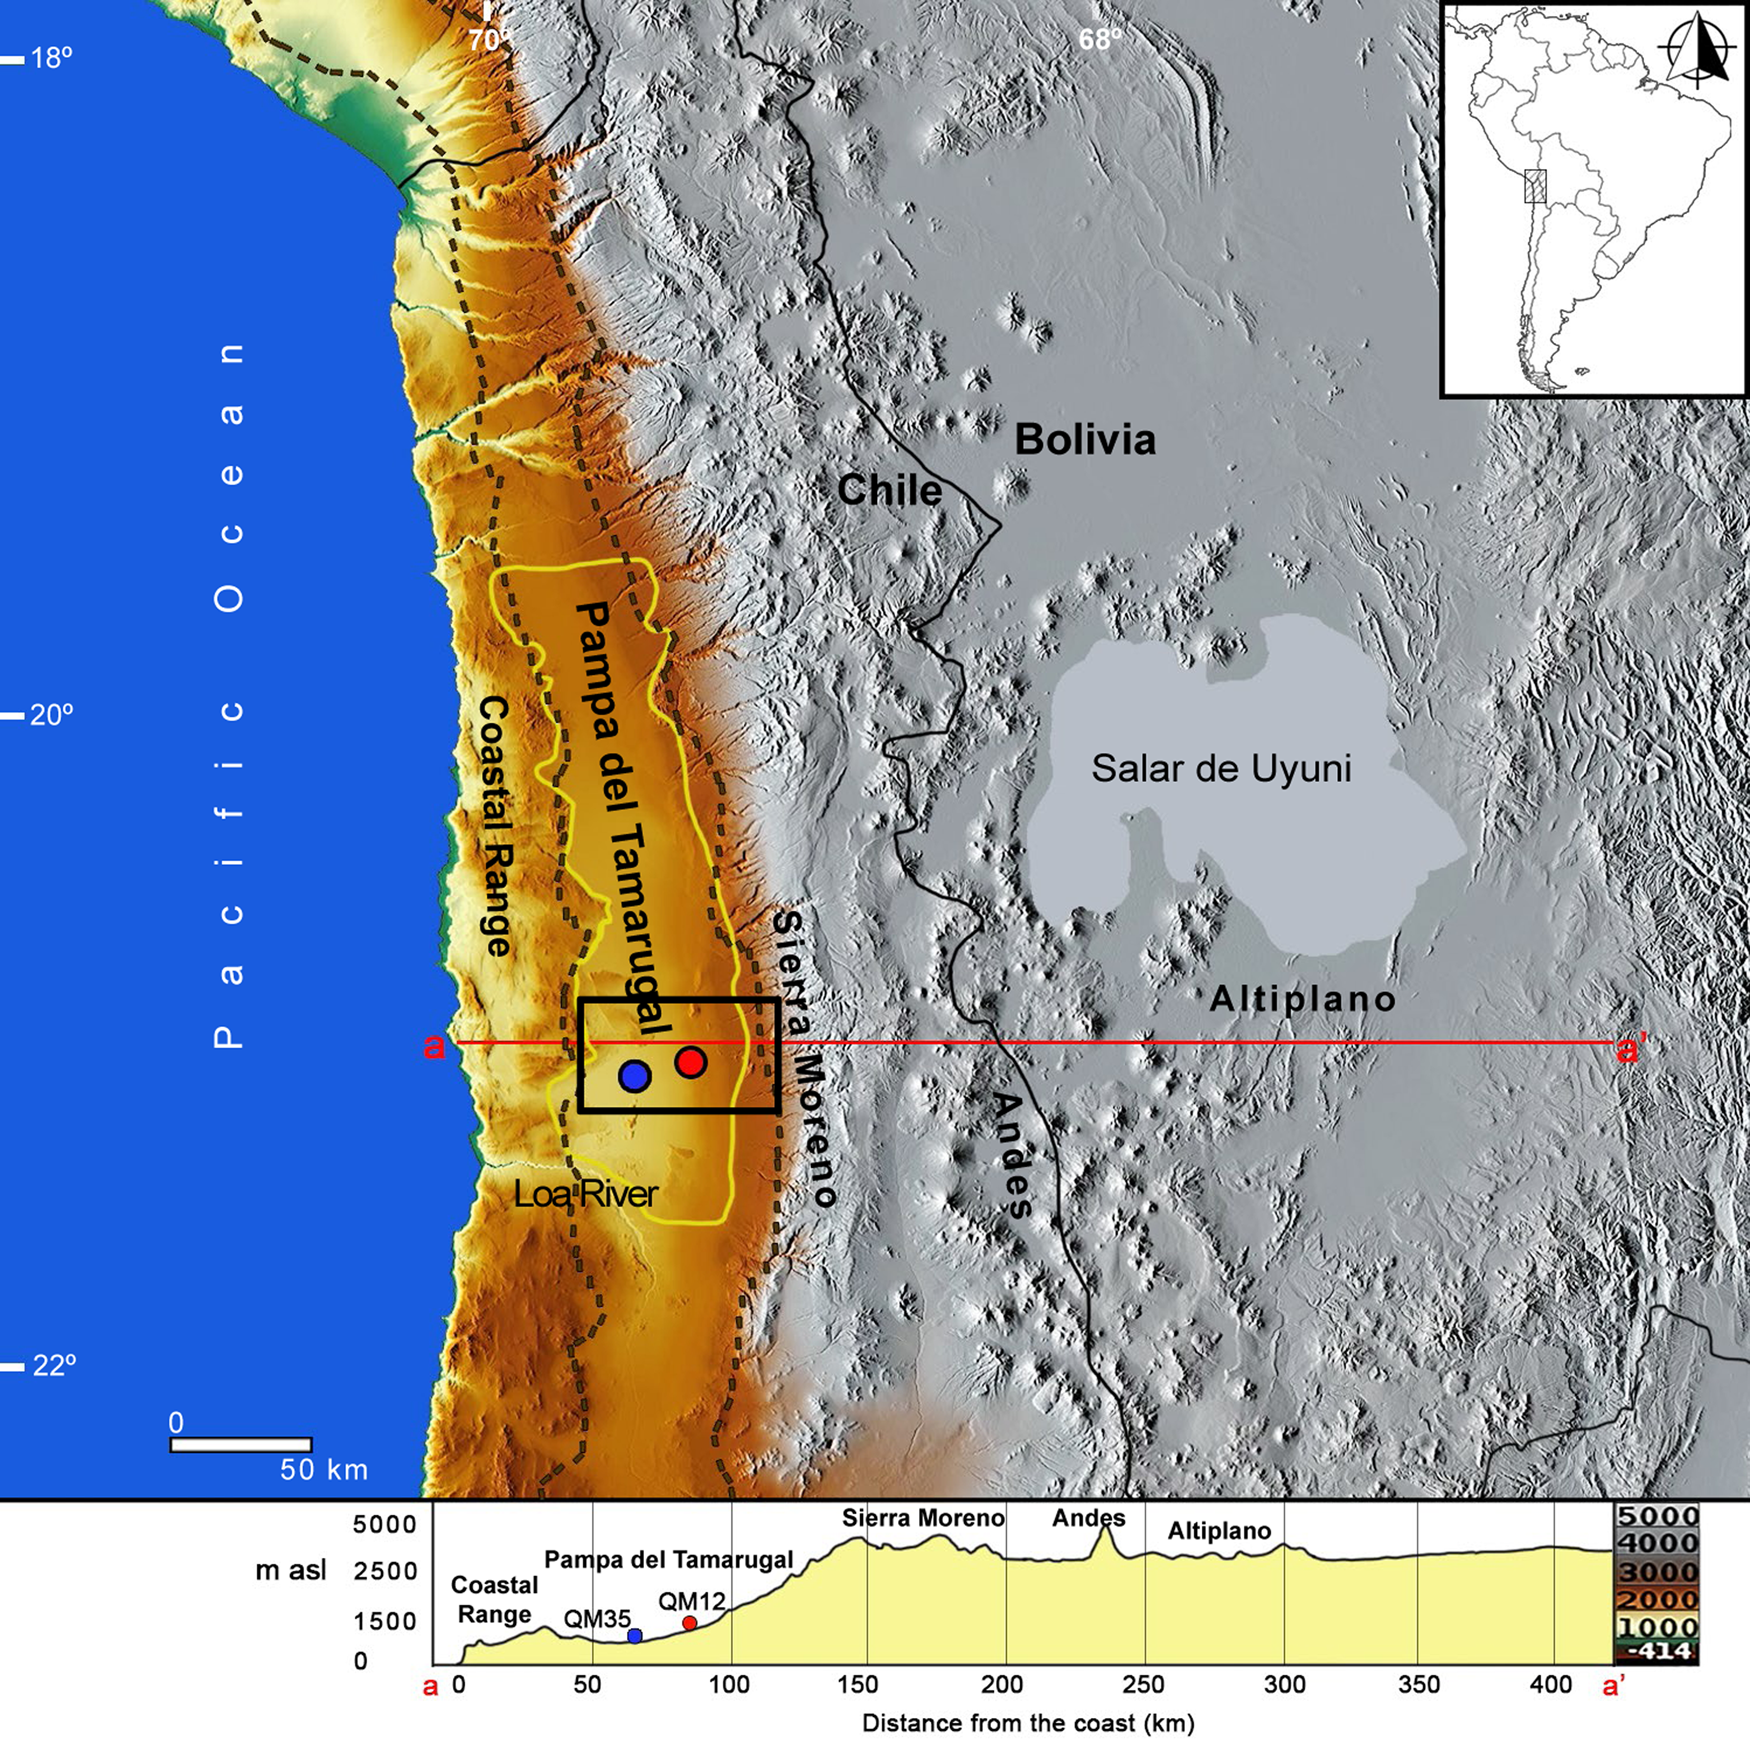
Figure 1. Map of the Atacama Desert with elevation profile, highlighting the Pampa del Tamarugal, and the two study sites: Quebrada Maní 12 (red dot) and Quebrada Maní 35 (blue dot) (modified from Herrera, Reference Herrera2018). The image for the elevation model was downloaded from https://maps-for-free.com. This webpage uses the SRTM dataset. The map projection is Mercator. (For interpretation of the references to color in this figure legend, the reader is referred to the web version of this article.)
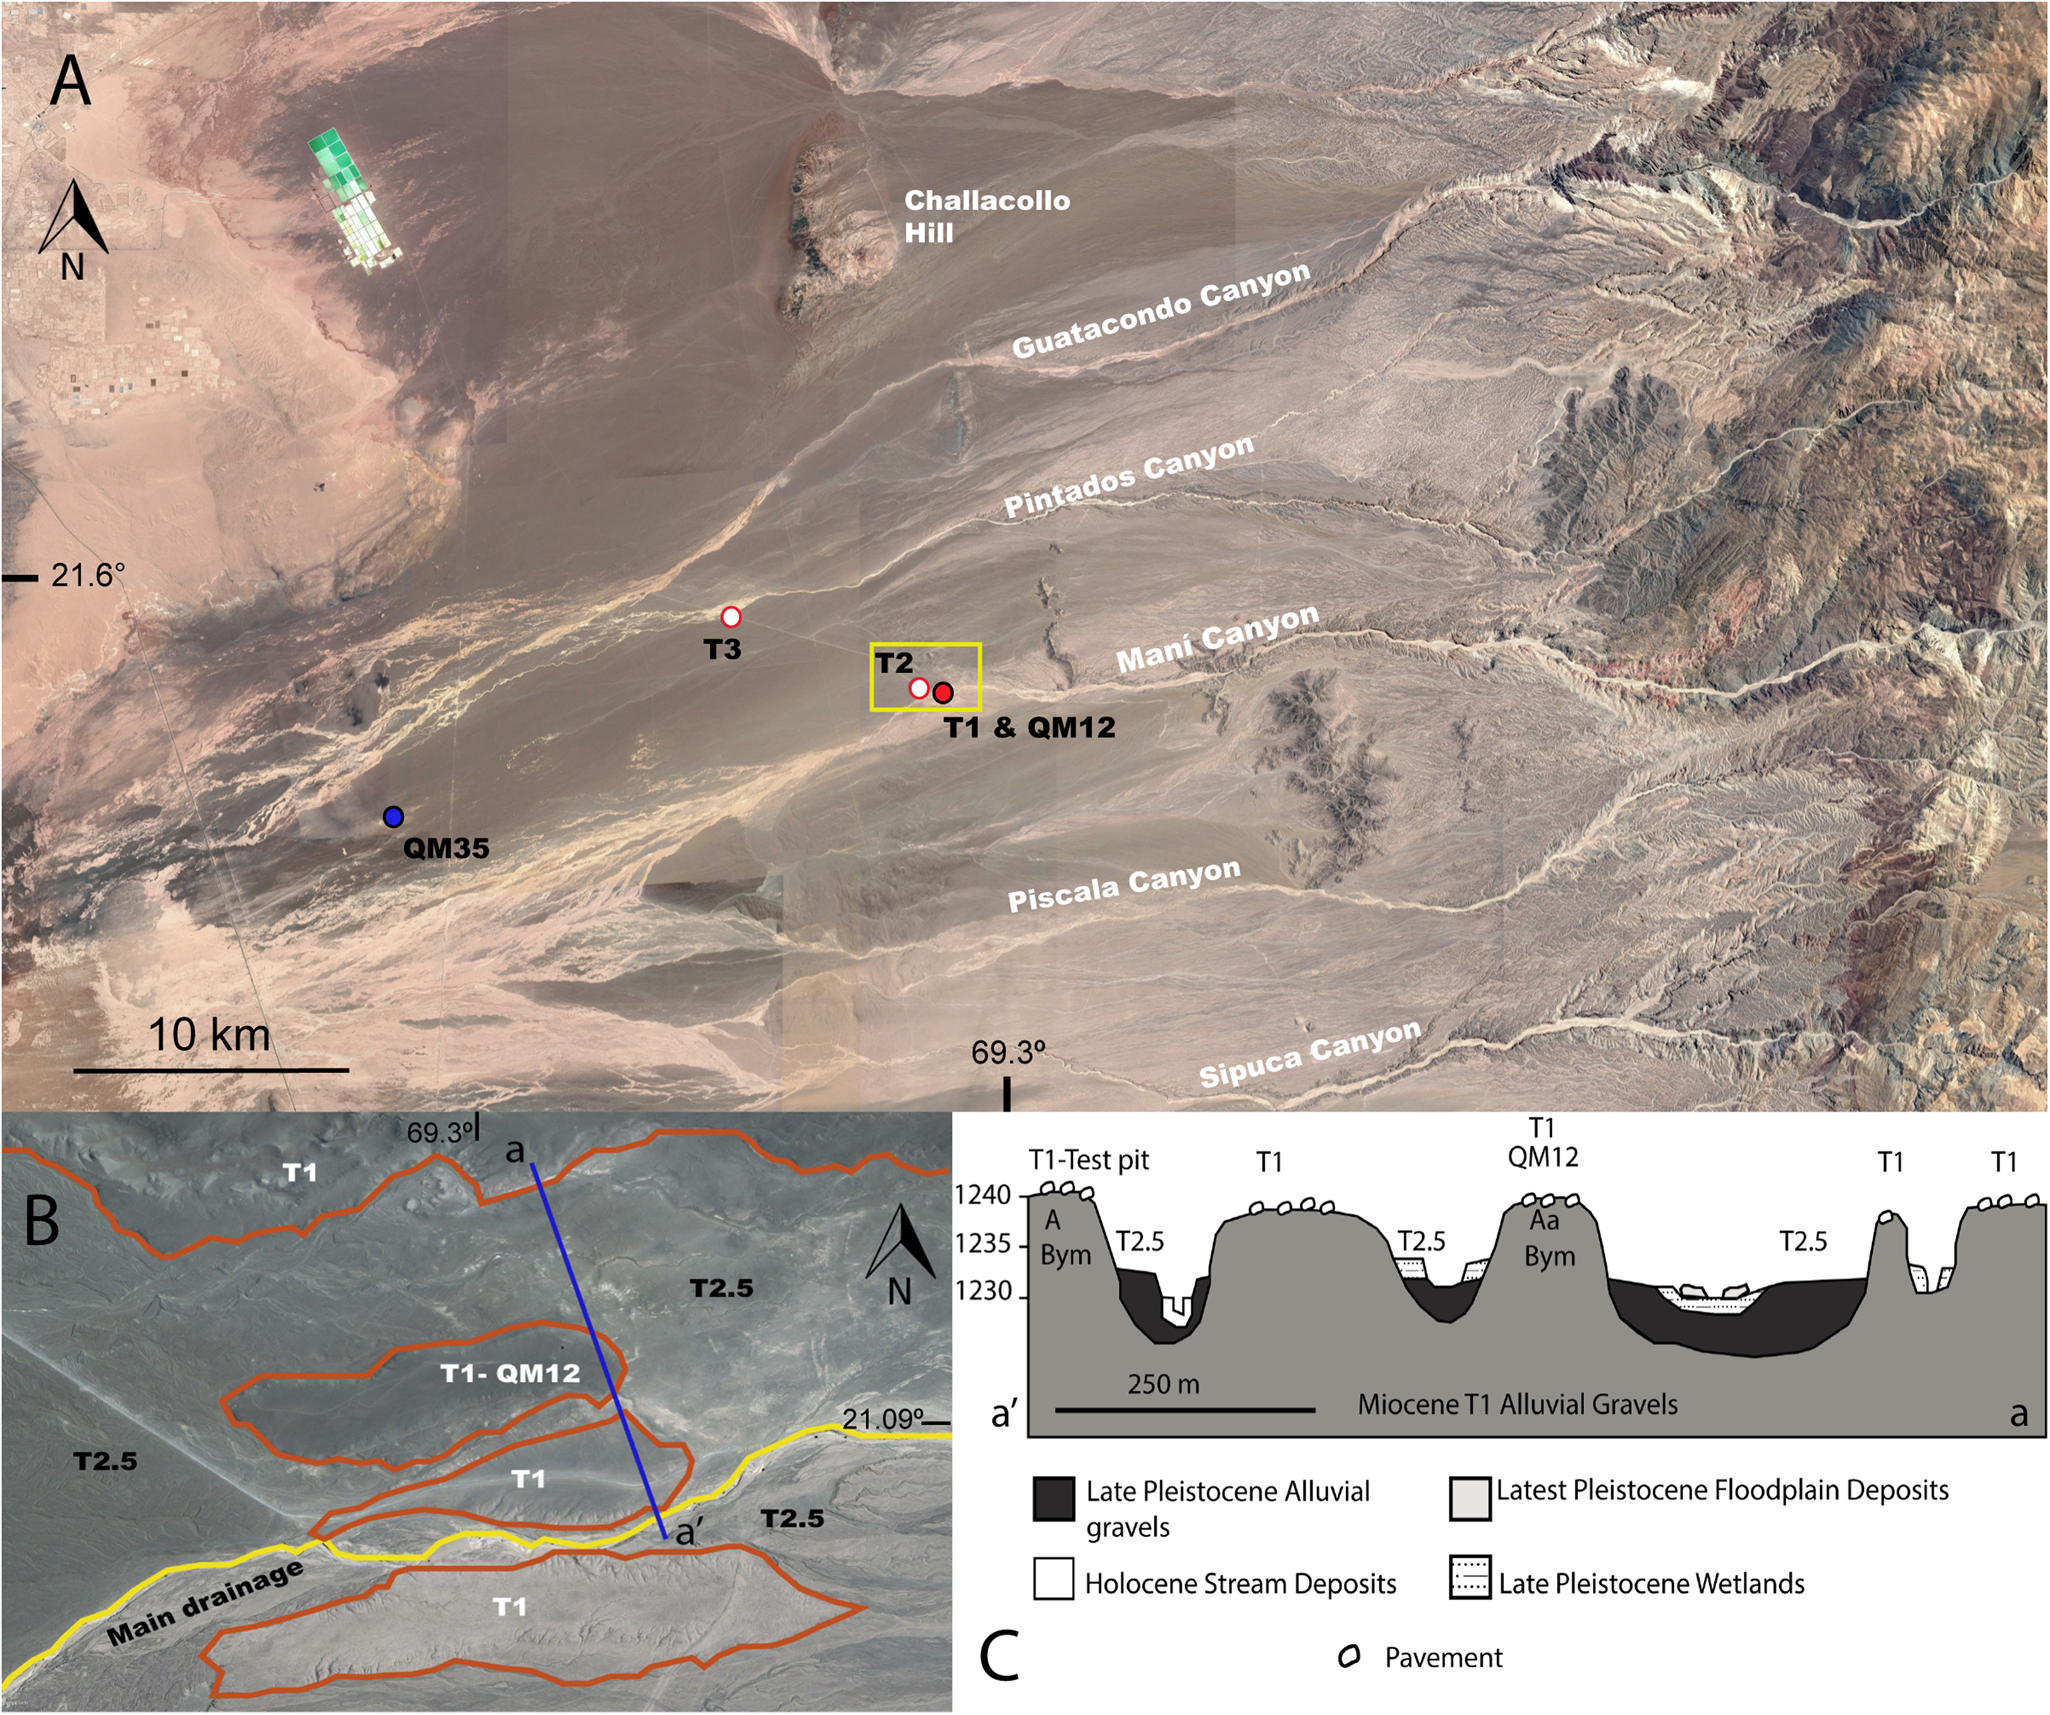
Figure 2. (A) The study area, showing the main canyons, the two archaeological sites studied (QM12 and T1 red dot; QM35 blue dot), and the other two test pits on geological locations (red and white dots). (B) Detail of the yellow square of 2A; plan view of the terrace system (modified from Latorre et al., Reference Latorre, Santoro, Ugalde, Gayo, Osorio, Salas-Egaña, De Pol-Holz, Joly and Rech2013). T1 remnants are enclosed in orange lines. T2 is the rest of the surface, except for the yellow line, which indicates the main Quebrada Maní drainage. (C) a–a’ (1 km) from panel B shows a geological cross-section of the same terrace system (modified from Latorre et al., Reference Latorre, Santoro, Ugalde, Gayo, Osorio, Salas-Egaña, De Pol-Holz, Joly and Rech2013). (For interpretation of the references to color in this figure legend, the reader is referred to the web version of this article.)
Desert pavements are virtually unstudied in the Atacama, in contrast to pavements in other deserts such as the Mojave, the Negev, and the Sahara (McFadden et al., Reference McFadden, Wells and Jercinovich1987; Wells et al., Reference Wells, McFadden, Poths and Olinger1995; Adelsberger and Smith, Reference Adelsberger and Smith2009; Matmon et al., Reference Matmon, Simhai, Amit, Haviv, Porat, McDonald, Benedetti and Finkel2009; Dietze et al., Reference Dietze, Dietze, Lomax, Fuchs, Kleber and Wells2016). The few previous studies include dating by cosmogenic nuclides (Evenstar et al., Reference Evenstar, Hartley, Stuart, Mather, Rice and Chong2009; Placzek et al., Reference Placzek, Granger, Matmon, Quade and Ryb2014; Wang et al., Reference Wang, Michalski, Seo, Granger, Lifton and Caffee2015; Evenstar et al., Reference Evenstar, Mather, Hartley, Stuart, Sparks and Cooper2017; Ritter et al., Reference Ritter, Stuart, Binnie, Gerdes, Wennrich and Dunai2018); an explanation for the absence of pavements in the Coastal Cordillera (de Haas et al., Reference de Haas, Ventra, Carbonneau and Kleinhans2014); a study of anomalous pavements called zebra stripes on the slopes of the Central Depression (Owen et al., Reference Owen, Dietrich, Nishiizumi, Chong and Amundson2013); and the formation of pavements in the high Atacama (Dietze and Kleber, Reference Dietze and Kleber2012) at the southern limit of the desert (26.5–27 °S).
Here we present our findings on the nature and development of pavements of different ages, both disturbed and undisturbed by Paleoindians, in the Atacama. Our comparative analysis has the goal of understanding how these early archaeological sites were formed (Fig. 2), the process of recovery of the pavements, and how archaeological materials are integrated into these recovered pavements. Our ultimate archaeological goal is to contribute to the better understanding of the archaeological occupations that are mixed in these deposits. In terms of geology, our goal is to show how desert pavements form and recover in the most hyperarid desert in the world, in comparison to other, generally moister deserts.
Desert pavements
Desert pavements are highly stable geological features typical of arid environments (Evenari et al., Reference Evenari, Noy-Meir and Goodall1985; Quade, Reference Quade2001; Wood et al., Reference Wood, Graham and Wells2005). In the arid lands of North America, for example, they cover approximately 50% of the surface (Wood et al., Reference Wood, Graham and Wells2002). Pavements are usually a one- to two-clast-thick layer of angular to sub-rounded clasts atop low-relief surfaces, underlain by finer sedimentary units (McFadden et al., Reference McFadden, Wells and Jercinovich1987). In spite of being so thin, pavements control surface stability and water infiltration, and thus can record chemical and physical processes on desert surfaces (Cook et al., Reference Cook, Warren and Goudie1993 found in Wells et al., Reference Wells, McFadden, Poths and Olinger1995).
Early models of desert pavement formation proposed that pavements develop through: (1) deflation of clasts lags (e.g. Summerfield, Reference Summerfield1991 found in Adelsberger and Smith, Reference Adelsberger and Smith2009); (2) surface runoff and lateral transport by creep, resulting in the sorting of fine clasts (Thomas, Reference Thomas1989 found in Wells et al., Reference Wells, McFadden, Poths and Olinger1995); or (3) upward migration of coarse gravels due to shrinking and swelling (Cooke, Reference Cooke1970). In all of these cases, clasts arrive at the surface at times that are not necessarily the same as the time of formation of the landform. Recent models propose that clasts are maintained at the surface, and pavements form through the progressive cracking of these clasts. The fracturing process likely begins with the action of temperature changes (Eppes et al., Reference Eppes, McFadden, Wegmann and Scuderi2010), followed by other processes such as salt expansion of these initial cracks (Amit et al., Reference Amit, Gerson and Yaalon1993; Wood et al., Reference Wood, Graham and Wells2002, Reference Wood, Graham and Wells2005). These and other processes can eventually produce continuous pavements of interlocking clasts. Pavements trap windblown sediments, which are then washed downwards with episodic rains (McFadden et al., Reference McFadden, Wells and Jercinovich1987; Wells et al., Reference Wells, McFadden, Poths and Olinger1995; Adelsberger et al., Reference Adelsberger, Smith, McPherron, Dibble, Olszewski, Schurmans and Chiotti2013; Dietze et al., Reference Dietze, Dietze, Lomax, Fuchs, Kleber and Wells2016). Thus, pavements remain at the surface while an accretionary mantle of dust grows vertically to form a soil beneath the pavement (Wells et al., Reference Wells, McFadden, Poths and Olinger1995; Anderson et al., Reference Anderson, Wells and Graham2002). This allows researchers to cosmogenically date pavement clasts to establish an age for the formation of the land surfaces, and thus infer periods of geomorphic stability (González et al., Reference González, Dunai, Carrizo and Allmendinger2006; Evenstar et al., Reference Evenstar, Hartley, Stuart, Mather, Rice and Chong2009; Matmon et al., Reference Matmon, Simhai, Amit, Haviv, Porat, McDonald, Benedetti and Finkel2009; Placzek et al., Reference Placzek, Granger, Matmon, Quade and Ryb2014; Wang et al., Reference Wang, Michalski, Seo, Granger, Lifton and Caffee2015).
However, desert pavements with interlocking clasts do not necessarily remain stable over time. They can be disrupted or buried by changes in plant cover (Quade, Reference Quade2001), soil creep (McFadden et al., Reference McFadden, McDonald, Wells, Anderson, Quade and Forman1998), and hydraulic processes that preferentially orient the long-axes of the clasts along flow direction (Dietze and Kleber, Reference Dietze and Kleber2012). In these instances, the ages of the surficial pavements will be younger than the land features that they rest upon (Dietze et al., Reference Dietze, Groth and Kleber2013).
Distinctive soil features found beneath many desert pavement surfaces include a vesicular A horizon (Av) of <1 cm up to 20 cm, underlain by a relatively clast-free B horizon (Cooke, Reference Cooke1970; McFadden et al., Reference McFadden, Wells and Jercinovich1987; Wells et al., Reference Wells, McFadden, Poths and Olinger1995; McFadden et al., Reference McFadden, McDonald, Wells, Anderson, Quade and Forman1998; Adelsberger and Smith, Reference Adelsberger and Smith2009; Dixon, Reference Dixon, Abrahams and Parsons2009). The development of the vesicular layer depends upon the accumulation of eolian silts and clays, which traps air bubbles after water infiltration and seals the surface (Springer, Reference Springer1958; McFadden et al., Reference McFadden, Wells and Jercinovich1987; Dietze et al., Reference Dietze, Bartel, Lindner and Kleber2012). Vesicles (pores of millimeter scale; Dietze et al., Reference Dietze, Dietze, Lomax, Fuchs, Kleber and Wells2016) develop due to soil-air expansion or increased gas pressure in the soil, which appear as a vesicular structure only after repeated wetting and drying cycles (Dietze et al., Reference Dietze, Bartel, Lindner and Kleber2012). Shrinking and swelling of the vesicular layer is also essential to maintain the clasts at the surface (McFadden et al., Reference McFadden, McDonald, Wells, Anderson, Quade and Forman1998; Anderson et al., Reference Anderson, Wells and Graham2002). The distinct, fine platy structure in these A horizons containing flattened vesicles form by the accretion of new sediments and by shrink-and-swell events (McFadden et al., Reference McFadden, McDonald, Wells, Anderson, Quade and Forman1998). The interior of peds that compose this platy structure tend to be enriched in clay and CaCO3 (Anderson et al., Reference Anderson, Wells and Graham2002).
Despite the potential open-system behavior, there have been several attempts to date vesicular horizons using 14C of organic matter (Anderson et al., Reference Anderson, Wells and Graham2002) and optically stimulated luminiscence (OSL) on quartz grains (Matmon et al., Reference Matmon, Simhai, Amit, Haviv, Porat, McDonald, Benedetti and Finkel2009; Fuchs et al., Reference Fuchs, Dietze, Al-Qudah and Lomax2015; Dietze et al., Reference Dietze, Dietze, Lomax, Fuchs, Kleber and Wells2016). These studies show that the OSL ages of the fine-grain fraction of Av horizons are older and show lower dispersion than the coarse-grain fraction. The coarse-grain fraction apparently moves more through the profile, infiltrating through cracks and mixing with older grains, both deposited by wind and the result of weathering of older rocks in the deposits. However, the older ages of the fine fraction can also be explained in some cases by a trend towards higher De values associated with larger aliquot sizes (Fuchs et al., Reference Fuchs, Dietze, Al-Qudah and Lomax2015; Fuchs and Lomax, Reference Fuchs and Lomax2019). Research suggests that accumulation of dust is linked to periods of climatic instability, when there is more dust available due to devegetation and drying of lake basins (Chadwick and Davis, Reference Chadwick and Davis1990; Reheis et al., Reference Reheis, Goodmacher, Harden, Rockwell, Shroba, Sowers and Taylor1995) and that the vesicles in the A horizons and the pavement itself tend to form during periods of increased aridity (Dietze et al., Reference Dietze, Dietze, Lomax, Fuchs, Kleber and Wells2016). However, research also shows that accumulation of dust to form new pavements can be linked to periods of increased moisture when grasses grow over formerly barren areas and are able to trap dust (Dietze et al., Reference Dietze, Dietze, Lomax, Fuchs, Kleber and Wells2016).
Desert pavements need stability to form and are easily disturbed by anthropic and natural agents (Ward, Reference Ward1961; Quade, Reference Quade2001; Adelsberger and Smith, Reference Adelsberger and Smith2009; Dietze et al., Reference Dietze, Bartel, Lindner and Kleber2012; Dietze et al., Reference Dietze, Dietze, Lomax, Fuchs, Kleber and Wells2016). The pavements appear to form quickly, on times scales of 102 to 105 years (Amit et al., Reference Amit, Gerson and Yaalon1993; Matmon et al. Reference Matmon, Simhai, Amit, Haviv, Porat, McDonald, Benedetti and Finkel2009 and references therein; Dietze and Klebler, Reference Dietze and Kleber2012) and regenerate quickly after disturbance (Pelletier et al., Reference Pelletier, Cline and Delong2007; Prose and Wilshire, Reference Prose and Wilshire2000 found in Adelsberger et al., Reference Adelsberger, Smith, McPherron, Dibble, Olszewski, Schurmans and Chiotti2013).
Regional setting and climate
The Atacama Desert is >1000 km in length and extends from ~16°S in southern Peru to ~27°S in northern Chile. It is bounded by the Pacific Ocean on the west and reaches 4000 m asl along the Andean Cordillera. The hyperarid core (<2,300 m asl) is among the driest places on Earth, receiving <1 mm of rain per year (Houston, Reference Houston2006) (Fig. 1). The onset and causes of hyperaridity are highly debated. Some authors argue for an early onset >10 Ma, related to the growth of the Andes (Rech et al., Reference Rech, Currie, Michalski and Cowan2006; Jordan et al., Reference Jordan, Kirk-Lawlor, Blanco, Rech and Cosentino2014). Others suggest an Oligocene start, which coincides with a global cooling, and propose that hyperaridity could be the reason for the uplift of the Andes (Lamb and Davis, Reference Lamb and Davis2003; Dunai et al., Reference Dunai, González López and Juez-Larré2005). Hartley and Chong (Reference Hartley and Chong2002) and Amundson et al. (Reference Amundson, Dietrich, Bellugi, Ewing, Nishiizumi, Chong and Owen2012) suggest a Pliocene onset of hyperaridity caused by changes in Pacific sea surface temperatures.
Wetter intervals on the order of thousands of years punctuated the mean hyperarid conditions of the Atacama during the late Quaternary (Rech et al., Reference Rech, Quade and Betancourt2002; Latorre et al., Reference Latorre, Betancourt and Arroyo2006; Nester et al., Reference Nester, Gayo, Latorre, Jordan and Blanco2007; Quade et al., Reference Quade, Rech, Betancourt, Latorre, Quade, Rylander and Fisher2008; Gayo et al., Reference Gayo, Latorre, Jordan, Nester, Estay, Ojeda and Santoro2012a; Pfeiffer et al., Reference Pfeiffer, Latorre, Santoro, Gayo, Rojas, Carrevedo and McRostie2018). Two such major pluvial stages (termed Central Andean Pluvial Events or CAPEs) have been identified in the highlands and the hyperarid core of the Atacama Desert: CAPE I, between ~18 and 14.5 ka, and CAPE II, between ~13 and 9.5 ka (Latorre et al., Reference Latorre, Betancourt and Arroyo2006; Placzek et al., Reference Placzek, Quade and Patchett2006; Quade et al., Reference Quade, Rech, Betancourt, Latorre, Quade, Rylander and Fisher2008). The core of the Atacama Desert, where our sites are located in Quebrada Maní (QM) (Figs. 1 and 2), remained hyperarid—i.e., no direct rainfall occurred. However, enhanced rainfall at higher elevations (Nester et al., Reference Nester, Gayo, Latorre, Jordan and Blanco2007; Gayo et al., Reference Gayo, Latorre, Jordan, Nester, Estay, Ojeda and Santoro2012a; Workman, Reference Workman2012) supported wetlands and shallow lakes through run-off and ground-water discharge into the otherwise hyperarid desert (Pfeiffer et al., Reference Pfeiffer, Latorre, Santoro, Gayo, Rojas, Carrevedo and McRostie2018; Quezada et al., Reference Quezada, Varas, Vásquez, Sepúlveda and Cifuentes2018). Interestingly, the Coastal Cordillera was not affected by these CAPE pluvial stages, but displays asynchronous wet periods related to a different moisture source (Ritter et al., Reference Ritter, Wennrich, Medialdea, Brill, King, Schneiderwind and Niemann2019).
Sustained arid to hyperarid conditions in the Atacama Desert reduced rates of erosion and weathering (Jordan et al., Reference Jordan, Kirk-Lawlor, Blanco, Rech and Cosentino2014). Consequently, a unique suite of soils (and surfaces) is present in the Atacama, mainly characterized by the accumulation and redistribution of soluble salts, which are dissolved and leached from soils by rain in most other settings (Ewing et al., Reference Ewing, Sutter, Owen, Nishiizumi, Sharp, Cliff, Perry, Dietrich, McKay and Amundson2006).
SITE DESCRIPTIONS
Geomorphological context
Our study sites are in the Pampa del Tamarugal (PdT), an internally drained basin at the foot the Andes, with a mean elevation of ~1 km. This basin is, in turn, part of the Central Depression in the hyperarid core of the Atacama Desert (Fig. 1). In terms of surface hydrology, the PdT is divided into northern and southern parts. Most of the drainages of the southern PdT where our sites are located presently experience no surface flow (Nester et al., Reference Nester, Gayo, Latorre, Jordan and Blanco2007). However, fluvial deposition and incision during more humid periods than today created terraces along river courses (Nester et al., Reference Nester, Gayo, Latorre, Jordan and Blanco2007). The system of terraces that we studied is located on the proximal section of the QM alluvial fan and the nearby Pintados Canyon (Fig. 2). The terrace surfaces completely lack vegetation and range between 840 and 1245 m asl. From oldest to youngest these terraces are: T1, T2, T2.5, T2.7, T3, and “modern” (Fig. 2) (Nester et al., Reference Nester, Gayo, Latorre, Jordan and Blanco2007). The T2, T2.5, and T2.7 terraces are differentiated from the T1 in that they incised into older Pleistocene or Miocene sediments (Fig. 2). The surface of T1 has a maximum age of 5.4 Ma based on a dated ignimbrite intercalated with the alluvial gravels that compose the terrace fill (Hoke et al., Reference Hoke, Isacks, Jordan, Blanco, Tomlinson and Ramezani2007). 14C dates for Terraces 2, 2.5, and 2.7 correspond to two enhanced stream discharge intervals, the first between ca. 17,750 and 13,750 cal yr BP, and a second ca. 11,750 cal yr BP. These dates are based on buried paleowetland organic material or subfossil leaf-litter. In QM itself, dates range between ~16,000 to 15,300 cal yr BP (Nester et al., Reference Nester, Gayo, Latorre, Jordan and Blanco2007). The dates for T2 terraces correspond to minimum age estimates for the time when aggradation stopped (Gayo et al., Reference Gayo, Latorre, Jordan, Nester, Estay, Ojeda and Santoro2012a). Terrace T3 is ~1000 yr old, based on the Late Intermediate-age (chrono-cultural period that spans from ca. 1500 to 500 cal yr BP) archaeology underlying T3 at QM. Additionally, aggradational terraces on side canyons in the Maní drainage yielded Late Holocene dates between 1100 and 700 cal yr BP (Nester et al., Reference Nester, Gayo, Latorre, Jordan and Blanco2007). The dates on terraces T2 and T3 suggest a relationship with periods of increased runoff coincident with CAPE I and II, and the Medieval Climate Anomaly (Nester et al., Reference Nester, Gayo, Latorre, Jordan and Blanco2007; Gayo et al., Reference Gayo, Latorre, Santoro, Maldonado and De Pol-Holz2012b).
Archaeological sites
Two late Pleistocene Paleoindian archaeological sites were studied for this research: QM12 and QM35 (Fig. 2; Table 1). QM12 (1240 m asl) is located on the distal part of the homonymous canyon, and atop an erosional remnant of the T1 terrace. Our previous excavations unearthed a human habitation area, as revealed by a prepared fireplace, pigments, shells from the Pacific (the shells were most likely worn as ornaments), wooden stakes, camelid bones and dung, and hundreds of lithic artifacts and tools (Latorre et al., Reference Latorre, Santoro, Ugalde, Gayo, Osorio, Salas-Egaña, De Pol-Holz, Joly and Rech2013; Santoro et al., Reference Santoro, Gayo, Capriles, Rivadeneira, Herrera, Mandakovic and Rallo2019). Ignoring several outliers that probably represent subfossil wood being used as fuel, accelerator mass spectrometry (AMS) 14C dates show that humans occupied this area between ~12,800 and 11,500 cal yr BP (Latorre et al., Reference Latorre, Santoro, Ugalde, Gayo, Osorio, Salas-Egaña, De Pol-Holz, Joly and Rech2013; Joly et al., Reference Joly, Santoro, Gayo, Ugalde, March, Carmona, Marguerie and Latorre2017; and this study, Supplementary Table 1). This period of human occupation coincides with CAPE II. Paleoenvironmental studies carried out in the vicinity of the site reveal that it was surrounded by a wetland (Workman, Reference Workman2012) and a perennial river. These water features supported phreatophyte vegetation (Gayo et al., Reference Gayo, Latorre, Jordan, Nester, Estay, Ojeda and Santoro2012a) and game such as Lama guanicoe (guanacos) and Vicugna vicugna (vicuñas).
Table 1. Archaeological site characteristics.

QM35 (840 m asl) is located on the surface of a T2 terrace between the distal section of the alluvial fans of the Maní and Pintados canyons. With six AMS 14C dates from stratigraphic contexts, the occupation ranges from ~11,300 to 11,900 cal yr BP (Table 1 and Supplementary Table 1). On the surface, T2 presents hundreds of lithic artifacts. The archaeological site is underlain by a terrace fill composed of paleowetland deposits associated with CAPE II (Supplementary Table 1; Santoro et al., Reference Santoro, Gayo, Capriles, Rivadeneira, Herrera, Mandakovic and Rallo2019), and beneath this, with CAPE I (~17,000–14,300 cal yr BP) containing several complete and incomplete faunal remains corresponding to extinct Megatherium, Hippidion, and camelid.
MATERIALS AND METHODS
Field methods
Desert pavements
Anthropogenically undisturbed locations at T3, T2, and T1 were analyzed (Fig. 2). On the surface, we recorded clast size (clasts >2mm), density or percentage of coverage, clast color, orientation of the clasts, surface slope, lithology of the clasts, and the presence and development of bar-and-swale topography. Clast density and size measurements were recorded using a 1 × 1 m wire-mesh grid with 1-cm-square subdivisions, counting the clasts manually, and then measuring their longest axis. Lithologies were identified and counted in the field. The change in color, from fresh to weathered rock, was assessed with a Munsell color chart and by comparing the outer crust of the clast with the inner, unexposed rock. Color was verified, when possible, by comparing exposed rocks to buried alluvium. The development of bar-and-swale topography was evaluated by dividing it in three stages: 0, 1, 2. Stage 0 represents a fresh topography, where both bars and swales are visible. Stage 1 shows swales partially covered with eolian sand and with clasts that have migrated from the bars. Stage 2 represents a completely smoothed topography, where bars and swales are no longer distinguishable (a similar model was proposed by de Haas et al. [2014] for Coastal Cordillera alluvial fans further south in the Atacama).
We excavated one ~50-cm deep test pit—or until we reached the cemented B horizon—on each terrace (Test Pit-T1, Test Pit-T2, Test Pit-T3) to evaluate sedimentology, soil development, and carbonate and salt content. Our profile descriptions focused on texture, lithology, and bedding of the sediments. Soil morphology was assessed through description of color, structure, and presence of secondary minerals. We took sediment and salt samples at 5-cm intervals or following the natural soil stratigraphy.
We employed the same methods to analyze the development of desert pavements in our two selected archaeological sites. For both sites we described a soil profile of an already open excavation (excavated in previous field seasons; Latorre et al., Reference Latorre, Santoro, Ugalde, Gayo, Osorio, Salas-Egaña, De Pol-Holz, Joly and Rech2013; Santoro et al., Reference Santoro, Gayo, Capriles, Rivadeneira, Herrera, Mandakovic and Rallo2019). Additionally, for QM12, we performed two new excavations: one in an area that was visibly less disturbed (QM12d), and a second next to the open excavation of the locus QM12c (QM12c-North Expansion, hereafter called QM12c-NE), where the more intense occupation was uncovered (Latorre et al., Reference Latorre, Santoro, Ugalde, Gayo, Osorio, Salas-Egaña, De Pol-Holz, Joly and Rech2013; Joly et al., Reference Joly, Santoro, Gayo, Ugalde, March, Carmona, Marguerie and Latorre2017). Excavations were carried out following a décapage method (Leroi-Gourhan and Brézillon, Reference Leroi-Gourhan and Brézillon1966; Courbin, Reference Courbin1987), recording in situ positions of tools, plus orientation and dip of all artifacts to evaluate vertical migration. Dip of artifacts was recorded and classified according to four stages: 1–flat, 2–slightly dipping, 3–moderately dipping, and 4–vertical. QM35 was not re-excavated for this study.
Laboratory Methods
Seven archaeological samples were AMS 14C dated: wood (wooden stake from QM12c-NE), charcoal (from QM12c-NE and QM12d), and bone (from QM12c-NE). All dates, including those from other studies, are reported as calibrated 14C ages (Supplementary Table 1). In the following text, 14C results are given as ranges between minimum and maximum calibrated ages based on 2 standard deviations.
Twenty-eight sediment samples from the three undisturbed pavement profiles and the archaeological pits were analyzed for particle size, organic matter content, carbonate content, and presence of salts. We used the pipette and sieve method from Janitzky (Janitzky, Reference Janitzky, Singer and Janitzky1986a) for the particle size determination. Organic matter analysis was carried out with the Walkley-Black method (Janitzky, Reference Janitzky, Singer and Janitzky1986b), whereas the carbonate content [CaCO3, CaMg(CO3)2] was determined with the Chittick test (Machette, Reference Machette, Singer and Janitzky1986). Analyses of salts in sediments (<2 mm fraction) were performed by the Arizona Laboratory for Emerging Contaminants (ALEC) at the University of Arizona, Tucson. Sulfate, nitrate and chloride concentrations in aqueous solutions were determined with ion chromatography (IC), whereas Na, Mg, K, and Ca cations were determined with inductively coupled plasma mass spectrometry (ICP-MS). We immersed 5 g of sediment samples in 40 ml of ultrapure water and warmed them on the heating block at 43° C for 3 hours (Klimchouk, Reference Klimchouk1996), intermittently shook the samples, and finally centrifuged them for 15 minutes at 3000 rpm to ensure dissolution of gypsum.
RESULTS
Undisturbed desert pavements and soils
T3 desert pavement and soil (≤1,000 cal yr BP)
The Late Holocene surface, T3, is covered by fresh bar-and-swale topography (Stage 0) (Fig. 3A), with no observable desert pavement. However, the swales are partially filled with eolian sand representing the first stage in landscape smoothing. Faint clast imbrications indicating flow direction are still visible. The surface slope is 3°. The soil test pit (Test Pit-T3) at the proximal end of the alluvial fan of the Pintados Canyon (Fig. 2) reveals a matrix-supported conglomerate composed of rhyolite, granite, sandstone, and basalt (Fig. 4A). The colors of surface clasts have only slightly changed to darker hues (Table 2, Fig. 3G) compared to buried alluvium and to the inner (unexposed) parts of the rock. For example, the rhyolite clasts change from 10R 5/2 to 2.5YR 4/2. Most clast types are fresh except granite, which displays some spalling. Clast density ranges from 36% for finer-grained (mean diameter = 8.3 mm) bars to 68% where bars are coarser (mean diameter = 48.8 mm). The largest clasts range up to ~450 mm in diameter (Table 3; Fig. 9A and 9B). In the soil profile, a thin, loamy sand A horizon (15 cm thick) with platy structure is observed, underlain by coarse gravels (Figs. 3B and 4A; Table 4). Salt analyses reveal Ca and SO4, probably in the form of gypsum, are present mainly in the first 20 cm (0.015–0.039 μmol/g Ca; 0.028–0.057 μmol/g SO4), but then increases in the lowest 5 cm of the profile (0.054–0.058 μmol/g Ca; 0.067–0.095 μmol/g SO4) (Fig. 5A; Supplementary Table 2). Chlorides and nitrates are scarce, but peak between 25–30 cm depth in the case of chlorides (0.008 μmol g Cl), and at 40 cm for nitrates (0.005 μmol g NO3) (Fig. 6A; Supplementary Table 2).
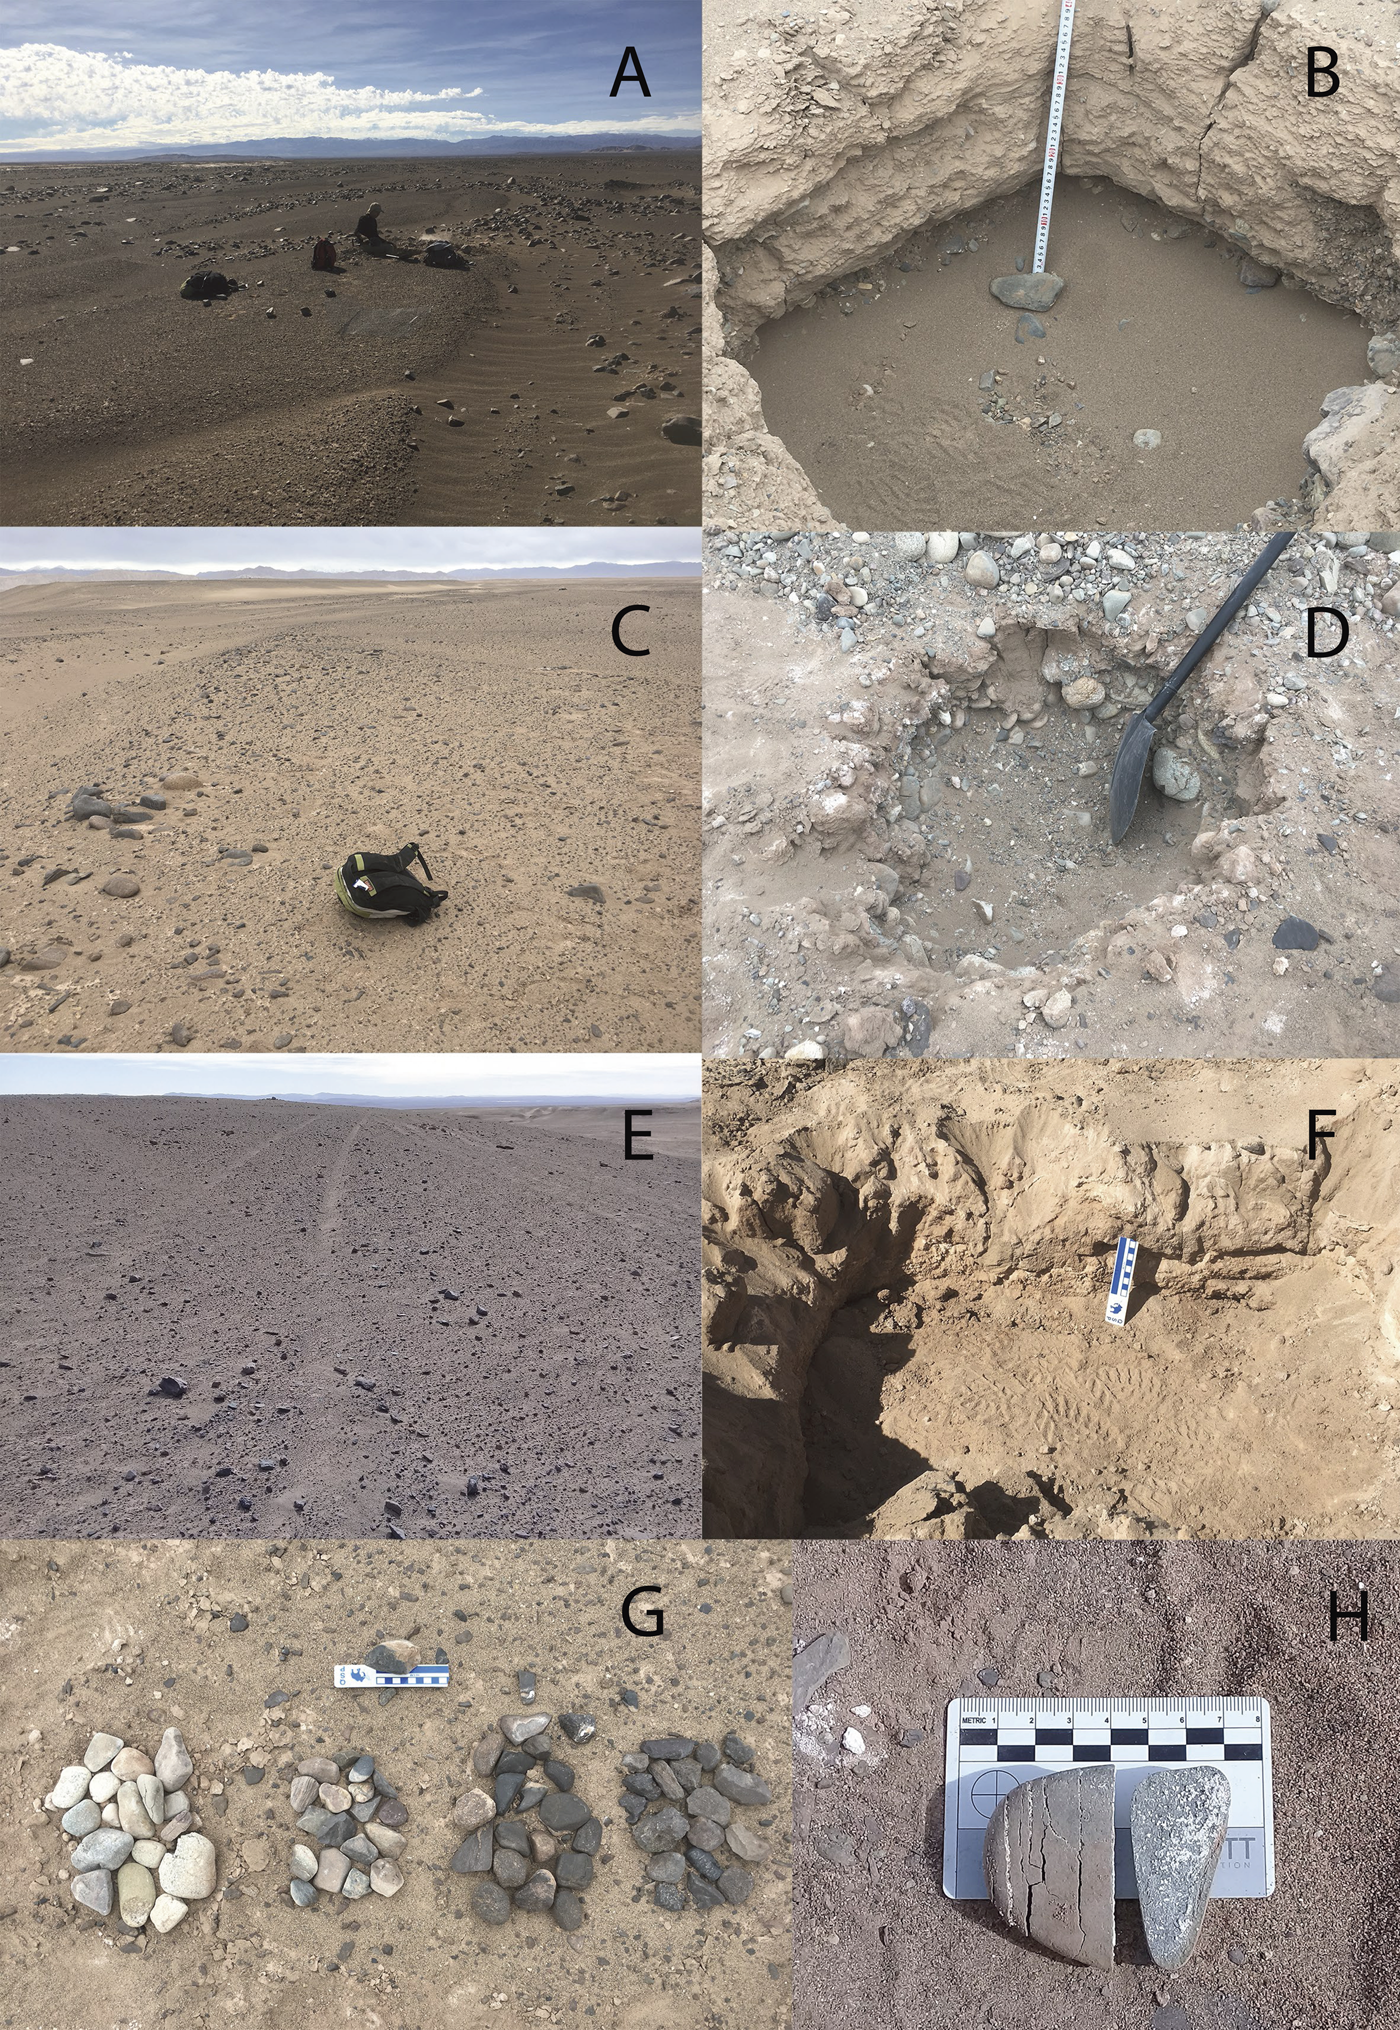
Figure 3. (color online) (A), (B) Terrace 3, bar-and-swale stage 1, and test pit showing soil profile; (C), (D) Terrace 2, bar-and-swale stage 2, and test pit showing soil profile; (E), (F) Terrace 1, bar-and-swale stage 3, and test pit showing soil profile. (G) The main lithologies of the three terraces, displaying change of color and progressive desert varnishing, left to right. (H) Thermal cracking (perpendicular to the long axis) of a gravel clast showing salts.

Figure 4. (color online) (A) T3 soil profile: A horizon with platy structure, absent B horizon. Decrease in gravel content: 36% on the surface, 5% in the C1 to C3 horizons, and a very gravelly (gravel up to 20 cm) C4ym horizon. (B) T2 soil profile. Platy structure at the surface, thin avesicular A horizon, absence of a B horizon. C corresponds to a gravel bar. (C) Calcium carbonate percentage vs. soil depth at the studied terraces (T1, T2, and T3). (D) T1 soil profile: Av for the first 10 cm, with vesicles in silty pockets.

Figure 5. (color online) Sulfates concentrations for all three study sites, (A) T3; (B) T2; (C) T1; (D) QM12c; (E) QM12d. Lines connecting the data points are added to better visualization of the trends, not to express gradual transitions.

Figure 6. (color online) Nitrate and chloride concentrations for all of the studied profiles: (A) T3; (B) T2; (C) T1; (D) QM12c; (E) QM12d. Note how chlorides and nitrates peaks are coupled, but chloride and Na are not, with the exception of T2 where sampling was difficult because the soil was so gravelly. Lines connecting the data points are added to better visualization of the trends, not to express gradual transitions.
Table 2. Change in color for main lithologies at different terraces.

Table 3. Desert pavement characteristics on the different terraces.
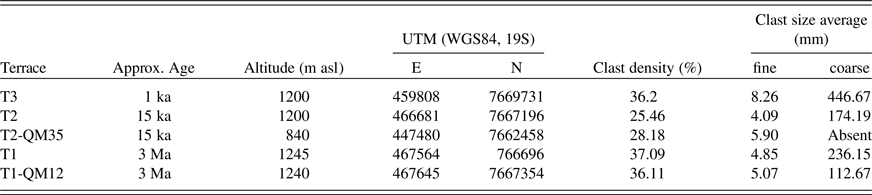
Table 4. Summary of profile descriptions.

T2 desert pavement and soil (~15,000 cal yr BP)
Bar-and-swale topography is still visible but heavily modified by weathering on T2 (Stage 1) (Fig. 3C). Granite clasts in both bars and swales are almost completely reduced to granular grus. Volcanic rocks are also extensively spalled and some show book-like weathering (“kernsprung”). Secondary salts are evident within the cracks (Fig. 3H). The orientation of the clasts is random and without the clast imbrication observable on T3. The surface slope is 2°. Clasts in pavements are more poorly sorted, due to the differential weathering of different lithologies—in this case, basalt, sandstone, rhyolite—and the almost complete loss of granite. All clasts display a noticeable darkening in color (Table 2, Fig. 3G). For instance, in rhyolite clasts color changes from 5YR 4/2 to Gley1 7/10y. Mean clast coverage is 25%, and mean clast size is 4 mm, whereas mean size of the largest clasts is 174 mm (Table 3; Figs. 9A and 9B). The soil profile (Test Pit-T2) shows a pavement supported by a ~0.3-cm thick silty matrix, followed by a ~5-cm thick loamy sand A horizon with platy structure, resting on coarse alluvial gravels (Figs. 3D and 4B; Table 4). Salt analyses show that gypsum is more abundant at the surface (0–5 cm; 0.16 μmol/g Ca; 0.175 μmol/g SO4), nitrate is low (<0.01 μmol/g NO3), and halite is accumulating between 10 and 20 cm of depth (0.18 μmol g Na; 0.056 μmol/g Cl) (Figs. 5B and 6B; Supplementary Table 2).
T1 desert pavement and soil (≤5.4 Ma)
Bar-and-swale topography is no longer present on this smooth, homogeneous surface (Stage 2; Fig. 3E). The main persisting clast lithologies are fine- and coarse-grained rhyolite and sandstone. About half of these clasts, including those of resistant lithologies, show surface pitting but few signs of the clast splitting common on T2. Granite, the most weatherable of the lithologies, is completely absent. The orientation of the clasts is random, and the surface is gently sloping. Their colors are conspicuously darker (Table 2, Fig. 3G) compared to younger surfaces. For instance, coarse-grained rhyolite changed from 2.5Y 5/1 to 10YR 5/1. Clast coverage is 37%, and mean clast size is 4.9 mm, whereas the mean for the largest clasts is 236 mm (Table 3; Figs. 9A and 9B), finer than on T3. The soil profile (Test Pit-T1) shows a pavement supported by a very thin (0.1–0.2 cm thick) silty matrix, underlain by two loamy sand and sandy loam, almost gravel-free A horizons, with vesicles in silty pockets (Av), and platy structure for the lower A (total thickness = 18 cm). These A horizons rest on top of two cemented, gravel-free Byzm horizons (Figs. 3F and 4D; Table 4). Salt analyses reveal the accumulation of sodium and sulfate at 15 cm (7.867 μmol/g Na; 3.391 μmol/g SO4) and 30–40 cm of depth (3.515–9.027 μmol/g Na; 1.462–7.620 μmol/g SO4) (Fig. 5C; Supplementary Table 2). Because mNa >mSO4 on a molar basis, we attribute these salt peaks to thenardite (Na2SO4) with some minor halite. At the surface (0–5 cm), gypsum appears dominant (0.016 μmol/g Ca; 0.218 μmol/g SO4). In general, and compared to sulfates, nitrate and chloride are low throughout the T1 profile (0.008–0.217 μmol/g Cl; 0.009–0.0338 μmol/g NO3) (Fig. 6C; Supplementary Table 2).
Desert pavements and soils disturbed by late Pleistocene humans
T2 and QM35
The surface overlying archaeological site QM35 is morphologically similar to the undisturbed T2, with the exception that there are no large clasts, and the bar-and-swale topography is smoother. This probably reflects the more distal position of this terrace on the alluvial fan than our natural site on T2. However, clast coverage at 28% is almost identical (Table 3). The surface of the terrace is covered with flakes and tools. The orientation of the clasts is also random, and mean size is 5.9 mm (Fig. 9A). The soil profile exposes paleowetland deposits on the bottom, capped by a coppice dune, which in turn is overlain by a loamy sand deposit with archaeological material and a thin surficial layer of pavement (Figs. 7A, 8A, and B; Table 4).

Figure 7. (color online) (A) QM35 soil profile. Horizons Aa1 and Aa2 contain the archaeological material. As shown in the profile with a wavy black boundary line, Aa2 deepens irregularly because of the fireplace. C horizon is a coppice dune. Byk (and below, up to 150 cm) corresponds to a series of wetland deposits, archaeologically sterile, composed of clay-loam and loam. (B) QM12d soil profile. Platy structure supporting the pavement, complex sequence of weakly formed B horizons (all loamy sands with pockets of gypsum, but with different colors), underlain by Byzm. (C) QM12c soil profile. Platy structure in the first 3 cm, absence of vesicles. A very weak sub-angular blocky structure unique to this part of the site. Aa3 corresponds to a prepared fireplace dug into the Byz1. Also found in Aa3 (or Level 3) was a vertically placed wooden stake. (D) QM12c-NE soil profile. Weak fine platy structure on the top 2 cm, avesicular Aa horizon. (E) Calcium carbonate percentage vs. soil depth at sites QM12c and QM12d.

Figure 8. (A) Human occupation layer in QM35 soil profile, underlain by a coppice dune (red line separates both layers and shows how the human occupation layer goes deeper in some section of the profiles). (B) A deeply buried paleowetland deposit in the QM35 soil profile, underlaying both the human occupation and the coppice dune. This paleowetland sequence corresponds to CAPE I, and it is archaeologically sterile. (C) Soil profile in QM12d. Bedding observable in the upper few centimeters (white arrow), underlain by large pockets of gypsum (red arrow). Red sands are interspersed. A large crack affects the whole profile vertically. (D) Clast density on top of QM12d. This represents clast density in QM12c and T1 as well. Close to 30% cover. (E) QM12c profile showing a large vertical crack (white arrow). (F) QM12c profile displaying the wooden stake, sharpened on the bottom (distal) end (red arrow). (G) Cracking in plan view at QM12c. (H) Cracking in plan view at QM12d, displaying two colors of sandy sediments coming through the cracks, one greenish-grayish at the center, and one reddish at the margins. This does not happen at QM12c. Both cracks are surrounded by fine gypsum specks. (For interpretation of the references to color in this figure legend, the reader is referred to the web version of this article.)

Figure 9. (color online) (A) Sizes for smaller clasts on archaeological sites, T1, T2, and T3. (B) Sizes for larger clasts on QM12, T1, T2, and T3. Middle line of the box represents the median, x represents the mean, the box's lower and upper limits represent the 1st and 3rd quartiles, respectively. Whiskers correspond to minimum and maximum values. Dots show outliers (one extreme outlier on each end was trimmed for every sample).
T1 and QM12
The surface above site QM12 is morphologically very similar to the undisturbed T1 terrace: bar-and-swale topography is completely smoothened (Stage 3), and clasts are equally weathered (Table 2). However, there is a clear abundance of allochthonous rocks, such as shale and opaline silica, used as raw material for artifacts, which are not present among surface clasts on the undisturbed T1 surface. Clasts are randomly oriented. Clast coverage is 36%, mean clast size 5.1 mm, and the mean size of the largest clasts is considerably smaller compared to T2 and T3, with 113 mm (Table 3; Figs. 9A and 9B).
We described three profiles on this site to compare different degrees of human disturbance. The first one, QM12d, located 20 meters south of QM12c, displays less surface human activity and has a very shallow deposit (Figs. 8C and 8D). The second profile, QM12c-NE, is also newly excavated and is located toward the north of the original excavation of QM12c in an area where the density of materials is noticeably less than around the fireplace (Figs. 8E and 8F). The third profile, QM12c, on the already open excavation is located next to the area where the prepared fireplace was located and corresponds to the most intensely used part of the site (Latorre et al., Reference Latorre, Santoro, Ugalde, Gayo, Osorio, Salas-Egaña, De Pol-Holz, Joly and Rech2013).
All three profiles are capped by a disturbed pavement (clasts mixed with archaeological material) resting on a loamy sand matrix, followed by one or several loamy sand or sandy Aa horizons with variable amounts of archaeological material. The A horizons have a thin platy structure and are underlain by several irregular B horizons that are very weakly developed (e.g., sulfate only present in pockets, with single-grain or sub-angular blocky structure), transforming into a strong and cemented B horizon with depth, containing an estimated >50% sulfate. All of the archaeological material is embedded in the A horizons, and mixed at the surface (Figs. 7B, 7C, and 7D; Figs. 8C–8F; Table 4). Based on the salt analyses, gypsum is present in minor quantities (0.098–0.137 μmol/g Ca; 0.166–0.170 μmol/g SO4) from 0 to 30 cm at QM12c, and from 0 to 14 cm at QM12d (0.084–0.094 μmol g Ca; 0.126–0.140 μmol/g SO4), whereas based on the mNa >mSO4, we estimate that the lower B horizons are dominated by thenardite (reaching 4.8 μmol/g Na at 40 cm in QM12c, and 4.5 μmol/g at QM12d) (Figs. 5D and 5E; Supplementary Table 2). Nitrate and chloride are present throughout. A chloride peak at 17 cm in QM12d indicates the presence of halite (1.11 μmol/g Na; 0.186 μmol/g Cl) (Figs. 6D and 6E; Supplementary Table 2).
Calcium Carbonate and organic carbon content in the soil profiles
The percentage of calcium carbonate (CaCO3) in all the study soils is very low, ranging from 0 to 1.3% (Figs. 4C and 7E). The upper soil profiles contain more CaCO3, which decreases with depth, except for T3 (Fig. 4C). Additionally, the highest percentages deeper in the profile are found in the QM12c-NE sample and coincide with the more intense human occupation (Fig. 7E). Organic carbon is also generally low in all of the tested soils, ranging from 0.05 to 2%. The highest percentages are found in the top layers (Aa horizons) of the archaeological sites of QM12c and QM12d, with 1.25–2% and 2%, respectively.
Archaeological excavations at QM12d and QM12c-NE
QM12d
QM12d contains three archaeological levels. Level 1 (0 to ~4 cm) is uppermost and includes the capping desert pavement and underlying loose sediment. The matrix is eolian sand and exhibits common vertical cracks up to 25 cm infilled with sediments from above (Fig. 8H). There are several flakes all of which range in dip from stages 1 to 4 (Table 5). Small pieces of charcoal as well as red pigments occur sparsely. Level 2 (~4 to 13–19 cm) is a very irregular layer, contains more red pigment, charcoal, and some unidentified plant remains. The dip stage of flakes also ranges from 1 to 4. Some of the flakes, which are abundant, are cemented into sulfate concretions. Salt cracks are infilled with sediments of two colors. Two charcoal samples from this level are dated to 11,640–12,000 and 11,645–12,010 cal yr BP (Supplementary Table 1). Level 3 (~13–19 to 20–26 cm) is practically sterile with only a small number of flakes that likely migrated downward along cracks.
Table 5. Percentages of dipping stages for flakes and lithic tools at QM12d and QM12c. Dip of artifacts was recorded considering four stages: 1–flat, 2–slightly dipping, 3–moderately dipping, and 4–vertical.

QM12c-NE
QM12c-NE encompasses four archaeological levels. The surface pavement contained five flakes all lying flat (Table 5), and bone fragments. Level 1 (~1 to 2 cm) contained several flakes with dipping stages from 1 to 4. It also featured the top of a wooden stake hammered vertically into the next level (Fig. 8F), bone fragments, and pockets of ash and charcoal. Several artifacts and ecofacts are cemented by sulfates. Level 2 (~2 to 7–8 cm) contained several large pieces of charcoal, fragments of wood probably coming from the stake, unidentifiable plant remains, and a few flakes with dipping stages from 2 to 3. All of the archaeological material is weakly cemented by sulfates. Level 3 (~7–8 to 18–23 cm) sediment becomes loose again with depth, and sand-filled cracks appear (Fig. 8G). This level contained several pieces of charcoal and bones. Both ecofacts and their surrounding sediments are cemented by sulfates. Flakes are inclined in stages 2 and 4. A finished and resharpened Las Cuevas projectile point, a typically Early Holocene typology at the Andean Highlands (Santoro, Reference Santoro, Hidalgo, Schiappacasse, Niemeyer, Aldunate and Solimano1989; Osorio et al., Reference Osorio, Jackson, Ugalde, Latorre, De Pol-Holz and Santoro2011), was found at the base of this level, lying flat (Fig. 7D). Charcoal from this level dates to 11,965–12,395 cal yr BP (Supplementary Table 1). Level 4 (~18–23 to 29–35 cm) showed a dramatic decrease of archaeological material to almost nothing, with the exception of the sharpened base of the wooden stake (which was hammered to the floor, and therefore lower than the occupation surface; Fig. 7D), and very few small flakes that were probably migrating from above. This level corresponds to a Byz transitioning to a Byzm horizon. The wooden stake dates to 11,395–11,805 cal yr BP (Fig. 7D; Supplementary Table 1).
DISCUSSION
The nature of pavements in the Atacama
In contrast to other deserts, pavements from the core of the Atacama are poorly developed regardless of their age (based on the age of the terraces). They show a low percentage of clast coverage, no interlocking clasts, and no significant decrease in size for the smaller clast size as the pavements get older (Fig. 9A). Additionally, with the exception of the clasts on the T1, there is a low degree of rock varnishing compared to other deserts (Quade, Reference Quade2001; Matmon et al., Reference Matmon, Simhai, Amit, Haviv, Porat, McDonald, Benedetti and Finkel2009; Dietze and Kleber, Reference Dietze and Kleber2012; Dietze et al., Reference Dietze, Groth and Kleber2013; Dietze et al., Reference Dietze, Dietze, Lomax, Fuchs, Kleber and Wells2016). Nevertheless, there are several reasons to consider the clasts on T1 to be a part of true pavements. One is the presence of the surficial layer of clasts that have remained stable on the surface for long periods and display clear signs of progressive weathering. Surface stability is expressed by the smoothing of the bar-and-swale topography and the random orientation of the clasts, along with a gradual loss of the more weatherable lithologies, a significant decrease of the maximum size clasts from T3 to T1, and changes in color toward darker hues due to formation of rock varnish (Cooke, Reference Cooke1970; McFadden et al., Reference McFadden, Wells and Jercinovich1987, Reference McFadden, McDonald, Wells, Anderson, Quade and Forman1998; Haff and Werner, Reference Haff and Werner1996; Al-Farraj and Harvey, Reference Al-Farraj and Harvey2000; Quade, Reference Quade2001; Valentine and Harrington, Reference Valentine and Harrington2006; Pelletier et al., Reference Pelletier, Cline and Delong2007). The second classic desert pavement feature is the presence of an Av with vesicles in silty pockets under the pavement at undisturbed T1, underlain by an A horizon with platy structure. The third feature is the formation of a gravel-free B horizon under the T1, where the eolian deposition of sand and silt potentially spans millions of years.
We hypothesize that both the Av and B horizon formation in the core of the Atacama depends not only on time and accumulation, but on different climatic conditions, as has been noted for other deserts (McFadden et al., Reference McFadden, McDonald, Wells, Anderson, Quade and Forman1998; Quade et al., Reference Quade2001; Matmon et al., Reference Matmon, Simhai, Amit, Haviv, Porat, McDonald, Benedetti and Finkel2009; Dietze et al., Reference Dietze, Dietze, Lomax, Fuchs, Kleber and Wells2016). We propose that they must have formed under wetter conditions before the Holocene, particularly during the Pliocene and early Pleistocene when rare precipitation events were larger in the Atacama (>10 mm) (Ewing et al., Reference Ewing, Sutter, Owen, Nishiizumi, Sharp, Cliff, Perry, Dietrich, McKay and Amundson2006; Amundson et al., Reference Amundson, Dietrich, Bellugi, Ewing, Nishiizumi, Chong and Owen2012). This might be counterintuitive, because in other deserts in the world, such as the Mojave, desert pavement and Av horizon formation seems to be related to periods of increased aridity (Dietze and Kleber, Reference Dietze and Kleber2012; Dietze et al., Reference Dietze, Dietze, Lomax, Fuchs, Kleber and Wells2016). However, in the Atacama the increase in moisture during wetter phases was still insufficient at these elevations for plant growth (Díaz et al., Reference Diaz, Latorre, Maldonado, Quade and Betancourt2011) or for overland flows on these Miocene terraces, two factors that destroy pavements and Av horizons.
In the case of the Av horizon, the sustained lack of water may have inhibited development of a very silty and continuous Av horizon, since it is episodic rain that mobilizes sediment particles trapped by the pavement clasts and creates the air bubbles in the vesicular A horizons beneath them. Additionally, we attribute the prevalence of sandy loam and loamy sands, instead of silts and clays found in other deserts (McFadden et al., Reference McFadden, Wells and Jercinovich1987; McFadden et al., Reference McFadden, McDonald, Wells, Anderson, Quade and Forman1998; Anderson et al., Reference Anderson, Wells and Graham2002; Dixon, Reference Dixon, Abrahams and Parsons2009) to the lack of an interlocked carpet of clasts to trap the finer particles of dust. We believe that this is the reason for the scarcity of fines, instead of a lack of dust availability, since the area is surrounded by playas that are and were a good fine dust source (Pfeiffer et al., Reference Pfeiffer, Latorre, Santoro, Gayo, Rojas, Carrevedo and McRostie2018). In the T1 soil, the patchy nature of silty deposits which show vesicles indicates that perhaps these pockets have formed wherever there is more clast coverage.
For B horizon formation, sufficient but not excessive rainfall is required to remobilize sulfates without transporting them out of the system by percolation. The absence of sulfate accumulation under T2 indicates that rainfall was insufficient in this part of the Atacama over the last ~10,000 years to form such a B horizon. This precipitation threshold is likely >1 and <20 mm/yr, because at >20 mm/yr CaCO3 starts to accumulate in these soils (Ewing et al., Reference Ewing, Sutter, Owen, Nishiizumi, Sharp, Cliff, Perry, Dietrich, McKay and Amundson2006). Furthermore, the lack of CaCO3 in the form of Bk horizons in all the test sites, including T1 which is ~5 Ma, is evidence that this part of the Atacama has been predominantly hyperarid for millions of years (Hartley and Chong, Reference Hartley and Chong2002; Hartley, Reference Hartley2003; Dunai et al., Reference Dunai, González López and Juez-Larré2005; Ewing et al., Reference Ewing, Sutter, Owen, Nishiizumi, Sharp, Cliff, Perry, Dietrich, McKay and Amundson2006; Rech et al., Reference Rech, Currie, Michalski and Cowan2006; Garreaud et al., Reference Garreaud, Molina and Farias2010; Amundson et al., Reference Amundson, Dietrich, Bellugi, Ewing, Nishiizumi, Chong and Owen2012; Jordan et al., Reference Jordan, Kirk-Lawlor, Blanco, Rech and Cosentino2014; Ritter et al., Reference Ritter, Stuart, Binnie, Gerdes, Wennrich and Dunai2018).
The low amounts of CaCO3 only at the surface of our soil profiles may signify marine transport of Ca through fog or eolian reworking of local salares (salt flats) (Rech et al., Reference Rech, Quade and Hart2003), the presence of plants during wet periods (which is very unlikely), or microbial activity (because the source for the CO2 in CaCO3 is plant and/or microbial respiration) (Schoeneberger et al., Reference Schoeneberger, Wysocki, Benham and Staff2012). However, this CaCO3 was never remobilized downward to form B horizons, and we do not believe this or any other salt moved upward through capillary diffusion into the T1 profile because of (1) the depth of the water table >70 m below the ground (PRAMAR-DICTUC, 2007), (2) the absence of oxidized roots, mottled colors, and carbonates, all typical of a locally elevated water table, and (3) the lack of thick salt crusts at the surface (Davis et al., Reference Davis, de Pater and McKay2010; Cosentino et al., Reference Cosentino, Jordan, Derry and Morgan2015) like those found in phreatic salares at lower elevation at this same latitude (Pfeiffer et al., Reference Pfeiffer, Latorre, Santoro, Gayo, Rojas, Carrevedo and McRostie2018).
The lack of densely interlocking pavements at our sites is interesting and surprising, since surface stability and aridity are seen to be crucial elements in strong pavement formation. All terraces, including intact and disturbed surfaces, did not exceed 37% of clast coverage, which contrasts with other well-developed desert pavements around the world (Springer, Reference Springer1958; Abrahams and Parsons, Reference Abrahams and Parsons1991; Al-Farraj and Harvey, Reference Al-Farraj and Harvey2000; Quade, Reference Quade2001; Wood et al., Reference Wood, Graham and Wells2005; Matmon et al., Reference Matmon, Simhai, Amit, Haviv, Porat, McDonald, Benedetti and Finkel2009; Bockheim, Reference Bockheim2010; Dietze and Kleber, Reference Dietze and Kleber2012; Adelsberger et al., Reference Adelsberger, Smith, McPherron, Dibble, Olszewski, Schurmans and Chiotti2013; O'Neill et al., Reference O'Neill, Balks and López-Martínez2013). Maximum clast coverage in old, abandoned surfaces comparable to what we found in T1 range from 80 to 100% (Table 6; Fig. 10A). Even in younger (Holocene) surfaces, such as in the Mojave Desert in the United States, up to 95% of clast coverage has been recorded (Quade, Reference Quade2001).

Figure 10. (color online) (A) Comparative data on maximum clast coverage (%) for different deserts of the world. (B) Maximum Clast Coverage vs. current Mean Annual Precipitation for pavements from different deserts in the world: 1) Pampa del Tamarugal, Atacama Desert, Chile (this study); 2) Lybian Plateau, Egypt (Adelsberger et al., Reference Adelsberger, Smith, McPherron, Dibble, Olszewski, Schurmans and Chiotti2013; Adelsberger and Smith, Reference Adelsberger and Smith2009); 3) Paran Plains, Negev Desert, Israel (Matmon et al., Reference Matmon, Simhai, Amit, Haviv, Porat, McDonald, Benedetti and Finkel2009); 4) Nevado Tres Cruces, High Atacama, Chile (Dietze and Kleber, Reference Dietze and Kleber2012); 5) Laguna Salada, Baja California, Mexico (Dietze and Kleber, Reference Dietze and Kleber2012); 6) Ross Sea Region, Antarctica (O'Neill et al., Reference O'Neill, Balks and López-Martínez2013); 7) Transantarctic Mountains, Antarctica (Bockheim, Reference Bockheim2010); 8) Carson Desert, Nevada, USA (Springer, Reference Springer1958); 9) Wadi Al-Bih, UAE and Oman (Al-Farraj and Harvey, Reference Al-Farraj and Harvey2000); 10) Mojave Desert, California, USA (Quade, Reference Quade2001; Wood et al., Reference Wood, Graham and Wells2005; Dietze and Kleber, Reference Dietze and Kleber2012); 11–13, 15–19) Black Rock Desert, Utah, USA (Dietze and Kleber, Reference Dietze and Kleber2012); 14) Sonora Desert, Arizona, USA (Abrahams and Parsons, Reference Abrahams and Parsons1991).
Table 6. Comparative data on clast coverage for different deserts of the world.

Several factors contribute to pavement development and long-term stability in general, such as slope stability and surface reworking by runoff. Neither of these factors are at play in our study area, which is nearly rainless (Ewing et al., Reference Ewing, Sutter, Owen, Nishiizumi, Sharp, Cliff, Perry, Dietrich, McKay and Amundson2006; DGF, 2007; Amundson et al., Reference Amundson, Dietrich, Bellugi, Ewing, Nishiizumi, Chong and Owen2012; Jordan et al., Reference Jordan, Kirk-Lawlor, Blanco, Rech and Cosentino2014), and where slopes are modest and stable (for our sites, this study). Added to this is the lack of orientation of our clasts, which suggests pavements not affected by surface runoff (cf. Dietze et al., Reference Dietze, Groth and Kleber2013). Another key control on pavement development and stability is bioturbation by plants and animals. For example, in the United States’ Mojave and Black Rock deserts, pavement clast density declines as rainfall increases, and pavements virtually disappear where mean annual precipitation (MAP) equals 250–350 mm/yr due to the constant churning action of the surface by plants and animals (Quade, Reference Quade2001; Dietze and Kleber, Reference Dietze and Kleber2012; Dietze et al., Reference Dietze, Bartel, Lindner and Kleber2012, Reference Dietze, Dietze, Lomax, Fuchs, Kleber and Wells2016). Similarly, Av horizons are also destroyed or prevented by roots; and the maintenance of the Av is fundamental for the maintenance of the pavement above it (Dietze et al., Reference Dietze, Bartel, Lindner and Kleber2012; Dietze et al., Reference Dietze, Dietze, Lomax, Fuchs, Kleber and Wells2016). Again, bioturbation seems to be absent on our sites. Untested by any previous studies is the possibility of a lower rainfall limit for pavement formation, a test provided by this research in the core of the Atacama Desert.
In contrast to many other deserts, especially the North American ones (Finstad et al., Reference Finstad, Pfeiffer and Amundson2014), soluble salts readily accumulate in the Atacama and create Bzm horizons due to very scarce direct rainfall (Ericksen, Reference Ericksen1981; Rech et al., Reference Rech, Quade and Hart2003; Ewing et al., Reference Ewing, Sutter, Owen, Nishiizumi, Sharp, Cliff, Perry, Dietrich, McKay and Amundson2006). This increased salt deposition appears to be a key element in the extreme and rapid breakage of surficial clasts that we observe, homogenizing the minimum clast size during the first 10,000 years of exposure, and impeding the formation of an interlocking surface of clasts (Fig. 9A). This rapid and extreme breakage of clasts has also been proposed for alluvial fan surfaces that have remained inactive on the Coastal Range at a similar latitude (de Hass et al., Reference de Haas, Ventra, Carbonneau and Kleinhans2014). In our study area, gypsum and halite are present in the younger terraces (T3 and T2), and ubiquitous in cracks of surface clasts (Fig. 3H). On T1, fracturing is no longer apparent, and gypsum appears only at the shallower levels, whereas thenardite seems to be accumulating through leaching in the older B horizons. This is to be expected, as Na is highly soluble, and it has been noted for other pavement soils as well (McFadden et al., Reference McFadden, McDonald, Wells, Anderson, Quade and Forman1998). The presence of Na in these older soils could be related to the influence of coastal fog as a source of moisture, due to the low altitude of the Coastal Range in this area and the elevation of this T1 below 1300 m asl (Rech et al., Reference Rech, Quade and Hart2003). However, Cosentino et al. (Reference Cosentino, Jordan, Derry and Morgan2015) argued that the zone of influence of coastal fog inland reaches only 1100 m asl. Consequently, the source of Na and any other main cation could be also the eolian reworking of local salares and thus Andean in origin, as demonstrated by Rech et al. (Reference Rech, Quade and Hart2003).
In short, we propose that there is a range for the required amount of water needed to form well-developed pavements and their underlying Av horizon. Figure 10B illustrates the association of mean annual rainfall between ~60 and ~200 mm/yr and dense, interlocking pavements (i.e., pavements between 85 and 100% maximum clast coverage). Below (~50 mm/yr) and above (~250 mm/yr) this range the association is not optimal, and pavements with <80% clast coverage form (Quade, Reference Quade2001; Dietze and Kleber, Reference Dietze and Kleber2012). The core of the Atacama, with a MAP of <1 mm/yr, has a maximum clast coverage of 37% at our sites, which we believe to be representative of the Central Depression in general. This could be different on alluvial fans of the similarly hyperarid Coastal Range of the Atacama because they have been subject to more recent activity, especially debris flows caused by extreme precipitation events that might be related to El Niño (Haug et al., Reference Haug, Kraal, Sewall, Van Dijk and Diaz2010; Walk et al., Reference Walk, Stauch, Reyers, Vásquez, Sepúlveda, Bartz, Hoffmeister, Brückner and Lehmkuhl2020). The Libyan Plateau in Egypt is the only record that does not follow this trend, i.e., rainfall below ~50 mm/yr creates pavements with <80% of clast coverage. Today, this region of the world experiences the same MAP as the Atacama, but it shows well-developed pavements with up to 100% coverage and thick Av horizons (Adelsberger and Smith, Reference Adelsberger and Smith2009; Adelsberger et al., Reference Adelsberger, Smith, McPherron, Dibble, Olszewski, Schurmans and Chiotti2013). The difference between these two environments might be past precipitation, since the hyperarid core of the Atacama has received negligible direct rainfall in the last ~10 Ma (Rech et al., Reference Rech, Currie, Michalski and Cowan2006; Jordan et al., Reference Jordan, Kirk-Lawlor, Blanco, Rech and Cosentino2014), whereas the Sahara Desert has been intermittently much wetter in the recent (precessional) past (Haynes, Reference Haynes2001; Adelsberger and Smith, Reference Adelsberger and Smith2010; Tierney et al., Reference Tierney, Pausata and deMenocal2017). The well-developed pavements in Egypt therefore may be relicts of previous wetter periods in the Sahara.
Archaeological sites and desert pavements
The surface pavements and soils that we investigated appear to have been partially or totally disturbed by Paleoindians, with the surface pavements subsequently regenerated after abandonment of the sites during the Early Holocene. QM12 provides the clearest evidence of this regeneration process. Archaeological materials at QM12c migrated upwards to the surface and mixed with the clasts exposed before human occupation. This is evident from the differential weathering of clasts and lithics, as shown by change in color and pitting (Fig. 3G; Table 2). Where humans intervened more heavily by digging the ground to place their tents and fireplaces, certain features remained in situ. For example, the wooden stakes to either build a tent, stretch leather, or cook; the hole dug in the Byzm horizon for the prepared fireplace; a large rock placed intentionally next to the fireplace; and some lithics, such as a projectile point of early typology, lying flat on top of the Byzm.
Most of the development of the B horizon must pre-date the stake and related human occupation because the post-occupation aridity would inhibit pedogenesis (Gayo et al., Reference Gayo, Latorre, Santoro, Maldonado and De Pol-Holz2012b; Pfeiffer et al., Reference Pfeiffer, Latorre, Santoro, Gayo, Rojas, Carrevedo and McRostie2018). Additionally, since this B horizon is strongly cemented, and there is no evidence of human occupation within it, we suggest that wherever humans excavated enough to reach the B horizon represents an occupational floor. However, the evidence suggests that mobilization of sulfate continued post-occupationally, and thus this cultural horizon is not intact. Most of the artifacts from QM12c-NE were covered or engulfed in sulfates, showing that sulfate translocation was post-occupational. This mobilization likely was top down from the surface, by infiltrating water due to rare and small rainfall events or moisture from coastal fog, and with new salts coming into the deposits likely from coastal fog or eolian reworking of salares. Later, the salt-induced expansion and contraction churns the artifacts and ecofacts in the deposit, including charcoal pieces, thus inverting the radiocarbon dates reported by Latorre et al. (Reference Latorre, Santoro, Ugalde, Gayo, Osorio, Salas-Egaña, De Pol-Holz, Joly and Rech2013) (Supplementary Table 1).
Once humans abandoned QM12, the surface pavement began to regenerate. All of the artefacts and archaeological features such as pits were covered by eolian deposits, as evidenced by the high percentage of poorly sorted sands but especially fine sands. Clasts from the margins of the site began to move into these human-made swales by gravity, earthquakes, and breakage of larger clasts. Following burial, both clasts and lithic artifacts moved up, probably due to earthquakes (Schröter et al., Reference Schröter, Ulrich, Kreft, Swift and Swinney2006) and salt expansion-contraction (see Owen et al., Reference Owen, Dietrich, Nishiizumi, Chong and Amundson2013). Whatever the cause, upward migration would explain why we find so many tools on the surface versus a larger proportion of smaller flakes within the A horizons. Additionally, flakes tend to be lying flatter than in the middle levels (i.e., Levels 2 and 3). We tested this hypothesis of upward movement by performing a Spearman correlation between the size of lithic artifacts and the archaeological level. Results show a weak but significant negative correlation between thickness and level (−0.194, p < 0.01), and a positive and significant correlation between length-thickness ratio and level (0.236; p <0.01). This relationship explains approximately 20% of the variation in size in our assemblages.
The difference in the salts throughout the profiles in undisturbed T1 compared to the archaeological sites provides further evidence of human disturbance in this area and of post-Pleistocene pavement and soil regeneration. The undisturbed T1 profile shows two thenardite peaks, whereas QM12c and QM12d only have one peak at the bottom (Figs. 5C vs. 5D and 5E). We propose that the absence of the shallower thenardite peak on the archaeological sites could be the result of humans digging into these soils to locate their tent and fireplace. Consequently, after the abandonment of the site, these holes were filled with aeolian sediments during the Holocene, a time so dry that salts have not been significantly remobilized downward again through the profile. A future test to prove that the A horizons at the archaeological sites correspond to renovated desert pavements could be a comparative OSL dating of the sediments in the Av horizons of the undisturbed T1 and those at QM12. OSL dating would also be helpful in understanding the formation process of the undisturbed T1.
In regard to the possibility of later (Mid-to Late Holocene) human occupations, the loose soil on top of T1 could easily have been disturbed by such occupations. Consequently, any major human activity (e.g., walking, cooking, setting a tent) would have eroded the first layer. This means that it would be very improbable that the material at the surface corresponds to an in situ occupation that occurred later than the late Pleistocene occupation. Likewise, at QM12, most of the archaeological material is at the surface, even though the occupational features are deeper. Effective downward vertical migration, as long as there are no cracks and no human disturbance, seems to be minor. This is shown at the natural T1 profile, in which gravel diminishes almost to zero from top to bottom. There, in the lower section of our profiles, salts are concentrated, pushing gravel and artifacts upwards and forming clast-free B horizons. Further evidence for the almost complete abandonment of the site is the virtual absence of cultural material from later periods (Latorre et al., Reference Latorre, Santoro, Ugalde, Gayo, Osorio, Salas-Egaña, De Pol-Holz, Joly and Rech2013).
QM12d, the less intensely occupied location, also shows that lithic artifacts tend to migrate upwards. Deeply buried archaeological deposits are found only where there are ancient excavated features such as a prepared fireplace, or hammered features such as the wooden stakes. This archaeological excavation also demonstrates that cultural material does not usually migrate downwards, even with the presence of the large vertical cracks. Artifacts in QM12d only reach 10–15 cm depth, whereas cracks are as deep as 30 cm. This further supports the hypothesis that lithics, such as the projectile point found on QM12c-NE, on top of the B horizon and lying flat, are still in situ, and that the site was abandoned for a protracted period. The 14C date from the charcoal found at the same level as this projectile point is older (11,965–12,395 cal yr BP; Supplementary Table 1) than the date for the wooden stake (11,395–11,805 cal yr BP; Supplementary Table 1). This, however, makes sense, and explains the intermittent nature of QM12 human occupation: Level 3 was already recovering when humans reoccupied the site, and hammered the stake down to Level 4.
Another factor that demonstrates that QM12d was less intensely occupied and disturbed by Paleoindian groups, when compared to QM12c, is that QM12d preserves two layers of polygons and cracks produced by salt expansion, whereas QM12c-NE only preserves the deeper one. Moreover, at QM12c the area of the prepared fireplace does not preserve any of these cracking layers. This difference in the preservation of salt cracking is likely related to intensity of human occupation: human activity destroys cracks.
The pavement at QM12 itself did regenerate after the site abandonment and the clast coverage is the same as the much older undisturbed pavement of the T1. This observation constrains the regeneration rate of the pavements, which are at most 11,000 cal yrs old (age of QM12), in the hyperarid core of the Atacama. However, the Av at QM12 apparently did not regenerate, suggesting that the surface pavement regenerated faster than Av horizons, perhaps because there was insufficient rain or moisture availability during the Holocene.
Finally, our research demonstrates that the intensity and type of occupation can have different quantitative and qualitative effects on the soil and surface properties of these deposits, which without human intervention remain stable and preserve an accretionary horizon that potentially records the dust influx history of the last 3 million years.
CONCLUSIONS
We show that the extreme and sustained aridity of the Atacama Desert has created two features: (1) unusual desert pavements with very low clast densities (30–37%) and (2) archaeological sites with shallow deposits that disturbed the original, upper structure of the soil and have been affected post human abandonment by the regeneration of the pavements.
We propose that low clast density is a result of the accumulation of soluble salts, which promotes extreme clasts breakdown, inhibiting the formation of an interlocking surface. This is also the reason why a continuous and strongly developed Av horizon never formed, as finer sediment particles cannot be trapped without an interlocking structure. Another reason for the minimal expression of Av horizons is the lack of rain (McFadden et al., Reference McFadden, McDonald, Wells, Anderson, Quade and Forman1998). Experiments show that vesicular structures need wetting cycles (Dietze et al., Reference Dietze, Bartel, Lindner and Kleber2012) that exceed the precipitation events that marked the core of the Atacama throughout the Holocene. However, the formation of a platy structure on the T1 likely speaks of an older Av horizon that has been flattened (McFadden et al., Reference McFadden, McDonald, Wells, Anderson, Quade and Forman1998). We hypothesize that this older Av formed when rare precipitation events were larger in the Atacama during the Pliocene and early Pleistocene (Ewing et al., Reference Ewing, Sutter, Owen, Nishiizumi, Sharp, Cliff, Perry, Dietrich, McKay and Amundson2006; Amundson et al., Reference Amundson, Dietrich, Bellugi, Ewing, Nishiizumi, Chong and Owen2012). In the future this idea can be tested with OSL dating.
We propose that humans differentially disturbed the surface of the T1. The more intense the occupation, the thicker archaeological deposits and the greater the disruption of the Av horizon reaching down to the Byzm. We estimate that depending on size, artifacts in these deposits have differentially remained in situ or migrated upwards. Migration upwards results in a mixture of artifacts in association with highly weathered clasts, which were part of the original pavement. In contrast, the less intensely occupied sector of the site has very shallow deposits and does not present in situ buried features.
Based on a comparison of various desert pavements in the world, we propose that pavement development has an optimal zone in terms of MAP between 50–250 mm/yr. Above this 250 mm/yr limit, pavements are inhibited by water erosion and bioturbation. Below the 50 mm/yr limit, salt weathering rapidly destroys surface clasts. Considering the precipitation budgets at different elevations in the Atacama, we could find the best developed pavements between ~3000 and ~4000 m asl, similar to what Dietze and Kleber (Reference Dietze and Kleber2012) described for the southern fringe of the High Atacama at 4400 m asl.
Our study on desert pavements and associated archaeological sites (QM12 and QM35) provides insights on the uniqueness of the pavements of the Atacama, and on how archaeological sites are heavily influenced by pavement recovery. We conclude that the QM12 Paleoindian site was not reoccupied later during the Holocene, and its cultural palimpsest is isochronous and confined to late Pleistocene Paleoindian occupations.
ACKNOWLEDGMENTS
Funding for this research was provided by CONICYT/PFCHA/Doctorado en el Extranjero/2018-72190243, Fondecyt project 1160744, CONICYT/PCI PII20150081, a School of Anthropology (University of Arizona) intramural grant, and Graduate and Professional Student Council (GPSC) of the University of Arizona travel and research grants. This paper is the result of Paula Ugalde's master's research. Paula Ugalde thanks Steve Kuhn and Mary Stiner for their comments on the master's report, and Amy Schott, Willy Faundes, Gabriela Marcelo, Alonso Maldonado, Héctor Orellana, and Sebastián Jiménez for their help during field work and lab work. We thank Paola Salgado Urrea for crafting Figure 1.
SUPPLEMENTARY MATERIAL
The supplementary material for this article can be found at https://doi.org/10.1017/qua.2020.39


