


INTRODUCTION
The ways in which humans interact with the environment are extremely diverse: from dramatic environmental transformations resulting from human activities to extreme natural events with large impacts on human systems on the other. As environmental changes are expected to affect both the distribution and abundance of organisms (Darlington, Reference Darlington1978), natural factors may condition the spectrum of human adaptive strategies and resilience capacity, which in turn will modify the landscape (Berkes et al., Reference Berkes, Folke and Colding2000; Odling-Smee et al., Reference Odling-Smee, Laland and Feldman2003; Foley et al., Reference Foley, Gronenborn, Andreae, Kadereit, Esper, Scholz and Crutzen2013).
Looking at the past, there are several cases in which environmental processes triggered changes in human mobility patterns (e.g., Holdaway and Porch, Reference Holdaway and Porch1995; Holdaway et al., Reference Holdaway, Fanning, Jones and Shiner2002, Reference Holdaway, Fanning, Rhodes, Marx, Floyd and Douglass2010; Grosjean et al., Reference Grosjean, Santoro, Thompson, Nuñez, Stander, Anderson, Maasch and Sandweiss2007; Morales et al., Reference Morales, Barberena, Belardi, Borrero, Cortegoso, Durán, Guierci, Goñi, Neme, Yacobaccio and Zárate2009; Méndez et al., Reference Méndez, Gil, Neme, Nuevo Delaunay, Cortegoso, Huidobro, Durán and Maldonado2014; Durán et al., Reference Durán, Winocur, Stern, Garvey, Barberena, Peña Monné and Benítez2016), food consumption (e.g., Turney and Hobbs, Reference Turney and Hobbs2006; Kinahan, Reference Kinahan2016), long-distance networks (e.g., Jones and Schwitalla, Reference Jones and Schwitalla2008; Mitchell, Reference Mitchell2017), technology (e.g., Grosjean et al., Reference Grosjean, Santoro, Thompson, Nuñez, Stander, Anderson, Maasch and Sandweiss2007; Jones and Schwitalla, Reference Jones and Schwitalla2008), and demographic trends (e.g., Gamble et al., Reference Gamble, Davies, Pettitt, Hazelwood and Richards2005; Smith et al., Reference Smith, Williams, Turney and Cupper2008; Barberena et al., Reference Barberena, Méndez and de Porras2017). Particularly in the Fuegian Archipelago (southernmost South America; Fig. 1), some studies have considered environmental, geographic, ecological, and/or climatic factors to explain past human behavior (e.g., Borrero, Reference Borrero1999, Reference Barberena2008, Reference Borrero2013; Barberena, Reference Barberena, Borrero, Barberena and Dunken2004; Muñoz, Reference Muñoz, Corona-M and Arroyo-Cabrales2007; Borrazzo et al., Reference Borrazzo, Martin, Barberena, Borrero, Borrero and Franco2008; McCulloch and Morello, Reference McCulloch, Morello, Salemme, Santiago, Álvarez, Piana, Vázquez and Mansur2009; Morello et al., Reference Morello, Borrero, Torres, Massone, Arroyo, McCulloch, Calás, Lucero, Martínez, Bahamonde, Salemme, Santiago, Álvarez, Piana, Vázquez and Mansur2009, Reference Morello, Borrero, Massone, Stern, Garcia-Herbst, McCulloch and Arroyo-Kalin2012, Reference Morello, Massone, Martin, McCulloch, Borrero, Arroyo-Kalin, Reyes, Alfonso-Durruty and Christensen2015a; Zangrando et al., Reference Zangrando, Tessone, Vázquez, Salemme, Santiago, Álvarez, Piana, Vázquez and Mansur2009; Coronato et al., Reference Coronato, Fanning, Salemme, Oría, Pickard and Ponce2011; Pallo, Reference Pallo2011, Reference Pallo2017; Fernández, Reference Fernández2013; Prieto et al., Reference Prieto, Stern and Estévez2013; Pallo and Ozán, Reference Pallo and Ozán2014; San Román, Reference San Román and Smith2014; Mansilla et al., Reference Mansilla, McCulloch and Morello2016; Pallo and Borrazzo, Reference Pallo and Borrazzo2016; Fernández et al., Reference Fernández, Ponce, Zangrando, Borromei, Mussotto, Alunni and Vázquez2018). However, systematic contributions discussing human–environmental interactions in the entire Fuegian Archipelago across the Holocene are still scarce.
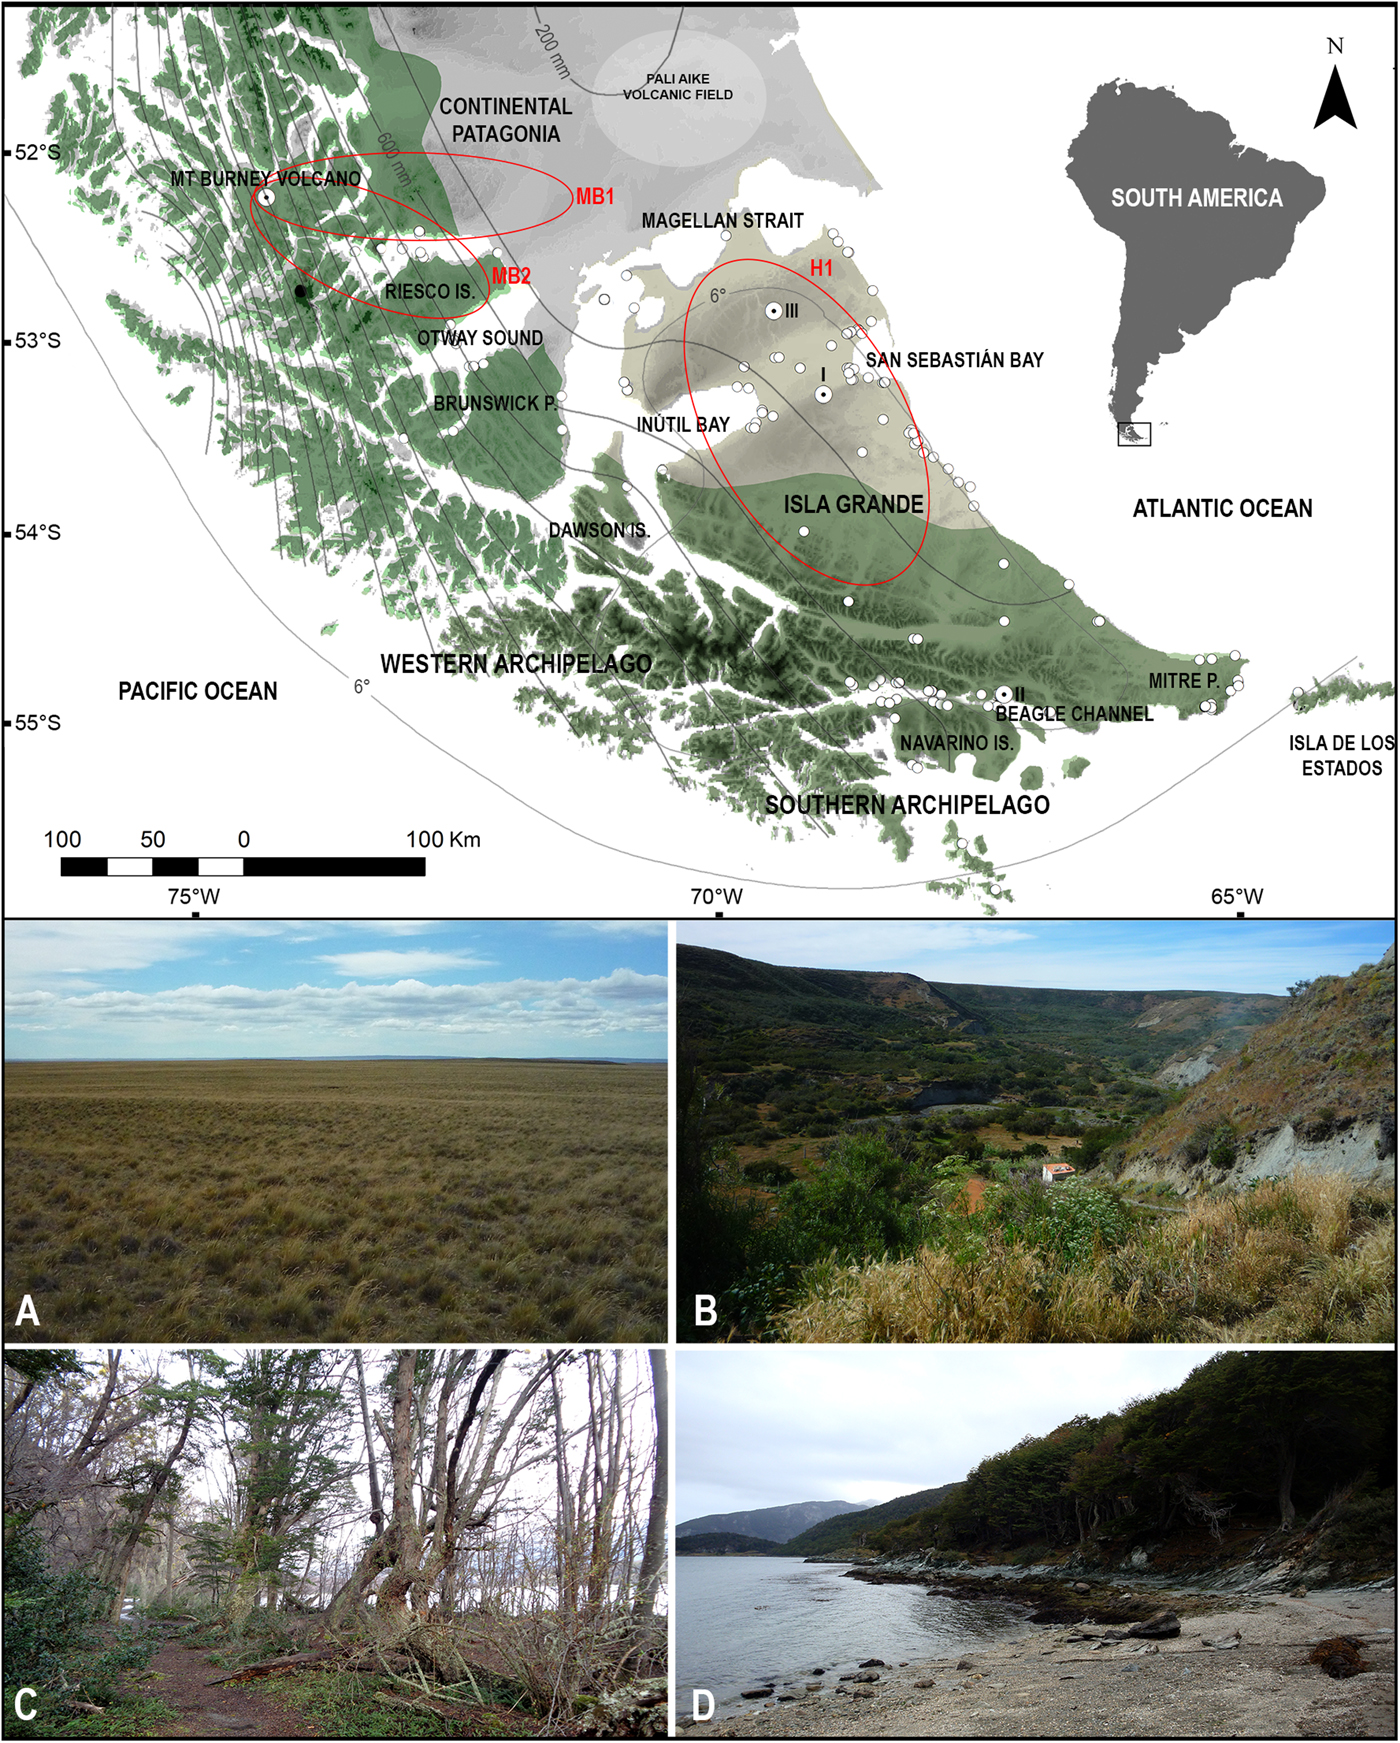
Figure 1. The Fuegian Archipelago showing the two main phytogeographic regions, geographic references mentioned through the text, isohyets and isotherm curves, and the archaeological site distribution (white circles). Red circles are isopatch contours indicating ash deposit thickness of ≥ 10 cm from the Hudson (H1) and Mt. Burney (MB1 and MB2) eruptions (Fontijn et al., Reference Fontijn, Lachowycz, Rawson, Pyle, Mather, Naranjo and Moreno-Roa2014, and references therein). I, Tres Arroyos site; II, Imiwaia site I; III, Chorrillo Miraflores raw material source. (A) Steppe; (B) ecotone; and (C and D) evergreen forest (photos courtesy of L. Diaz Balocchi). (For interpretation of the references to color in this figure legend, the reader is referred to the web version of this article.)
Based on a biogeographic perspective (e.g., Yellen, Reference Yellen1977; Veth, Reference Veth1993; Whittaker, Reference Whittaker1998), the present work aims to discuss possible relationships between human behavioral changes and environmental deterioration for the last 13,000 cal yr BP in the Fuegian Archipelago at southern end of South America (Fig. 1). For this purpose, high-resolution paleoenvironmental data, calibrated radiocarbon dates from archaeological sites, and time-block spatial analysis are put together to assess whether some shifts in human trends can be related to environmental deterioration phenomena.
It is expected that, at extreme latitudes, ecological consequences caused by cooling episodes, arid pulses, and/or volcanic eruptions might have impacted hunter-gatherer decisions in the past. The temporal decrease of abundance and diversity of resources, along with their spatial fragmentation arising from these environmental changes, might trigger risk-buffer strategies in human populations. Here, the use of “risk” means unpredictable environmental variations (in time and space) that influence getting enough food to support the (relative) need of a given population (e.g., Halstead and O'Shea, Reference Halstead and O'Shea1989; Casdam, Reference Casdam1990; Bousman, Reference Bousman1993:64). In this sense, risk-buffer strategies refer to behaviors that tend to minimize such risk (Bousman, Reference Bousman1993; Veth, Reference Veth1993, and references in them). The increase in mobility, the incorporation or abandonment of certain ecological patches, the exploitation of more predictable resources, and the expansion of network systems are examples of past risk-buffer strategies interpreted through the archaeological record (e.g., Rautman, Reference Rautman1993; Bousman, Reference Bousman2005; Jones and Schwitalla, Reference Jones and Schwitalla2008; Veth, Reference Veth, Veth, Smith and Hiscock2005; Grosjean et al., Reference Grosjean, Santoro, Thompson, Nuñez, Stander, Anderson, Maasch and Sandweiss2007; Mitchell, Reference Mitchell2017).
The study area
The Fuegian Archipelago, located at the southernmost extreme of South America—Chile and Argentina (between 52°20′ and 55°10′S and 72°30′ and 64°20′W)—comprises Isla Grande de Tierra del Fuego and several western and southern smaller islands connected by a complex network of channels (Fig. 1). The Fuegian Archipelago was peopled by highly mobile hunter-gatherers (Borrero, Reference Borrero1994/5), when Isla Grande was still part of continental Patagonia before ca. 9200 cal yr BP (McCulloch et al., Reference McCulloch, Clapperton, Rabassa, Currant, Mc Ewan, Borrero and Prieto1997; McCulloch and Davies, Reference McCulloch and Davies2001). Evidence of first occupation was found on the northern steppe around 12,500 cal yr BP, at the Tres Arroyos site (Fig. 1), though with a significant temporal gap until the mid-Holocene (Massone, Reference Massone2004; Morello et al., Reference Morello, Borrero, Massone, Stern, Garcia-Herbst, McCulloch and Arroyo-Kalin2012). The first populations were terrestrial hunter-gatherers who mainly consumed Lama guanicoe (guanaco) and smaller mammals, with a supplementary use of maritime resources, such as marine birds, mollusks, fish, marine mammals, and cetaceans (Massone, Reference Massone2004; Borrero, Reference Barberena2008). Deeper archaeological deposits at the Tres Arroyos site are also associated with extinct fauna (Massone, Reference Massone2004), though its effective consumption by humans is controversial (Borrero, Reference Borrero2003; Borrero and Martin, Reference Borrero and Martin2012).
The first archaeological occupation in the southern Isla Grande was recorded at the Imiwaia I site, at ca. 8600 cal yr BP, in a terrestrial hunter-gatherer context (Fig. 1; Piana et al., Reference Piana, Zangrando and Orquera2012). Later maritime adaptations (after ca. 7300 cal yr BP) were explained by either the arrival of maritime people from the north or by a specialization of local terrestrial hunter-gatherers (e.g., Orquera et al., Reference Orquera, Legoupil and Piana2011; San Román, Reference San Román and Smith2014). Marine hunter-gatherers from the Beagle Channel focused their subsistence and technology on sea mammals and mollusks, despite consuming a variable proportion of terrestrial resources (Orquera and Piana, Reference Orquera and Piana1999; Zangrando, Reference Zangrando2009). Their way of life was probably similar to that known for inhabitants of the southwestern archipelago, whose archaeological background also points to a subsistence mainly based on marine resources and the use of watercraft (e.g., Legoupil et al., Reference Legoupil, Christensen and Morello2011; San Román et al., Reference San Román, Reyes, Torres, Morello and Bjerck2015).
The intensity of human occupation increases in the late Holocene for the whole study area. A broad distribution of certain technological items (e.g., microlithic projectile points) and raw materials (e.g., exotic obsidian from the southwestern archipelago and the Miraflores tuff and silicified tuff) across the entire Fuegian Archipelago and southern coasts of continental Patagonia also provide evidence of increasing interaction between terrestrial and maritime populations by the late Holocene (e.g., Álvarez, Reference Álvarez, Salemme, Santiago, Álvarez, Piana, Vázquez and Mansur2009; Borrazzo et al., Reference Borrazzo, Morello, Borrero, D'Orazio, Etchichury, Massone and De Ángelis2015, Reference Borrazzo, Borrero and Pallo2019; Morello et al., Reference Morello, Borrero, Massone, Stern, Garcia-Herbst, McCulloch and Arroyo-Kalin2012, Reference Morello, Stern and San Román2015b; Pallo and Borrazzo, Reference Pallo and Borrazzo2016). By this time, the consumption of guanaco increases in the northern steppe (Santiago, Reference Santiago2013), while processes of subsistence intensification are described in the southern area (Álvarez, Reference Álvarez, Salemme, Santiago, Álvarez, Piana, Vázquez and Mansur2009; Tívoli, Reference Tívoli2010; Zangrando, Reference Zangrando2009).
When the first Europeans arrived in AD 1520 (Guisinde, Reference Guisinde1982), four human ethnographic groups were described: the Selk´nam (terrestrial hunter-gatherers of northern and central Isla Grande), the Káweskar (maritime hunter-gatherers from the western archipelago), the Yámana (maritime hunter-gatherers from southern coasts of Isla Grande and smaller archipelagos), and the Haush (a small group inhabiting the southeastern sector of Isla Grande) (Yesner et al., Reference Yesner, Figuerero Torres, Guichón and Borrero2003). Despite the ethnographic distinction, several lines of archaeological evidence indicate a lack of sharp differences among these populations through time (e.g., Yesner et al., Reference Yesner, Figuerero Torres, Guichón and Borrero2003; Barberena, Reference Barberena, Borrero, Barberena and Dunken2004; Borrero et al., Reference Borrero, Martin, Barberena, Whallon, Lovis and Hitchcock2011; Tívoli and Zangrando, Reference Tívoli and Zangrando2011; Suby et al., Reference Suby, Luna, Aranda and Flensborg2017).
Environment and climate of the Fuegian Archipelago
The study area comprises two main phytogeographic regions: the northern semiarid steppe plains and the southern humid mixed/evergreen Nothofagus forest (Fig. 1). The ecotone between them consists of deciduous Nothofagus forest mixed with steppe communities (Tuhkanen et al., Reference Tuhkanen, Kuokka, Hyvoenen, Streenroos and Niermelä1989/90). These ecological differences are a direct consequence of a remarkable precipitation gradient from southwest to northeast that varies from more than 3000 mm in the southwest to less than 300 mm in the northeast. Further geographic features distinguish both ecosystems, such as a flatter relief (with a maximum height of 400 m above sea level [m asl]) and a scarcity of permanent water sources in northern steppes versus the presence of the Fuegian Cordillera (with heights up to 2500 m asl) and large bodies of water in the southwestern region (Coronato, Reference Coronato, Oría and Tívoli2014).
The mean annual temperature in the Fuegian Archipelago is about 5°C to 7°C, whereas the mean maximum and minimum temperatures are about 11°C to 15°C and −0.2°C to −1.4°C, respectively (Garreaud et al., Reference Garreaud, Vuille, Compagnucci and Marengoaud2009). Strong southern westerlies during austral summer, with a mean of ~70 km/h and gusts over 180 km/h (particularly in the northern steppes), and a high oceanic influence that dampens annual differences between seasons characterize the Fuegian climate. Along with the Andean range and the Southern Annular Mode (e.g., Coronato and Bisigato, Reference Coronato and Bisigato1998; Ariztegui et al., Reference Ariztegui, Anselmetti, Gilli and Waldmann2008; Villalba et al., Reference Villalba, Lara, Masiokas, Urrutia, Luckman, Marshall and Mundo2012), westerlies have a strong influence on the regional precipitation regime (e.g., Ariztegui et al., Reference Ariztegui, Anselmetti, Gilli and Waldmann2008; Moreno et al., Reference Moreno, Vilanova, Villa-Martínez, Garreaud, Rojas and De Pol-Holz2014).
In the last three decades, several Holocene paleoclimatic studies have been carried out in the region, using a variety of proxy data (e.g., palynomorphs, diatoms, fungi, charcoal, ostracods, chironomids, sediments, magnetic properties, geochemical data, isotopes) in many different sedimentary contexts (e.g., lakes, mires, peat bogs, glacial deposits, paleosols). Resulting reconstructions have often provided conflicting models due to: (1) methodological issues (e.g., dating inaccuracies, differences among climatic model reconstructions, depth models, laboratory procedures, among others); (2) timing, sensitivity, spatial representativeness, and taphonomic differences among proxies; (3) ambiguities in data interpretation; and (4) intrinsic differences between continuous and discontinuous records (Dincauze, Reference Dincauze2000; Grosjean et al. Reference Grosjean, Cartajena, Geyh and Nuñez2003; Zolitschka et al., Reference Zolitschka, Anselmetti, Ariztegui, Corbella, Francus, Lücke, Maidana, Ohlendorf, Schäbitz and Wastegård2013). The high climatic and environmental variability of the Fuegian Archipelago, particularly during the late Holocene (Haberzettl et al., Reference Haberzettl, Fey, Lucke, Maidana, Mayr, Ohlendorf, Schäbitz, Schleser, Wille and Zolitschka2005; Coronato et al., Reference Coronato, Fanning, Salemme, Oría, Pickard and Ponce2011; Orgeira et al., Reference Orgeira, Vásquez, Coronato, Ponce, Moreto, Osterrieth, Egli and Onorato2012; Irurzun et al., Reference Irurzun, Gogorza, Sinito, Chaparro, Prieto, Laprida, Lirio, Navas and Nuñez2014; Borromei et al., Reference Borromei, Candelb, Musotto, Cusminsky, Martínez, Coviaga, Ponceb and Coronato2018), has also posed a challenge to providing representative paleoclimatic syntheses. Likewise, the quantification of the magnitude of climatic phenomena is not straightforward (Hahn et al., Reference Hahn, Kliem, Ohlendorf, Zolitschka and Rosén2014), creating further complications.
Therefore, to reduce discrepancies among local studies, the present paleoclimatic summary only takes into account: (1) high-resolution temporal data (i.e., research focused on lakes, mires, or peat bogs); (2) multiproxy approaches; and (3) interpretations concerning only relative variations in humidity and temperature. The two main ecosystems of the Fuegian Archipelago (i.e., the forest and the steppe ecotone) are treated separately, due to noticeable differences regarding annual precipitation, ecology, geographic features, and archaeological evidence.
Holocene paleoclimatic reconstructions
The late Pleistocene deglaciation process in the Fuegian Archipelago was characterized by pulses and reversals (McCulloch et al., Reference McCulloch, Clapperton, Rabassa, Currant, Mc Ewan, Borrero and Prieto1997; Rabassa et al., Reference Rabassa, Coronato, Bujalesky, Salemme, Roig, Meglioli and Heusse2000; Bentley et al., Reference Bentley, Sugden, Hulton and McCulloch2005; Coronato et al., Reference Coronato, Coronato, Mazzoni, Vázquez and Rabassa2008), until glaciers retreated into the Fuegian Andes around 18,000 cal yr BP (with some chronological differences, depending on the author; e.g., McCulloch et al., Reference McCulloch, Bentley, Tipping and Clapperton2005; Kaplan et al., Reference Kaplan, Fogwill, Sugden, Hulton, Kubik and Freeman2008; Coronato et al., Reference Coronato, Seppala, Ponce and Rabassa2009; Hall et al., Reference Hall, Porter, Denton, Lowell and Bromley2013; Musotto et al., Reference Musotto, Borromei, Coronato, Menounos, Osborn and Marr2016). Broadly, paleoecological evidence indicates relatively warm and moister conditions during the Holocene (e.g., Heusser, Reference Heusser1993; Ariztegui et al., Reference Ariztegui, Anselmetti, Gilli and Waldmann2008; Zolitschka et al., Reference Zolitschka, Anselmetti, Ariztegui, Corbella, Francus, Lücke, Maidana, Ohlendorf, Schäbitz and Wastegård2013). Within this general trend, the early and mid-Holocene of the northern steppes show some relative cooling phases around 10,300 and 8500 cal yr BP (Irurzun et al., Reference Irurzun, Gogorza, Sinito, Chaparro, Prieto, Laprida, Lirio, Navas and Nuñez2014); and arid periods around 13,500–11,500 cal yr BP (Haberzettl et al., Reference Haberzettl, Corbella, Fey, Janssen, Lücke, Mayr and Ohlendorf2007; Wille et al., Reference Wille, Maidana, Schäbitz, Fey, Haberzettl, Janssen and Lücke2007; Hahn et al., Reference Hahn, Kliem, Ohlendorf, Zolitschka and Rosén2013); 9700–7000 cal yr BP (Mancini et al., Reference Mancini, Paez, Prieto, Stutz, Tonello and Vilanova2005; Haberzettl et al., Reference Haberzettl, Corbella, Fey, Janssen, Lücke, Mayr and Ohlendorf2007; Wille et al., Reference Wille, Maidana, Schäbitz, Fey, Haberzettl, Janssen and Lücke2007; Anselmetti et al., Reference Anselmetti, Ariztegui, Batist, Gebhardt, Haberzettl, Niessen, Ohlendorf and Zolitschka2009; Hahn et al., Reference Hahn, Kliem, Ohlendorf, Zolitschka and Rosén2013, Reference Hahn, Kliem, Ohlendorf, Zolitschka and Rosén2014; Jouve et al., Reference Jouve, Francus, Lamoureux, Provencher-Nolet, Hahn, Haberzettl, Fortin and Nuttin2013; Kilem et al., Reference Kliem, Buylaert, Hahn, Mayr, Ohlendorf, Wastegård and Zolitschka2013; Massaferro et al., Reference Massaferro, Recasens, Larocque-Tobler and Maidana2013; Zolitschka et al., Reference Zolitschka, Anselmetti, Ariztegui, Corbella, Francus, Lücke, Maidana, Ohlendorf, Schäbitz and Wastegård2013; Irurzun et al., Reference Irurzun, Gogorza, Sinito, Chaparro, Prieto, Laprida, Lirio, Navas and Nuñez2014); and 8500 cal yr BP (Irurzun et al., Reference Irurzun, Gogorza, Sinito, Chaparro, Prieto, Laprida, Lirio, Navas and Nuñez2014). Arid pulses beginning ca. 12,200 cal yr BP (McCulloch and Davies, Reference McCulloch and Davies2001), 9300 cal yr BP (Zolitschka et al., Reference Zolitschka, Anselmetti, Ariztegui, Corbella, Francus, Lücke, Maidana, Ohlendorf, Schäbitz and Wastegård2013), and ca. 7400 cal yr BP (Haberzettl et al., Reference Haberzettl, Anselmetti, Bowen, Fey, Mayr, Zolitschka and Ariztegui2009; Hahn et al., Reference Hahn, Kliem, Ohlendorf, Zolitschka and Rosén2014) were considered to be of relatively high magnitude.
A high climatic variability characterized the late Holocene northern steppes (Haberzettl et al., Reference Haberzettl, Corbella, Fey, Janssen, Lücke, Mayr and Ohlendorf2007, Reference Haberzettl, Anselmetti, Bowen, Fey, Mayr, Zolitschka and Ariztegui2009; Coronato et al., Reference Coronato, Fanning, Salemme, Oría, Pickard and Ponce2011; Orgeira et al., Reference Orgeira, Vásquez, Coronato, Ponce, Moreto, Osterrieth, Egli and Onorato2012; Hahn et al., Reference Hahn, Kliem, Ohlendorf, Zolitschka and Rosén2014; Irurzun et al., Reference Irurzun, Gogorza, Sinito, Chaparro, Prieto, Laprida, Lirio, Navas and Nuñez2014; Borromei et al., Reference Borromei, Candelb, Musotto, Cusminsky, Martínez, Coviaga, Ponceb and Coronato2018), with at least seven dry–wet phases registered for the last 4200 cal yr BP (Borromei et al., Reference Borromei, Candelb, Musotto, Cusminsky, Martínez, Coviaga, Ponceb and Coronato2018). The moister phase at ca. 1000–700 cal yr BP and the following severe dry episode at ca. 500–200 cal yr BP were associated with the Medieval Warm Period (MCA) and the Little Ice Age (LIA), respectively (Stine, Reference Stine1994). However, these two events registered an opposite signal in the Potrok Aike lake record, located further north (Fig. 1; Haberzettl et al., Reference Haberzettl, Fey, Lucke, Maidana, Mayr, Ohlendorf, Schäbitz, Schleser, Wille and Zolitschka2005, Reference Haberzettl, Anselmetti, Bowen, Fey, Mayr, Zolitschka and Ariztegui2009; Hahn et al., Reference Hahn, Kliem, Ohlendorf, Zolitschka and Rosén2014; Schäbitz et al., Reference Schäbitz, Wille, Francois, Haberzettl, Quintana, Mayr and Lück2013).
Paleoclimatic reconstructions of the Fuegian Archipelago southern forest show some differences compared with the northern steppe, as the former seems to have experienced only a few arid pulses across the Holocene and a lower late Holocene climatic variability. Instead, several relatively moister episodes characterized the middle Holocene of the southern forest, particularly around 8500 cal yr BP (Unkel et al., Reference Unkel, Fernandez, Björck, Kjung and Wolfarth2010; Fernández, Reference Fernández2013), 8000 cal yr BP (Waldmann et al., Reference Waldmann, Ariztegui, Anselmetti, Austin, Moy, Stern, Recasens and Dunbar2010, Reference Waldmann, Borromei, Recacens, Olivera, Martinez, Maidana, Ariztegui, Austin, Anselmetti and Moy2014; Moy et al., Reference Moy, Dunbar, Guilderson, Waldmann, Mucciarone, Recasens, Ariztegui, Austin and Anselmetti2011), 7200 cal yr BP (Björck et al., Reference Björck, Rundgren, Ljung, Unkel and Wallin2012), 6000 cal yr BP (Unkel et al., Reference Unkel, Fernandez, Björck, Kjung and Wolfarth2010; Fernández, Reference Fernández2013), ca. 5000 cal yr BP (Unkel et al., Reference Unkel, Fernandez, Björck, Kjung and Wolfarth2010; Fernández, Reference Fernández2013; Mansilla et al., Reference Mansilla, McCulloch and Morello2016), and 4500 cal yr BP (Björck et al., Reference Björck, Rundgren, Ljung, Unkel and Wallin2012). On the other hand, some relative cooling episodes, also known as “neoglaciations,” are suggested around 5500 cal yr BP (Ponce et al., Reference Ponce, Borromei, Rabassa and Martinez2011; Menounos et al., Reference Menounos, Clague, Osborn, Davis, Ponce, Goehring, Maurer, Rabassa, Coronato and Marr2013), between ca. 5000 and 2200 cal yr BP (Unkel et al., Reference Unkel, Fernandez, Björck, Kjung and Wolfarth2010; Fernández, Reference Fernández2013; Mansilla et al., Reference Mansilla, McCulloch and Morello2016), and after ca. 600 cal yr BP (Kuylenstierna et al., Reference Kuylenstierna, Rosqvist and Holmlund1996; Koch and Killian, Reference Koch and Kilian2005; Aravena, Reference Aravena2007; Strelin et al., Reference Strelin, Casassa, Rosqvist and Holmlund2008). The MCA and LIA global phenomena had an even more ambiguous expression in the southern Fuegian Archipelago, though some authors found conspicuous signatures of the MCA at ca. 1000–500 cal yr BP (Mauquoy et al., Reference Mauquoy, Blaauw, van Geel, Borromei, Quattocchio, Chambers and Possnert2004; Waldmann et al., Reference Waldmann, Ariztegui, Anselmetti, Austin, Moy, Stern, Recasens and Dunbar2010; Ponce et al., Reference Ponce, Borromei, Rabassa and Martinez2011) and the LIA at ca. 700–200 cal yr BP (Strelin et al., Reference Strelin, Casassa, Rosqvist and Holmlund2008; Borromei et al., Reference Borromei, Coronato, Franzén, Ponce, López Sáez, Maidana, Rabassa and Candel2010; Ponce et al., Reference Ponce, Borromei, Rabassa and Martinez2011, Reference Ponce, Borromei, Menounos and Rabassa2017; Menounos et al., Reference Menounos, Clague, Osborn, Davis, Ponce, Goehring, Maurer, Rabassa, Coronato and Marr2013; Musotto et al., Reference Musotto, Borromei, Coronato, Menounos, Osborn and Marr2016).
Other remarkable environmental processes took place in the Fuegian Archipelago during the Holocene, such as a marine transgression that reached its maximum at ca. 7420–7340 cal yr BP (calibrated after McCulloch and Davies, Reference McCulloch and Davies2001) or at ca. 8300–6000 cal yr BP in southern areas (Candel et al., Reference Candel, Borromei and Louwye2018), causing massive geomorphological and ecological transformations. Additionally, important volcanic eruptions impacted the Fuegian ecosystems during the Holocene (Fig. 1; Stern, Reference Stern2008), including the first Monte Burney volcano eruption (MB1, 52°19′S, ca. 9350–8990 cal yr BP or ca. 8975–8380 cal yr BP; after Haberzettl et al., Reference Haberzettl, Corbella, Fey, Janssen, Lücke, Mayr and Ohlendorf2007); the Hudson volcano eruption (H1, 45°54′S, ca. 7960–7430 cal yr BP); the second Monte Burney volcano eruption (MB2, ca. 4375–4135 cal yr BP); and the Aguilera volcano eruption (A1, 50°20′S, ca. 3370–2860 cal yr BP) (Kilian et al., Reference Kilian, Hohner, Biester, Wallrabe-Adams and Stern2003; calibrated ages from Stern, Reference Stern2008, and references therein). Consequences of these major eruptions seemed to last for years, decades, and even centuries, comprising temporary burials of soils and shallow-water sources, ash storms, and soil acidification in humid areas (Kilian et al., Reference Kilian, Biester, Behrmann, Baeza, Fesq-Martin, Hohner, Schimpf, Friedmann and Mangini2006; Stern, Reference Stern2008; Wilson et al., Reference Wilson, Cole, Stewart, Cronin and Johnston2011; Fontijn et al., Reference Fontijn, Lachowycz, Rawson, Pyle, Mather, Naranjo and Moreno-Roa2014).
METHODOLOGY
Human occupations were represented as summed probability distributions of calibrated radiocarbon archaeological dates and were also evaluated by spatiotemporal analyses. Radiocarbon calibrated dates were taken as the analytic unit and considered as human occupation events (e.g., Rick, Reference Rick1987; Gamble et al., Reference Gamble, Davies, Pettitt, Hazelwood and Richards2005; Surovell and Brantingham, Reference Surovell and Brantingham2007; Smith et al., Reference Smith, Williams, Turney and Cupper2008; Holdaway et al., Reference Holdaway, Fanning, Rhodes, Marx, Floyd and Douglass2010; Williams, Reference Williams2012; Méndez et al., Reference Méndez, Gil, Neme, Nuevo Delaunay, Cortegoso, Huidobro, Durán and Maldonado2014; Attenbrow and Hiscock, Reference Attenbrow and Hiscock2015; Williams et al., Reference Williams, Veth, Steffen, Ulm, Turney, Reeves, Phipps and Smith2015; Pérez et al., Reference Pérez, Gonzalez and Bernal2016; Barberena et al., Reference Barberena, Méndez and de Porras2017). The use of “dates as data” allows for comparing large data sets and can be considered as a heuristic tool to formulate biogeographic and archaeological hypotheses. Nevertheless, there is already consensus about the limitations of this approach due to taphonomic issues, sample size requirements, sampling criteria, spatial cover heterogeneity, problems associated with the calibration curve, and archaeological visibility, among others (Surovell et al., Reference Surovell, Byrd Finley, Smith, Brantingham and Kelly2009; Prates et al., Reference Prates, Politis and Steele2013; William, Reference Williams2012, Reference Williams2013; Williams et al., Reference Williams, Veth, Steffen, Ulm, Turney, Reeves, Phipps and Smith2015). The behavioral meaning of frequencies (demography, mobility, and/or the intensity of human occupation) also comprises an equifinality problem (Torfing, Reference Torfing2015; Williams et al., Reference Williams, Veth, Steffen, Ulm, Turney, Reeves, Phipps and Smith2015), so other lines of evidences are required to cross-check the interpretations (Williams, Reference Williams2012).
Radiocarbon dates come from surface and buried archaeological settings (Fig. 1; Supplementary Table 1) mainly located in open-air contexts (only 13 sites out of 132 are placed in rock shelters) and coastal areas. Even though the abundance of archaeological loci placed along the coast could be an effect of archaeological visibility, a careful research agenda in the inland was carried out as well (e.g., Massone et al., Reference Massone, Jackson and Prieto1993; Borrero et al., Reference Borrero, Martin, Horwitz, Franco, Favier Dubois, Carballo Marina, Belardi, Cruz, Caracotche, Senatore and Ladrón de Guevara2008; Borrazzo, Reference Borrazzo, Salemme, Santiago, Álvarez, Piana, Vázquez and Mansur2009; Santiago, Reference Santiago2013; Oría et al., Reference Oría, Salemme and Fernández2014). Because these surveys showed low frequencies and diversity of archaeological evidence (interpreted as a consequence of ephemeral human occupations), the archaeological spatial distribution could thus be associated with past human behavior. In contrast, the high density and diversity of the archaeological record found along the coast further reinforced the interpretation of human occupation nodes of littoral places, also supported by the ecological structure of these areas, with their high density and richness of resources (e.g., Borella, Reference Borella2004; Massone and Morello, Reference Massone, Morello, Morello, Martinic, Prieto and Bahamonde2007; Pallo, Reference Pallo2017).
Calibrations were run in Oxcal v. 4.3.2. (Bronk Ramsey, Reference Bronk Ramsey2009), using ShCal 13 and Marine 13 curves at the 2σ confidence level before present (Hogg et al., Reference Hogg, Hua, Blackwell, Niu, Buck, Guilderson and Heaton2013; Reimer et al., Reference Reimer, Bard, Bayliss, Beck, Blackwell, Bronk Ramsey and Buck2013). A standard reservoir effect of 400 years was applied by default. Some radiocarbon dates were rejected due to: (1) uncertainties higher than 50%; (2) limited/ambiguous contextual information; and (3) dates overlapping (statistically indistinguishable) at the site scale. In the last case, less reliable materials for dating (such as soil, marine animals, wood, or roots) or dates with higher uncertainties were removed, rather than using the “Combine” algorithm. These analytical criteria also minimize the oversampling effect of archaeological contexts with intense research programs. Data were organized by summed probability distributions (Oxcal v. 4.3.2.), and a taphonomic equation was applied in 200 year–range histograms (following Williams, Reference Williams2013):
 $$n_c = n_a/{\rm }\left[ {2.107{\rm } \times {\rm }{10}^7{\left( {t + {\rm }2754} \right)}^{ - 1.526}} \right]$$
From a total of 158 dates in the steppe/ecotone database (56 archaeological localities), 106 and 114 dates were processed for summed probability distribution and histograms, respectively. Dates reported as “modern” were not computed in summed probability distributions due to the lack of numerical data. In addition, 193 and 194 out of 279 dates in the forest database (76 archaeological localities) were processed for summed probability distribution and histograms, respectively (Supplementary Table 1). As the minimum number of dates recommended for the procedure (Williams, Reference Williams2012) is higher than the one presented here, summed probability plots should be treated as preliminary. Each significant peak or smooth area of summed probability distributions was compared with the ShCal 13 curve (Hogg et al., Reference Hogg, Hua, Blackwell, Niu, Buck, Guilderson and Heaton2013) to discard false trends caused by “calendar-age steps” or “radiocarbon-age plateaus” (e.g., Michczynski and Michczynska, Reference Michczynski and Michczynska2006; Williams, Reference Williams2012).
Spatial analysis was carried out by organizing georeferenced calibrated dates in 1000-year temporal blocks (using the calibrated range mean value) in ArcGIS 10 (ESRI). Temporal blocks with few occupation events (<5) were not considered for the analysis. To describe the arrangement, intensity, and range of the spatial point pattern of each temporal block (Diggle, Reference Diggle2003), the Ripley's K analysis was applied (Ripley, Reference Ripley1979, Reference Ripley1981). Ripley's K function is a tool for analyzing completely mapped spatial point process data in a predefined study area, that is, data in the location of occupation events. The main capacity of this tool is to describe characteristics of the point processes at many distance scales (Dixon, Reference Dixon, El-Shaarawi and Piegorsch2002).
The multiscalar dispersion estimation comprises the average point density calculated as a function of linear distance from every point. The Ripley's K(d) function iteratively measures the frequency of appearance of the point process in an n number of radii with regular and permanent growth around all its compositional points. The estimated value is compared with a null hypothesis, which states that data respond to a homogenous Poisson distribution, so a clustered or dispersed point pattern arises by contrast. Therefore, the index that is calculated from the K function is the value of the deviation from randomness. If the estimated value is lower than the confidence threshold for the randomness hypothesis, a dispersed distribution between points is inferred. In contrast, if the value is higher than the threshold, a clustered distribution is interpreted. Finally, if the estimated value is within the confidence threshold for the randomness hypothesis, then the distribution will be random (Ripley, Reference Ripley1979, Reference Ripley1981; Cressie, Reference Cressie1991). Here, the L(d) function is used, which corresponds to a transformation of K(d) into a linear function to stabilize the variance (Dixon, Reference Dixon, El-Shaarawi and Piegorsch2002). With the L(d) transformation, the expected K(d) value is equal to the distance. To guarantee the statistical confidence interval for a random distribution, a 95% confidence interval of complete spatial randomness (at any scale) was estimated using 1000 Monte Carlo simulations within the smallest bounding polygon for forest and steppe/ecotone (Hammer, Reference Hammer1999–2017).
A kernel density estimation analysis (KDE) was also carried out. KDE is a nonparametric tool that relates the similar values of the distribution in different locations through isolines or color scales, giving a quick and complete view on point process distribution (Baxter et al., Reference Baxter, Beardah and Wright1997). Broadly, the spatial structure in KDE is quantified by a contingency table or grid generated with the coordinates of the data points, in which the empirical value of each cell is compared with an expected numerical value in that cell, according to the number of points contained in each of the neighboring cells (Baxter and Beardah, Reference Baxter, Beardah, Huggett and Ryan1995, 1997; Hawkins et al., Reference Hawkins, Stewart and Banning2003). Therefore, KDE is used as a clustering method that provides a smooth point density map that shows data deviation from a null hypothesis of spatial homogeneity (Poisson distribution). Its scale estimates the number of points per area, and thus differs from a probability density (Hammer, Reference Hammer1999–2017). It does not impose any structure on the data and facilitates comparisons by combining many data sets into a single graph (Baxter et al., Reference Baxter, Beardah and Wright1997). Both Ripley's K and KDE spatial tools were run in Paleontological Statistics (PAST v. 3.15) (Hammer, Reference Hammer1999–2017).
RESULTS
The northern steppe/ecotone area
The steppe/ecotone area shows a low and discontinuous human signal during the Pleistocene–Holocene transition and a long archaeological hiatus between ca. 11,200 and 7800 cal yr BP (Fig. 2A). Low frequencies remain until ca. 6800–6700 cal yr BP, when a growth trend is observed, with a major peak at ca. 6300 cal yr BP. This period is not associated with any calendar-age step of the ShCal 13 curve (Williams, Reference Williams2012; Hogg et al., Reference Hogg, Hua, Blackwell, Niu, Buck, Guilderson and Heaton2013), so it is not an effect of the calibration process. Frequencies decrease between ca. 5500 and 5300 cal yr BP and increase moderately afterward, with oscillations until ca. 1500 cal yr BP. A significant increase in human occupations is recorded since ca. 1500–1300 cal yr BP, reaching its maximum between ca. 750 and 500 cal yr BP, and succeeded by a drop at about 1000–750 cal yr BP. Because radiocarbon dates between 1.3 and 1.5 ka are associated with a calendar-age step, this increase could be overestimated by the calibration process. It is worth mentioning that, following the taphonomic curve correction, this peak has a lower magnitude than the ca. 6800–5500 cal yr BP one. After ca. 500 cal yr BP, a substantial decrease in occupation events is observed. In general, calibration curve plateaus do not seem to affect the summed probability distribution.

Figure 2. (A) Summed probability distribution (black area) and occupation events with (red curve) and without (blue curve) taphonomic bias correction for the steppe/ecotone phytogeographic area. Black arrows indicate main changes in the human occupation trend. (B) Spatial analysis (kernel density analysis) from the steppe/ecotone area (see Ripley's K analysis in Supplementary Fig. 1). S, number of archaeological sites; O, number of human occupations. (For interpretation of the references to color in this figure legend, the reader is referred to the web version of this article.)
The spatial organization of archaeological occupations does not reveal any trend for the first millennia, as there are only five occupation events between ca. 12,500 and 7200 cal yr BP. For later occupations, Ripley's K analysis indicates a clustered to random pattern, depending on the spatial scale, between ca. 7 and 4 cal ka BP (Fig. 2B and Supplementary Fig. 1A–C). The 5–4 cal ka BP temporal block (Fig. 2B) can be understood as a transitional trend toward the 4–1 cal ka BP period, where a random pattern is clearly defined. Finally, a significant shift toward a clustered pattern is recorded for the last millennium (Fig. 2B and Supplementary Fig. 1G).
KDE analysis, on the other hand, presents a fuzzy trend over time. High-density spots are located at the Inútil Bay and south of the San Sebastián Bay. Between 7 and 3 cal ka BP, occupations are distributed along a northwest–southeast trend. At 3–2 cal ka BP, the spatial occupation pattern is restricted to the upper north of Isla Grande (Fig. 2B and Supplementary Fig. 1E), while at 2–1 cal ka BP, human occupations reach the largest spatial extent on the northern plains. The same tendency continues in the next temporal block (1–0 cal ka BP), when a more clustered pattern is focused in the San Sebastián Bay area.
The southwestern forest area
The human occupation in the southwestern forest begins at ca. 8600 cal yr BP, but only after ca. 7500–7400 cal yr BP do occupation events increase continuously until ca. 5500 cal yr BP (Fig. 3A). During this period, there is no calendar-age step on the calibration curve (Hogg et al., Reference Hogg, Hua, Blackwell, Niu, Buck, Guilderson and Heaton2013), so the increase is not amplified by the calibration processes. Some minor oscillations are observed between ca. 5500 and 2000 cal yr BP. From ca. 2000–1800 cal yr BP, a remarkable peak in human occupation is registered, with a maximum between ca. 700 and 500 cal yr BP (calendar-age steps around 1.5–1.3 ka and 1.2–0.4 ka could accentuate this increase). Two drops are registered during this increasing trend, at ca. 1700–1500 and ca. 1300–1000 cal yr BP. According to the taphonomic curve correction, the magnitude of the late Holocene peak (2000–500 cal yr BP) is similar to that of the peak seen in the middle Holocene (ca. 7500–5000 cal yr BP).

Figure 3. (A) Summed probability distribution (black area) and occupation events with (red curve) and without (blue curve) taphonomic bias correction for the forest phytogeographic area. Black arrows indicate main shifts in the human occupation trend. (B) Spatial analysis (kernel density analysis) from the forest area (see Ripley's K analysis in Supplementary Fig. 2). S, number of archaeological sites; O, number of human occupations. (For interpretation of the references to color in this figure legend, the reader is referred to the web version of this article.)
Ripley's K analysis indicates that the human occupation pattern mainly follows a clustered trend over time (even more accentuated for the last two millennia), although a slight shift toward a relatively random pattern is observed between 5 and 3 cal ka BP (Fig. 3B and Supplementary Fig. 2D and E). KDE analysis shows that the early Holocene presents high-density occupation spots on the northwest coast of Otway Sound, Brunswick Peninsula, Beagle Channel, and Mitre Peninsula, while the Beagle Channel becomes the focus of human occupation in the last two millennia.
DISCUSSION
The following discussion is organized into broad periods arising from the human occupation curve (Figs. 2A and 3A) along with spatial analysis data to enable discussion of possible relations between changes in human behavior and harsh environmental conditions, such as drier pulses in the northern steppe/ecotone area and cooling episodes and/or volcanic eruptions in the entire Fuegian Archipelago.
The nonlinear model of human land use proposed by Borrero (Reference Borrero1994/5) for southern Patagonia hunter-gatherer groups was used as a framework to discuss the different periods observed in the human occupation curve. The model proposes archaeological expectancies based on how populations inhabit landscapes by gaining ecological and geographic information. Broadly, the “exploration phase” comprises long-range mobility populations arriving in empty lands with low-intensity and discontinuous use of locations (low archaeological visibility). The colonization phase consists of more regular interactions between populations and resources and the re-use of optimal locations (high archaeological visibility and temporal resolution). Finally, the “effective occupation phase” adds higher demography, occasional territoriality, and potential human-resource unbalances to the colonization phase (high archaeological visibility and low temporal resolution/palimpsests).
Steppe/ecotone environment and human populations
First period (ca. 12,600–6800 cal yr BP): low-frequency and discontinuous occupations
During this first period of the human occupation trajectory, understood as the exploration phase (Borrero, Reference Borrero1994/5), three main changes are observed in the curve (Fig. 2A). The first refers to the earliest human evidence for Isla Grande at the Tres Arroyos site at ca. 12,660–12,400 cal yr BP (10.58 ± 0.50 ka; Massone, Reference Massone2004), which might have taken place during the second land-bridge window, defined as being ca. 12,400–9000 cal yr BP (10.314 ± 0.81–8.265 ± 0.65 ka; McCulloch et al., Reference McCulloch, Bentley, Tipping and Clapperton2005; McCulloch and Morello, Reference McCulloch, Morello, Salemme, Santiago, Álvarez, Piana, Vázquez and Mansur2009). This initial peopling is associated with southern steppe populations of continental Patagonia (Borrero Reference Borrero1994/95, Reference Borrero, Silverman and Isbell2008), probably as a result of logistical forays from the Pali Aike volcanic field region (Martin and Borrero, Reference Martin and Borrero2017; Fig. 1) in a warming trend (e.g., McCulloch and Davies, Reference McCulloch and Davies2001; Haberzettl et al., Reference Haberzettl, Corbella, Fey, Janssen, Lücke, Mayr and Ohlendorf2007; Wille et al., Reference Wille, Maidana, Schäbitz, Fey, Haberzettl, Janssen and Lücke2007; Hahn et al., Reference Hahn, Kliem, Ohlendorf, Zolitschka and Rosén2013; Jouve et al., Reference Jouve, Francus, Lamoureux, Provencher-Nolet, Hahn, Haberzettl, Fortin and Nuttin2013; Irurzun et al., Reference Irurzun, Gogorza, Sinito, Chaparro, Prieto, Laprida, Lirio, Navas and Nuñez2014). In this context, available data do not show clear relationships between first human occupations of northern steppes and possible triggers related to harsh environmental conditions.
The second significant change corresponds to the beginning of a 3.4 ka hiatus at ca. 11,200 cal yr BP. Although both dry and extremely dry episodes are described during the hiatus (McCulloch and Davies, Reference McCulloch and Davies2001; Mancini et al., Reference Mancini, Paez, Prieto, Stutz, Tonello and Vilanova2005; Haberzettl et al., Reference Haberzettl, Corbella, Fey, Janssen, Lücke, Mayr and Ohlendorf2007; Wille et al., Reference Wille, Maidana, Schäbitz, Fey, Haberzettl, Janssen and Lücke2007; Anselmetti et al., Reference Anselmetti, Ariztegui, Batist, Gebhardt, Haberzettl, Niessen, Ohlendorf and Zolitschka2009; Hahn et al., Reference Hahn, Kliem, Ohlendorf, Zolitschka and Rosén2013, Reference Hahn, Kliem, Ohlendorf, Zolitschka and Rosén2014; Jouve et al., Reference Jouve, Francus, Lamoureux, Provencher-Nolet, Hahn, Haberzettl, Fortin and Nuttin2013; Kilem et al., Reference Kliem, Buylaert, Hahn, Mayr, Ohlendorf, Wastegård and Zolitschka2013; Massaferro et al., Reference Massaferro, Recasens, Larocque-Tobler and Maidana2013; Zolitschka et al., Reference Zolitschka, Anselmetti, Ariztegui, Corbella, Francus, Lücke, Maidana, Ohlendorf, Schäbitz and Wastegård2013; Irurzun et al., Reference Irurzun, Gogorza, Sinito, Chaparro, Prieto, Laprida, Lirio, Navas and Nuñez2014), as are cooling pulses (Irurzun et al., Reference Irurzun, Gogorza, Sinito, Chaparro, Prieto, Laprida, Lirio, Navas and Nuñez2014; Zhu et al., Reference Zhu, Lu and Zhang2014) and the first Monte Burney volcanic eruption (Stern, Reference Stern2008), the hiatus is too long to support a cause–effect relationship between environmental deterioration and human abandonment. Nevertheless, because paleoenvironmental information shows an early Holocene mainly dominated by arid and cold conditions in an already subhumid and cold area, it could be proposed that more predictable water sources, such as the Potrok Aike lake and rock shelter availability in the Pali Aike volcanic field (Barberena, Reference Barberena2008; Fig. 1A), would have been more attractive for terrestrial hunter-gatherers. It is worth mentioning that massive geomorphological changes resulting from the middle Holocene marine transgression (e.g., McCulloch and Davies, Reference McCulloch and Davies2001) could have destroyed coastal sites before 7800 cal yr BP, so taphonomic issues might affect the hiatus.
Finally, the third significant change on the human occupation curve concerns the re-occupation of the region after the hiatus around 7800 cal yr BP, contemporaneous with the Hudson eruption, which probably occurred at 7960–7430 cal yr BP (Stern, Reference Stern2008). This eruption is considered the largest of all 12 eruptions recorded for this volcano (Veblen, Reference Veblen1989; Naranjo and Stern, Reference Naranjo and Stern1998; Fontijn et al., Reference Fontijn, Lachowycz, Rawson, Pyle, Mather, Naranjo and Moreno-Roa2014). For example, although it had a significantly lower impact, the 1991 Hudson eruption caused the sealing of shallow-water ponds, lake turbidity, and high ash-load levels in water bodies for several months (Inbar et al., Reference Inbar, Ostera, Parica, Remesal and Salani1995). Dead and blind birds were found, while the movements of local wild animals were slower, and their death rates rose due to pasture deterioration. Considering this information, after an ash fall more than 10 cm thick in the central and northern Isla Grande, this eruption could have promoted mobility of terrestrial groups from highly affected areas to more suitable ones (Fig. 1). In fact, first occupations of terrestrial hunter-gatherers at the Ponsonby site (ca. 7800 cal yr BP, on Riesco Island, outside Isla Grande; Legoupil, Reference Legoupil2003; Fig. 1A) and first green obsidian artifacts at Inútil Bay carried by hunter-gatherers from the Otway Sound and Riesco Island area (ca. 7600–7200 cal yr BP; Morello et al., Reference Morello, Massone, Martin, Alfonso-Durruty and San Román2015c) could be evidence of this mobility process (cf. Prieto et al., Reference Prieto, Stern and Estévez2013). Beyond this possible effect on human behavior, the human occupation curve (Fig. 1A) does not support the idea of a population extinction caused by the ecological impact of this Hudson volcanic eruption (Prieto et al., Reference Prieto, Stern and Estévez2013).
Second period (ca. 6800–1500 cal yr BP): oscillating increase in human occupation frequencies
The second period, which may comprise the colonization phase (Borrero, Reference Borrero1994/95), shows some peaks in the human signal (Fig. 2A). However, only those around 4200, 3100, and 2400 cal yr BP are temporally overlapped with climatic and/or environmental deterioration phenomena. The human occupation increase at ca. 4200 cal yr BP coexists with the second Mt. Burney plinian eruption (ca. 4375–4135 cal yr BP; Stern, Reference Stern2008; Fig. 1), an episode that might cause long-term impacts on the superhumid and cold western evergreen forest, due to additional acidification of already acid soils (Kilian et al., Reference Kilian, Biester, Behrmann, Baeza, Fesq-Martin, Hohner, Schimpf, Friedmann and Mangini2006). At this time, the distribution of human occupations across the steppe/ecotone became concentrated along the Inútil Bay and south of San Sebastián Bay (Figs. 1 and 2B; Supplementary Fig. 1C), two areas with highly predictable and rich resources (Borella, Reference Borella2004; Massone and Morello, Reference Massone, Morello, Morello, Martinic, Prieto and Bahamonde2007). In this context, it could be expected that the highly disruptive phenomenon of the volcanic eruption, probably coupled with a dry phase registered at 4500–3600 cal yr BP (Haberzettl et al., Reference Haberzettl, Anselmetti, Bowen, Fey, Mayr, Zolitschka and Ariztegui2009; Hahn et al., Reference Hahn, Kliem, Ohlendorf, Zolitschka and Rosén2014; Borromei et al., Reference Borromei, Candelb, Musotto, Cusminsky, Martínez, Coviaga, Ponceb and Coronato2018) could have affected the resource structure, promoting those changes in human spatial organization.
At ca. 4800–4200 cal yr BP, the archaeological record also evidences long- and short-distance interactions (and/or direct provisioning) among maritime and terrestrial populations. This process is evidenced by the presence of artifacts manufactured with Miraflores raw materials (whose source is in the northern Isla Grande; Fig. 1) and guanaco bones (also from Isla Grande) in the central Magellan Strait islands (Labarca et al., Reference Labarca, Prieto, Sierpe and Morano2014; Borrazzo et al., Reference Borrazzo, Morello, Borrero, D'Orazio, Etchichury, Massone and De Ángelis2015; San Román et al., Reference San Román, Reyes, Torres, Morello and Bjerck2015). In addition, black obsidian raw material exploited by continental hunter-gatherers located over 640 km away from the Fuegian Archipelago is recorded at the Inútil Bay (Morello et al., Reference Morello, Massone, Martin, McCulloch, Borrero, Arroyo-Kalin, Reyes, Alfonso-Durruty and Christensen2015a).
The human occupation increase around 3100 cal yr BP is contemporaneous with the Aguilera volcanic eruption (at ca. 3370–2860 cal yr BP; Stern, Reference Stern2008; Fig. 1), the impact of which on Isla Grande might be of low magnitude, considering the 1-cm-deep ash deposit registered across the area (Stern, Reference Stern2008; Fontijn et al., Reference Fontijn, Lachowycz, Rawson, Pyle, Mather, Naranjo and Moreno-Roa2014). Beyond its contemporaneity, neither the spatial analysis nor the archaeological record indicates changes due to the eruption that could support a significant behavioral shift on the past human populations.
Finally, the occupation increase around 2400 cal yr BP took place during a relatively drier period registered at ca. 2600–2100 cal yr BP (Borromei et al., Reference Borromei, Candelb, Musotto, Cusminsky, Martínez, Coviaga, Ponceb and Coronato2018). Spatial analysis indicates more inland occupations (Fig. 2B), whereas the archaeological record shows the earliest indirect record of fishing net use (notched pebbles) in terrestrial hunter-gatherer contexts (Massone and Torres, Reference Massone and Torres2004). After ca. 2700 cal yr BP, artifacts manufactured in green exotic obsidian reappear on Isla Grande after a discontinuity of more than 2500 years (Morello et al., Reference Morello, Stern and San Román2015b, and references therein). Hence, the increase on human occupation events, along with changes on subsistence strategies, occupations of new areas, and long-distance interactions could be understood as risk-buffer strategies due to environmental deterioration after the dry pulse.
Third period (ca. 1500–500 cal yr BP): the highest frequencies of human occupations
After ca. 1500 cal yr BP, the human occupation curve shows a significant peak that, along with the archaeological record, suggests an effective occupation of the space (Borrero, Reference Borrero1994/95). This process is characterized by the maximum expansion of human occupations, implying the incorporation of new areas, including the ecotone and many sectors along Atlantic and northern Magellan coasts (Fig. 2B, 2–1 cal ka BP temporal block). An intensification of inland occupations also takes place at 2000–1000 cal yr BP, together with a widespread use of microlithic technology across the entire island (Álvarez, Reference Álvarez, Salemme, Santiago, Álvarez, Piana, Vázquez and Mansur2009; Borrazzo, Reference Borrazzo2010). After ca. 1000 cal yr BP, a demographic peak is also described by considering age-at-death profiles (Suby et al., Reference Suby, Luna, Aranda and Flensborg2017), whereas an abandonment of littoral occupations of northern Magellan Strait and an accentuated shift from a random to a clustered spatial pattern on the San Sebastián Bay is recorded (Fig. 2B, 1–0 cal ka BP temporal block; Supplementary Fig. 1G).
These significant spatial, technological, and demographic changes in the human system occurred under the high climatic variability that characterized the late Holocene (e.g., Haberzettl et al., Reference Haberzettl, Fey, Lucke, Maidana, Mayr, Ohlendorf, Schäbitz, Schleser, Wille and Zolitschka2005, Reference Haberzettl, Kücka, Wulf, Anselmetti, Ariztegui, Corbella and Fey2008; Irurzun et al., Reference Irurzun, Gogorza, Sinito, Chaparro, Prieto, Laprida, Lirio, Navas and Nuñez2014; Borromei et al., Reference Borromei, Candelb, Musotto, Cusminsky, Martínez, Coviaga, Ponceb and Coronato2018). Particularly, the two-step increases between ca. 1300 and 500 cal yr BP (Fig. 2A) coincide with two dry episodes described between 1200–1000 cal yr BP and 700–500 cal yr BP. An extreme dry pulse between 500 and 200 cal yr BP (Borromei et al., Reference Borromei, Candelb, Musotto, Cusminsky, Martínez, Coviaga, Ponceb and Coronato2018) occurs along with a remarkable drop on human occupation frequencies (Fig. 2A). Under such arid conditions, the clustered pattern of human occupations after 1000 cal yr BP in places with highly predictable and/or diverse resources could be understood as a low-risk strategy for human subsistence. In fact, this behavior was observed in southern continental Patagonia (Pallo and Ozán, Reference Pallo and Ozán2014), so a similar landscape management approach among terrestrial hunter-gatherers from the continental and Fuegian Patagonia steppes could be proposed by this time. However, because the demographic growth after 1000 cal yr BP on Isla Grande (Suby et al., Reference Suby, Luna, Aranda and Flensborg2017) could have also caused the same spatial signal, covariations between paleoclimatic data and human signature for the northern steppe/ecotone area still remain unclear.
A significant final drop after 500 cal yr BP coincides with a demographic decrease attributed to the European colonization process (Suby et al., Reference Suby, Luna, Aranda and Flensborg2017). An increase in residential mobility as a strategy to avoid European contact (Borrero, Reference Borrero2001) could also influence the drop in human occupations. Indeed, human occupations after ca. 500 cal yr BP also present a clear spatial shift characterized by an abandonment of Magellan Strait coasts (Fig. 4A and B), where first hostile contacts between Selk´nam and European explorers (Spanish and Dutch) took place starting in the second half of the sixteenth century (Borrero, Reference Borrero2001, and references therein).

Figure 4. (color online) (A and B) Comparison between the last three 500-year temporal blocks. Note the Magellan Strait abandonment pattern after 500 cal yr BP in the entire study area. (C) Comparison between taphonomic curves from the steppe/ecotone and the forest human occupations (see also Figs. 2A and 3A).
On the other hand, this increase in residential mobility could be expected based on the extreme arid conditions ascribed to the LIA (Borromei et al., Reference Borromei, Candelb, Musotto, Cusminsky, Martínez, Coviaga, Ponceb and Coronato2018). In fact, a more intense human occupation of ecotone areas (including the center-east deciduous forest of Isla Grande) could indicate a particular land-use strategy in the face of low-productivity steppe environments. Because guanaco populations were the critical resource for steppe human groups, their mobility patterns would have affected human land-use strategies (Borrero, Reference Borrero, Mondini, Muñoz and Wickler2004). Then, under environmental productivity drops in the steppe, the forest might have functioned as a secondary habitat for guanaco populations (Raedeke, Reference Raedeke1978), and this could have impacted human land use. In sum, both environmental and sociodemographic factors could have acted in combination on the human signal after ca. 500 cal yr BP.
The southwestern forest environment and human populations
First period (ca. 8600–7400 cal yr BP): low-frequency human occupation events
The earliest human evidence at the Imiwaia I site (ca. 8600 cal yr BP), located at the Beagle Channel (Orquera and Piana, Reference Orquera and Piana2009; Zangrando, Reference Zangrando2009; Fig. 1), took place during the northern steppe archaeological hiatus, when these margins were still part of a steppe/forest ecotone (Musotto et al., Reference Musotto, Borromei, Coronato, Menounos, Osborn and Marr2016). At this time, local paleoecological data indicate a relatively arid pulse about 8600 cal yr BP (Musotto et al., Reference Musotto, Borromei, Coronato, Menounos, Osborn and Marr2016) within a broader regional context characterized by several arid and cold episodes (e.g., Zolitschka et al., Reference Zolitschka, Anselmetti, Ariztegui, Corbella, Francus, Lücke, Maidana, Ohlendorf, Schäbitz and Wastegård2013; Irurzum et al., 2014; Zhu et al., Reference Zhu, Lu and Zhang2014). The first Monte Burney volcanic eruption is also registered (ca. 9350–8990 cal yr BP sensu Kilian et al., Reference Kilian, Hohner, Biester, Wallrabe-Adams and Stern2003; or ca. 8975–8380 cal yr BP after Haberzettl et al., Reference Haberzettl, Corbella, Fey, Janssen, Lücke, Mayr and Ohlendorf2007), with a major impact in the western Fuegian Archipelago and southwestern continental Patagonia (Stern, Reference Stern2008: Fig. 7; Fig. 2).
The ecological deterioration, particularly the one caused by the volcanic eruption, could have promoted changes in mobility systems to deal with low-productivity ecosystems. Thus, the Imiwaia I site could be explained as a result of a north–south peopling mechanism motivated by harsh environmental conditions. Although first occupations at this site show no evidence of littoral adaptation (Piana et al., Reference Piana, Zangrando and Orquera2012), the coastal environment could have been attractive for human exploration (Piana et al., Reference Piana, Zangrando and Orquera2012) due to its low daily and seasonal temperature amplitude and a relatively high biodiversity (Zangrando, Reference Zangrando2009; Musotto et al., Reference Musotto, Borromei, Coronato, Menounos, Osborn and Marr2016). These first coastal occupations with a lack of littoral adaptations make sense in the context of a homogeneous landscape (i.e. low ecozone diversity in the whole Isla Grande) (Musotto et al., Reference Musotto, Borromei, Coronato, Menounos, Osborn and Marr2016), with low-diversity human subsistence strategies (Bailey and Milner, Reference Bailey and Milner2002; Borrero et al., Reference Borrero, Martin, Horwitz, Franco, Favier Dubois, Carballo Marina, Belardi, Cruz, Caracotche, Senatore and Ladrón de Guevara2008).
Second period (ca. 7400–5600 cal yr BP): a substantial increase in the human signal
This period of higher occupation frequencies, interpreted as a colonization phase (Borrero Reference Borrero1994/95), comprises three main peaks in the curve (Fig. 3A). The first increase, around 7400–6600 cal yr BP, is contemporaneous with the Hudson volcano explosive eruption (ca. 7960–7430 cal yr BP; Stern, Reference Stern2008), the environmental impact of which was discussed earlier and might affect forest human populations (Fernández, Reference Fernández2013). The Hudson eruption was proposed as a trigger for littoral adaptations (Prieto et al., Reference Prieto, Stern and Estévez2013), along with the existence of forest patches that might provide raw material for the watercraft manufacturing (Orquera and Piana, Reference Orquera and Piana2005; Musotto et al., Reference Musotto, Borromei, Coronato, Menounos, Osborn and Marr2016). Indeed, the first evidence of maritime adaptation is recorded at the Túnel 1 site at the Beagle Channel at ca.7300 cal yr BP (e.g., Piana and Orquera, Reference Piana and Orquera2009; San Román et al., Reference San Román, Reyes, Torres, Morello and Bjerck2015), whereas between ca. 7300 and 6700 cal yr BP, the southern coast of Navarino Island is occupied, probably by the use of watercraft (Legoupil, Reference Legoupil1993/94). By this time, the first green obsidian artifacts from the Riesco Island—controlled by western marine hunter-gatherers—were found in the Beagle Channel (after ca. 7600 cal yr BP; Morello et al., Reference Morello, Stern and San Román2015b), providing further evidence of long-range interactions (Álvarez, Reference Álvarez2004).
It seems likely that the human concentration around relatively high-productivity areas, such as the Beagle Channel margins (Zangrando, Reference Zangrando, Muñoz, Götz and Ramos Roca2014), less affected by the Hudson eruption (Fontijn et al., Reference Fontijn, Lachowycz, Rawson, Pyle, Mather, Naranjo and Moreno-Roa2014: Fig. 2), and the network interaction—understood as a southwestern forest strengthening mechanism (San Román et al., Reference San Román, Reyes, Torres, Morello and Bjerck2015)—were risk-buffer strategies in the face of harsh environmental conditions. Therefore, the previous hypothesis regarding the interruption of long-distance transport of items during the Hudson volcanic eruption can be ruled out (Prieto et al., Reference Prieto, Stern and Estévez2013).
There are no environmental deterioration episodes described during the other two increases in the human occupation curve at ca. 6300 cal yr BP and ca. 5800–5600 cal yr BP or drops in between (Fig. 3A). If neither methodological nor taphonomic issues are involved, these latter changes in the human signal regarding the intensity of human occupation, the mobility system, and/or demography could have been motivated by possible intrinsic biosocial processes of human populations.
Third period (ca. 5600–2000 cal yr BP): low-oscillating frequencies of human occupations
During this period, considered as part of the colonization phase (Borrero, Reference Borrero1994/95), a relative decrease in the frequency of human occupations at ca. 5500 cal yr BP is observed (Fig. 3A). Because a demographic growth pulse was described in the region by 5500 cal yr BP (Suby et al., Reference Suby, Luna, Aranda and Flensborg2017), this drop may reflect changes in spatial/mobility patterns rather than a demographic process. Indeed, spatial analyses between 5 and 3 cal ka BP (Fig. 3B; Supplementary Fig. 2D and E) show a more dispersed distribution across the forest area, which contrasts with previous and subsequent temporal blocks. The increase in guanaco consumption recorded in Beagle Channel archaeological sites (Fernández et al., Reference Fernández, Ponce, Zangrando, Borromei, Mussotto, Alunni and Vázquez2018) could also support a residential mobility increase by the exploitation of northern sectors of the inland.
Contemporaneously, a relative cooling phase is observed (Ponce et al., Reference Ponce, Borromei, Rabassa and Martinez2011; Menounos et al., Reference Menounos, Clague, Osborn, Davis, Ponce, Goehring, Maurer, Rabassa, Coronato and Marr2013). In southern Patagonia, a decrease in the water column primary productivity, which may drive a loss in higher trophic levels, could be expected in a colder phase due to the Malvinas current effect on the water stratification (Voigt et al., Reference Voigt, Chiessi, Prange, Mulitza, Groeneveld, Varma and Henrich2015). Additionally, colder summers create suboptimal conditions for pinnipeds mating and pupping (Campagna and Le Boeuf, Reference Campagna and Le Boeuf1988; Pavés et al., Reference Pavés, Schlatter and Espinoza2005). This scenario could explain the subsistence diversification observed in the Beagle Channel area at ca. 5400–4600 cal yr BP, which is characterized by a significant decrease in pinniped consumption and an increase in bird (Zangrando, Reference Zangrando2009) and guanaco resources (Fernández et al., Reference Fernández, Ponce, Zangrando, Borromei, Mussotto, Alunni and Vázquez2018).
Fourth stage (ca. 2000–200 cal yr BP): the highest frequency of human occupations
The effective occupation of the space (Borrero, Reference Borrero1994/95) is represented by this fourth period, when three progressive increases in the frequency of human occupations are observed (Fig. 3A). While the ca. 2000 and ca. 1500 cal yr BP peaks do not occur along with any environmental deterioration phenomena, the ca. 1000 cal yr BP increase and the drop after ca. 500 cal yr BP coincide with the onset of a relative cooling episode at ca. 1000 cal yr BP and an extreme cooling local episode at ca. 680–300 cal yr BP (Borromei et al., Reference Borromei, Coronato, Franzén, Ponce, López Sáez, Maidana, Rabassa and Candel2010).
When considering these cooling episodes, the ca. 1000 cal yr BP increase in the human signal could be understood as a shift toward a more intense spatial occupation (long-term and/or recurrent loci) around areas with more predictable and rich resources (like the Beagle Channel) as a risk-buffer strategy. In fact, spatial analysis supports such a concentration focused on the Beagle Channel (Fig. 3B; Supplementary Fig. 2H). An alternative interpretation of the 1000 cal yr BP human occupation increase is related to the demographic peak between ca. 1000 and 400 cal yr BP (Suby et al., Reference Suby, Luna, Aranda and Flensborg2017), which could have caused more occupations across the area and spatial concentration around more productive locations. Therefore, both a growing population and/or an environmental deterioration could have caused such a spatial pattern, resulting in the increase in the frequency of human occupations. Subsistence intensification based on fewer guanaco, more birds and coastal fish, and a higher diversity of deep-water fish around 1500–1200 cal yr BP in the Beagle Channel (Zangrando, Reference Zangrando2009; Zangrando et al., Reference Zangrando, Ponce, Martinoli, Montes, Piana and Vanella2016a, Reference Zangrando, Riccialdelli, Kochi, Nye and Tessone2016b) could thus be understood as the result of the demographic growth.
The final drop in frequencies of human occupations (ca. 500 cal yr BP) coincides with the European arrival, but also with extreme cold conditions recorded between ca. 680 and 300 cal yr BP, interpreted as the LIA (Borromei et al., Reference Borromei, Coronato, Franzén, Ponce, López Sáez, Maidana, Rabassa and Candel2010) during the neoglaciations (Kuylenstierna et al., Reference Kuylenstierna, Rosqvist and Holmlund1996; Mauquoy et al., Reference Mauquoy, Blaauw, van Geel, Borromei, Quattocchio, Chambers and Possnert2004; Koch and Kilian, Reference Koch and Kilian2005; Aravena, Reference Aravena2007; Strelin and Iturraspe, Reference Strelin and Iturraspe2007; Strelin et al., Reference Strelin, Casassa, Rosqvist and Holmlund2008). Changes in the zooarchaeological record at ca. 600 cal yr BP in the Beagle Channel area, concerning a decrease in guanaco remains, were also related to harsh environmental conditions ascribed to the LIA (Fernández et al., Reference Fernández, Ponce, Zangrando, Borromei, Mussotto, Alunni and Vázquez2018). Nevertheless, as the same human trend is observed in the northern steppe/ecotone, where no cold episodes are registered, the European colonization process might be the most likely explanation of the contraction of the human signal, due to both the increase of residential mobility (to avoid the European contact; Borrero, Reference Borrero2001) and/or higher mortality rates (Suby et al., Reference Suby, Luna, Aranda and Flensborg2017). As in the case of northern Isla Grande, a substantial decrease of archaeological loci located along the Magellan Strait forest area (the western Fuegian Archipelago) after ca. 500 cal yr BP could be associated with the strategy to avoid European contact, because first contacts were along the Magellan Strait coasts (Fig. 4A and B).
Finally, it is worth mentioning that similarities between steppe/ecotone and forest occupation curves (Fig. 4C) during the effective occupation phase are observed across the Holocene. This fact could suggest common biogeographic aspects within the entire Fuegian Archipelago, beyond ecological differences. Common behaviors behind both human occupation trajectories are consistent with previous studies that emphasized the lack of sharp archaeological differences of ethnographic populations (e.g., Yesner et al., Reference Yesner, Figuerero Torres, Guichón and Borrero2003; Barberena, Reference Barberena, Borrero, Barberena and Dunken2004; Borrero et al., Reference Borrero, Martin, Barberena, Whallon, Lovis and Hitchcock2011; Tívoli and Zangrando, Reference Tívoli and Zangrando2011; Suby et al., Reference Suby, Luna, Aranda and Flensborg2017).
CONCLUSIONS
This contribution comprises a first attempt to compile all archaeological data as summed probability distributions of calibrated dates from the entire Fuegian Archipelago across the Holocene in order to discuss possible relationships between changes in human occupation frequencies and environmental deterioration phenomena. The main insights arising from the discussion are summarized in the following paragraphs.
In the entire study area, the scarce archaeological evidence during the exploration phase (Borrero, Reference Borrero1994/95) does not allow disentangling the behavioral meaning of the occupation curve. Hence, possible changes in the human signal associated with environmental deterioration scenarios are difficult to establish due to equifinality. However, the coexistence between the human signal reappearance after the long hiatus in the northern steppes and the Hudson volcano eruption (ca. 7700 cal yr BP), as well as the peopling of southern Isla Grande after the first Monte Burney volcanic eruption (ca. 8600 cal yr BP), should be considered as key factors for future agendas willing to deal with human–environmental questions during the exploration phase.
During the colonization phase (Borrero, Reference Borrero1994/95), the ecological deterioration resulting from the second Monte Burney volcano eruption and an aridity phase (ca. 4300 cal yr BP) in the northern steppes could have been important triggers for changes in human occupation dynamics. Changes in land-use strategies toward a high-intensity occupation focused on predictable resource areas, along with the development of long-network systems with western Fuegian islands and continental Patagonia, could be understood as human responses to ecological deterioration. Another dry episode beginning around 2600 cal yr BP could have played a role in the contemporaneous human occupation increase, which might arise from the incorporation of new inland zones. In this context, the first use of fishing nets in terrestrial contexts and the evidence of network system interactions with the western Fuegian islands could be understood as risk-buffer strategies to deal with an environmental productivity drop caused by the arid pulse in an already subhumid region.
The colonization phase (Borrero, Reference Borrero1994/95) in the southwestern Fuegian Archipelago shows an increase in the frequency of human occupations at ca. 7400 cal yr BP, which could be attributed to a shift toward a more intense human occupation in the Beagle Channel area. This process might have occurred along with the first evidence of maritime adaptation and interactions with western Fuegian island populations. The contemporaneous Hudson volcanic eruption could have triggered these risk-buffer behaviors.
Human occupation frequencies drop at ca. 5500 cal yr BP, probably due to a shift toward a more dispersed spatial occupation pattern, accompanied by diet diversification and a significant increase of guanaco consumption in the Beagle Channel area (Zangrando, Reference Zangrando2009; Fernández et al., Reference Fernández, Ponce, Zangrando, Borromei, Mussotto, Alunni and Vázquez2018). Because a cooling phase is registered by this time (Ponce et al., Reference Ponce, Borromei, Rabassa and Martinez2011), its ecological impact, likely coupled with the demographic increase recorded by age-at-death profiles (Suby et al., Reference Suby, Luna, Aranda and Flensborg2017), could be proposed as the main trigger for changes observed in human land use and subsistence patterns.
During the effective occupation phase (Borrero, Reference Borrero1994/95), the human occupation curves of both phytogeographic areas yield similar trends. First, both curves are characterized by a two-step increase after ca. 1500 cal yr BP, likely caused by the incorporation of new areas, the intensification of others, and demographic growth (Suby et al., Reference Suby, Luna, Aranda and Flensborg2017). Second, a major drop in occupation events after ca. 500 cal yr BP is observed, probably in response to a combination of an abandonment of Magellan Strait loci, an inferred increase in residential mobility, and the demographic decrease observed after the European arrival (Suby et al., Reference Suby, Luna, Aranda and Flensborg2017). The spatial abandonment of Magellan Strait coastal loci is consistent with the strategy to avoid contact with Europeans (Borrero, Reference Borrero2001), whose first appearances were along these coasts (Fig. 4A and B). Even though these changes coincide with environmental deterioration episodes (aridity in the steppe/ecotone and cooling in the forest), the high late Holocene (e.g., Borromei et al., Reference Borromei, Candelb, Musotto, Cusminsky, Martínez, Coviaga, Ponceb and Coronato2018) climatic variability makes environmental explanations unlikely, whereas demography and the colonization process may account for the human occupation curve.
Finally, it is worth mentioning the similarity arising from the comparison between steppe/ecotone and forest occupation trajectories (Fig. 4C), with only minor differences regarding the curve amplitude and timing. This common trajectory between phytogeographic areas could result from either biogeographic aspects or taphonomic issues. As depositional and postdepositional conditions show clear contrasts between the northern and southern Fuegian Archipelago (Fig. 1A and C), similarities in human occupation trends could be attributed to behavioral factors. Hence, this large spatiotemporal analysis is consistent with other lines of evidence that highlight common features between steppe and forest Fuegian populations (e.g., Barberena, Reference Barberena, Borrero, Barberena and Dunken2004; Borrero et al., Reference Borrero, Martin, Barberena, Whallon, Lovis and Hitchcock2011; Suby et al., Reference Suby, Luna, Aranda and Flensborg2017).
In sum, this study offers a broad picture of where some changes observed in the frequency of human occupation of the Fuegian Archipelago could be framed by under natural stress effects caused by volcanic eruptions and cooling and/or arid episodes. Spatial analysis allowed translating peaks and drops of human occupation curves into changes concerning settlement and mobility patterns, whereas additional archaeological data offered relevant information about network interactions, demography, subsistence strategies, and technology, likely associated with that oscillation of the occupation curve. Whether other recorded major climatic/geological events influenced human occupations still requires further discussion. Future work should aim to provide more high-resolution paleoclimatic data, allowing the quantification of the magnitude of natural phenomena, whereas further archaeological studies should go deeper into the behavioral meaning behind the record.
SUPPLEMENTARY MATERIAL
The supplementary material for this article can be found at https://doi.org/10.1017/qua.2018.157.
ACKNOWLEDGMENTS
The authors thank Sebastián Oriolo, Luis A. Borrero, and María Julia Orgeira for their support and advice on an earlier version of this paper. The authors also thank the reviewers and editors for their constructive comments for improving this work.


