INTRODUCTION
Significant uncertainties exist when projecting modern sea-level rise into the future. These are partly caused by the challenge of reconstructing the past dynamics of large ice sheets on millennial time scales, which is required to have confidence in the projections. It is generally accepted that short-term climate excursions can occur (e.g., Bakker et al., Reference Bakker, Masson-Delmotte, Martrat, Charbit, Renssen, Groeger, Krebs-Kanzow, Lohman, Lunt, Pfeiffer, Phipps, Prange, Ritz, Schulz, Stenni, Stone and Varma2014) during an otherwise stable climate period. Such climate variations could have led to ice-mass and sea-level oscillation during the last interglacial (LIG; 129–116 ka), but the magnitude of the oscillation remains elusive. The global LIG sea level could have remained stable, accentuated in a second, rapid rise at the end of a period of stability (Hearty et al., Reference Hearty, Hollin, Neumann, O’Leary and McCulloch2007; Blanchon et al., Reference Blanchon, Eisenhauer, Fietzke and Liebetrau2009; O’Leary et al., Reference O’Leary, Hearty, Thompson, Raymo, Mitrovica and Webster2013), or oscillated repeatedly or twice (Chen et al., Reference Chen, Curran, White and Wasserburg1991; Stein et al., Reference Stein, Wasserburg, Aharon, Chen, Zhu, Bloom and Chappell1993; Israelson and Wohlfahrt, Reference Israelson and Wohlfahrt1999; Blanchon and Eisenhauer, Reference Blanchon and Eisenhauer2001). We note the small scale of the oscillation (<6 m) and ask to what extent the sea-level proxy can resolve such oscillations where the proxy’s qualification should be a function of sea-level sensitivity and datum and age uncertainty. The question is challenging because the reconstruction of the LIG global sea level suffers from the dilemma that non-eustatic glacio-isostatic adjustment (GIA) contribution to sea-level change cannot be predicted for a specific location unless the ice history is known, but this is what the proxy is trying to reconstruct. To circumvent this problem, sites are investigated where the non-eustatic component is minimal. Hergla, situated on the North African coast, does satisfy this requirement (Mauz et al., Reference Mauz, Ruggieri and Spada2015). It is an often-cited sea-level site (e.g., Hearty et al., Reference Hearty, Hollin, Neumann, O’Leary and McCulloch2007; Kopp et al., Reference Kopp, Simons, Mitrovica, Maloof and Oppenheimer2009) outside the tropics that seems to show a highstand amplified by a second rise after a brief drop. Focusing on the two-peak hypothesis, we show that the two-peak interpretation changes drastically when the study integrates stratigraphy, sediment architecture, and high-resolution chronology.
The two-peak hypothesis during MIS 5e
Some authors (e.g., O’Leary et al., Reference O’Leary, Hearty, Thompson, Raymo, Mitrovica and Webster2013; Hansen et al., Reference Hansen, Sato, Hearty, Ruedy, Kelley, Masson-Delmotte and Russell2016) argue for a second rise occurring after the sea level has been stable for several millennia. Their evidence are erosional surfaces and/or notches in reefs crests behind the wave-cut platform at Bahamas (Neumann and Hearty, Reference Neumann and Hearty1996), western Australia (O’Leary et al., Reference O’Leary, Hearty, Thompson, Raymo, Mitrovica and Webster2013) and Yucatán (Blanchon et al., Reference Blanchon, Eisenhauer, Fietzke and Liebetrau2009). The geomorphic feature is supported by the regional extent of the erosional surface – a compelling stratigraphic evidence for two separate reef units in the northern part of the Caribbean (Frujtier et al., Reference Frujtier, Elliott and Schlager2000). Others found field evidence for a sea-level jump (Bahamas; Chen et al., Reference Chen, Curran, White and Wasserburg1991; Barbados; Blanchon and Eisenhauer, Reference Blanchon and Eisenhauer2001) or, on the contrary, weak stratigraphic evidence (Seychelles; Israelson and Wohlfahrt, Reference Israelson and Wohlfahrt1999) contradicting earlier work on the same Seychelles reef (Montaggiori and Houng, Reference Montaggiori and Houng1988). Ideally, bimodal age distribution is found for two reef units. Apart from data published by Stein et al. (Reference Stein, Wasserburg, Aharon, Chen, Zhu, Bloom and Chappell1993; Huon Peninsula, reef complex VII), however, bimodal age distribution does not emerge from the age data published probably due to the diagenetic overprint limiting both accuracy and precision of age estimates. 230Th age plots generated by Melinda-Elizalde (Reference Melinda-Elizalde2013), however, clearly show the multi-peak pattern of the LIG sea level even after probabilistic Monte Carlo simulation of data that should have masked millennial-scale oscillations.
SITE DESCRIPTION
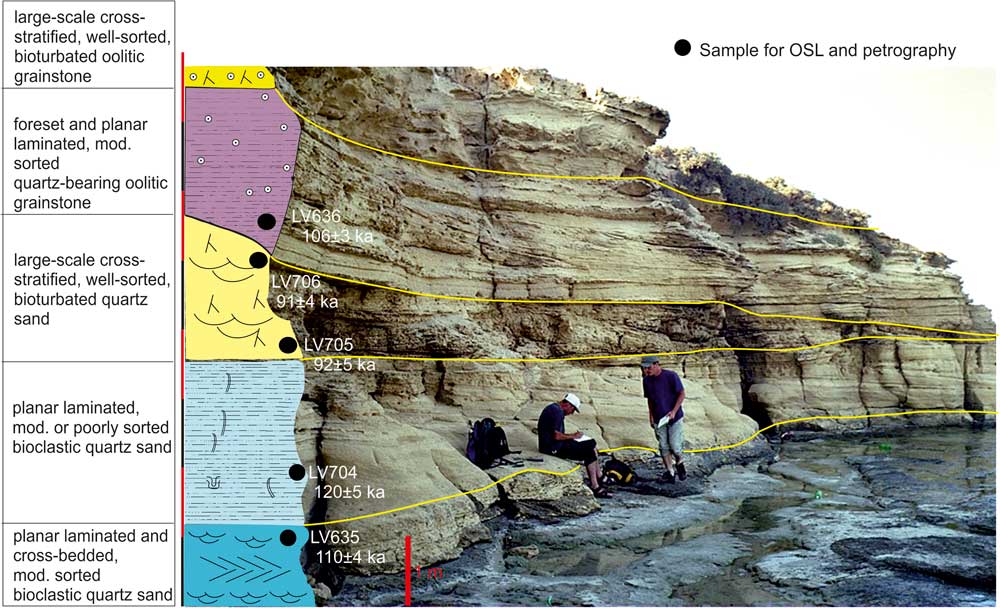
The Hergla site (Fig. 1) is a 2-km-long cliff situated on a microtidal coast (20–50 cm tidal range). The cliff constitutes a former coastal barrier anchored on Pliocene hills. The main section of the barrier (Fig. 2) shows sediment succession of mixed carbonate-siliciclastic planar laminated and cross-bedded moderately sorted sand, followed by laminated and foreset bedded oolitic grainstone. The stratigraphic succession, including stratigraphically significant surfaces, is summarized in Figure 3 (see also Supplementary Material). According to Hearty et al. (Reference Hearty, Hollin, Neumann, O’Leary and McCulloch2007, p. 2099), the top of the lower aeolian deposit is a ”weathering surface” and is associated with a sea level “fall to near or below present level (0 m)." The surface would allow to postulate a brief drop followed by a second, higher than the previous, sea-level highstand during MIS 5e (Hearty et al., Reference Hearty, Hollin, Neumann, O’Leary and McCulloch2007). In our correlation panel (Supplementary Fig. S2), the aeolian deposit is in juxtaposition to the lagoonal deposit, suggesting the shoreline was situated seaward at an unknown distance to the dune. The dune’s top is a buried subaerial surface that is spatially limited to the central and northern part of the cliff, where the exposure of the bay to the northeast allowed aeolian sand to accumulate.
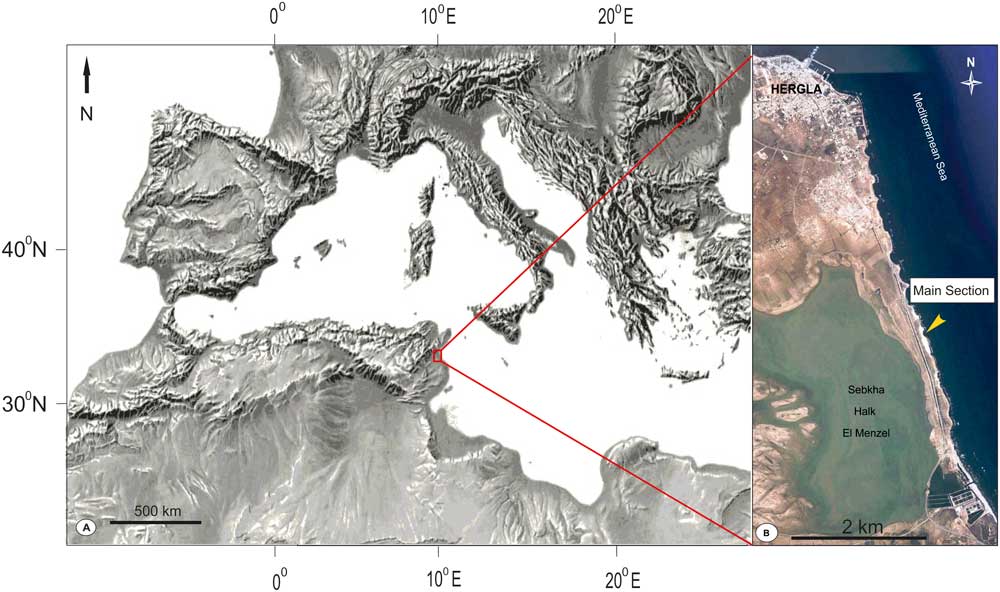
Figure 1 (color online) The location of the Hergla site.

Figure 2 (color online) The main section at Hergla. Deposits are classified following the results from thin section analysis. Dots and numbers indicate sample position and OSL ages. Photo courtesy of E. Davaud.

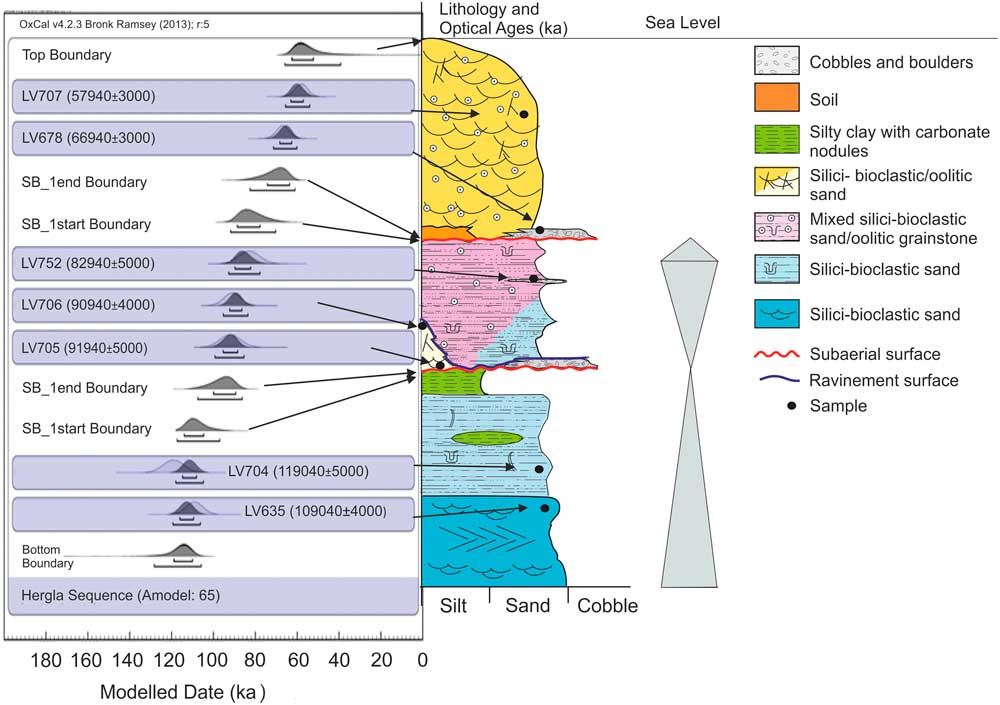
Figure 3 Generalized vertical succession of the Hergla cliff and Bayesian model of the optical ages using the OxCal program (Bronk Ramsey, 2013). Optical ages (likelihoods) are in light gray and the modeling results (posteriors) in dark gray. Blue bands highlight likelihoods based on an optical age, white band are likelihoods inferred from the respective upper and lower bounding ages. For details of age data and facies correlation, see Supplementary Material. (For interpretation of the references to color in this figure legend, the reader is referred to the web version of this article.)
METHODS
We revisited the Hergla site aiming at approximating the ages of stratigraphic boundaries, constraining the stratigraphically informed depositional sequence of dated strata, and at improving the accuracy of age estimates. The ~2-km-long lateral cliff exposure was mapped and logged in detail. Samples were collected at key points in the succession (Fig. 3) for optical stimulated luminescence (OSL) dating and for further describing the sediments and their depositional environment through thin section microscopy. Sea-level index points (SLIPs) were established following Shennan (Reference Shennan2015), where the midpoint of the foreshore deposits and the top of the lagoon are the reference water levels; an average tidal range of 0.3±0.2 m and the square-root rule are used for error calculation. Stratigraphic boundaries were identified following standard concepts of sequence stratigraphy (e.g., Catuneanu et al., 2011), where a subaerial surface is the land behind the shoreline and the ravinement surface is an erosional surface formed by wave action while the sea level rises.
Because quartz OSL tends to underestimate ages beyond ca. 80 ka (Shen and Mauz, Reference Shen and Mauz2011), extended dose-recovery test were performed to semi-quantitatively assess potential age underestimation caused by variable saturation doses of natural sedimentary quartz. The ages of the OSL samples, indicated in kilo years (ka) after sampling datum (AD2015), and key stratigraphic boundaries were modeled with a Bayesian approach. This statistical model takes OSL age data as a probability distribution alongside stratigraphic information to produce age estimates of the OSL samples and of key points in the stratigraphy for which no age information is available (e.g., stratigraphic boundaries). The Agreement Index is calculated for each sample and for the whole model to evaluate confidence of the modeling results, where a value >60% corresponds to about >95% probability of a chi-squared distribution (Bronk Ramsey and Lee, Reference Bronk Ramsey and Lee2013). To solve an apparent age inversion (see Fig. 2), multiple Bayesian runs were performed until the >60% Agreement Index was obtained (for details see Supplementary Material). Ages of MIS 5 substages were adopted from Martinson et al. (Reference Martinson, Pisias, Hays, Imbrie, Moore and Shackleton1987).
RESULTS
The result of optical dating, Bayesian modeling, and facies correlation is shown in Fig 3. The succession starts with a package of siliciclastic deposits of shoreface, foreshore, and lagoonal environment. The second sediment package is composed of siliciclastic, partly oolitic foreshore, aeolian oolitic dune deposits, two gravel layers, and soil. The base of the lower package, dated to 110±4 ka and 120±5 ka is not exposed; its top is the top of the lagoon bounded by a subaerial surface, which lasted from 107±10 ka to 97±11 ka (Fig. 3). An aeolian dune bed and a gravel layer bury this surface and both are, alongside the lagoonal deposit, truncated by the transgressive surface. The latter surface forms the base of the second, 2- to 3-m-thick package dated to 86±4 ka and 106±3 ka that is bounded at the top by a subaerial surface. This surface lasted from 81±9 ka to 72±11 ka before it was covered by gravel bed, soil, and aeolian dune. The lower part of the cliff represents a shallowing upward sequence subsequently overlain by an incomplete transgressive sequence. The OSL data show negligible age underestimation for ages above 80 ka. The multiple Bayesian runs led to the rejection of the sample LV636 (106±3 ka). See Supplementary Material for details of data.
DISCUSSION
Evidence for two peaks during MIS 5e
Following the stratigraphy and corresponding geochronological intervals (Fig. 3), the succession shows two incomplete sequences, each topped by a subaerial surface. The lower sequence’s top is the top of the lagoonal deposit, which is in some bays marked by beach pebbles and a foredune. This surface lasted around 107–97 ka, covering the timing of the two separate global sea-level drops of the MIS 5d and 5b stadials. The upper sequence’s top is the top of the upper foreshore which is marked by soil, foredune, and beach pebbles. The timing of this upper subaerial surface coincides with the global sea-level fall after this highstand. The upper foreshore deposit, embedded by the two surfaces, starts with a transgressive surface forming above existing beach and dune deposits (see Fig. 3 for illustration of surfaces). The timing of this upper foreshore coincides with the global sea-level rise of MIS 5a at around 85 ka. This clearly shows that Hergla does not provide evidence for a second sea-level rise during MIS 5e.
The global highstand of MIS 5c (ca. 110 ka) is missing in the succession; the sample that would represent this time interval (LV636, 106±3 ka) was rejected as a result of Bayesian modeling (for details see Supplementary Material). This implies that at Hergla the MIS 5c sea-level peak remained below 0 m, allowing the lowstands of MIS 5d and MIS 5b to coalesce in one subaerial surface, the regional extent of which is documented in earlier studies (e.g., Paskoffe and Sanlaville, Reference Paskoff and Sanlaville1983). During the subsequent transgression, the surface was reworked to a ravinement surface, eroding terrestrial material such as carbonate crust, soil, and colluvium.
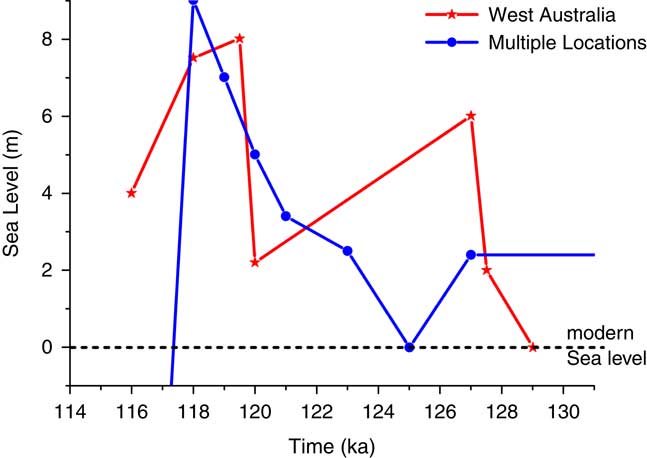
Our interpretation differs from other authors (e.g., Hearty et al., Reference Hearty, Hollin, Neumann, O’Leary and McCulloch2007). They believed the sediment succession is continuous and the subaerial surface between the two foreshore deposits lasted around 8 ka. More importantly, given limited time available, the two-peak hypothesis requires a rapid sea-level drop of several meters at the end of MIS 5e (Fig. 4). Such an extremely rapid fall seems physically impossible to achieve through ice growth only.

Figure 4 (color online) Last interglacial sea-level oscillations reported from two studies: O’Leary et al. (Reference O’Leary, Hearty, Thompson, Raymo, Mitrovica and Webster2013) for the Western Australia site (24°S, 114°E); Hearty et al. (Reference Hearty, Hollin, Neumann, O’Leary and McCulloch2007) for multiple locations including Bermuda, Barbados, Bahamas, Hawaii, W-Australia, and the non-reef site in the Mediterranean. For the sake of clarity, no error bars are depicted. For all data, see supplement.
The quality of facies-based sea-level proxies
Key features to identify shoreline migration in a geological record are vertical facies succession and surface. This should be supported by bi- or multi-modal distribution of ages, which, in turn, are in-line with the stratigraphy. The vertical uncertainty of the sea-level index point deduced from these two criteria must be smaller than the ~3 m uncertainty range of the LIG sea level (Kopp et al., Reference Kopp, Simons, Mitrovica, Maloof and Oppenheimer2009; Dutton et al., Reference Dutton, Carlson, Long, Milne, Clark, DeConto, Horton, Rahmsdorf and Raymo2015) to be a robust feature.
Facies successions allow localizing the position of the shoreline and facies analysis of fining or coarsening upward sequence allows inference of the sea-level trend. However, most coastal landforms evolve into a well-preserved clastic deposit under a positive sediment budget, which occurs when sea level falls because more coastal plain sediment is available for littoral transport during regression than during transgression (Lobo and Ridente, Reference Lobo and Ridente2013; Mauz et al., Reference Mauz, Hijma, Amorosi, Porat, Gallili and Bloemendal2013). On some coasts, the stratigraphic dominance of the falling stage is further enhanced by the solid-earth response to water load in the far field, leading to coastal sea-level fall.
Surfaces are created by waves (ravinement) or by subaerial processes (weathering, dissolution, erosion, or deposition of terrestrial sediment). The example of Hergla shows that, as the sea returns, the subaerial surface is transformed to a ravinement surface, a process that is likely to obliterate the signature of the pre-existing subaerial exposure.
Thus, the facies-based sea-level proxy is likely to be incomplete or too poorly preserved to show small-scale sea-level change. Moreover, the uncertainties associated with a sea-level datum often exceed 3 m and 8 ka, a resolution required to identify the two peaks at Hergla.
The sensitivity of the proxy to sea-level change
A certain amount of sea-level rise related to glacial meltwater should be detected everywhere on earth, albeit at different times and with different magnitudes due to the geographically variable effects of glacio-isostatic adjustment processes (e.g., Lambeck et al., Reference Lambeck, Purcell and Dutton2012). The response rate of the proxy relative to the rate of sea-level change is key to recording the change. Clastic coasts vary its sensitivity due to local morphodynamics in addition to physical accommodation. Experiments on sea-level signal preservation suggest that internal and external controls on the stratigraphic record cannot be separated (Li et al., Reference Li, Yu and Straub2016) below a certain threshold. In addition, where the stratigraphic discontinuity is not a regional feature, numerical modeling (e.g., Prince and Burgess, Reference Prince and Burgess2013) is required to test the ability of the particular proxy to record small-scale sea-level change.
The analysis of Melinda-Elizalde (Reference Melinda-Elizalde2013), however, shows that 230Th data are able to robustly record a 2 m sea-level jump in reefs. This seems to show that, despite uncertainties associated with diagenesis, the 230Th ages are more sensitive to the change than the clastic stratigraphic record.
CONCLUSION
Hergla is a remarkable site, not only because it shows a stack of two foreshore strata above each other, but also because it reveals how reworking during transgression can obliterate evidence of sea-level fall. Its chronostratigraphy does not confirm a MIS 5e double peak but confirms the two sea-level highstands during MIS 5e and MIS 5a. These findings from a mid-latitudinal site do not preclude the evidence for the MIS 5e sea-level jump elsewhere. Such sites, for instance in the Caribbean, deserve reconsideration, bearing in mind preservation potential of strata and diagenetic overprint of facies. Moreover, the geographically variable GIA effects and millennial-scale climate oscillations with contrasting timings in both hemispheres should be taken into account. Notwithstanding such an elucidated approach, inferring a small global sea-level signal from stratigraphic records that are spatially limited, remains a challenge.
ACKNOWLEDGMENTS
Mauz and Elmejdoub acknowledge the support of Leverhulme Trust International Network IN-2012-113 for “A New Network for Research into Past Shifts of the Mediterranean-Saharan Climate Boundary.”
SUPPLEMENTARY MATERIAL
To view supplementary material for this article, please visit https://doi.org/10.1017/qua.2017.111