


INTRODUCTION
Glacial Lake Hind formed in a small ice-marginal basin during retreat of the Laurentide Ice Sheet (LIS; Fig. 1). Sediments deposited in the Lake Hind basin are exposed along the Souris River, ~40 km west of the glacial Lake Agassiz basin and southwest of the city of Brandon, Manitoba (Fig. 2). The sequence consists of sand overlain by lacustrine silt, silty clay, and organic-rich marshland sediments that span the Younger Dryas (YD); this is overlain by fluvial and eolian sediment deposited during the Holocene.
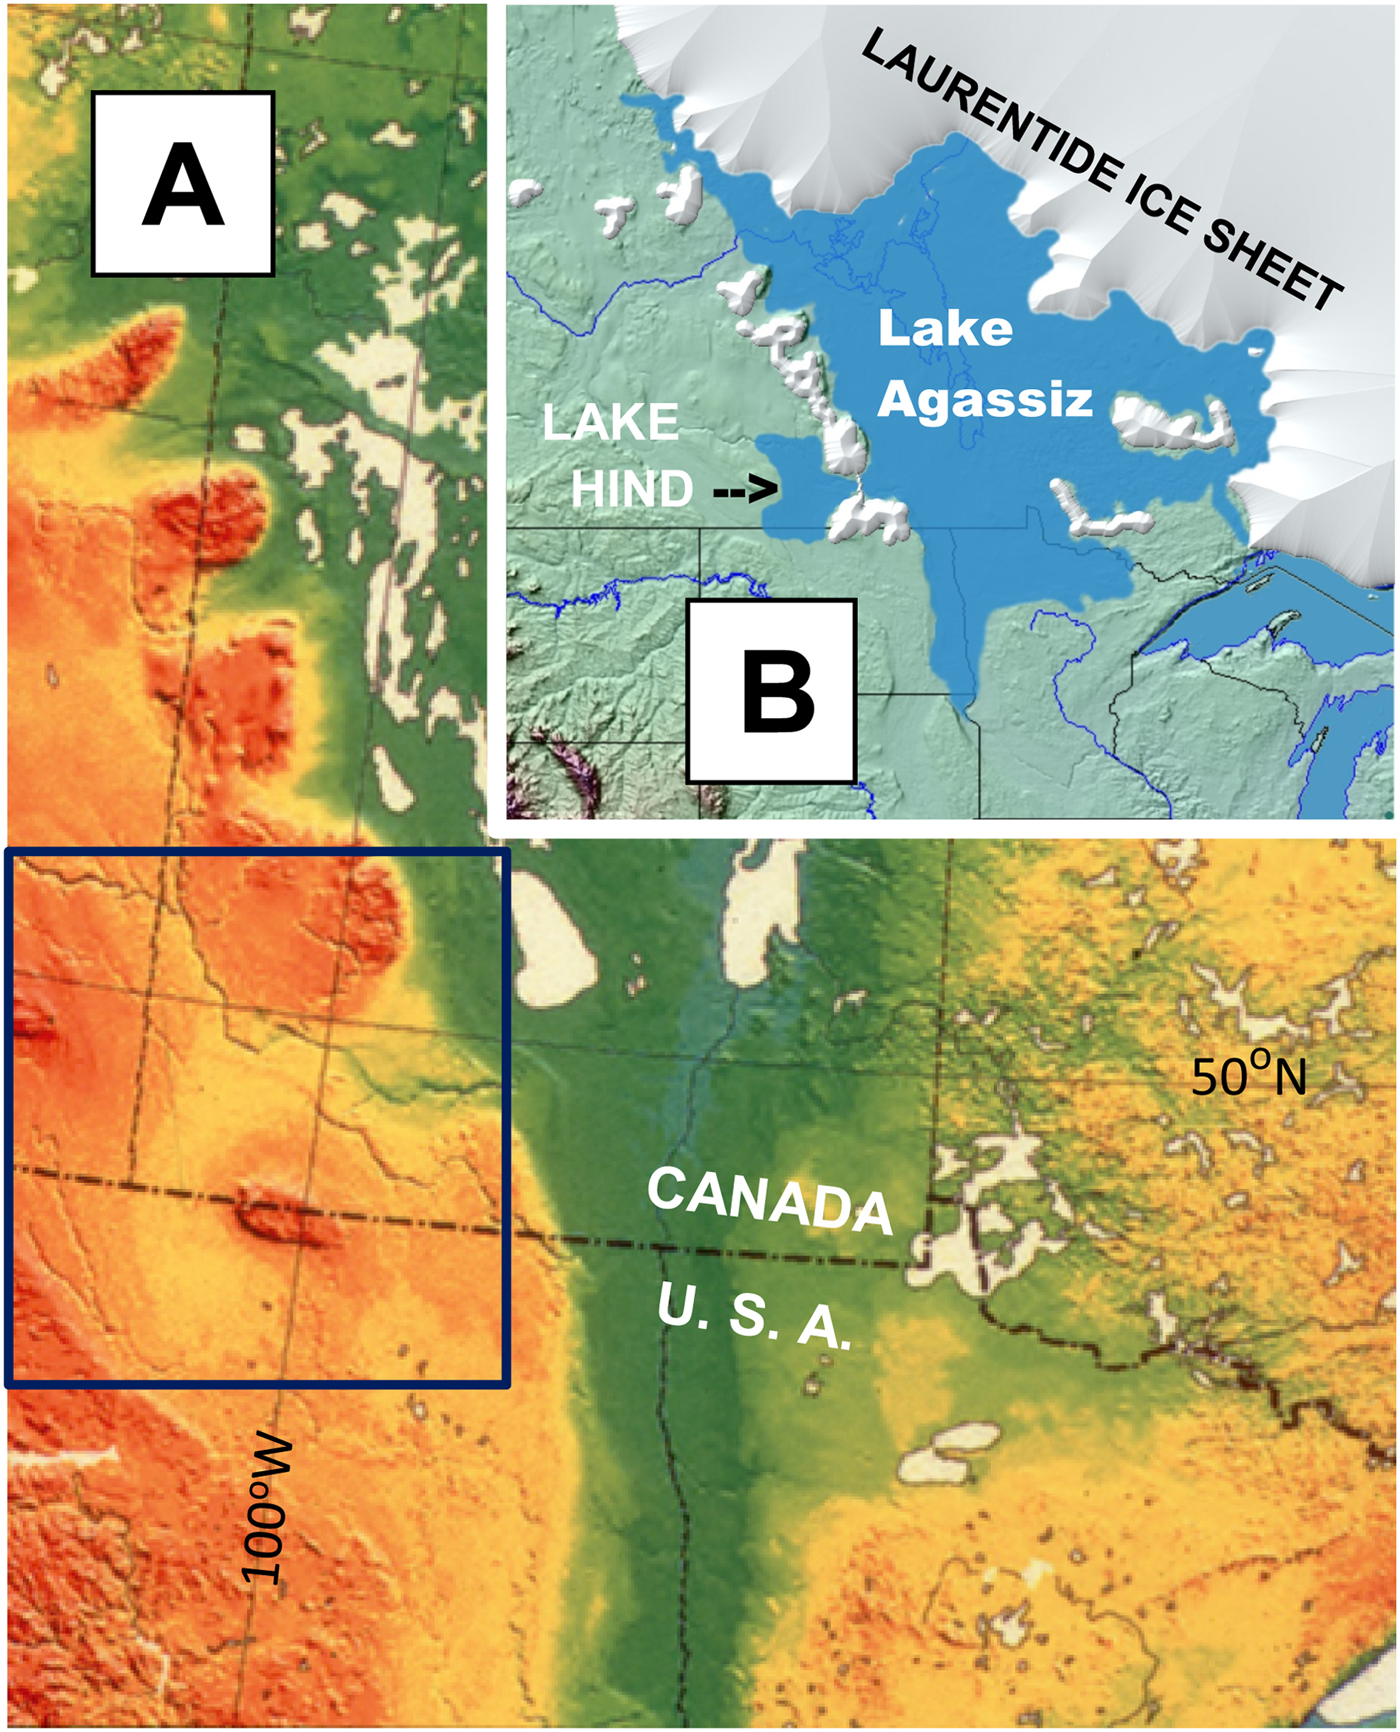
Figure 1. (A) Digital elevation model of regional topography. Lake Agassiz occupied low area shown in dark green. Black box outlines area shown in Figure 2A. (B) Schematic of Lake Agassiz and Glacial Lake Hind during time of Laurentide Ice Sheet retreat; local residual ice on uplands west of Lake Agassiz shown.

Figure 2. (A) Glacial Lake Hind region, showing major rivers and lake basins (after fig. 1 in Sun and Teller, Reference Sun and Teller1997); extent of Glacial Lake Hind shaded. Location of Flintstone Hills section noted by dot along Souris River. The modern drainage divide extends across the ancient Glacial Lake Hind plain between the Souris and Assiniboine rivers. Area of map in Figure 2B boxed. (B) Sediments in Glacial Lake Hind basin (fig. 3 in Sun and Teller, Reference Sun and Teller1997); deltas and fluvial deposits noted by letters A–P.

Figure 3. Exposure along Souris River (modified from fig. 2 in Running et al., Reference Running, Havholm, Boyd and Wiseman2002), showing correlation between section described in this paper (B, right stratigraphic column) and that in Boyd (Reference Boyd2003) (A, left stratigraphic column); note difference in vertical scales. Stratigraphic column A at the left shows units ”A” to “D” described by Boyd (Reference Boyd2003, fig. 3). “A1” in stratigraphic column (A) and in the photo (from Boyd, 2000) is peat overlying silty clay and sand that is equivalent to the peat over silty clay of Unit B and sand of Unit A in our stratigraphic column (B) below a depth of 0; a thin marl in both columns overlies the peat. Also see Figure 5. Boyd's Unit “A2” is correlated with our Unit C in stratigraphic column (B). Units “B” to “D” in the photo and column A are correlated with our Unit D, and are dominantly eolian sand; black zones in Boyd's units “B” and “C” are organic soils. Light-toned zone in unit C1 is a carbonate accumulation. Stratigraphic column (B) is discussed in this paper.
Glacial Lake Hind formed in a regionally low area of Cretaceous shale bedrock that is draped by Quaternary glacial sediment (Fig. 2). The lake basin today lies between the Assiniboine River, whose drainage extends westward into Saskatchewan, and the Souris River basin, which drains part of North Dakota and southeastern Saskatchewan. During its life, Lake Hind covered ~4000 km2, and was impounded by the LIS, receiving water directly from the ice and from proglacial rivers that drained into the lake. Some of this inflow may have included outbursts from a number of short-lived, ice-marginal lakes that drained catastrophically (e.g., Kehew and Clayton, Reference Kehew, Clayton, Teller and Clayton1983; Kehew and Teller, Reference Kehew and Teller1994a; Wolfe and Teller, Reference Wolfe and Teller1995). Finer-grained and increasingly organic-rich sediment was deposited in the Lake Hind basin as the LIS retreated and drainage systems were rerouted. Peat eventually dominated. Fluvial sediment was deposited over the peat, and that was subsequently reworked into dunes over much of the basin during the Holocene (Fig. 2).
LOCATION OF STUDY AND OBJECTIVES
The modern Souris River has eroded into sediments deposited in the Glacial Lake Hind basin, and in places there are riverbank cuts that expose post-glacial lacustrine, fluvial, and eolian sediment, as well as peat. Some of these exposures have been studied, primarily to establish the Holocene eolian history and post-glacial paleoenvironmental conditions of the region (Boyd, Reference Boyd2000a, Reference Boyd and Radenbaugh2000b, Reference Boyd2003; Boyd et al., Reference Boyd, Running and Havholm2003; Running et al., Reference Running, Havholm, Boyd and Wiseman2002; Havholm et al., Reference Havholm, Bergstrom, Jol, Running, Bristow and Jol2003; Havholm and Running, Reference Havholm and Running2005). Other studies by Sun (Sun, Reference Sun1996; Sun and Teller, Reference Sun and Teller1997) and Matile and Keller (Reference Matile and Keller2004a) focussed on the overall geology of the Lake Hind basin. This paper reports new studies in the Flintstone Hills area (Fig. 2), initiated by J. Teller, J. Kennett, M. Boyd, and M. Fayek. Extensive excavations, stratigraphic descriptions, and sampling took place, and this was followed by mineralogical, elemental, and biological analyses and accelerator mass spectrometry (AMS) dating; we provide brief descriptions of the methods used and references to them in each section, as well as some elaboration in the Supplementary Data section. The primary goal of the research was to better establish the paleoenvironmental history and age of the lacustrine and wetland sediments near the bottom of the sequence, including possible paleohydrological changes bracketing the YD episode.
A further aim of this investigation was to conduct multiple time-series analyses in search of evidence in the Lake Hind sequence for a cosmic (extraterrestrial [ET]) event at the onset of the YD about 12.8 cal ka, referred to as the YDB (Younger Dryas Boundary) event and found in many sections across North America, including previously in the Lake Hind basin (Firestone et al., Reference Firestone, West, Kennett, Becker, Bunch, Revay, Schultz, Belgya, Kennett and Erlandson2007, but also see Paquay et al. [Reference Paquay, Goderis, Ravizza, Vanhaeck, Boyd, Surovell, Holliday, Haynes and Claeys2009] for an alternative view). Although the YD cosmic impact hypothesis is supported by considerable data, it remains controversial (Surovell et al., Reference Surovell, Holliday, Gingerich, Ketron, Haynes, Hilman, Wagner, Johnson and Claeys2009; Daulton et al., Reference Daulton, Pinter and Scott2010; Haynes et al., Reference Haynes, Boerner, Domanik, Lauretta, Ballenger and Goreva2010; Scott et al., Reference Scott, Pinter, Collinson, Hardiman, Anderson, Brain, Smith, Marone and Stampanoni2010; Pinter et al., Reference Pinter, Scott, Daulton, Podoll, Koeberl, Anderson and Ishman2011; van Hoesel et al., Reference Van Hoesel, Hoek, Pennock and Drury2014; see list of articles on “Pros” and “Cons” in Supplementary Table 1). Two recent reviews provide an update of the controversy (Kennett et al., Reference Kennett, Kennett, LeCompte, West, Goodyear and Moore2018; LeCompte et al., Reference LeCompte, Adedeji, Kennett, Bunch, Wolbach, Goodyear and Moore2018). The impact hypothesis is based on evidence from many sites in North America, Greenland, Europe, and other continents, suggesting that Earth collided with fragments of a large disintegrating comet ~12.8 cal ka (Firestone et al., Reference Firestone, West, Kennett, Becker, Bunch, Revay, Schultz, Belgya, Kennett and Erlandson2007; Wolbach et al., Reference Wolbach, Ballard, Mayewski, Adedeji, Bunch, Firestone, French, Howard, Israde-Alcántara and Johnson2018a, Reference Wolbach, Ballard, Mayewski, Parnell, Cahill, Adedeji, Bunch, Domínguez-Vázquez, Erlandson and Firestone2018b; Pino et al., Reference Pino, Abarzúa, Astorga, Martel-Cea, Cossio-Montecinos, Navarro and Lira2019). The recent discovery of a crater under the Hiawatha glacier in northern Greenland (Kjær et al., Reference Kjær, Larsen, Binder, Bjørk, Eisen, Fahnestock and Funder2018) has led to speculation that it may be related to the YD event. Firestone et al. (Reference Firestone, West, Kennett, Becker, Bunch, Revay, Schultz, Belgya, Kennett and Erlandson2007) also inferred that an extraterrestrial impact event may have destabilized the LIS and caused glacial lake ice dams to fail; this may have included ice-marginal Glacial Lake Hind as well as lakes upstream from it to the west. Another result of this ET event may have been that it triggered Northern Hemisphere cooling, marking the onset of the YD cooling episode. It has also been proposed to have triggered widespread biomass burning (Wolbach et al., Reference Wolbach, Ballard, Mayewski, Adedeji, Bunch, Firestone, French, Howard, Israde-Alcántara and Johnson2018a, Reference Wolbach, Ballard, Mayewski, Parnell, Cahill, Adedeji, Bunch, Domínguez-Vázquez, Erlandson and Firestone2018b) and to have contributed to late Pleistocene megafaunal extinctions and human cultural shifts/population declines (Anderson et al., Reference Anderson, Goodyear, Kennett and West2011).
In this paper, we reconstruct the paleoenvironmental history of Glacial Lake Hind, and explore whether its stratigraphic record contains evidence of hydrological destabilization by the YDB impact event, perhaps by failure of the bounding ice dam or changes in proglacial lakes upstream from Lake Hind. Many new AMS ages and data spanning the YD make the Lake Hind sedimentary sequence particularly important. Furthermore, the sequence is among the farthest north and closest to the LIS of all sequences examined for evidence of the YDB cosmic impact event (Firestone et al., Reference Firestone, West, Kennett, Becker, Bunch, Revay, Schultz, Belgya, Kennett and Erlandson2007; Kennett et al., Reference Kennett, Kennett, Culleton, Aura Tortosa, Bischoff, Bunch and Daniel2015).
GENERAL DESCRIPTION OF REGIONAL SEDIMENTS AND STRATIGRAPHY
Quaternary sediments in the Lake Hind basin include calcareous clayey to silty diamictons (tills) up to 75 m thick that underlie lacustrine, fluvial, and eolian sediments (Fig. 2B; Sun, Reference Sun1996; Sun and Teller, Reference Sun and Teller1997; Matile and Keller, Reference Matile and Keller2004c); the tills overlie Mesozoic shale. The modern surface surrounding the Lake Hind basin varies from hummocky to glacially streamlined, and is overlain in places by glaciofluvial sediments (Matile and Keller, Reference Matile and Keller2004c). There are glaciofluvial sediments along the margin of the Lake Hind basin that consist of interbedded fine-grained sand, and a small amount of gravel, silt, and clay that were deposited as deltas and subaqueous fans and by turbidity currents in the lake (Fig. 2; Sun, Reference Sun1996; Sun and Teller, Reference Sun and Teller1997; Matile and Keller, Reference Matile and Keller2004b, Reference Matile and Keller2004c). Offshore glaciolacustrine sediments, 1 to 30 m thick, lie basinward of this, and include massive to laminated clay, silt, and sand (fig. 3–11b in Sun, Reference Sun1996; Sun and Teller, Reference Sun and Teller1997; Matile and Keller, Reference Matile and Keller2004b, Reference Matile and Keller2004c). In places, the surface of the basin is covered by eolian sand with dune and blowout forms present in many areas (Fig. 2; David, Reference David1977; Running et al., Reference Running, Havholm, Boyd and Wiseman2002). Adjacent to and above the modern floodplain of the Souris River, south of Glacial Lake Hind is a broad zone of scoured till (Fig. 2B). Alluvial deposits are present along the modern Souris River, Assiniboine River, and Pipestone Creek.
STRATIGRAPHY OF THE FLINTSTONE HILLS SEQUENCE
The stratigraphy near the study site was described and interpreted by Boyd (Reference Boyd2000a, Reference Boyd2003), Boyd et al. (Reference Boyd, Running and Havholm2003), Running et al. (Reference Running, Havholm, Boyd and Wiseman2002), Havholm and Running (Reference Havholm and Running2005), and Havholm et al. (Reference Havholm, Bergstrom, Jol, Running, Bristow and Jol2003), with the eolian Holocene sequence being the focus of those studies. Figure 3 shows the exposed section, and provides a general description of the sequence discussed in this paper (Fig. 3B), with a correlation to the nearby section studied by Boyd (Reference Boyd2003) and others (Fig. 3A). Unlike previous studies, our research focusses on the 2.8 m of silty sediment and organic deposits lying below the eolian sediments named units B to D by Boyd (Reference Boyd2003; Fig. 3A). The section we studied is shown in Figure 4 with locations of radiocarbon ages and a Bayesian age-depth model for the sequence.

Figure 4. Bayesian age-depth model. OxCal, a Bayesian statistical program, calculated >12 million possible age-depth models and determined the best fit (mean) for the set of radiocarbon ages, analogous to using a polynomial trendline in other types of age-depth modeling. Darker colors along distribution curve represent Bayesian-modeled ages that comprise the age-depth model; adjacent lighter colors represent unmodeled calibrated radiocarbon ages. Small open circles represent the mean Bayesian-modeled ages that are derived from the calibrated radiocarbon dates that are listed at right and approximately correspond to the depth of the dots on the Bayesian curve. The blue, dashed lines mark the Younger Dryas Boundary (YDB) Impact Event. Orange distribution curves represent dates rejected by OxCal as outliers and are not included in the Bayesian model (17,190 not shown). Depths are below top of peat (0 cm). Colored background represents general stratigraphy and subunits; tan, sand of Unit A; blue, organic silt of subunit B1; gray, peat of subunit B2. Selected ages are shown at stratigraphic breaks along age envelope determined from Bayesian analysis, including a Bayesian-calculated age of ~12,766 ± 61 cal yr BP for the YDB impact layer in the thin sandy zone from −33 to −30 cm. Concentrations of spherules (MS), nanodiamonds (NDs), and iridium (Ir) plotted by depth; bars represent thickness of sampled interval; abundance scales at top and bottom. Program version: OxCal 4.3.2 (Bronk Ramsey, Reference Bronk Ramsey1997).
The lower 2.8 m of the exposed sequence consists of four Units (A–D; Fig. 3, column B) distinguished on the basis of lithological properties; Unit B is subdivided into several subunits, B1–3. Because the lower part of Unit A lay mostly below the level of the Souris River and was saturated, the description is general and based partly on hand augering. Note that all depths relate to the top of the peat (subunit B2), designated as 0, and values are negative below it and positive above. Our Units A and B were called unit A1 by Boyd et al. (Reference Boyd, Running and Havholm2003) and Boyd (Reference Boyd2003; Fig. 3).
Unit A (−150 to −43 cm)
Unit A in Figure 3 (column B) is the lowest unit exposed at this site and is about a meter thick. It is a massive very-fine- to fine-grained sand that is slightly coarser near the bottom and silty in the upper 25 cm where there are small organic fragments. Based on our correlation, this unit lies in Boyd's (Reference Boyd2003) unit A1 in Figure 3 (column A). The base of Unit A was not reached in any studies. Only the upper 20 cm lies above the water table, and rapid deformation of the saturated sediment below precluded an accurate description of the stratigraphic details. The contact between Units A and B1 is at a depth of −43 cm below the top of the peat in overlying Unit B. Studies by Sun (Reference Sun1996) and dozens of boreholes filed with the Manitoba Department of Natural Resources’ Groundwater Section reveal a 20- to 30-m-thick sequence of sand, silt, and clay overlying till throughout this part of the Lake Hind basin.
Unit B (−43 to + 7 cm)
Unit B is about a half meter thick and is composed of several different lithologies; it is divided into three subunits, B1–3, from bottom to top, with its base at −43 cm. The contact with Unit A is distinct and irregular, perhaps due to deformation by loading on the underlying unit.
Subunit B1 is ~20 cm of organic-rich silty sediment. The lower 10 cm of subunit B1 is a poorly laminated, organic-bearing, grey clayey silt that grades upward into dark brown laminated to fissile very organic-rich silty clay with abundant vegetal matter including leaves and stems. Boyd et al. (Reference Boyd, Running and Havholm2003) noted that there are some millimeter-scale symmetrical ripples of sand in this unit. As measured in the laboratory, there is a thin sandy zone of dark, cemented, fine organic detritus near the middle of subunit B1 at −33 to −30 cm.
Subunit B2 is a peat that overlies B1 at −22 cm and is composed of fissile, fibrous organic matter (peat), wood, distinct leaves, needles, stems, and seeds (Fig. 5). Its thickness is variable from 20 to 30 cm. Several silt and clay-rich laminae are present in the peat; the thickest is 3–9 cm just below a depth of −16 cm and contains what may be small (10 to 15 cm diameter) footprint depressions filled by the overlying peat and small nodules of secondary carbonate. The peat is overlain by a 5–7-cm-thick marl (subunit B3; Fig. 3 and 5) that lies on a polygonally fractured surface in the peat. Buried peat has not been reported at any other locations except in exposures along the Souris River, although “coal” grains reported in some water well logs in the area could be a misinterpretation of peat.

Figure 5. (color online) Photograph showing silty clay to clayey silt of subunit B1 overlain by silty peat (subunit B2) and thin marl of subunit B3, and then by silty sand of the lower part of Unit C. The YD boundary at 12.7–12.8 cal ka is near the tip of the knife.
Unit C (+7 to + 120 cm)
The lower 70 cm of this unit is grey sandy silt that coarsens upward to silty medium-rained sand (Fig. 5). Mollusks and plant fragments occur throughout this part of the unit (Boyd, Reference Boyd2003). Above this is a 0- to 3-cm-thick, thinly laminated, marly, sandy silt that is overlain by ~40 cm of coarsening-upward massive calcareous sandy silt to silty sand containing scattered plant remains and large fragments of wood. In places, the marly part of this unit has diapiric structures that intrude the overlying unit by up to 12 cm. Our Unit C probably is equivalent to unit A2 in Figure 3 column A.
Unit D
The upper part of the cutbank along the Souris River consists mainly of well-sorted sand, which we call Unit D; it exceeds 10 m in thickness at the study site and is exposed up to the modern surface (Fig. 3). Boyd's (Reference Boyd2003) units B, C1, C2, and D in Figure 3 are interpreted as equivalent to Unit D in this study. We did not investigate this unit and it is not shown in Figure 4; Figure 3A shows this part of the sequence with its many buried soils. This unit corresponds to the “early dune” and “modern dune” units described by Boyd (Reference Boyd2003), Boyd et al. (Reference Boyd, Running and Havholm2003), Running et al. (Reference Running, Havholm, Boyd and Wiseman2002), and Havholm and Running (Reference Havholm and Running2005) and consists of dunes, sand sheets, and interdunal wetland sediments (Running et al., Reference Running, Havholm, Boyd and Wiseman2002). Boyd's (Reference Boyd2003) unit B (the lower part of our Unit D) is characterized by eastward-dipping cross-strata of sand and disseminated organic material (Boyd et al., Reference Boyd, Running and Havholm2003) that disappear upward where the sand becomes massive (Running et al., Reference Running, Havholm, Boyd and Wiseman2002). The upper part of our Unit D consists of massive beds of sand with occasional 5- to 20-cm-thick paleosols (Fig. 3 column A), erosional unconformities, and local 2- to 5-mm-thick clay laminae (Boyd et al., Reference Boyd, Running and Havholm2003) and, in places, ripples (Running et al., Reference Running, Havholm, Boyd and Wiseman2002). The paleosols are enriched in organic matter (Running et al., Reference Running, Havholm, Boyd and Wiseman2002).
RADIOCARBON AGES AND RATES OF SEDIMENTATION
There are 35 AMS radiocarbon ages from the Flintstone Hill stratigraphic section (Table 1 and Supplementary Table 2): 25 dates are new and 10 were done as part of previous studies that focussed on the upper (eolian) part of the sequence (e.g. Boyd et al., Reference Boyd, Running and Havholm2003). All but one of the new ages are on macrobotanical material, mainly seeds (Table 1 and Supplementary Figure 1). A. Telka and J. Kennett carefully selected plant macrofossils that are generally considered to be reliable indicators of materials neither transported long distances nor reworked from older sediments. To avoid the potential problem of age contamination in plants that may incorporate old carbon from dissolved bicarbonate or CO2 to construct their tissue (the “hard-water effect”)—which may yield an age older than that of the encapsulating sediment (Teller, Reference Teller1989; Grimm et al., Reference Grimm, Maher and Nelson2009; Marty and Myrbo, Reference Marty and Myrbo2014)—most dated materials were from emergent aquatic plants. These typically provide the best reflection of the actual age of the macrophyte and encompassing sediment (e.g., Marty and Myrbo, Reference Marty and Myrbo2014), so atmospheric-fixing emergent plants such as Menyanthes trifoliata (buckbean), Schoenoplectus tabernaemontani (bulrush), and Carex (sedges) were used for many of our dates (Table 1). Ages that lie within the Bayesian envelope in Figure 4 are mainly from emergent plants. In some cases, however, seeds from submergent plants were included in the pool of dated materials (Table 1), and many ages from those samples are considered anomalous (statistically invalid), although there is no obvious direct relationship between age reliability and the relative percentages of emergent and submergent seeds in the dated sample.
Table 1. Accelerator mass spectrometry (AMS) radiocarbon and calibrated ages (Reimer et al., Reference Reimer, Bard, Bayliss, Beck, Blackwell, Ramsey, Buck, Cheng, Edwards and Friedrich2013) plotted against depth in relation to top of peat at 0. Material dated shown. Beta, Beta Analytical Labs; UCIAMS, University California Keck Carbon Cycle Accelerator Mass Spectrometry Lab at Irvine; TO, IsoTrace Lab at University of Toronto; PSUAMS, Pennsylvania State University AMS Facility; S, submergent plants; E, emergent plants.

a A, Running et al. (Reference Running, Havholm, Boyd and Wiseman2002); B, Firestone et al. (Reference Firestone, West, Kennett, Becker, Bunch, Revay, Schultz, Belgya, Kennett and Erlandson2007); C, this study; Freeman (Reference Freeman2006).
Figure 4 shows a Bayesian analysis of 28 ages in Units A and B in the lower part of the sequence derived from Supplementary Table 2. Using the IntCal 13 calibration curve in the OxCal Bayesian analytical program (version 4.3.2), we calculated >12 million possible age-depth models to find the best fit (average model). All age-depth models have limitations but, currently, Bayesian age-depth modeling is considered more robust and flexible than non-Bayesian models (Parnell et al., Reference Parnell, Haslett, Allen, Buck and Huntley2008; Bronk Ramsey, Reference Bronk Ramsey2009), leading to the increased use of Bayesian analytical programs in multiple disciplines. Of 25 dates across the studied interval, the program determined that seven ages (orange in Figure 4) represent major age reversals, meaning that they are substantially older than dates lower in the sequence, thus violating the law of geological superposition; one age in subunit B2 was substantially younger than the adjacent strata. Consequently, these ages were not included in the Bayesian model, because they do not reflect statistically plausible true ages of sediment at those depths.
Six of the eight rejected ages occur in the subunit B1 silt that was deposited just prior to and after the onset of YD climate change. As elaborated later, deposition of subunit B1 may have coincided with turbulent hydrological conditions in the Lake Hind basin that produced erosion and redeposition of older organic material from the surrounding watershed, so may explain the presence of these anomalous age reversals. Alternatively, some of these old ages may relate to having included subaquatic organics for dating (Table 1), which may have included old carbon from bicarbonate (Marty and Myrbo, Reference Marty and Myrbo2014; Teller, Reference Teller1989).
In summary, the Bayesian analysis provides calculated ages for key boundaries and intervals in the sequence (Fig. 4 and Table 1), as follows.
(1) Unit A
The 24-cm-thick sandy interval studied has dates that span 13,130 ± 18 to 13,076 ± 24 cal yr BP, indicating that the rate of sediment accumulation in this 54-cal-yr interval was very rapid, 2.2 yr/cm (4.63 mm/yr).
(2) Subunit B1, lower 10 cm
The bottom and top of this poorly laminated, organic-rich, silty interval have Bayesian calibrated ages of 13,076 ± 24 and 12,766 ± 61 cal yr BP. There are five radiocarbon dates that are anomalously old in this part of Unit B, and only two dates that are statistically acceptable (Fig. 4). The age span of this 10-cm interval is ~310 calibrated yr, for a rapid deposition rate of 31 yr/cm (0.32 mm/yr).
(3) Subunit B1, middle 3 cm
This thin interval at −33 to −30 cm is a hard, organic-rich sand with one calibrated radiocarbon age of 12,630 ± 78 cal yr BP (PSUAMS-88701, 10,470 ± 35 14C yr BP) and a similar calculated Bayesian age of ~12,766 ± 61 cal yr BP (range = 12,827–12,705 cal yr BP; Fig. 4, Supplementary Table 2). The age span of this 3-cm interval is 256 yr, with a very slow deposition rate of 85 yr/cm (0.12 mm/yr), the slowest in the profile investigated. As described below, the start of this interval marks the initial deposition of YDB-impact-related proxies and is approximately the same age (12,835–12,735 cal yr BP) as that of the YDB layers at ~40 other sites on four continents, as reported in Kennett et al. (Reference Kennett, Kennett, Culleton, Aura Tortosa, Bischoff, Bunch and Daniel2015).
(4) Subunit B1, upper 8 cm
This subunit is an organic-rich, laminated, very silty clay and has a Bayesian-calculated age at the top of ~12,287 ± 111 cal yr BP, which closely matches one of the uppermost calibrated radiocarbon ages of 12,298 ± 135 cal yr BP near the top of B1, and is close to the average of the other two ages (Fig. 4, Supplementary Table 2). The age span of the upper part of subunit B1 is 223 yr, yielding a rapid deposition rate of 28 yr/cm (0.36 mm/yr), which is similar to the lower part of subunit B1, but more rapid than in the intervening 3-cm interval.
(5) Subunit B2
This subunit is composed of silty peat with a Bayesian-calculated age at its top (0 cm) of ~10,961 ± 127 cal yr BP (Fig. 4, Supplementary Table 2). This upper boundary age closely matches the calibrated radiocarbon age of 10,893 ± 123 cal yr BP (UCIAMS-88697, 9530 ± 30 14C yr BP; Supplementary Table 2). The age span of this peat is 1326 cal yr, for a slow deposition rate of 60 yr/cm (0.17 mm/yr).
(6) Units C and D
There are three radiocarbon ages in fluvial Unit C. The oldest age near the base of Unit C (10,358 ± 60; UCIAMS-88696) is a few hundred years younger than that of the age at the top of the underlying peat (Table 1). The in situ willow root in the top of Unit C is dated at 6031 ± 86 (TO-10272) and reflects the age of the early stages of dune activity at this site. Other ages in the overlying eolian dune sediment and soils of Unit D are discussed by Boyd (Reference Boyd2000a, Reference Boyd2003), Running et al. (Reference Running, Havholm, Boyd and Wiseman2002), and Boyd et al. (Reference Boyd, Running and Havholm2003).
PALEOENVIRONMENTAL PROXIES IN LAKE HIND SEDIMENTS
Pollen
Figure 6A is a summary of the new pollen data in Units A and B in the sequence. Figure 6B is a pollen profile from Boyd (Reference Boyd2000a, Reference Boyd2003) and Running et al. (Reference Running, Havholm, Boyd and Wiseman2002) from a section located a few meters away from the section described in this paper that stratigraphically overlaps the top of Figure 6A by about 10 cm. In general, these data provide new insight into the earliest vegetation of the Lake Hind basin and highlight some of the limitations of interpreting pollen from proglacial lake sediments. These limitations largely result from the high percentage of pre-Quaternary palynomorphs present in the pollen assemblage, particularly between −121 and −30 cm (Figure 6A). In this interval, reworked pollen comprises up to 80% of the total assemblage and is dominated by cf. Taxodiaceae (Taxodiaceaepollenites) with minor quantities of cf. Tsuga, cf. Corylus, cf. Polypodiaceae types, and varied but trace numbers of extinct forms such as Aquilasporites, Laevigatosporites, Momipites, Caryapollenites, and Pityosporites.

Figure 6. Abundance of pollen and spores in Flintstone Hill sequence. (A) New data from upper part of Unit A, B1, and lower part of B2; note relatively high content of pre-Quaternary pollen in Unit A. (B) Data from Boyd (Reference Boyd2003) from equivalent units in this study.
The most likely source of pre-Quaternary palynomorphs in these sediments is from Paleocene lignite in the ancestral Souris River valley of south-central Saskatchewan that terminated in Glacial Lake Hind (Fig. 2). Pollen and spores from these deposits are described in Frank (Reference Frank1999) and Frank and Bend (Reference Frank and Bend2004), and our reworked assemblage in the lower Lake Hind sediments corresponds closely to those from the top of the Souris Lignite (Ravenscrag Fm). This can be seen in the dominance of Taxodiaceaepollenites, triporate angiosperm pollen (e.g., our “cf. Corylus” type) and various conifer and fern pollen types (fig. 4 in Frank and Bend, Reference Frank and Bend2004). The high percentage of Paleocene palynomorphs below −33 cm coincides with a high rate of sedimentation and a greater abundance of charcoal and coal particles in the lower part of the section (Fig. 6 and Supplementary Table 3), suggesting that these are related to changes in hydrological conditions or to the drainage basin supplying sediment to Glacial Lake Hind. Pre-Quaternary pollen is also high in the lower part of subunit B1.
Interpretation of the vegetation growing in the local and regional zones surrounding the site during the late Quaternary is complicated by: (1) the small numbers of pollen present in the lower part of the sequence where there is a high rate of sediment influx (Fig. 4), (2) the relatively high numbers of pre-Quaternary pollen (Fig. 6A) that originated from the Souris Valley lignite, and (3) the similarity of pre-Quaternary pollen with more recent types produced by conifers, many species of deciduous trees and shrubs, and a variety of spores produced by ferns. Nevertheless, it is possible to draw some tentative conclusions about vegetation during the early stages of Glacial Lake Hind. The lower part of the sequence at −121 to −79 cm (>13 cal ka) contains relatively low numbers of arboreal pollen and has a higher representation of herbs (especially sedges [Cyperaceae]) and, to a lesser extent, grasses (Poaceae). One interpretation is that this interval records a brief period of treeless vegetation reminiscent of the “tundra-like” interval rarely seen in other pollen profiles in the region (e.g., Ritchie, Reference Ritchie1976). Alternatively, it is possible that the relatively low representation of arboreal vegetation is due to high water levels in the Hind basin and, consequently, greater distances between the site and upland vegetation communities. Support for the latter idea comes from the decline of aquatic pollen such as Potamogeton and the concomitant increase in pollen from deciduous and coniferous trees through time (Fig. 6A).
In general, our new pollen data indicate that a mix of conifers (especially Picea and Larix) and deciduous trees (especially Populus and Quercus) covered the uplands surrounding the Lake Hind basin throughout the period of study from ~13.1 to 10 cal ka. This wooded environment was probably fairly open and dry as suggested by the persistence of Ambrosia, Artemisia, and grasses in the pollen profile. Similar pollen assemblages—interpreted as evidence of open white spruce parkland vegetation—are recorded at sites across the northern Great Plains during the late-glacial period (Yansa, Reference Yansa2006).
Diatoms
Five samples in Units A and B were examined for diatoms by Dr. Maria Valez (Department of Geology, University Regina, Regina, Saskatchewan) to determine if conditions such as water temperature, clarity, and turbidity allowed these microorganisms to live in waters of the Lake Hind basin. Standard procedures of Battarbee (Reference Battarbee and Bergland1986) were used to remove and identify these siliceous microfossils at sample depths of −57 to −55, −45 to −43, −33 to −30, −27 to −26, and −24 to −23 cm. No diatoms were found in any samples, except for several Aulacoseira in the sample at −45 to −43 cm. The explanation may be that living conditions were unfavorable for these organisms, perhaps because waters were too turbid and too cold; this was the interpretation for the absence of siliceous microfossils in other early post-glacial sediments in the region, with Aulacoseira taxa indicative of deeper cold waters (e.g., Rühland et al., Reference Rühland, Rentz, Paterson, Teller and Smol2018; Risberg et al., Reference Risberg, Sandgren, Teller and Last1999; Teller et al., Reference Teller, Yang, Boyd, Buhay, McMillan, Kling and Telka2008, Reference Teller, McGinn, Rajapara, Shukla and Singhvi2018). It is also possible that any diatoms deposited were diluted by the rapid influx of sediment.
Macrofossils
A. Telka and J. Kennett sorted and identified macrofossils during the process of selecting materials for radiocarbon dating. The main trends reconstructed from pollen are generally supported by the plant macrofossil data (see Supplementary Table 3). In the lowest stratigraphic unit (Unit A, below −43 cm), plant remains are dominated by Equisetum (horsetail), bryophytes (mosses), various Cyperaceae species (sedges), and other emergents (e.g., Juncus). Detrital pre-Quaternary coal particles are abundant. Arboreal remains of trees include small quantities of Picea (mostly charred) that more than likely were transported atmospherically from forest fires in the surrounding uplands (Pisaric, Reference Pisaric2002). These plant materials, in addition to the sandy nature of Unit A, suggest shallow-water conditions were present in the Lake Hind basin during this time.
Based on the Bayesian radiocarbon curve (Fig. 4), 22-cm-thick subunit B1 spans ~800 yr from ~13,076 to 12,287 cal ka. This interval consists mainly of clayey silt with abundant organics that become more clayey upward and very rich in organic material, including well-preserved leaves and stems; peat overlies this (subunit B2). The presence of articulated ostracodes in the lower part of subunit B1 and some seed species with delicate bristles (e.g., see dated Scirpus in Supplementary Fig. 1F), argue for a relatively quiet-water environment for this interval. Chara (stonewort) oogonia appear at the base of subunit B1 with the greatest abundance in the interval −39 to −37 cm (Table S3). Chara is a freshwater algae that prefers alkaline, hard-water habitats, and can form dense, extensive growths attached but not rooted to the substrate of newly formed water bodies. These charophytes can produce underwater meadows, which restrict growth of other aquatic macrophytes. They are often first to colonize newly formed aquatic environments since they are fast maturing compared to the slower growth rate of aquatic plants in these habitats (Moore, Reference Moore1986). They usually are abundant in shallow water especially under favorable conditions of clear water (Wood, Reference Wood, Wood and Imahori1965). Evidence of clear-water conditions is corroborated by the presence of freshwater sponges at the base of Unit B (Table S4). Sponges are filter feeders requiring relatively clear-water conditions for filtration (Frost, Reference Frost, Smol, Birks and Last2003). Plant and, as noted below, insect macrofossils portray a shallow-water environment of a calm, clear lake. Boyd et al. (Reference Boyd, Running and Havholm2003, p. 597) concluded waters responsible for depositing this part of the sequence in a nearby section (unit A1 in stratigraphic section A; Fig. 3) were “carbonate-rich, warm, shallow and therefore not directly fed by meltwater.” Furthermore, ages that lie within the Bayesian envelope in Figure 4 are almost all from emergent plants, rather than submergent plants that produced numerous anomalous ages, so it can be argued that the identified emergent plants, and attached algae Chara, provide a reliable indication of the paleoenvironmental conditions at this time in Lake Hind.
In contrast, a more turbid environment is suggested by the high rate of sedimentation and the presence of a number of anomalously old dates (Fig. 4) in subunit B1 that may reflect the reworking of older sediments. Except for ostracodes in the lower half of subunit B1 (Supplementary Table 4), shelled invertebrates are uncommon and diatoms are absent, and that argues for unfavorable conditions like those in a murky turbid environment with a high sediment influx. Although articulated ostracodes and bristles on some seeds argue to the contrary, it is possible that species indicative of calm, clear lake conditions were transported from upstream areas. It is more likely, however, that indicators of turbid conditions represent only brief times when muddy floodwaters were injected into a clear and quiet-water lake during this 310-yr period. Thus, the environment of deposition for the lower 10 cm of subunit B1 may have been a shallow-water lake on a floodplain or delta favorable for organisms that required relatively warm, low-energy, carbonate-rich waters, but had occasional influxes of muddy flood waters from the paleo-Souris or paleo-Assiniboine Rivers (Fig. 2). This type of environment is common along many rivers such as the Red, Mackenzie, and Mississippi, and in their deltas, and could account for “anomalous” organics, minerals, and elements in Unit B that periodically were added to the lacustrine sediments.
The decline of Chara above the lower part of Unit B1, at −33 to −30 cm, marks the onset of YD cooling and signals the beginning of rooted emergent and submergent aquatic plant growth. These emergent plants include Carex spp. (sedges), C. rostrata, Eleocharis palustris (spike-rush), Schoenoplectus tabernaemontani (bulrush), Hippuris vulgaris (mare's-tail), and Menyanthes trifoliata (buckbean); submergents being represented by species of Potamogeton (pondweed), Myriophyllum sibiricum (watermilfoil), and Sparganium (bur-reed; Supplementary Table 3).
Insect fossils are equally abundant as plant fossils at the base of subunit B1, with the richest assemblage occurring at −39 to −37 cm (Supplementary Table 4). They include shoreline or near shoreline aquatic members of Saldula (shore bug), Cercyon (water scavenger beetle), Dytiscidae (predaceous diving beetle), Ochthebius (minute moss beetle), Olophrum consimile (rove beetle), Cyphon (marsh beetle), Trichoptera (caddisflies), Tipula (crane flies), Chironomidae (midges), crustaceans of the cladoceran Daphnia and Simocephalus (water fleas), arachnid Hydrozetes (oribatid mite), and ostracodes. In the −33 to −30 cm interval, many of these insect types are replaced mainly by aquatic leaf beetles (Donacia/Plateumaris; Supplementary Table 4), whose larval forms tap into submerged stems of aquatic host plants for food and oxygen; the adults typically feed on emergent vegetation in standing water. Crustaceans, arachnids, and ostracodes also diminish or are absent. This change in insect fossils coincides with a change in mineralogical and elemental composition and with the onset of YD climate change (Fig. 4).
The change to peat accumulation (subunit B2) at −22 cm coincides with a change in the macrofossil assemblage—namely, the dominance of Menyanthes trifoliata and continued abundance of bryophytes ( ≥90%; −12 to −22 cm) in subunit B1 into B2 (Supplementary Table 3). At the base of the peat, emergent Carex spp. occur along with submergents of Potamogeton, Sparganium, and abundant Myriophyllum sibricum. Trees are represented by Picea (mostly seeds and charred needles) and twigs or persistent buds of Salix (Supplementary Table 3). These plant taxa either decline or are absent in the upper peat of subunit B2 (at −12 to 0). The abundance of Menyanthes in this interval may be due to periodic flooding from the ancestral Souris or Assiniboine Rivers (Boyd, Reference Boyd2003), as further indicated by the presence of clastic laminae with occasional ripples. The sparse macrobotanical remains in the marl overlying the peat (subunit B3) may be attributed to poor organic preservation during the drier climatic regime that formed this evaporative accumulation.
Summary of paleoenvironmental interpretations of fossil data
The macrobotanical evidence in Lake Hind sediments shows some notable changes in the lower part of the sequence prior to 11 cal ka, which were deposited in a shallow fluviolacustrine to wetland environment. These changes occur mainly (1) at −43 cm (the base of subunit B1, dated to ~13.1 cal ka); (2) at −35 cm in the middle of subunit B1 just prior to the YD onset at ~12.8 cal ka; (3) at −22 cm, the bottom of subunit B2 when peat began to accumulate at 12.3 cal ka; and (4) at the top of the peat at ~11 cal ka. Subsequently, increasingly dry conditions developed (Boyd, Reference Boyd2003), with marl deposited in an evaporative lowland phase (subunit B3), followed by the accumulation of fluvial (Unit C) and eolian (Unit D) sediments. These environmental changes are in general agreement with other studies in the region, including the high-resolution, multiproxy record from Kettle Lake in nearby North Dakota reported by Grimm et al. (Reference Grimm, Donovan and Brown2011).
Pollen in the lower part of the sequence (Unit A) is dominated by pre-Quaternary palynomorphs attributable to erosion of Paleocene rocks to the west by the Souris River. These palynomorphs continue to be dominant in the lower part of overlying subunit B1, suggesting a continued contribution by the Souris River at least until 12.8 cal ka and probably until after 12.3 cal ka when peat began to be deposited. A sparse population of organisms and sandy sediment in the period before 13.1 cal ka suggests an unfavorable turbulent living environment, presumably dominated by inflow from the Souris River system. However, there is a conflict of proxy data in overlying subunit B1, with some macrofossils, a high rate of sedimentation, a continued abundance of pre-Quaternary pollen, a number of anomalously old dates on organics, and an absence of diatoms suggesting that conditions in the Lake Hind basin for a few centuries after ~13.1 ka reflect a continued turbulent period of high fluvial influx into a lacustrine basin. However, many macrofossils in this part of the sequence indicate conditions were that of a shallow quiet-water lake. This difference in environmental interpretation between turbid conditions and a shallow clear lake phase in the few centuries before 12.8 ka might be explained by an environment (1) where there were occasional flood incursions into a quiet-water lake during this period or (2) where some of the quiet-water macrofossils in subunit B1 were transported from clear shallow lakes upstream in the watershed and redeposited in Lake Hind during a turbid lake phase. In either case, after ~12.8 cal ka, the basin became dominated by rooted aquatics of emergent and submergent species in a quiet-water lacustrine environment. A 256-yr period of slowly accumulating sandy organic sediment (middle part of subunit B1) followed the YDB at ~12.8 cal ka, which we interpret to reflect a low-water phase of the lake. This was followed by deposition of organic-rich silty clay (upper part of subunit B1) in quiet-water conditions of a shallow lake until 12.3 cal ka and then by bog-like conditions, when peat (subunit B2) was deposited, until ~11 cal ka. As discussed later, there are some distinct mineralogical and element changes just before and after 12.8 ka that may help explain changing paleoenvironmental conditions in Units A and B. Overall, pollen in the sequence indicates a mix of conifer (especially Picea and Larix) and deciduous trees (especially Populus and Quercus) in the surrounding region until after 11 cal ka.
BULK MINERALOGY AND ORGANIC CARBON
To identify the principal minerals in the Lake Hind sequence, 29 samples were analyzed by Diaz (Reference Diaz2012) for bulk mineralogy, using 33 slides prepared for X-ray diffraction and JADE 7.0 software analyses. Quartz is present throughout the sequence. As can be seen in Figure 7, gypsum/anhydrite is high in Unit B between −50 and 0 cm, and nearly absent above and below it. Calcite and dolomite are present in Units A and C and in the marl in the top of Unit B, but largely absent in the organic-rich part of Unit B. The organic content in Unit B was determined by combusting the sample at 550°C, and shows an overall upward increase in Unit B. Asterisks in Figure 7 note particularly high values of charcoal identified by J. Kennett. Supplementary Table 3 also shows a large increase in charcoal in Unit C—both occur in sediments related to large fluvial episodes.

Figure 7. Relative abundance of organic matter and qualitative abundance of selected minerals in comparison to quartz based on XRD patterns (after Diaz, Reference Diaz2012). Asterisks indicate relatively high content of charcoal in samples at −12 to −14, −18 to −20, −28 to −33 (YDB layer), −35 to −37, and −37 to −39 cm.
Coal particles were identified visually in the lower part of the exposed Unit A sand. An investigation of borehole logs within 10 km of the Flintstone Hill section (filed with the Groundwater Section of the Manitoba Department of Natural Resources) shows nearly every log in this area to the north of the Souris River reports coal grains in sand at varying depths of 1 to 14 m; clay and sand underlie these coaly sand units to depths of up to 20 m. In some cases, it is possible that some of the grains of “coal” may be fragments of peat from our Unit B mixed with the sand of other units. On the uplands south of Glacial Lake Souris, borehole logs do not report sand nor grains of coal; however, upstream along the Souris River, Lord (Reference Lord1991) reports abundant lignite in sediments of Glacial Lake Souris <100 km to the south.
MAGNETIC MINERALS AND THEIR INTERPRETATION
We selected 32 samples at varying intervals from −71 to + 118 cm in the sequence, extracting magnetic grains using a neodymium magnet. We followed the protocol described in previous studies (Firestone et al., Reference Firestone, West, Kennett, Becker, Bunch, Revay, Schultz, Belgya, Kennett and Erlandson2007; Israde-Alcántara et al., Reference Israde-Alcántara, Bischoff, Domínguez-Vázquez, Li, DeCarli, Bunch, Wittke, Weaver, Firestone and West2012; LeCompte et al., Reference LeCompte, Goodyear, Demitroff, Batchelor, Vogel, Mooney, Rock and Seidel2012; Wittke et al., Reference Wittke, Weaver, Bunch, Kennett, Kennett, Moore, Hillman, Tankersley, Goodyear and Moore2013) and described in the “Methodology” section of the Supplementary Data. Scanning Electron Microscopy (SEM) was used to examine surface textures and Energy Dispersive Spectroscopy (EDS) was used to analyze chemical composition. SEM-EDS analyses are required to correctly differentiate rounded, unmelted magnetic grains and framboids from melted YD magnetic spherules (Firestone et al., Reference Firestone, West, Kennett, Becker, Bunch, Revay, Schultz, Belgya, Kennett and Erlandson2007; Israde-Alcántara et al., Reference Israde-Alcántara, Bischoff, Domínguez-Vázquez, Li, DeCarli, Bunch, Wittke, Weaver, Firestone and West2012; LeCompte et al., Reference LeCompte, Goodyear, Demitroff, Batchelor, Vogel, Mooney, Rock and Seidel2012; Wittke et al., Reference Wittke, Weaver, Bunch, Kennett, Kennett, Moore, Hillman, Tankersley, Goodyear and Moore2013). These particles cannot be distinguished by limiting observations to a reflected-light microscope. A number of previous studies critical of the YD hypothesis (Surovell et al., Reference Surovell, Holliday, Gingerich, Ketron, Haynes, Hilman, Wagner, Johnson and Claeys2009; Pinter et al., Reference Pinter, Scott, Daulton, Podoll, Koeberl, Anderson and Ishman2011; Pigati et al., Reference Pigati, Latorre, Rech, Betancourt, Martínez and Budahn2012; Holliday et al., Reference Holliday, Surovell and Johnson2016) claimed to find “melted YDB spherules” throughout stratigraphic columns they investigated well beyond the YD time frame. However, none of those studies correctly used SEM-EDS, as required, making it unclear whether any YDB high temperature impact spherules were observed at all. Also, although some upward redistribution of melted YDB spherules has been reported in dynamic eolian and fluvial environments younger than the YDB layer (Moore et al., Reference Moore, West, LeCompte, Brooks, Daniel, Goodyear and Ferguson2017), the oldest and deepest appearance of melted spherules and other impact-associated proxies is typically only observed in YDB-aged strata.
In a study of the Flintstone Hill sequence, Diaz (Reference Diaz2012) reported an increase in magnetic mineral grains in the upper part of sandy Unit A in the Lake Hind section; a further increase in magnetic grains also was observed in the upper part of Unit B deposited a few centuries later. Selected grains were thin sectioned by Diaz for geochemical analysis and observations of interior structure, revealing that most grains are composed of iron oxide (Supplementary Fig. 2) surrounded by a rim of globular iron sulfide. These thin-section images of Diaz (Reference Diaz2012) allowed us to identify magnetic grains and framboidal spherules, but we were unable to confirm that the surface textures in that study were those of high-temperature, melted spherules (Group 1 below), primarily due to the methodology used.
As described in the “Methodology” section of the Supplementary Data, magnetic grains in our study were separated from 32 samples: (a) 6 samples, ~1 cm thick, from the interval between −27 and −22 cm, each weighing 200–400 g; (b) 4 samples, ranging in thickness from 2–3 cm, at discontinuous intervals from −69 to −27 cm, each weighing 200–400 g; and (c) 22 samples from −71 to + 118 cm, typically 1–2 cm thick, each weighing 20–51 g. SEM imagery showed that two sediment samples contained spherules that are morphologically the same as those from other YDB sites that are interpreted as having melted under high temperatures (Group 1, Melted magnetic spherules; Wittke et al., Reference Wittke, Weaver, Bunch, Kennett, Kennett, Moore, Hillman, Tankersley, Goodyear and Moore2013). Although those small samples contained only two and nine spherules, respectively, numbers are much larger when converted to spherules/1000 g, as shown in Figure 9A. Supplementary Table 5 presents a selection of chemical analyses of spherules in this study. Magnetic particles we found in the Lake Hind sequence were separated into three groups: melted magnetic spherules, magnetite grains, and framboidal spherules. Melted magnetic spherules are melted, spherical, Fe- and/or Si-rich grains that can form by several processes, including lightning strikes, volcanism, and anthropogenic activities, as well as from ablation of a cosmic impactor and/or from the ejection of molten droplets of impact-melted terrestrial target rocks (Bunch, Reference Bunch, Hermes, Moore, Kennett, Weaver, Wittke, DeCarli, Bischoff, Hillman and Howard2012; LeCompte et al., Reference LeCompte, Goodyear, Demitroff, Batchelor, Vogel, Mooney, Rock and Seidel2012; Wittke, Reference Wittke, Weaver, Bunch, Kennett, Kennett, Moore, Hillman, Tankersley, Goodyear and Moore2013). All of these processes produce spherules with surface morphologies that show evidence of high-temperature melting, including distinctive dendritic texturing, plate-like or soccer-ball-like structures, and/or vesicles from high-temperature outgassing (Fig. 8). SEM imagery and SEM-EDS analyses are required to differentiate origin. One focus of this study was to search for, analyze, and quantify these spherules and to infer their origin. Iron-rich magnetite grains are detrital in origin and were eroded from igneous, metamorphic, and sedimentary rocks, and some were rounded during transport; their formation is unrelated to cosmic impact events. Framboidal spherules typically have a spherical shape and are dominantly composed of iron pyrite, FeS2. Morphologically, they are composed of hundreds of unmelted, often cube-like, iron-and-sulfur crystals that formed slowly under anoxic conditions, rather than instantaneously as expected for melted impact-related spherules (Wittke et al., Reference Wittke, Weaver, Bunch, Kennett, Kennett, Moore, Hillman, Tankersley, Goodyear and Moore1996).

Figure 8. (color online) Magnetic Spherules. (A–I) Spherules from sample at a depth of −27 to −26 cm. Note secondary impact feature on spherule in panel G. Arrow marks direction of impacting particle, which appears to have depressed rim beneath head of arrow. (J-K) Two spherules from the Younger Dryas Boundary layer, the sandy zone between −33 and −30 cm. Note distinctive dendritic texturing on Fe-rich spherules of images (A) through (J) and related inset images, representing rapid melting and quenching. (J) Spherule displays Fe-rich, micro-crystalline structure. (K) The smooth spherule is an amorphous, aluminosilicate spherule based on scanning electron microscopy and energy dispersive spectroscopy analyses. Bulge on left side represents a smaller aluminosilicate object that apparently accreted while molten.

Figure 9. Impact Proxies. (A) High-temperature magnetic spherule concentrations (lower x-axis, purple; this study) display a small peak in the YDB zone at −33 to −30 cm (bounded by dashed lines) and a slightly younger larger peak above from −27 to −26 cm. Nanodiamonds (upper x-axis, green; from Kinzie et al., Reference Kinzie, Que Hee, Stich, Tague, Mercer, Razink, Kennett, DeCarli, Bunch and Wittke2014) peak in the YDB interval from −33 to −30 cm. (B) Platinum (Pt) concentrations measured in this study (upper x-axis, green) show a broad increase across the YDB to approximately −29 cm, with concentrations continuing to rise into the peat section, presumably due to selective plant uptake of PGEs (Greger, Reference Greger2004; Moore et al., Reference Moore, West, LeCompte, Brooks, Daniel, Goodyear and Ferguson2017). Pt analyses by Paquay et al. (Reference Paquay, Goderis, Ravizza, Vanhaeck, Boyd, Surovell, Holliday, Haynes and Claeys2009; lower x-axis, purple) show the first abundance spike near the YDB interval, with a larger spike above it in the peat of subunit B2. Dotted, blue vertical line represents average Pt crustal abundance; only Pt concentrations at or above the YDB interval are significantly larger than background. (C) Iridium (Ir) concentrations measured in this study (upper x-axis, green) reach highest concentration in the YDB interval from −33 to −30 cm, near the start of the YDB interval, although resolution is low. Ir concentrations from Firestone et al. (Reference Firestone, West, Kennett, Becker, Bunch, Revay, Schultz, Belgya, Kennett and Erlandson2007; upper x-axis, orange line) peak in the YDB at −33 to −30 cm. Ir concentrations from Paquay et al. (Reference Paquay, Goderis, Ravizza, Vanhaeck, Boyd, Surovell, Holliday, Haynes and Claeys2009; lower x-axis, purple line) also peak in the YDB interval at −33 to −30 cm. Dotted blue vertical line represents Ir crustal abundance; only Ir concentrations within or just above the YDB interval are significantly larger than background. (D) Sediment grain-size analyses, showing the relatively coarse (sandy) nature of the lower part of the sequence (Unit A), and the dominantly silty composition of overlying Unit B1. Note the short abrupt increase in relative grain size in the interval from −33 to −30 cm. Also note that the y-axis scale is different from previous panels; purple arrows from panel C indicate match points from −100 to −70 to cm.
Melted magnetic spherules (Group 1)
In this investigation, we quantified magnetic spherules that exhibited evidence of high-temperature melting, specifically those having a dendritic surface texture (Firestone et al., Reference Firestone, West, Kennett, Becker, Bunch, Revay, Schultz, Belgya, Kennett and Erlandson2007; Israde-Alcántara et al., Reference Israde-Alcántara, Bischoff, Domínguez-Vázquez, Li, DeCarli, Bunch, Wittke, Weaver, Firestone and West2012; LeCompte et al., Reference LeCompte, Goodyear, Demitroff, Batchelor, Vogel, Mooney, Rock and Seidel2012; Wittke et al., Reference Wittke, Weaver, Bunch, Kennett, Kennett, Moore, Hillman, Tankersley, Goodyear and Moore2013). Grains with those characteristics are shown in Figure 8, with their stratigraphic distribution shown in Figure 9A. The procedures used to select and identify magnetic spherules in Group 1 are described in the Supplementary section on Methodology.
Group 1 spherules (Fig. 9A) in the Lake Hind sequence were observed in the interval from −32 to −31 cm at an abundance of 10 spherules/kg, averaging 29 µm in diameter with the range of 15–42 µm. A second set of spherules were found in the interval from −27 to −26 cm at an abundance of 45 spherules/kg, averaging 65 µm in diameter with a range of 34–78 µm. SEM-EDS analyses of 11 microspherules showed eight with iron oxide abundances ≥95%, while the composition of the remaining three microspherules averaged 36.8% SiO2 and 24.2% Al2O3 (Supplementary Table 5). All of these spherules are morphologically and compositionally indistinguishable from hundreds of spherules with the same physical and chemical characteristics found at other YDB sites (Firestone et al., Reference Firestone, West, Kennett, Becker, Bunch, Revay, Schultz, Belgya, Kennett and Erlandson2007; Bunch et al., Reference Bunch, Hermes, Moore, Kennett, Weaver, Wittke, DeCarli, Bischoff, Hillman and Howard2012; Israde-Alcántara et al., Reference Israde-Alcántara, Bischoff, Domínguez-Vázquez, Li, DeCarli, Bunch, Wittke, Weaver, Firestone and West2012; LeCompte et al., Reference LeCompte, Goodyear, Demitroff, Batchelor, Vogel, Mooney, Rock and Seidel2012; Wittke et al., Reference Wittke, Weaver, Bunch, Kennett, Kennett, Moore, Hillman, Tankersley, Goodyear and Moore2013, Andronikov et al., Reference Andronikov, Andronikova, Loehn, Lafuente, Ballenger, Crawford and Lauretta2016b). Based on laboratory experiments by Bunch et al. (Reference Bunch, Hermes, Moore, Kennett, Weaver, Wittke, DeCarli, Bischoff, Hillman and Howard2012) and Wittke et al. (Reference Wittke, Weaver, Bunch, Kennett, Kennett, Moore, Hillman, Tankersley, Goodyear and Moore2013), we infer that these 11 spherules melted at high temperatures of >1400°C and subsequently experienced rapid cooling. Based on their morphologies, compositions, and depth of burial, we can eliminate formation of these spherules by volcanism, anthropogenesis, and lightning. Available evidence indicates that they formed during the same cosmic impact event that produced spherules at >40 other YDB sites.
Detrital magnetite grains (Group 2)
In the Lake Hind sequence investigated, magnetite and titano-magnetite grains (Group 2) were randomly and variably distributed in all samples in Units A and B. These particles are often Ti-enriched and are typically rounded to subrounded, sometimes displaying relict facets that are the remnants of their original octahedral morphology after erosion Figure 10A–C. Fe concentrations range from 60 to 90 wt%, with Ti concentrations ranging from 10 to 40 wt%. These detrital grains were not quantified because they were not relevant to this study, having no similarities with magnetite grains in impact melts, ET micrometeorites, cosmic spherules, or chondrites, as concluded by Diaz (Reference Diaz2012). Our qualitative observation is that Fe-rich magnetite grains are generally more abundant in sediments older than ~12,800 cal yr BP. Subrounded titano-magnetite grains were found in essentially equal numbers at all levels. Diaz (Reference Diaz2012) analyzed magnetic extracts from Unit A and suggested that most of these grains are terrestrial in origin and appear to be typical magnetite grains eroded from rocks in glacial sediment and redeposited in Lake Hind by meltwater. We agree that these magnetite grains are terrestrial, although a few grains display unusual surface flow marks and vesicles that suggest they may have been at least partially melted (Fig. 10D and E).

Figure 10. Detrital grains and framboids. (A–C) Typical rounded, unmelted, detrital magnetite and titano-magnetite grains. Occasional flat facets or concave depressions are all that remain of original octahedral magnetite structure after erosion and transportation. These grains are unrelated to cosmic impact events. (D–F) Magnetite grains from the YDB layer that possibly show partial surface melting and vesicles suggestive of high-temperature outgassing. If so, these may represent pre-existing sedimentary magnetite that was partially melted at high temperatures. (G) Diagenetic framboids with numerous cubic and/or faceted crystals. (H and I) Framboids with honeycombed surfaces.
Framboidal spheroids (Group 3)
We also observed very high numbers of non-impact-related spherical framboids (Group 3), mostly below −33 cm in the sequence. Our qualitative estimate is that there are many thousands of framboids/kg below −33 cm and the YDB layer, with very few above. In marked contrast, we found no YDB melted spherules (Group 1) grains below −33 cm. All framboids in the Lake Hind sequence displayed a distinctive sulfur-rich chemical signature (pyrite), with the sulfur content ranging from a few weight percent up to 30 wt%, typical of authigenic and/or diagenetic framboids (Israde-Alcántara et al., Reference Israde-Alcántara, Bischoff, Domínguez-Vázquez, Li, DeCarli, Bunch, Wittke, Weaver, Firestone and West2012; LeCompte et al., Reference LeCompte, Goodyear, Demitroff, Batchelor, Vogel, Mooney, Rock and Seidel2012). About half of the framboids display a characteristic structure composed of numerous cubic and/or faceted crystals (Fig. 10G), whereas the other half typically have a microns-thick crust with a honeycomb-like structure, possibly due to chemical dissolution of the faceted iron crystals, leaving their imprints in the crust (Fig. 10H and I). Typically, framboids form as clusters over time in anoxic sediments that are diagenetically and/or authigenically altered (Wilkin et al., Reference Wilkin, Barnes and Brantley1996), and are not formed abruptly at high temperatures such as during an impact event.
IRIDIUM AND PLATINUM AND THEIR INTERPRETATION
We submitted multiple 50–60 g aliquots of sediment from the Lake Hind section to Activation Laboratories for Pt and Ir analyses by fire assay and inductively coupled plasma-mass spectrometry (ICP-MS). The results reveal two peak Pt concentrations, one in the interval from −30 to −27 cm with values averaging 1.7 ppb (maximum = 2.9 ppb), and a larger one from −29 to −24 cm with an average of 2.9 ppb (maximum = 4.6 ppb; Fig. 9, Supplementary Table 6). There are peak concentrations of Ir in the YDB layer at −33 to −30 cm with values averaging 1.7 ppb (maximum = 2.2 ppb), as compared to 3.75 ppb for Lake Hind in Firestone et al. (Reference Firestone, West, Kennett, Becker, Bunch, Revay, Schultz, Belgya, Kennett and Erlandson2007; their fig. 9). Secondary peaks in Ir of 1.2 and 0.9 ppb were measured at −22 to −21 and −10 to −9 cm, respectively (Fig. 9, Supplementary Table 6). These Ir and Pt results compare favourably with those reported by Paquay et al. (Reference Paquay, Goderis, Ravizza, Vanhaeck, Boyd, Surovell, Holliday, Haynes and Claeys2009), albeit with larger magnitudes.
In 2013, Petaev et al. reported the discovery of a distinct peak concentration in Pt in the GISP2 core of Greenland in the YD peak, which they attributed to material deposited by a Pt-rich impactor. Subsequently Pt enrichment well above background levels in YDB sediments have been reported at 28 sites across North America, Europe, and Asia by Moore et al. (Reference Moore, West, LeCompte, Brooks, Daniel, Goodyear and Ferguson2017) and Gramly et al. (Reference Gramly2017); Andronikov and Andronikova (Reference Andronikov and Andronikova2016) and Andronikov et al. (Reference Andronikov, Lauretta, Andronikova and Maxwell2011, Reference Andronikov, Subetto, Lauretta, Andronikova, Drosenko, Kuznetsov, Sapelko and Syrykh2014, Reference Andronikov, Rudnickaitė, Lauretta, Andronikova, Kaminskas, Šinkūnas and Melešytė2015, Reference Andronikov, Andronikova, Loehn, Lafuente, Ballenger, Crawford and Lauretta2016b, Reference Andronikov, Hoesel, Andronikova and Hoek2016c) also reported peak concentrations of Ir in the YDB layer at multiple sites in North America and Europe.
At the Flintstone Hill site in the Lake Hind basin, only a few meters away from the sequence we investigated, Firestone et al. (Reference Firestone, West, Kennett, Becker, Bunch, Revay, Schultz, Belgya, Kennett and Erlandson2007) reported high peak concentrations of two potential indicators of an ET event, Ir and Ni, at −32 to −28 cm (Fig. 9), which we correlate with the YDB level at −33 to −30 cm in our nearby sequence. They measured an average abundance of Ir at 3.0 ppb with a maximum of 3.75 ppb, a value that is ~180 times the average crustal abundance (0.02 ppb; Rudnick and Gao, Reference Rudnick, Gao and Rudnick2003). Background abundances above and below the YDB in this Lake Hind section were below detection (<0.1 ppb). Firestone et al. (Reference Firestone, West, Kennett, Becker, Bunch, Revay, Schultz, Belgya, Kennett and Erlandson2007) did not measure Pt abundances.
Subsequently, Paquay et al. (Reference Paquay, Goderis, Ravizza, Vanhaeck, Boyd, Surovell, Holliday, Haynes and Claeys2009) measured an Ir peak of 0.12 ppb and a Pt peak of ~3 ppb in exactly the same levels of the Lake Hind sequence investigated by Firestone et al. (Reference Firestone, West, Kennett, Becker, Bunch, Revay, Schultz, Belgya, Kennett and Erlandson2007). Although with smaller peak Ir abundances, the values they found were still ~6 × the average crustal abundance (Fig. 9). Background values in that study were 0.03 ppb, closely matching expected crustal abundance of 0.022 ppb. Paquay et al. (Reference Paquay, Goderis, Ravizza, Vanhaeck, Boyd, Surovell, Holliday, Haynes and Claeys2009) attributed the small Ir peak to authigenesis, rather than an impact event, but offered no evidence supporting that interpretation.
It is unclear why the Ir results of Firestone et al. (Reference Firestone, West, Kennett, Becker, Bunch, Revay, Schultz, Belgya, Kennett and Erlandson2007) and Paquay et al. (Reference Paquay, Goderis, Ravizza, Vanhaeck, Boyd, Surovell, Holliday, Haynes and Claeys2009) differ in magnitude, but this may be due to the well-known nugget effect, caused by Ir-rich and Pt-rich grains that are rare and heterogeneously present in sediment samples. Although Paquay et al. (Reference Paquay, Goderis, Ravizza, Vanhaeck, Boyd, Surovell, Holliday, Haynes and Claeys2009) considered their sample sizes to be adequate to overcome the nugget effect, if sample sizes analyzed are too small, this heterogeneity can become magnified (i.e., the Ir and Pt grains are too rare in any given sample to provide a reliable average abundance). To minimize the possibility of a nugget effect, Firestone et al. (Reference Firestone, West, Kennett, Becker, Bunch, Revay, Schultz, Belgya, Kennett and Erlandson2007) analyzed 50-g aliquots, the maximum allowed for laboratory analyses, whereas Paquay et al. (Reference Paquay, Goderis, Ravizza, Vanhaeck, Boyd, Surovell, Holliday, Haynes and Claeys2009) used samples weighing only 6–10 g.
The increased concentrations of Pt and Ir occur at −33 cm in the silt of subunit B1 near the onset of the YD and continue for centuries to the top of the peat (Subunit B2; Fig. 9). There are several possible explanations for these elevated concentrations of Pt and Ir above the YDB layer, some of which may also apply to other elements such as those noted in the next section. (1) High concentrations of Pt and Ir, originally deposited during the ET event at the onset of the YD, subsequently migrated higher in the sedimentary column through uptake by lake vegetation (Greger, Reference Greger2004; Moore et al., Reference Moore, West, LeCompte, Brooks, Daniel, Goodyear and Ferguson2017), thus accumulating in the overlying organic matter during the following centuries. (2) Bioturbation or physical mixing in accumulating sediment may have displaced Pt and Ir upward in the stratigraphic column. (3) Diffusion may have moved trace elements upward above the YDB (or downward; e.g., Nyffeler et al., Reference Nyffeler, Santschi and Li1986); note other elements in Figure 11. (4) Ir and Pt may have been scavenged by clays and incorporated into their interlayer structure or adsorbed by organics as they accumulated in the upper part of Unit B in the sequence during years following the ET event. (5) The fallout of tiny particles of Pt and Ir may have extended across several decades due to long atmospheric residence time after the ET impact event (Petaev et al., Reference Petaev, Huang, Jacobsen and Zindler2013). (6) Precipitation may have carried previously deposited Pt and Ir into the Lake Hind basin for centuries following the ET event.

Figure 11. Abundances of Cr, Co, Th, U, Hf, Sc, and La at four locations (modified in part from Firestone et al., Reference Firestone, West, Kennett, Becker, Bunch, Revay, Schultz, Belgya, Kennett and Erlandson2007, fig. 15 in Suppl. Data) showing relation to impact layers. Dashed horizontal line represents impact layers of the Younger Dryas (YD), Eocene, or Cretaceous-Tertiary (K-T) boundary. (A1–3) Lake Hind values begin to rise below the YD zone, and form sharp fluctuating peaks just above the Younger Dryas Boundary (YDB) around −33 to −30 cm; after that in the peat (subunit B2) and marl (subunit B3) concentrations decrease sharply. (B) Values at Blackwater Draw, New Mexico, USA, rise before the peak in the YDB layer and decline afterward. (C) At Medetli, Turkey, values peak near the K-T impact layer, and then declined sharply(Arakawa et al., Reference Arakawa, Li, Ebihara, Meriç, Tansel, Bargu, Koral and Matsumaru2003). (D) At Massignano, Italy, values reach peaks just above the impact layer caused by the Eocene Chesapeake Bay impact, rising and falling just before and after.
OTHER ELEMENTAL ANOMALIES
Firestone et al. (Reference Firestone, West, Kennett, Becker, Bunch, Revay, Schultz, Belgya, Kennett and Erlandson2007) reported anomalously high concentrations of Th, U, Hf, Sc, and Sm in the YDB layers in Lake Hind and at Blackwater Draw, New Mexico. They also reported a similar pattern of enrichment at two sites in Italy containing layers deposited during the ~66-Ma Cretaceous-Tertiary impact event (K-T) and the ~36-Ma Eocene impact into Chesapeake Bay (Fig. 11). Patterns of multiple spikes were observed in and/or above the cosmic impact layers at Blackwater Draw, New Mexico (YDB event) and at Medetli, Turkey (K-T; Arawaka et al., Reference Arakawa, Li, Ebihara, Meriç, Tansel, Bargu, Koral and Matsumaru2003). At Massignano, Italy, a similar pattern of elemental peaks occurs immediately above the Eocene impact layer (Fig. 11; Bodiselitsch et al., Reference Bodiselitsch, Montanari, Koeberl and Coccioni2004). These studies exhibit increased values of these elements before the impact layer, a brief interval of anomalous spikes near the layer, which in turn was followed by a rapid decrease.
In our study of the Lake Hind sequence, we produced a time-series elemental analysis for Cr, Co, Th, U, Hf, Sc, and La. Values in the Lake Hind sequence begin to rise in the lower part of Unit B, just after 13 cal ka, and form sharp fluctuating peaks just above the YD (Fig. 11). This pattern, where there are elevated concentrations before and after a zone implicated as resulting from a cosmic event, is similar to that found in other sequences (Fig. 11), and may be explained by one or more of the reasons discussed above for Pt and Ir concentrations that extend above the YDB.
We concur with Firestone et al. (Reference Firestone, West, Kennett, Becker, Bunch, Revay, Schultz, Belgya, Kennett and Erlandson2007), who concluded that elevated concentrations of these elements most likely resulted from processes related to cosmic impacts/airbursts, including: (1) dispersal of ejecta from the impactor and/or the target rocks; (2) precipitation and runoff that concentrate these heavy metals; and (3) an influx of meteoritic material from the impactor. For an example of the latter, several types of meteorites contain elevated values of Cr, Co, and Sc, with lunar meteorites typically enriched in Th, U, Hf, and La (GERM Database, 2017, EarthRef.org).
SYNTHESIS OF INTERPRETATIONS
Glacial Lake Hind formed along the margin of the LIS at the mouths of the paleo-Souris, paleo-Assiniboine, and paleo-Pipestone rivers, whose basins lie in Saskatchewan, northern North Dakota, and southwestern Manitoba (Fig. 2). Studies have shown that the valleys of these rivers were mainly eroded by meltwater floods, some of which resulted from the abrupt drainage of other ice-marginal lakes to the west (Kehew and Clayton, Reference Kehew, Clayton, Teller and Clayton1983; Kehew and Lord, Reference Kehew and Lord1986, Reference Kehew, Lord, Mayer and Nash1987; Kehew and Teller, Reference Kehew and Teller1994a, Reference Kehew and Teller1994b). The sedimentary sequence in the Lake Hind basin is likely to contain a record of one or more of these floods and paleodrainage changes, as well as events related to melting of the LIS. In the early stages, Lakes Hind and Souris (Fig. 2 and 13) may have been joined. Kehew and Clayton (Reference Kehew, Clayton, Teller and Clayton1983, p. 203) noted that the spillway between these lakes (Fig. 13) “is incised below the level of the floor of Lake Souris, and the lake floor above the channel is scoured. This, plus the absence of lake sediment on the channel floor, indicates that the two lakes were drained for the last time shortly after erosion of the connecting spillway.” Lord (Reference Lord1991) describes the nature of the sedimentary sequence in the Glacial Lake Souris basin. The connecting spillway from Lake Souris disappears near the center of Lake Hind, and Kehew and Clayton (Reference Kehew, Clayton, Teller and Clayton1983) interpret the coarser sediment there (around the Flintstone Hills section) as having been deposited as an underflow fan. Today the Souris River channel has cut a shallow channel into these sediments and flows into the Pembina Valley (Fig. 2 and 13).
The sedimentary sequence at the Flintstone Hill site (Fig. 3 and 4) shows several distinct changes in depositional environment. In the lower part of the exposed sequence, there is a change from massive silty fine sand (Unit A) to poorly laminated clayey silt in subunit B1 at ~13.1 cal ka (at −43 cm) that becomes well laminated, more clayey, and organic-rich above ~12.8 cal ka (Table 2). Sedimentation rates are high in sandy Unit A, but decrease dramatically in overlying subunit B1, and are even lower in the sandy zone in the middle of that subunit that dates to 12.8 cal ka at the start of the YD. Subunit B1 spans ~800 cal yr (Fig. 4). There are a number of distinct geochemical changes at ~12.8 cal ka, accompanied by reduced numbers of pre-Quaternary microfossils and changes in macrofauna. Peat becomes the dominant lithology at ~12.3 cal ka (above −22 cm) for the next 1300 yr. The peat (subunit B2) is overlain by a thin unit of marl (B3) reflecting a dry and evaporative phase in the basin's history. Above this is a sandy silt and silty sand unit (Unit C), containing organics and an abundance of charcoal, reflecting a change from wetland marsh conditions to a basin dominated by river sedimentation; regional changes in vegetation also occur at this time. Changes in the nature, composition, and microfossil content of these units reflect regional changes in hydrology, notably events related to large floods from ice-marginal lakes to the west, and evidence for an ET event that may have destabilized the nearby LIS. Eolian sand (Unit D) overlies this.
Table 2. Summary of key characteristic of Lake Hind units. Assin. = Assiniboine

Paleoenvironmental interpretations of sediments and their historical context
Unit A
Radiocarbon ages indicate that deposition in the southern Lake Hind basin began before 13 cal ka. The massive, coal-bearing, silty, fine-grained sand of Unit A contains little pollen, no diatoms, and few macrofossils, and the assemblage is dominated by pre-Quaternary palynomorphs (Fig. 6, Supplementary Table 3), primarily Taxodiaceae (Taxodiaceaepollenites) that were derived from Paleocene lignite in the Souris River watershed of south-central Saskatchewan, which drained into Lake Hind.
We interpret the sandy sediments of Unit A as having been rapidly deposited in a turbid shallow lacustrine environment by meltwater released from ice-marginal lakes to the west or directly from the LIS. The paucity of Quaternary fossils, rapid rate of sedimentation (2 yr/cm; 4.63 mm/yr), and massive nature of Unit A largely resulted from deposition from floods through the Souris River watershed. Deposits in Glacial Lake Souris, just upstream from Lake Hind (Fig. 13), interpreted to be related to a glacial flood of similar age, consist mainly of a gravel facies overlain by a massive fine- to medium-grained sand containing 2–10% lignite grains that is well to moderately well-sorted (Lord, Reference Lord1991). The extensive sand facies in Glacial Lake Souris was deposited by turbidity currents that followed an initial catastrophic flood that deposited the gravel (Lord, Reference Lord1991). Presumably, the coarser gravel facies in the Glacial Lake Souris basin settled-out before reaching Lake Hind.
Unique and distinguishing geomorphic and sedimentological features related to catastrophic floods are present throughout the region to the west of Lake Hind, particularly along the Souris River, and a summary of these is presented by Kehew and Lord (Reference Kehew, Lord, Mayer and Nash1987, table 1 and fig. 3), and include (1) deep, steep-sided channels that lack tributaries and have a uniform width along their entire length, (2) the presence of a 1- to 3-km-wide scoured sub-upland zone along both sides of the channel (Fig. 12; see “washed till” zone in Fig. 2B along Souris River just south [upstream] from Lake Hind), (3) streamlined hills in the sub-upland valleys, (4) boulder-armoured floors on some sub-upland valleys, and (5) scattered massive boulder gravel deposits in the valleys. These channels all head in proglacial lake basins (Fig. 13), which have been interpreted to have abruptly released their waters and eroded the downstream valley in a few years. Kehew (Reference Kehew1982), Kehew and Clayton (Reference Kehew, Clayton, Teller and Clayton1983), Kehew and Lord (Reference Kehew and Lord1986, Reference Kehew, Lord, Mayer and Nash1987), Kehew and Teller (Reference Kehew and Teller1994a, Reference Kehew and Teller1994b), Sun (Reference Sun1996), Sun and Teller (Reference Sun and Teller1997), and Wolfe and Teller (Reference Wolfe and Teller1995) have described various late-glacial floods and the resultant channels in the drainage basin to the west of Lake Hind.

Figure 12. (color online) Aerial photograph showing scoured surface along margin of channel in southeastern Saskatchewan eroded by catastrophic floodwaters released from proglacial lakes. These sub-upland zones carried the initial flood flow before rapidly incising the channel to its modern depth.

Figure 13. (color online) Rivers and the routing of glacial overflow during glacial retreat from the Lake Hind basin and region to the west (modified from fig. 1 in Sun and Teller, Reference Sun and Teller1997). Main early inflow route to Lake Hind and two outflow routes (A and B) shown south of Laurentide Ice Sheet (LIS) ice margin that is indicated by dash-dot line. Subsequent routes were added to the north when the Assiniboine River flowed into Lake Agassiz at the Assiniboine Delta.
The chronology of these flood events is poorly constrained, although researchers have concluded that all flood channels in the Canadian Prairies were not eroded at the same time (e.g., Kehew and Lord, Reference Kehew and Lord1986, Reference Kehew, Lord, Mayer and Nash1987; fig. 5 in Kehew and Teller, Reference Kehew and Teller1994a; Sun and Teller, Reference Sun and Teller1997), nor were all the proglacial lakes and meltwater flood events contemporaneous. Sun (Reference Sun1996) presented evidence for a number of floods that impacted on the Lake Hind basin and there is evidence for more than one flood in many places to the west (e.g., Kehew and Lord, Reference Kehew and Lord1986, Reference Kehew, Lord, Mayer and Nash1987; Kehew and Teller, Reference Kehew and Teller1994a). Most floods appear to have occurred close to or just before 13 cal ka, including a particularly large one through the Souris River Valley that emanated from glacial Lake Regina (Fig. 13). Other channels west of Glacial Lake Hind, such as the Assiniboine and Qu'Appelle valleys, may have experienced catastrophic floods a few centuries later (fig. 5 in Kehew and Teller, Reference Kehew and Teller1994a).
Thus, the water-scoured landscape of Saskatchewan downstream from these proglacial lakes as far as the Glacial Lake Hind basin (Fig. 13) clearly indicates that one or more large floods helped shape this region. We conclude that the massive sand of Unit A, and possibly the lowermost part of overlying subunit B1, containing limited numbers of Quaternary fossils and with a dominance of pre-Quaternary microfossils reworked from Paleocene bedrock, plus the presence of Tertiary coal eroded from lignite beds in southwestern Saskatchewan, argues that the lower part of the Flintstone Hill sequence was rapidly deposited in a lake by floodwaters that shaped the region to the west. These waters may have abruptly spilled-over from Glacial Lake Souris after catastrophically released waters from Glacial Lake Regina reached that basin (Fig. 13). Kehew and Clayton (Reference Kehew, Clayton, Teller and Clayton1983) interpret coarse sandy sediments in the Lake Hind basin near the Souris River as deposited in an underflow fan fed by the paleo-Souris River.
Subunits B1 and B2
Interpretations from sedimentological and biological data
Radiocarbon dates place the beginning of Unit B sedimentation at ~13.1 cal ka. Although this unit is distinctly a lake deposit, environmental conditions during the next few centuries in the Lake Hind basin are not clearly indicated. The absence of diatoms and general paucity of invertebrates, plus the dominance of pre-Quaternary pollen and spores and high rate of sedimentation, suggest turbid conditions may have dominated in the lower part of subunit B1. This interval could reflect a waning stage of underflow fan construction by the paleo-Souris River as meltwater flow diminished through its channel. Alternatively, the Flintstone Hills sequence at this time may represent shallow lake conditions influenced by occasional river floods. Some fossils present in the lower part of subunit B1, such as Chara oogonia, sponge spicules, and ostracodes, may indicate clear-water conditions, although it is possible, but unlikely, that these organisms were reworked from upstream lacustrine settings and redeposited into a turbid lacustrine environment in Lake Hind. Interestingly, the large number of AMS ages that fall outside the Bayesian envelope (Fig. 4) may reflect a mixture of contemporaneous and old (reworked from upstream areas) organics and sediments, perhaps deposited by flood waters. Alternatively, some of the anomalously old ages outside the Bayesian envelope in subunit B1 may be explained by radiocarbon analyses of a mixture of emergent and submergent aquatic plant materials. This is because some subaquatic species are known to incorporate old C from bicarbonate in lake waters dissolved from carbonate bedrock, resulting in older ages not representative of the time when the sediments were deposited (e.g., Teller, Reference Teller1989; Marty and Myrbo, Reference Marty and Myrbo2014).
We suggest that a new hydrological regime began in the Lake Hind basin by about 13 cal ka, which coincided with a decrease in grain size, possibly as a result of deepening of regional river channels in response to an increase in meltwater and retreat of the LIS that lay along the northern edge of the lake (Fig. 13). At the same time, there may also have been a shift of overflow from Lake Hind from a southeasterly route into the Pembina River valley to one through a lower Assiniboine River Valley route out the northern side of the lake (Fig. 13, Table 2), as suggested by Sun and Teller (1994) and Kehew and Teller (1994). Cooling during the YD probably reduced regional runoff to the Lake Hind basin in the centuries following. All of these would have led to a lowering of the level of Glacial Lake Hind, if not complete drainage, a reduction in coarse (sandy) sediment to the lake, and eventually have allowed conditions favorable for the accumulation of organic matter in subunit B1 and the peat of subunit B2. Significantly, this valley entrenchment in the Lake Hind basin coincided with an abrupt drop of >50 m in the level of nearby glacial Lake Agassiz at the onset of its Moorhead low-water phase about 12.8 cal ka (Fisher et al., Reference Fisher, Yansa, Lowell, Lepper, Hajdas and Ashworth2008; Teller, Reference Teller2013).
The decline in pre-Quaternary palynomorphs and increase in Quaternary pollen types above −33 cm (Fig. 6) supports the interpretation that there was a reduction of water contributed from the Souris River watershed. There is also a decrease in the rate of sediment accumulation in the −33 to −30 cm interval, which spans several centuries and is the lowest in the sequence (Table 2). This and regional entrenchment of river valleys may be linked to the YDB impact event at 12.8 cal ka and the onset of YD climate cooling that likely suppressed local meltwater production. If the LIS ice dam that impounded Lake Hind failed, perhaps because of the YDB event, the northeastern outlet from the basin to the Assiniboine River may have opened (Fig. 13), further reducing water levels. YD cooling may have kept water levels low for a few centuries more, but may have been followed by a rise in lake level as cooling led to a readvance of the LIS that blocked the northeastern outlet to the Assiniboine Valley and returned overflow to the Souris River (Table 2). As discussed in the next section, other mineralogical and elemental changes are recorded within subunit B1 around 12.8 cal ka, which coincides with the onset of the YD, and may help explain paleoenvironmental changes in the Lake Hind basin during the 13–12 cal ka interval. Peat accumulation (subunit B2) began by 12.3 cal ka.
Our pollen and plant macrofossil studies of Unit B sediment and those from equivalent beds in Boyd's (Reference Boyd2003) study (units 1-b to II) indicate that the basin became a low-energy wetland by 12.8 cal ka punctuated by brief episodes of minor flooding represented by coarser laminae (Boyd, 2000; Wallace, Reference Wallace2002; Boyd, Reference Boyd2003; Boyd et al., Reference Boyd, Running and Havholm2003). In the pollen profile of Unit B, the continued contribution of fluvial sediments to the site is recorded by deposition of pre-Quaternary palynomorphs (Fig. 6), again probably derived from Paleocene lignite in the Souris River Valley of Saskatchewan, at least until peat (subunit B2) began to be deposited, although the frequency of these palynomorphs diminished after ~12.8 cal ka.
Interpretations from mineral and elemental data
Immediately above −33 cm in subunit B1, mineralogical and elemental evidence supports the occurrence of the YDB cosmic impact event, including concentrations of magnetic microspherules, a distinct peak in nanodiamonds (Kinzie et al., Reference Kinzie, Que Hee, Stich, Tague, Mercer, Razink, Kennett, DeCarli, Bunch and Wittke2014), anomalously high concentrations of Pt and Ir, and anomalous concentrations of Cr, Co, Th, U, Hf, Sc, and La (Fig. 9 and 11A). The high-temperature magnetic spherules exhibit morphologies and chemical compositions like those found in sediment dated to the YD onset at ~40 other sites across nearly a quarter of the Earth's surface (Wittke et al., Reference Wittke, Weaver, Bunch, Kennett, Kennett, Moore, Hillman, Tankersley, Goodyear and Moore2013). This evidence is comparable to distal ejecta from known impacts and inconsistent with non-impact terrestrial mechanisms.
If the Lake Hind area was influenced by a high-energy ET event such as the ablation or atmospheric burst of a fragmented comet or chondrite (Firestone et al., Reference Firestone, West, Kennett, Becker, Bunch, Revay, Schultz, Belgya, Kennett and Erlandson2007; Kennett et al., Reference Kennett, Kennett, West, Erlandson, Johnson, Hendy, West, Culleton, Jones and Stafford2008), this may have produced a high-energy seismic pulse (Florenskiy, Reference Florenskiy1965) or, less likely, a thermal pulse that briefly increased surface temperatures (Wasson, Reference Wasson2003). Either phenomena may have led to release of meltwater into regional drainage systems, through destabilization of the LIS margin, including failure of glacial dams upstream from Lake Hind that were holding back proglacial lakes. In turn, this would have led to valley entrenchment and lowering of the water table, and a change in inflow to the lake as well as overflow from Lake Hind.
In addition, a large-scale ET event would have greatly increased the outflow of freshwater from the LIS into the Arctic and North Atlantic oceans, as well as releasing large fluxes of icebergs into nearby oceans (Firestone et al., Reference Firestone, West, Kennett, Becker, Bunch, Revay, Schultz, Belgya, Kennett and Erlandson2007; Kennett et al., Reference Kennett, Kennett, LeCompte, West, Goodyear and Moore2018). This, in turn, would have disrupted the Atlantic Ocean's meridional overturning circulation that triggered Northern Hemisphere cooling (Broecker et al., Reference Broecker, Kennett, Flower, Teller, Trumbore, Bonani and Wolfli1989; Broecker, Reference Broecker1998). Glacial Lake Agassiz was the largest of these ice-marginal lakes that abruptly overflowed at the onset of the YD, coincidently at the same time as the ET event and the drawdown of waters in Glacial Lake Hind, which lies just upstream from it. Murton et al. (Reference Murton, Bateman, Dallimore, Teller and Yang2010), Condron and Windsor (Reference Condron and Winsor2012), Not and Hillaire-Marcel (Reference Not and Hillaire-Marcel2012), and Keigwin et al. (Reference Keigwin, Klotsko, Zhao, Reilly, Giosan and Driscoll2018) reported evidence of large-scale flooding into the Arctic Ocean from Lake Agassiz at ~12.8 cal ka. These researchers concluded that this massive outburst flood spread into the North Atlantic, where it suppressed ocean convection and triggered YD cooling by reducing meridional overturning.
Precipitated minerals in B1, B2, and subunit B3 marl
The presence of anhydrite (originally gypsum) and non-detrital carbonate in subunits B1 (clayey silt) and B2 (peat; Fig. 7) is incompatible with environmental conditions indicated by the pollen and macrofossil assemblages, so they are interpreted as secondary minerals related to diagenetic additions during later (Holocene) drying conditions in the region. A diagenetic origin of the gypsum is supported by (1) the more arid climatic conditions recorded in mid-Holocene Prairie lakes (e.g., Last and Teller, Reference Last and Teller2002; Grimm et al., Reference Grimm, Donovan and Brown2011; Teller et al., Reference Teller, McGinn, Rajapara, Shukla and Singhvi2018), (2) the more arid pollen types in sediments at this site that are younger than ~11,600 cal ka (Boyd, Reference Boyd2003), (3) the presence of secondary gypsum in Quaternary siliclastic sediments throughout the region (Young et al., Reference Young, Chow, Ferguson, Maris, McDonald, Benson, Halden and Matile2000), and (4) the overlying marl in Unit C and eolian dunes indicative of drier conditions.
The overlying subunit B3 marly bed (Fig. 3 and 5) dates to shortly after 11 cal ka based on the Bayesian age-depth model (Fig. 4), and may mark the first episode of notable climate warming and drying, when evaporation exceeded the sum of precipitation plus runoff. This allowed 7 cm of calcium carbonate to precipitate (subunit B3). The presence of polygonal desiccation cracks beneath the marl in the underlying peat supports the conclusion that the marl is an evaporitic deposit. Diagenetic gypsum and calcite may have precipitated within the underlying sediments of Unit B at this time or later.
Unit C
The transition from subunit B3 to Unit C at ~11 cal ka is marked by a change in environment from low-energy wetland to high-energy fluvial conditions. The sandy siliciclastic sediments of Unit C reflect times of higher flow of the rivers feeding the Lake Hind lowland, perhaps normal annual floods or those related to flood outbursts from the headwaters of the Assiniboine-Qu'Appelle watersheds to the northwest (Fig. 13) associated with the numerous flood features that lie adjacent to the Assiniboine River, including along the northern margin of the Lake Hind basin, as described by others (Sun, Reference Sun1993; Sun and Fulton, Reference Sun and Fulton1995; Wolfe and Teller, Reference Wolfe and Teller1995). As can be seen in Figure 2, major rivers lie along both the southern and northern sides of the Glacial Lake Hind basin, and smaller rivers such as Pipestone Creek feed into the basin from the west. The distinct thin marl bed in Unit C (C1 in Fig. 3 and 5) may reflect ponding on the floodplain between overbank events. The fluvial record ends when sands of Unit C or from the basin margin were reworked by the wind into dunes.
Unit D
This well-sorted sandy unit was deposited under warm and dry conditions in an eolian environment, beginning ~6000–7000 years ago, and it documents dune formation, with the paleosols reflecting periods of stability in the region from mid-Holocene to late Holocene time (Running et al., Reference Running, Havholm, Boyd and Wiseman2002; Havholm et al., Reference Havholm, Bergstrom, Jol, Running, Bristow and Jol2003; Havholm and Running, Reference Havholm and Running2005). Detailed studies of this unit (Boyd, 2000; Running et al., Reference Running, Havholm, Boyd and Wiseman2002; Wallace, Reference Wallace2002; Havholm and Running, Reference Havholm and Running2005; Hugenholtz and Wolfe, Reference Hugenholtz and Wolfe2005) identified parabolic dunes, sand sheets, erosional unconformities, paleosols, and evaporites in the region, which reflect intense arid conditions, interspersed with wetter periods of dune stabilization and soil formation, and variations in the wind regime.
Summary of conclusions
Sediments along the Souris River in the Glacial Lake Hind basin of southwestern Manitoba reveal a postglacial history spanning the interval from before 13 cal ka to the Late Holocene, and include a high-resolution record of the YD climate episode. Sandy and silty lacustrine sediments near the base of the sequence are dominated by old organics derived from pre-Quaternary bedrock, and have a paucity of Quaternary fossil remains until after the onset of the YD at 12.8 cal ka when more organic-rich, peaty sediments began to accumulate (Table 2). We attribute these sands and silts to flooding into the Lake Hind basin through the ancestral Souris River Valley, which emanated from ice-marginal lakes and the LIS to the west and northwest. This flooding produced a scoured landscape with deeply eroded valleys in the Glacial Lake Hind basin. The sequence records an abrupt appearance at the onset of the YD (12.8 cal ka) of high-temperature magnetic spherules, anomalously high concentrations of Pt and Ir, and nanodiamonds, as well as anomalous concentrations of Cr, Co, Th, U, Hf, Sc, and La. This impact proxy assemblage provides evidence for an extraterrestrial event at the beginning of the YD, identified at many other locations in North America and elsewhere. Major flooding into Lake Hind may have been triggered by this cosmic impact event through destabilization of the LIS, including ice dams bounding other proglacial lakes to the west, which released large volumes of meltwater that cascaded downstream. This was followed soon afterward by the deepening of regional river valleys and the drawdown of Lake Hind. Simultaneously, at 12.8 cal ka, glacial Lake Agassiz, into which Lake Hind drained, experienced a major drawdown, leading to a massive freshwater discharge into the North Atlantic Ocean (Teller and Thorleifson, Reference Teller, Thorleifson, Teller and Clayton1983; Leydet et al., Reference Leydet, Carlson, Teller, Breckenridge, Barth, Ullman, Sinclair, Milne, Cuzzone and Caffee2018) and the Arctic Ocean (Murton et al., Reference Murton, Bateman, Dallimore, Teller and Yang2010; Keigwin et al., Reference Keigwin, Klotsko, Zhao, Reilly, Giosan and Driscoll2018), which in turn triggered YD cooling by throttling meridional ocean overturning (Broecker et al., Reference Broecker, Kennett, Flower, Teller, Trumbore, Bonani and Wolfli1989; Manabe and Stouffer, Reference Manabe and Stouffer1997; Clark et al., Reference Clark, Marshall, Clarke, Hostetler, Licciardi and Teller2001; Alley, Reference Alley2007; Condron and Winsor, Reference Condron and Winsor2012; Keigwin et al., Reference Keigwin, Klotsko, Zhao, Reilly, Giosan and Driscoll2018). We propose that this massive hydrological reorganization resulted from a cosmic impact event at the YD boundary. Peat deposition began in the Lake Hind basin by 12.3 cal ka as wetlands evolved in response to this lake drainage. A mix of conifers (especially Picea and Larix) and deciduous trees (especially Populus and Quercus) covered the uplands surrounding the Lake Hind basin throughout the interval from ~13 to 10 cal ka. By ~11 cal ka, marl had begun to accumulate, and pollen assemblages indicate that the region became warmer. A period of fluvial accumulation followed, probably from local rivers or floods of the Assiniboine River, before increasing warmth and dryness of the Holocene led to formation of dunes in the region.
ACKNOWLEDGMENTS
This research was mainly funded by a grant to James T. Teller from the Natural Sciences and Engineering Research Council of Canada. We thank Mostafa Fayek (University of Manitoba) for initial contributions to this work, Douglas Kennett (University of California, Santa Barbara) for radiocarbon analyses while at Pennsylvania State University, and Pat Moore for technical assistance during Scanning Electron Microscope work at North Carolina State University. We are grateful to Maria Valez (University of Regina) for examining samples for diatoms. Helpful reviews were provided by Alan Kehew and Ken Tankersley.
SUPPLEMENTARY MATERIAL
The supplementary material for this article can be found at https://doi.org/10.1017/qua.2019.46.


