


INTRODUCTION
While there is broad understanding of deglaciation of the southern Great Lakes lobes of the Laurentide Ice Sheet (LIS) when ice was at its last glacial maximum (LGM; Heath et al., Reference Heath, Loope, Curry and Lowell2018), well-dated recessional moraines are lacking. Recession of the Saginaw Lobe of the LIS in southern Michigan and northern Indiana (Fig. 1) was out-of-phase with the adjacent Lake Michigan and Huron-Erie lobes (Leverett and Taylor, Reference Leverett and Taylor1915; Zumberge, Reference Zumberge1960; Kehew et al., Reference Kehew, Nicks and Straw1999, Reference Kehew, Beukema, Bird and Kozlowski2005; Colgan et al., Reference Colgan, Vanderlip and Braunschneider2015), and few chronologic data are available from the Saginaw Lobe terrain (Kehew et al., Reference Kehew, Esch, Karki, Kehew and Curry2018) to understand the timing of when the lobes interacted. Moreover, the maximum extent of the Saginaw Lobe is poorly understood beyond some position in northern Indiana between the Lake Michigan and Huron-Erie lobes (e.g., Bleuer and Moore, Reference Bleuer and Moore1974). The available radiocarbon ages (Dyke, Reference Dyke2004; Glover et al., Reference Glover, Lowell, Wiles, Pair, Applegate and Hajdas2011) for the area occupied by the Saginaw Lobe are minimum limiting ages and many were not collected for the purpose of dating ice-margin recession. The available isochrones drawn by Fullerton (Reference Fullerton1980) and Dyke (Reference Dyke2004) for the Saginaw Lobe assume a few thousand-year lag time between deglaciation and oldest available radiocarbon ages, and Curry et al. (Reference Curry, Lowell, Wang, Anderson, Kehew and Curry2018a) determined lag times for the Lake Michigan Lobe between 3080 and 4330 yr. The lag time can reflect periods of non-deposition, time for vegetation to colonize recently deglaciated landscapes, and the time necessary for buried ice to melt and basins to fill with water (Florin and Wright, Reference Florin and Wright1969). Lag times from Curry et al. (Reference Curry, Lowell, Wang, Anderson, Kehew and Curry2018a) reflect age differences on a moraine from oldest organics in ice-walled lake plain sediment compared to oldest dates from kettle lakes.

Figure 1. Regional maps of the study area. (A) Location map showing the last glacial maximum (LGM) extent of the Laurentide Ice Sheet. HEL, Huron-Erie Lobe; SL, Saginaw Lobe; LML, Lake Michigan Lobe. (B) Digital elevation model (DEM) map showing relationships between the Lake Michigan, Saginaw Bay, and Huron-Erie lobes (yellow arrows) that converged onto the higher relief area indicated by light gray tones of the study area in Figure 2. Distribution of specific radiocarbon ages (median cal ka BP) are indicated with white dots from Dyke (Reference Dyke2004) and Glover et al. (Reference Glover, Lowell, Wiles, Pair, Applegate and Hajdas2011). Long, thick, white arrow is the drainage route through the Imlay Channel across the Thumb of Michigan routing water from ancestral Lake Erie through the Grand River to glacial Lake Chicago within the Lake Michigan basin. Ancestral Lake Erie shown at Maumee stage and glacial Lake Chicago at the Glenwood stage. BM, Bloomington Moraine; OC, Oswego Channel; MM, Minooka Moraine; VM, Valparaiso Moraine; WM, Woodstock Moraine; WSM, Westmont Moraine; MR, Maxinkuckee Moraine; SHM, Shipshewana Moraine; SM, Sturgis Moraine; KM, Kalamazoo Moraine; FM, Fort Wayne Moraine; PHMC, Port Huron Moraine complex. (For interpretation of the references to color in this figure legend, the reader is referred to the web version of this article.)
The purpose of this paper is to begin developing a deglacial chronology of the southern part of the Saginaw Lobe by assigning ages to two of its recessional moraines. We use optically stimulated luminescence (OSL) dating of sand at the base of sediment cores from lake basins on and adjacent to the Shipshewana and Sturgis moraines of the Saginaw Lobe to determine minimum limiting ages for deglaciation, and when adjacent lobes began infilling this recently deglaciated space. The study began with basal radiocarbon ages collected by Horton (Reference Horton2015) and Dziekan (Reference Dzieken2017) that are thousands of years younger than the assigned ages for the moraines. Because of this age discrepancy, we wondered if the radiocarbon ages from wood fragments reflected the age of the encasing sediment. Pollen analysis of sediment adjacent to where the basal radiocarbon samples were collected provided insights into paleoenvironmental conditions and helped verify the accuracy of radiocarbon ages by comparison with dated pollen assemblages in nearby lakes (e.g., Appleman Lake; Fig. 2; Gill et al., Reference Gill, Williams, Jackson, Donnelly and Schellinger2012). We then received much older OSL ages for the same cores, which allowed calculation of the lag time between deglaciation (OSL ages) and lake-basin development (radiocarbon ages). A byproduct of the results is calculating the lag time for these two moraines, which we compare with lag times determined from the western side of the Lake Michigan Lobe. Lastly, a simple model of the melt-out of buried ice is used to explain how OSL ages of varying deglacial age can be present both beneath and at the base of a lake basin.

Figure 2. (color online) Location of the Shipshewana and Sturgis moraines and lakes cored on a regional digital elevation model. Black arrows are flow directions on fans recording former ice-margin positions.
Background and study area
It has long been thought that the Lake Michigan, Saginaw, and Huron-Erie lobes converged in southern Michigan and northern Indiana to form a complex interlobate region (Wayne, Reference Wayne1963). Descriptions of crosscutting relationships of tunnel channels on both sides of the Sturgis Moraine support this long-lived concept of complex interactions among the lobes (Leverett and Taylor, Reference Leverett and Taylor1915; Bleuer and Moore, Reference Bleuer and Moore1974; Fullerton, Reference Fullerton1980; Kehew et al., Reference Kehew, Nicks and Straw1999; Larson and Schaetzl, Reference Larson and Schaetzl2001; Krist and Lusch, Reference Krist, Lusch, Ehlers and Gibbard2004). The Maxinkuckee Moraine is close to the maximum extent of the Saginaw Lobe (Fig. 1; Wayne, Reference Wayne1963) and there are several recessional moraines in northeast Indiana including the Shipshewana Moraine (Fig. 1 and 2). Between it and the Sturgis Moraine to the north is the broad Pigeon River meltwater channel (Fig. 2).
The Sturgis Moraine was first described by Leverett and Taylor (Reference Leverett and Taylor1915) as a distinct ridge with associated large outwash fans extending south and west (Fig. 2) with up to 25 m local relief. It has been explained as a thrust moraine by Fleming et al. (Reference Fleming, Brown, Smous and Schrader1997), but, from pits within the moraine, thick sequences of glaciofluvial boulder gravel are horizontally bedded (Fisher, unpublished data). The moraine lies in southern Michigan as part of the Sturgis Hills physiographic region (Schaetzl et al., Reference Schaetzl, Enander, Luehmann, Lusch, Fish, Bigsby, Steigmeyer, Guasco, Forgacs and Pollyea2013) and trends just into northeast Indiana. The moraine is at the distal end of a drumlinized till plain and network of tunnel channels (Fisher and Taylor, Reference Fisher and Taylor2002; Fisher et al., Reference Fisher, Jol and Boudreau2005; Kehew et al., Reference Kehew, Esch, Kozlowski and Ewald2012, 2018). Some tunnel channels appear to end at the moraine, but others extend farther to the south beneath the Sturgis Moraine and outwash fan as revealed by collapsed topography (Fig. 2; Kehew et al., Reference Kehew, Nicks and Straw1999). The distal end of the Sturgis Moraine outwash fan is crosscut by a younger outwash plain or fan recording a meltwater source to the east. Southwest of this scarp the fans appear to merge with the Pigeon River outwash terraces (Fig. 2) recording flow from the Huron-Erie Lobe to the east (Fleming et al., Reference Fleming, Brown, Smous and Schrader1997). Farther up-ice there are many recessional moraines (e.g., Kalamazoo Moraine) mapped by Leverett and Taylor (Reference Leverett and Taylor1915), before reaching the Saginaw Bay lowlands (Fig. 1).
The Lake Michigan, Saginaw, and Huron-Erie lobes reached their LGM (Fig. 1A) at about 24 cal ka BP (Heath et al., Reference Heath, Loope, Curry and Lowell2018; Loope et al., Reference Loope, Antinao, Monaghan, Autio, Curry, Grimley, Huot, Lowell, Nashp and Florea2018). The chronology for recession of the Saginaw Lobe between northern Indiana and Saginaw Bay is weakly constrained by radiocarbon ages. Correlations of moraines from the adjacent lobes were used to develop retreat isochrones (Fullerton, Reference Fullerton1980; Monaghan et al., Reference Monaghan, Larson and Gephart1986; Dyke, Reference Dyke2004) with the ~19.3 cal ka BP (16.0 14C ka BP) isochron placed just south of the Sturgis Moraine, making the moraine age slightly younger than ~19.3 cal ka BP if correlation from the adjacent lobes are correct and the moraine records a simple recessional pattern. If the Sturgis Moraine formed in response to the Port Bruce readvance, the moraine landform and associated outwash may be considerably younger at ~17–18 cal ka BP (Dyke, Reference Dyke2004).
Dated moraines and geomorphic events suggest that the study area (Fig. 2) was deglaciated before ca. 19 cal ka BP, and that the Saginaw Lobe had retreated north to the Saginaw Bay lowlands by ca. 16.8 cal ka BP (Fig. 1B). Saginaw Lobe recession chronology is constrained by the age of the Kankakee Torrent and meltwater drainage through the Imlay Channel (Fig. 1B). First hypothesized by Ekblaw and Athy (Reference Ekblaw and Athy1925), the Kankakee Torrent is a large outburst-flooding event from the Michigan, Saginaw, and Huron-Erie lobes. Evidence of its flow is present in Illinois and Indiana and includes large streamlined bars, abandoned high-level channels, and widespread outwash. Similar features are seen in Michigan associated with the Central Kalamazoo River Valley and, while attributed to subglacial flow from the Saginaw Lobe positioned at the Kalamazoo Moraine (Fig. 1B) (Kozlowski et al., Reference Kozlowski, Kehew and Bird2005) and Sturgis Moraine (Fisher and Taylor, Reference Fisher and Taylor2002), the source of the meltwater is uncertain (Curry et al., Reference Curry, Hajic, Clark, Befus, Carrell and Brown2014) and could include subglacial and/or subaerial sources from all three lobes. Radiocarbon ages from Illinois related to the Kankakee Torrent provide a minimum age of 19.0 cal ka BP (Curry et al., Reference Curry, Hajic, Clark, Befus, Carrell and Brown2014).
A younger, but important Saginaw Lobe ice margin is south of the Port Huron Moraine complex (PHMC) that controlled proglacial lake drainage across the Thumb of Michigan. The Imlay channel was a drainage outlet for glacial Lake Maumee in the lakes Erie and Huron basins (Fig. 1B). For the channel to be active, ice must have retreated some distance across the Saginaw Lowlands for drainage to occur across southern Michigan (Fig. 1B) and into glacial Lake Chicago within the Lake Michigan basin during early Glenwood Phase (17–15 cal ka BP; Fig. 1B; Curry et al., Reference Curry, Bruegger and Conroy2018b). A new minimum-age radiocarbon date for deglaciation of the Imlay channel is 16.7–16.9 cal ka BP (Beta-492602; Luczak, 2018) that replicates the age of 16.3–17.0 cal ka BP (I-4899) from leaf materials at Weaver Drain just north of the Imlay Channel (Fig. 1B; Burgis, Reference Burgis1970; Eschman and Karrow, Reference Eschman, Karrow, Karrow and Calkin1985). OSL ages along beaches in northwest Ohio of the Lake Maumee stage of Ancestral Lake Erie are a similar age (Fisher et al., Reference Fisher, Blockland, Anderson, Krantz, Stierman and Goble2015). North of the Imlay channel, younger ages of 14.9–16.1 cal ka BP (Blewett et al., Reference Blewett, Winters and Rieck1993) and 15.5–15.9 cal ka BP (Gravenor and Stupavsky, Reference Gravenor and Stupavsky1976) are assigned to the PHMC, which are consistent with the age assignment of ~15.9 cal ka BP to proglacial Lake Whittlesey (Calkin and Feenstra, Reference Calkin, Feenstra, Karrow and Calkin1985), a lake younger than Lake Maumee. Aside from radiocarbon ages associated with either the Imlay channel outlet on the Thumb of Michigan, or the Kankakee Torrent, most radiocarbon ages from terrain once covered by the Saginaw Lobe are considerably younger than ages of deglaciation from regional deglacial reconstructions (Dyke, Reference Dyke2004; Krist and Lusch, Reference Krist, Lusch, Ehlers and Gibbard2004).
More recent work farther north of this study area in Michigan used OSL dating to provide a maximum average age of ca. 27 ka for ice advance into the highlands of the Lower Peninsula of Michigan (Schaetzl and Forman, Reference Schaetzl and Forman2008) and suggested an earlier-than-expected retreat from the same highlands at ca. 23 ka (Schaetzl et al., Reference Schaetzl, Lepper, Thomas, Grove, Treibert, Farmer, Fillmore, Lee, Dickerson and Alme2017). For this study, assuming that OSL dated sand is stratigraphically above till of the last ice advance, then the oldest OSL ages can be used as the constraining minimum limiting ages for deglaciation.
METHODS
Sediment cores with basal ages from nine lakes (Table 1) were used to establish minimum ages for the Shipshewana and Sturgis moraines. Locations of the cored lakes are shown on a regional digital elevation model (DEM) of the study area (Fig. 2) with close-up views in Figure 3. Sites were selected for a mix of kettle lakes and lakes in tunnel channels on and adjacent to the Shipshewana and Sturgis moraines (Fig. 1 and 2). Hunter, Stone, Bullhead, and Meteer lakes are generally circular in shape and are classified as kettle lakes. Thompson, Fish, Sweet, Fennell, and Wall lakes are within tunnel channels. Fennel Lake is at the head of a tunnel channel on the proximal side of the Sturgis Moraine. Meteer Lake is a kettle lake between the Shipshewana and Sturgis moraines and in the same palimpsest tunnel channel as Sweet Lake. It is assumed that lakes within tunnel channels filled upon retreat as water ponded within the topographic depressions incised by subglacial meltwater. Some tunnel channels in the study site are palimpsest, however, revealed by chains of depressions and kettles, suggesting that after their formation they were filled with ice and either survived a subsequent readvance (Kehew et al., Reference Kehew, Nicks and Straw1999) or were buried by outwash. Thus, the lakes from palimpsest tunnel channels likely formed in a similar manner as kettle lakes, such as Meteer Lake. Organic material collected for AMS radiocarbon-dating was either from logs penetrated by the Livingstone coring tube, or organic fragments wet sieved from basal sediment.

Figure 3. (color online) Closeup DEMs of kettle and tunnel channel lakes cored (white dots). Individual lakes are (A) Stone (upper), Hunter (lower), (B) Bullhead, (C) Fish, (D) Fennell, E) Thompson, F) Meteer, G) Sweet, H) Wall. Scale, north at the top, and hypsometric tinting in (A) is the same for all panels. See Figure 2 for location of lakes.
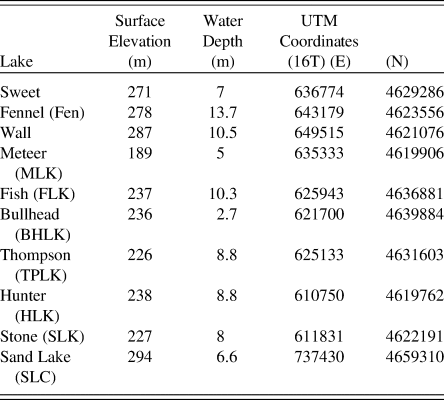
Table 1. Coring locations.
Sediment coring and processing
The lakes were cored with overlapping 1-m thrusts from lake ice or an anchored canoe-catamaran raft using a modified Livingstone corer (Wright, Reference Wright1967) with a customized hydraulic-assist. The core from Sand Lake, MI was collected January 2012, and cores from Fennel, Sweet, and Wall lakes were collected in January 2014. Cores from Thompson, Fish, Bullhead, Hunter, and Stone lakes were collected between June 2015 and February 2016, and then were split, photographed and scanned for magnetic susceptibility (MS) using a Geotek MSCL-XYZ automated core logger in 0.5-cm increments at the LacCore facility, University of Minnesota. The remaining cores and additional analyses not performed at LacCore were analyzed in the GLASS lab at the University of Toledo. Additional analysis included loss-on-ignition (Heiri et al., Reference Heiri, Lotter and Lemcke2001), particle size analysis using a Malvern Mastersizer 2000 (Malvern Instruments, 2007), and magnetic susceptibility (MS). MS is used for evaluating the iron-bearing sediment within the core, which is generally associated with detrital sediment in which higher values are associated with higher energy depositional environments (Dearing, Reference Dearing1999). Ratios of organic C and N were measured in the USDA Agriculture Research Service (ARS) laboratory at the University of Toledo through high temperature combustion with a vario MIRCO cube CN analyzer by Elementar. Ratios of ≥ 20 record vascular plant tissue, 4–10 record phytoplankton, and 10–20 indicate a mixture of the two (Meyers and Lallier-Verges, Reference Meyers and Lallier-Verges1999). Unprocessed cores from five of the lakes were imaged with an X-ray computed tomography (CT) scanner at the University of Toledo Medical Center. CT scanning produces images displaying changes in density through the lower sediment core sections with the same color scheme for all cores. Radiocarbon samples were calibrated using Calib 7.10 (Stuiver et al., Reference Stuiver, Reimer and Reimer2018) using the IntCal13 calibration dataset (Reimer et al., Reference Reimer, Bard, Bayliss, Beck, Blackwell, Ramsey and Buck2013), and are reported with one-sigma error.
Pollen
Pollen analysis was used to generate low-resolution ages for the sediment as a check for any sediment-age assignments generated from radiocarbon and OSL dating. Samples of 2.5-ml volume were disaggregated using dilute (0.02%) sodium hexametaphosphate. Carbonates were dissolved using 10% HCl and silicates were dissolved using undiluted (48–52%) HF in a warm water bath for ca. 15 minutes each. A tablet containing Lycopodium spores as marker particles was added during HCl treatment. Between each step, samples were centrifuged at 3000 rpm for 3 minutes and residues were rinsed with distilled water. Residues were sieved using a 10 μm Nitex mesh prior to mounting using glycerin jelly. Samples were analyzed for pollen at 400 × magnification using a Leica DMLB microscope and identified using the key of McAndrews et al. (Reference McAndrews, Berti and Norris1973). A minimum count of 150 pollen and spores was achieved in all samples except from Thompson Lake (TLK). Pollen was sparse in one of the samples from Wall Lake (WLK-2), but relative abundances were calculated based on an acceptable count of 126 grains. One of the samples from Hunter Lake (HLK-1) was barren. Pollen assemblages were compared with the well-dated, late glacial-to-early Holocene sequence from Appleman Lake, Indiana (Fig. 2; Gill et al., Reference Gill, Williams, Jackson, Lininger and Robinson2009) and Crystal Lake, Illinois (Gonzales and Grimm, Reference Gonzales and Grimm2009) as well as Silver Lake, Ohio (Gill et al., Reference Gill, Williams, Jackson, Donnelly and Schellinger2012) to provide age estimates. Interpretations of paleovegetation and climate were based on the atlas of Williams et al. (Reference Williams, Shuman, Bartlein, Whitmore, Gajewski, Sawada and Minckley2006).
Luminescence dating
Samples for OSL ages were collected from companion cores directly extruded into black ABS (acrylonitrile-butadiene-styrene) tubing. After reviewing the primary cores, targeted segments for OSL dating were shipped to the Optical Dating and Dosimetry Lab at North Dakota State University, where they were prepared for OSL analysis. Stratigraphic descriptions from the primary core were used to select primary OSL sampling layers in sands. Visual and textural differences among layers were evident even under subdued laboratory lighting.
A small portion from each sampled layer was set aside for elemental analysis of K, Rb, U, and Th via instrumental neutron activation (INAA). In three of the five cores, the target sampling layers were thin (<40 cm thick). For these cores INAA sub-samples were also collected from units that were within 30 vertical cm above and below the primary sampling layer. These layers within 30 cm would contribute to the gamma dose rate of the primary sample layers. The fractional gamma dose rate contribution of each layer was modeled based on the volume of a sphere with a radius of 30 cm with the sample layer occupying the equatorial region. Using this transformation and the thicknesses of the sampled layers, the fractional dose rate contributions from each layer were calculated. The fractional contributions, layer dose rates, and total sample dose rates are shown in Supplementary Table 1 and layer thickness differ somewhat from cores shown in Figure 4, as they were from companion cores a few meters away. All samples were saturated with water and were presumed to have been throughout their residence time below the lakes. Dose rates for individual layers were calculated following the methods presented in Aitken (Reference Aitken1985, Reference Aitken1998) and Prescott and Hutton (Reference Prescott and Hutton1988, Reference Prescott and Hutton1994). Cosmic dose rates were adjusted for the filtering effect of the water in the lake based on the depth of the lake at the coring locations (Supplementary Table 1; Osterhuber et al., Reference Osterhuber, Gehrke and Condreva1998).

OSL measurements were made on clean, etched, quartz in the fine sand (FS, 150–250 μm) and medium sand (MS, 250–355 μm) fractions. The purity of the processed quartz sands was verified by infrared screening (Short and Huntley, Reference Short and Huntley1992). Additional information regarding sample processing can be found in the supplement to Lepper et al. (Reference Lepper, Fisher, Hajdas and Lowell2007).
OSL measurements and calibration irradiations were conducted using a Risø DA-15 automated TL/OSL reader system. The system is equipped with a 90Sr/90Y ß-source for dose calibrations, which irradiated at a rate 0.115 Gy/s. Luminescence was stimulated with blue light (470 ± 30 nm) from a diode array and measured with an EMI model 9235QB PMT in the UV emission range (5 mm Hoya U-340). OSL single-aliquot regenerative dose (SAR) procedures (Murray and Wintle, Reference Murray and Wintle2000; Wintle and Murray, Reference Wintle and Murray2006) were used to determine equivalent doses (Des) for 95 or 96 individual aliquots from each field sample. Data filtering (described in Argyilan et al., Reference Argyilan, Lepper, Thompson, Fisher and Hansen2014) yielded equivalent dose (De) distributions containing 87 to 95 viable observations per field sample. The use of over 50 De observations for each sample permits more robust statistical analysis and leads to increased precision and confidence in individual ages (Rodnight, Reference Rodnight2008).
OSL equivalent dose distributions obtained from samples in this study were symmetric (M/m < 1.05), except for sample UT1607, which was positively asymmetric in both grain size fractions (M/m ≥ 1.05). Therefore, the mean and standard error of the OSL De distributions were used as the basis for age calculation for all samples other than UT1607. For UT1607 the “leading edge” method was used to select an age-representative equivalent dose (see supplement to Lepper et al. [2007]). Age errors presented in Table 2 are fully propagated uncertainties (Aitken, Reference Aitken1985) or what is commonly inferred to be “1-sigma” error.
Table 2. Radiocarbon ages.

RESULTS
Lake stratigraphy
The lithostratigraphy of the nine sediment cores (Fig. 4) are described with an emphasis on the lowermost few meters to reconstruct the earliest depositional environment. Radiocarbon ages (Table 2) and OSL data and ages (Tables 3 and 4, Supplementary Table 1) are from the lowermost sediment lithofacies in each lake. The general stratigraphy of all cores is basal pebbly or silty sand overlain by organic-rich silt capped with sapropel. The lithostratigraphy with various environmental proxy data for each core are shown on Figure 4. Results from Sand Lake, MI are given later.
Table 3. OSL age results and related data. OSL measurements were made on two grain size fractions: FS 150–250 μm with a BAF of 0.89 or MS 250–355 μm with a BAF of 0.84.

a Number of aliquots used for OSL De calculation/number of aliquots from which OSL data were collected. Filtering criteria given in Argyilan et al. (Reference Argyilan, Lepper, Thompson, Fisher and Hansen2014).
b Mean/median ratio: a measure of dose distribution symmetry/asymmetry. See supplement to Lepper et al. (Reference Lepper, Fisher, Hajdas and Lowell2007).
c Total dose distribution data dispersion (Std. dev./Mean).
d Dose recovery fidelity. Refer to “check dose” in Lepper et al. (Reference Lepper, Agersnap-Larsen and McKeever2000) and supplement to Lepper et al. (Reference Lepper, Fisher, Hajdas and Lowell2007).
e Mean and Std. Err. for all samples except UT1607, which had a positively asymmetric dose distribution. For sample UT1607, the “leading edge” method was used. See supplement to Lepper et al. (Reference Lepper, Fisher, Hajdas and Lowell2007).
f Dose rates for individual layers were calculated following the methods described in |Aitken (Reference Aitken1985, Reference Aitken1998) and Prescott and Hutton (Reference Prescott and Hutton1988, Reference Prescott and Hutton1994).
g Fully propagated age uncertainty (Aitken, Reference Aitken1985).
Table 4. Concentration of dosimetrically relevant elements from instrumental neutron activation analysis (INAA)a. The primary sample layers are indicated in bold and have the designation (u1).
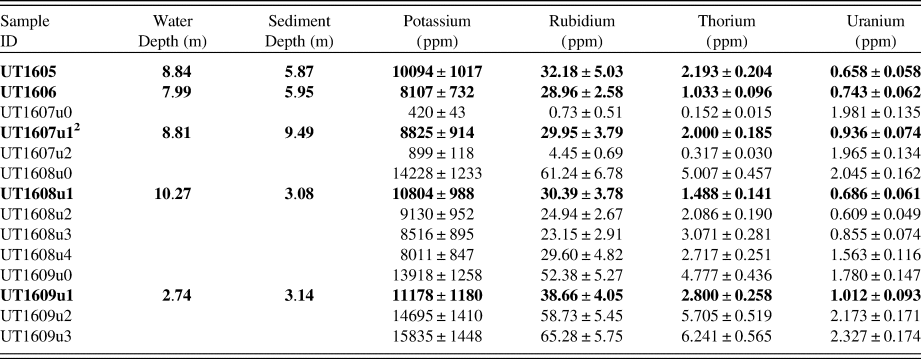
a Instrumental neutron activation analysis (INAA) performed at The Ohio State University Nuclear Reactor Laboratory. INAA data reduction was carried out by Scientific Consulting Services, Dublin, OH.
Lithofacies A
Lithofacies A is massive to weakly-stratified pebbly sand with minor amounts of silt. In lakes where multiple units are present, lower contacts can be flat or angular, sharp or gradual. Lithofacies A is the basal lithofacies in each core except Fennel Lake. Lithofacies A thickness is unknown due to incomplete penetration of the unit. Bending of thrust rods and jacking up of coring equipment on the lake ice or canoe-catamaran raft points to large clasts or very dense sediment within or beneath the pebbly sand. Recovered pebbles were typically in the fine-to-medium range. Percentage organic matter values were <2%, but up to 4–5% in Fish and Hunter lakes. Carbonate values were between 2.5–6% but higher in Stone and Fish lakes (22%). The magnetic susceptibility (MS) values in this lithofacies varied between the lakes (Fig. 4) between 0–165 SI units. They were much higher in Sweet and Wall lakes than Fennel Lake, consistent with the finer-grained sediment in Fennel Lake. C/N ratios were generally very high, between 100 and 1000, except for Bull Lake, where they were between 26 and 69. Abundance of terrestrial macrofossils varies among the cores.
Lithofacies B
Lithofacies B is sandy silt with usually a gradational lower contact with pebbly sand. Organic matter and carbonate values of lithofacies B were a few percentage points higher than in the pebbly sand lithofacies. The MS values were indistinguishable from the clayey silt above it.
Lithofacies C
Lithofacies C is clayey silt with a sharp lower contact in five of the cores. Sand content decreases up-core within the lithofacies. Organic matter content is between 2–7%, but much higher in Sweet Lake, ranging between 6–36%. Carbonate values are between 4–45%. MS values are variable among the lakes, often decreasing in value up-core. Nitrogen is nearly absent, resulting in high C/N ratio (>60). In Meteer Lake, much of the basal section of the core was brecciated, with some of the individual blocks resembling lithofacies C.
Lithofacies D
Lithofacies D is herbaceous peat, found only in Meteer and Bullhead lakes. Fragments of plant material (fibrous) are common. MS and carbonate values are very low, while organic matter values ranged between 25–80%. Any remaining material is expected to be silt and clay, but particle size analysis on this unit was not attempted because of the high organic content. The C/N ratios are <20, suggesting minimal terrestrial organic matter. The lower contact is gradational across 10 cm in Bullhead Lake, and in Meteer Lake the peat is part of brecciated lithofacies F.
Lithofacies E
Lithofacies E is dark colored, massive sapropel, which is found in each lake. There is some silt with increasing clay percentages up-core. Organic carbon contents are between 10 and 40%, and carbonate is <5%. MS is <20 SI. C/N ratios are 20 to 40. A gradual lower contact over 1–2 cm is present between this lithofacies and lithofacies C.
Lithofacies F
Lithofacies F is brecciated sediment composed of lithofacies A, C, and/or E, found only in Thompson and Meteer lakes. Sharp contacts exist between this lithofacies and lithofacies A, but distinguishing between large angular clasts of brecciated sediment and separate in situ sedimentary units is not always clear. The individual units record past early conditions within the lake. Organic carbon and carbonate contents are variable, ranging from 3–65% and 5–42%, respectively, which is expected from the varying sediment units sampled. From Thompson Lake MS values are irregular (~0–70 SI) and C/N values are high (>500).
Meteer and Thompson lakes differed from the other lakes by peat and brecciated sediment sharply overlying the basal, pebbly sand lithofacies. The brecciated lithofacies is explained by escaping ground water or slumping, both mechanisms possibly aided by melting of buried ice, or loading by overlying sediment. In Meeter and Thompson lakes, if the peat records low water levels then a rising water table may have led to density instabilities.
Pollen analysis
Age brackets for the discreet pollen samples are shown in Figure 4 and were assigned based on pollen results from well-dated cores located nearby (see methods section). The pollen ages were always in agreement with other dating method results from the same sedimentary unit. Several samples from different cores had very similar pollen assemblages, suggesting coeval deposition in a similar environment across the study area. Relatively sparse pollen assemblages in samples TLK-2 and WLK-2 were co-dominated by spruce (~47–54% Picea) and upland herbs (~28–29% Poaceae, Chenopodiaceae, Artemisia, and Ambrosia and other Compositae) with common sedge (~9–11% Cyperaceae). This pollen assemblage represents a proglacial forest-tundra and assigned an age of 14–16 ka. A patterned fen environment at the sites of Wall and Thompson lakes is consistent with the algal palynomorph assemblage containing desmids and other green algal palynomorphs and the presence of the pollen of several aquatic plants (Typha, Myriophyllum, Nymphaea, and Potamogeton; Hall and McCourt, Reference Hall, McCourt, Wehr, Sheath and Kocolek2015; John and Rindi, Reference John, Rindi, Wehr, Sheath and Kocolek2015).
An age of 14–16 ka was assigned to richer samples WLK-1, HLK-2, and HLK-3 (Fig. 4) that were strongly dominated by spruce (~60–73% Picea), with common upland herbs (~8–15% Poaceae, Chenopodiaceae, Artemisia, and Ambrosia and other Compositae) with common sedge (~1–7% Cyperaceae). Boreal tree taxa (Abies and various northern hardwoods like Alnus, Betula, Populus, and Salix) are also more reliably present in the pollen assemblage, than in samples WLK-2 and TLK-2, recording slightly warmer temperatures, longer growing season and drier conditions, and better regional drainage that might be consistent with the warmest part of the Bølling-Allerød interstadial. Benthic desmids are rare but colonial green algae like Botryococcus and Pediastrum were more common than in WLK-2 and TLK-2, suggesting a rise in water table, producing a eutrophic and/or turbid lacustrine depositional environment rather than a fen.
Samples TLK-1 and TLK-3 differed markedly from those described above, with pollen assemblages recording much warmer and drier conditions than in sample TLK-2, so duplicate samples were processed and examined from the Thompson Lake core to ensure that samples had not been mislabeled. Sample TLK-3, less than 20 cm above the spruce-dominated sample TLK-2, is dominated by oak (Quercus ~38%) with common pine (Pinus ~10%) and sugar maple (Acer saccharum ~2%), and walnut (Juglans nigra ~1%). The abundant pollen contains significant abundances of thermophilous elements like hickory (~ 6% Carya and ~2% Nyssa), consistent with deposition during the Holocene and is assigned an age of <11 ka (Fig. 4). Although there is no visible change in lithology in the core, the pollen records a substantial hiatus between these samples. Relatively abundant and diverse algal palynomorph assemblages in sample TLK-1 record a mesotrophic to eutrophic lacustrine environment during the Early Holocene, unlike the fen that existed at the site of Thompson Lake during the late Wisconsinan. Sample TLK-1 underlies/ predates the spruce-rich sample TLK-2. It is dominated by pine (Pinus ~59%) with common oak (Quercus ~12%) and elm (Ulmus ~7%), and even contains rare southern hardwoods like hickory (Carya ~2%), sugar maple (Acer saccharum ~2%), and walnut (Juglans nigra ~1%). An age could not be assigned to this sample below a sharp undulating contact indicative of an unconformity.
Radiocarbon and OSL ages
The oldest radiocarbon ages are from the base of each core (Fig. 4, Table 2). Where OSL and radiocarbon ages from the same sedimentary unit are not in agreement, the oldest (most limiting) radiocarbon ages for the lakes are thousands of years younger than the OSL ages. For cores with multiple ages, the pollen, radiocarbon, and OSL ages are in stratigraphic order except possibly for the brecciated lithofacies in Thompson Lake where the OSL age from sand is ~6000 yr older than an undetermined pollen age bracket from underlying sandy silt. Brecciated sediment in Meteer Lake was not dated. The δ13C values (-23.6–29.8; Table 2) reveal that terrestrial plant material was dated, requiring that material was transported from the deglaciated landscape into the lake. Thus, the ages are maximums for their encasing lacustrine sediment, but minimums for the lake basin.
The oldest radiocarbon ages from most of the lakes are very similar, overlapping at the 2-sigma level, with the oldest age of 16.61 cal ka BP from Wall Lake. The average median calibrated age from four lakes associated with the Sturgis Moraine is 16.3 cal ka BP, and 16.0 cal ka BP for the Shipshewana Moraine, with the one site at Meteer Lake between the two moraines dated to 16.2 cal ka BP. Without a pattern of decreasing age with distance along the south-to-north deglacial transect, the basal radiocarbon ages offer little value in establishing limiting ages for sequential ice-margin recession. However, the common median age of ~16.2 cal ka BP from the study site instead suggests that an ameliorating climate following an earlier deglaciation may better explain the nearly ubiquitous radiocarbon ages across the study area and regionally (Fig. 1B; Glover et al., Reference Glover, Lowell, Wiles, Pair, Applegate and Hajdas2011).
Although Sand Lake, MI, east of the study area (Fig. 1B), is more closely associated with the Fort Wayne Moraine or interlobate area between the Saginaw and Huron-Erie lobes, the basal age is included here because it is very similar to the ages from this study. The date of 16.4–16.6 cal ka BP from a twig near the base of a sequence of nearly 1000 rhythmites within the circular lake (Fig. 5) overlaps with the oldest radiocarbon ages from the study area, and the oldest radiocarbon age reported by Glover et al. (Reference Glover, Lowell, Wiles, Pair, Applegate and Hajdas2011) for the northern margin of the Huron-Erie Lobe (Fig. 1).
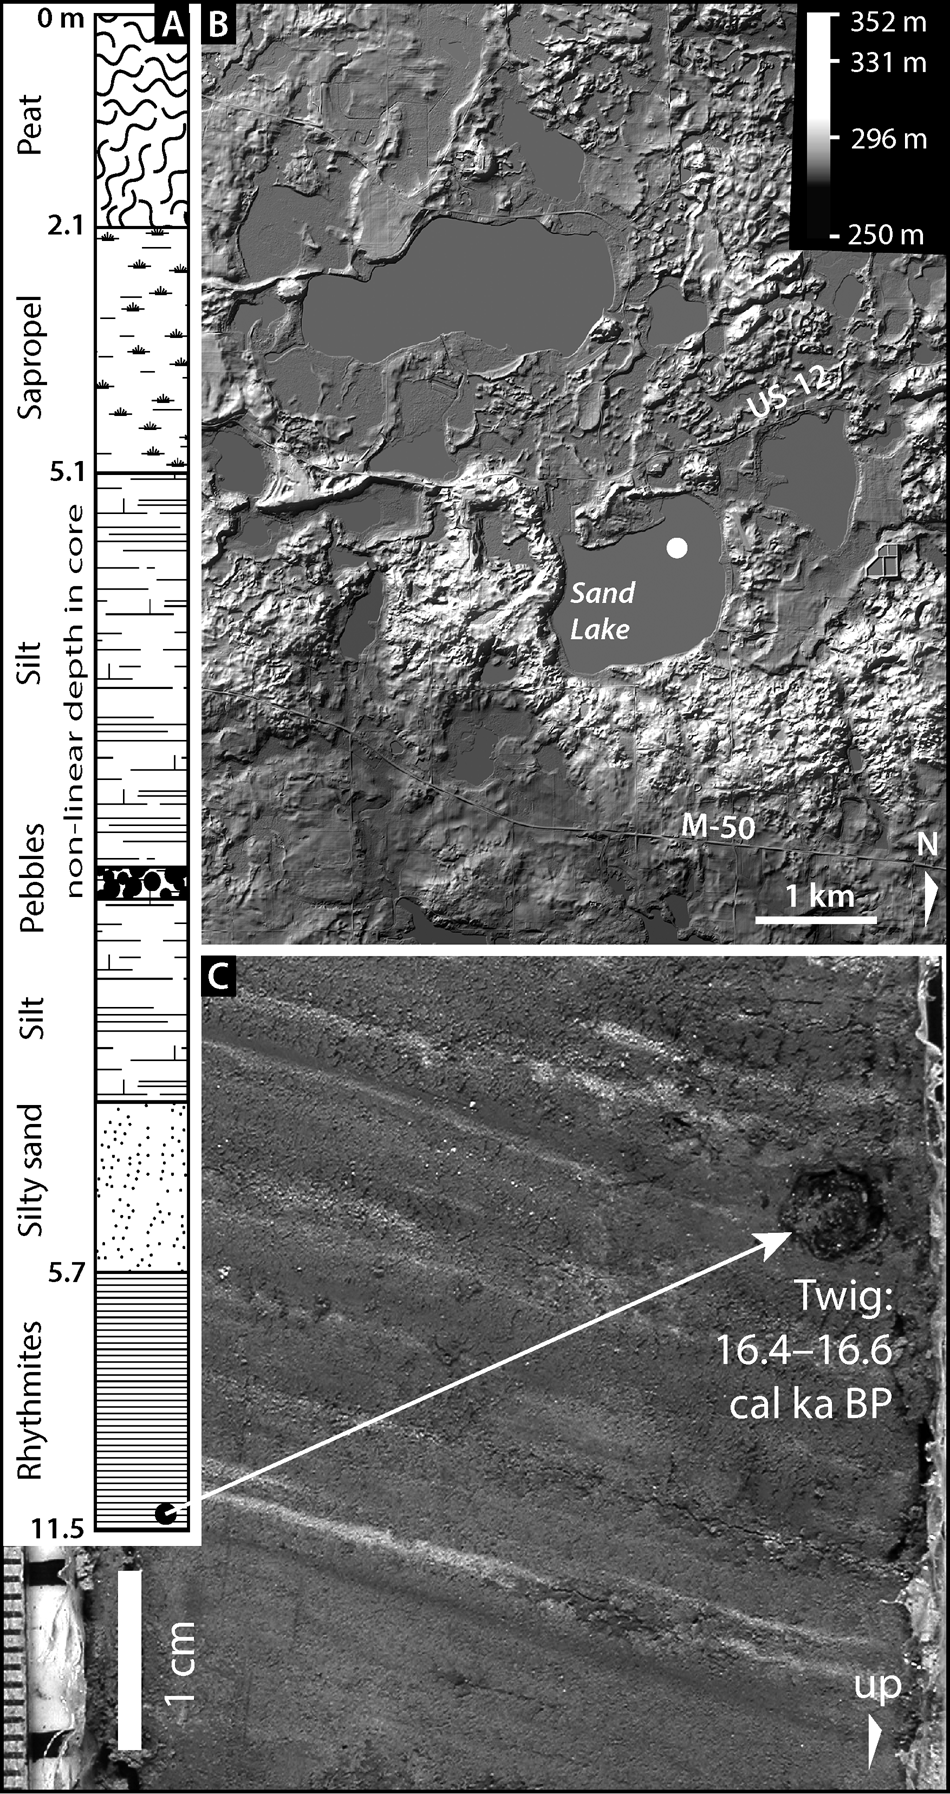
Figure 5. Geomorphology and sediment core from Sand Lake, Lenawee Co., Michigan (Fig. 1, Table 1). (A) Sediment core lithology, note non-linear depth scale. (B) Digital elevation model of Sand Lake, with core site indicated by white circle. (C) Rhythmically laminated sand, silt, and clay with radiocarbon dated twig identified. Approximately 1000 rhythmites were counted above the twig.
The OSL ages (Fig. 4, Table 3, dosimetry data in Table 4 and supplementary data in Supplementary Table 1) are in stratigraphic agreement with results from the other dating methods. The sample from Thompson Lake has a M/m measure of symmetry greater than 1.05 and dispersion (coefficient of variation—upsilon in the table) greater than 0.30; both are strong indicators of partial resetting, and it would be consistent with outwash or high turbidity fluvial transport. The samples from Hunter and Stone Lake have high dispersion but the M/m measure is less than 1.05, suggesting that the samples were reset prior to deposition, but have poor dosimetric characteristics. Resetting is based on sediment transport dynamics, however, dosimetric properties are based on inherent properties of the sediment grains, such as defect structure. The samples from Fish and Bullhead Lake have De distribution characteristics indicating they were fully reset (symmetric and relatively low dispersion) but are likely not eolian.
Cores with OSL and radiocarbon ages yielded chronologically consistent results within error. For example, the pebbly-sand lithofacies in Bullhead Lake with a radiocarbon age of 13.3–13.4 cal ka BP overlaps with the OSL 1-sigma range of 12.7 ± 3.3 ka. In the Fish Lake core above a basal radiocarbon age of 16.1–16.3 cal ka BP is an OSL age with a 1-sigma range of 9.9 ± 2.5 ka. In the next unit above the OSL ages are three pollen age brackets of <8 ka. For Hunter Lake the average of the two OSL ages (14.6 ± 1.5 ka) overlaps with the radiocarbon age (15.9–16.1 cal ka BP) from the same pebbly sand lithofacies. More wood in the overlying sandy silt lithofacies (Fig. 4) is the same age (15.9–16.1 cal ka BP), and the two pollen age brackets in the overlying clayey silt lithofacies record a similar time interval (14–16 cal ka BP). Agreement between the three dating methods from the same and adjacent sedimentary units gives confidence in OSL dating results from sand within sediment cores from basal lake sediment or lower, older stratigraphy.
For the two much older pebbly sand units dated with OSL accompanying wood was not present. The OSL ages from Stone Lake of 23.6 ± 2.2 ka (medium sand) and 23.2 ± 2.2 ka (fine sand) are ~7 ka older than the wood (15.9–16.1 cal ka BP) in the overlying sandy silt lithofacies (Fig. 4). In the Thompson Lake brecciated lithofacies, the OSL age from pebbly sand (19.0 ± 1.8 ka, fine sand; 20.4 ± 2.2 ka, medium sand) underlies wood (14.9–15.1 cal ka BP) and overlies pollen of uncertain age.
DISCUSSION
Depositional environments
A challenge interpreting depositional environments from a single core in a lake is that a pebbly sand lithofacies can be deposited in a variety of lacustrine and non-lacustrine environments. Interestingly, this same lithofacies is found in every lake cored. For a kettle, if the melted ice was encased in outwash, then outwash is expected at the base of the lake after the ice melts (Fig. 6). Scour lakes within tunnel channels would also be expected to contain sand and gravel deposits recording waning flow within the tunnel channel, and, following deglaciation, lakes are expected within the low topography of tunnel channels floored by gravel, along with whatever material the channel was scoured into. However, it needs to be emphasized that many tunnel channels in the study area stratigraphically underlie outwash fans of the Sturgis Moraine and the moraine itself. Consistent with a mechanism proposed by Clayton et al. (Reference Clayton, Attig, Mickelson, Mickelson and Attig1999), the tunnel channels must have filled with ice after their formation and then the ice was buried by outwash fans when ice was at the Sturgis Moraine, referred to as palimpsest tunnel channels (Kehew et al., Reference Kehew, Nicks and Straw1999). Thus, the sediment expected at the base of the lakes within palimpsest tunnel channels is also collapsed outwash, similar to the mechanism commonly invoked for kettles (Fig. 6). In both situations just discussed, collapsed and intact outwash would be expected to be present beneath lakes. But depending upon the position of the water table during this time, the pebbly sand lithofacies may also record fluvial reworking of the outwash and even low-relief fans on low positions of the landscape before rising water tables resulted in lakes (e.g., Hunter and Bullhead lakes; Fig. 6).
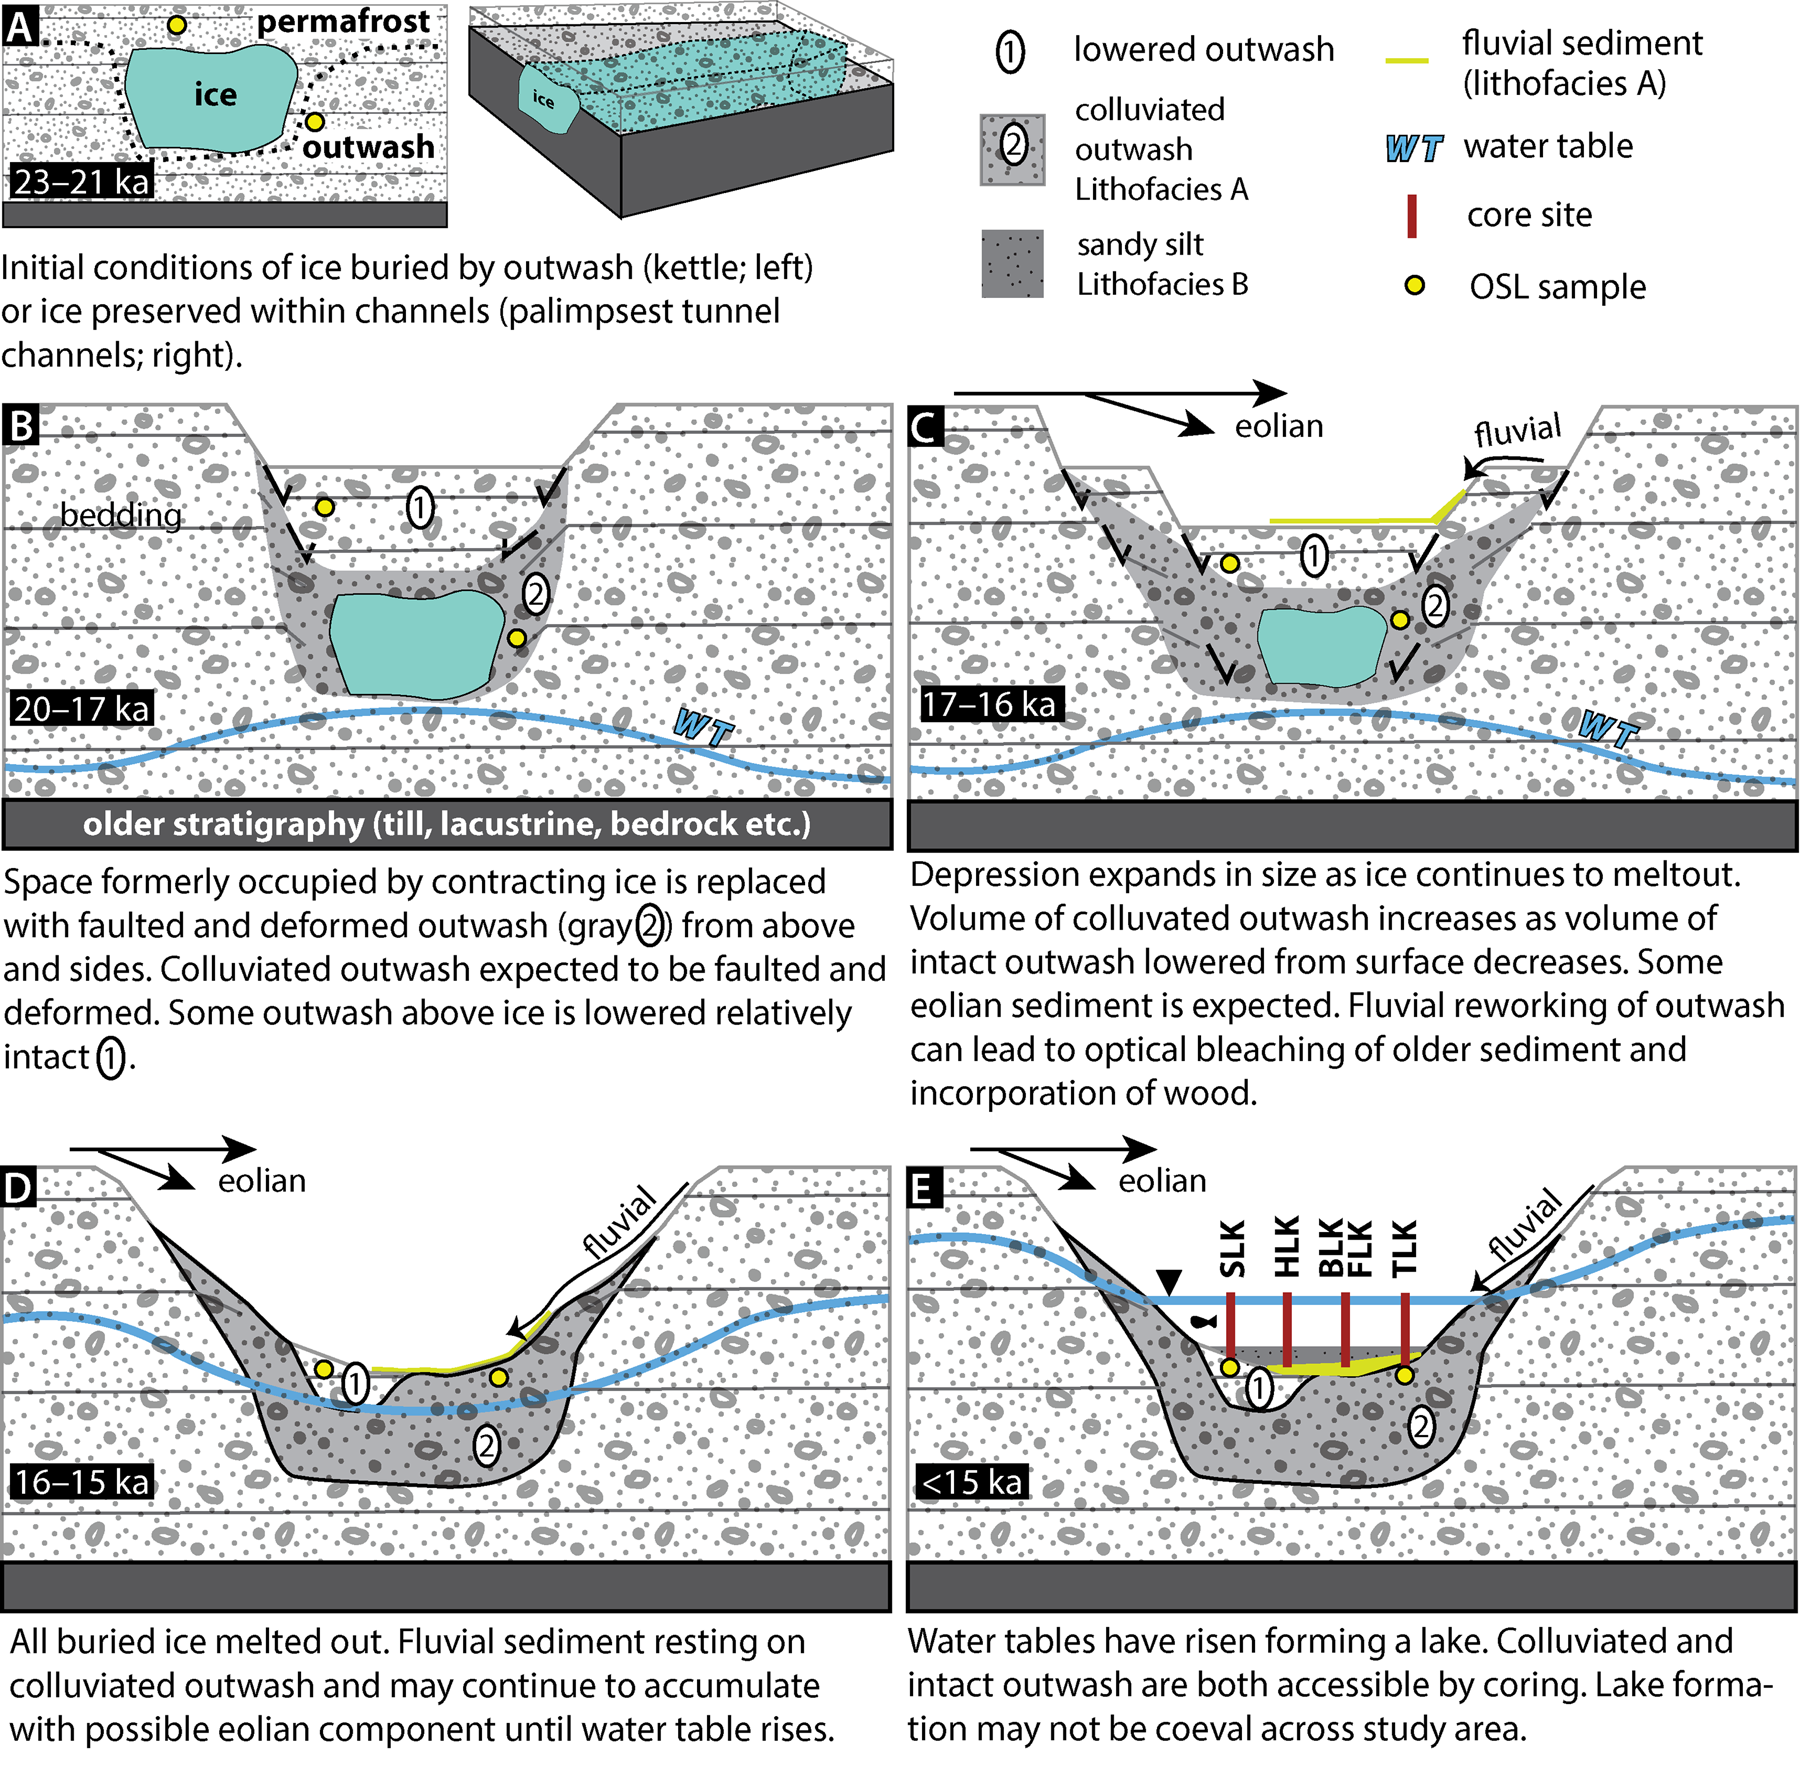
Figure 6. Model of buried ice melt-out to form kettles or depressions within palimpsest tunnel channels. For the example shown, the time sequence is for a kettle. The old (23.6 ± 2.2 and 20.4 ± 2.2 ka) optically stimulated luminescence (OSL) ages require sunlight exposure (resetting) of sand at that time recording deglaciation (panel A). During ice-block melt-out the sand may be faulted or deformed (colluviated outwash) or passively be lowered into a position on which lacustrine sediment eventually accumulates. Yellow dots are the two oldest OSL samples in outwash that can be traced through the kettle's evolution. Preservation of OSL signal can occur when sediment is not fully reset during this process (cores SLK and TLK), but when outwash is adequately exposed and reset, there is evidence of younger wood fragments being mixed into it through fluvial or mass-wasting processes (cores HLK, BLK, and FLK). Color version of figure is online. (For interpretation of the references to color in this figure legend, the reader is referred to the web version of this article.)
What does the radiocarbon record record?
An important result from this investigation is the abundance of wood in lake sediment dated between 16,000–16,500 cal yr BP, which gives the Sturgis Moraine the highest concentration of minimum ages in the southern Great Lakes region. A summed probability distribution plot of the radiocarbon ages from the study area (Fig. 7) peaks at 16.2 cal ka BP, which is interpreted as recording a warming climate with wood accumulating in lake basins. Similar ages come from basal sediment in Sand Lake, MI (Fig. 7), near the Imlay channel, MI (Luczak, Reference Luczak2018), Eagle Lake, IL (Curry et al., Reference Curry, Caron, Thomason and Florea2018c), and at Riverside, MI (Fig. 1B; Monaghan and Hansel, Reference Monaghan and Hansel1990), suggesting that all of the lobes had retreated well north of the study area when wood began accumulating in kettles associated with the Sturgis Moraine.

Figure 7. Summary of ages from the study area and those discussed from the Lake Michigan Lobe. (A) Climate proxy data (δ18O) from NGRIP, indicating that any climate amelioration within the study area at ~16.5 cal ka BP does not coincide with warming in Greenland. Data from Rasmussen et al. (Reference Rasmussen, Bigler, Blockley, Blunier, Buchardt, Clausen and Cvijanovic2014). Age distributions for (B) Saginaw Lobe and (C) Lake Michigan Lobe. Dashed black line is the probability distribution plot of all radiocarbon ages for Saginaw Lobe from this study. In (B) the offset between optically stimulated luminescence (OSL) and radiocarbon ages for Stone and Thompson lakes represents lag time between deglaciation and lake formation. Younger OSL ages from Bullhead, Hunter, and Fish Lake record younger fluvial or lacustrine sediment. In (C) the lag time in Illinois is recorded by the difference in age between oldest organics in the ice walled lake plain (IWLP) and kettle lakes associated with the same moraine.
South of the Sturgis Moraine in Indiana and Ohio, lakes are a little older. The bottommost sediment from Appleman Lake, IN, ~12 km to the south of the Sturgis Moraine was barren of dateable organic material (Gill et al., Reference Gill, Williams, Jackson, Lininger and Robinson2009), and an age projection using a sedimentation model suggests a core bottom age of ~17 cal ka BP. The basal sediment contained some charcoal, and pollen analysis revealed spruce dominance. The Silver Lake core in Ohio about 200 km southeast of the study area goes further back in time but does not record any change in climate beginning around 16.5 cal ka BP (Gill et al., Reference Gill, Williams, Jackson, Donnelly and Schellinger2012). The Crystal Lake pollen and macrofossil record from northeast Illinois begins about 17 cal ka BP with major vegetation changes lagging the Greenland ice core record by 300–400 yr (Gonzales and Grimm, Reference Gonzales and Grimm2009). The NGRIP Greenland ice core does not record a warming at ~16.2 cal ka BP (Rasmussen et al., Reference Rasmussen, Bigler, Blockley, Blunier, Buchardt, Clausen and Cvijanovic2014)—if anything, the climate record from Greenland shows cooling then. Lake-basin formation does overlap in time with the Heinrich 1 stadial but this is likely coincidental because the cooling in the North Atlantic is not expected to drive warming in the Midwest, a point made earlier by Glover et al. (Reference Glover, Lowell, Wiles, Pair, Applegate and Hajdas2011) who evaluated basal radiocarbon ages primarily to the south of this study area and observed that many basins formed at ~16.8 cal ka BP.
The basal radiocarbon ages from the sediment cores record the development of the lake basins, presumably from the melting of ice in kettles and the palimpsest tunnel channels. When these radiocarbon ages are viewed within a regional context, and with the OSL ages, the radiocarbon ages are minimum limiting ages for deglaciation.
Using OSL dating to record deglaciation
While it has long been stated that the Saginaw Lobe retreated before the adjacent Michigan and Huron-Erie lobes advanced into this space (e.g., Bleuer and Moore, Reference Bleuer and Moore1974) and deposited large volumes of outwash (Brown et al., Reference Brown, Fleming, Jones and Schrader1998), age constraints have been lacking. The results from this study suggest that the Saginaw Lobe had retreated from (1) the Shipshewana Moraine by 23.4 ± 2.2 ka based on the average OSL ages from Stone Lake on the proximal side of the moraine, and (2) Sturgis Moraine by 19.7 ± 2.2 ka based on the average OSL ages from Thompson Lake on the distal side of the moraine. The results of overlapping radiocarbon and OSL ages from the same sedimentary unit (e.g., Bullhead and Hunter lakes; Fig. 4) demonstrates an ability to OSL date sand from lacustrine cores and provides confidence in the veracity of the older OSL ages. Within the study area of the Saginaw Lobe, the oldest OSL ages record sunlight exposure of outwash or other fluvial sediment without glacial cover when the adjacent lobes were close to their maximum LGM extent 170 km farther south in south-central Indiana evidenced by radiocarbon age control (Loope et al., Reference Loope, Antinao, Monaghan, Autio, Curry, Grimley, Huot, Lowell, Nashp and Florea2018). Loope et al. (Reference Loope, Antinao, Monaghan, Autio, Curry, Grimley, Huot, Lowell, Nashp and Florea2018) report the ice margin was within ~50 km of its LGM maximum for almost 5000 yr (ca. 26–21 cal ka BP). Thus, the OSL ages from this report are recording very early recession of the Saginaw Lobe that was out-of-phase with the Lake Michigan and Huron-Erie lobes. It is likely that some type of ice-free or nunatak-style opening must have developed over the higher relief of the study area (light gray tone, Fig. 1B). Early retreat of the Saginaw Lobe was likely some combination of thinning ice and reduced ice flow through Saginaw Bay from ice in the Lake Huron basin.
The older OSL age from Stone Lake is not unusual for the region. A broader suite of deglacial OSL ages on outwash within and surrounding the Saginaw Lobe study area (Valachovics et al., Reference Valachovics, Fisher, Antinao-Rojas, Loope and Monaghan2018; Valachovics, Reference Valachovics2019) are like those from this study. Farther north on the highlands of northern Lower Peninsula of Michigan a date for deglaciation using OSL is like the Shipshewana Moraine OSL age assignment. The mean age of 23.1 ± 0.4 ka is from five OSL dates on a kame delta built into glacial Lake Roscommon (Schaetzl et al., Reference Schaetzl, Lepper, Thomas, Grove, Treibert, Farmer, Fillmore, Lee, Dickerson and Alme2017). North of this site outwash beneath till was dated at ca. 27 ka using OSL (Schaetzl and Forman, Reference Schaetzl and Forman2008). Numerous studies using the OSL method to date deglaciation of the Saginaw Lobe are consistent with each other. If deglaciation was occurring early across the central highland area of Michigan, Indiana, and Ohio (Fig. 1B), then early ice recession or stagnation could be expected elsewhere in the southern Great Lakes region.
The average OSL age of 23.4 ± 2.2 ka for the Shipshewana Moraine from this study is thousands of years older than Dyke's (Reference Dyke2004) age assignment of ~18.5–19.1 cal ka BP for initial retreat of the Saginaw Lobe across much of the Lower Peninsula of Michigan. The average OSL age of 19.7 ± 2.2 ka for the Sturgis Moraine overlaps at the higher end of Dyke's (2014) age assignment of 17.9–17.4 cal ka BP for the Port Bruce readvance of the Saginaw Lobe to the Sturgis Moraine position. Additional OSL ages north of the Sturgis Moraine from below and above till would better constrain the timing of the Port Bruce advance. If the adjacent lobes are not synchronized with the Saginaw Lobe and its moraines during its initial retreat, then using regional correlations of adjacent lobes to assign a recessional chronology to the Saginaw Lobe will not be effective. However, a regional coordination approach following recession of the southern Great Lakes lobes of the LIS following the Port Bruce stadial may be more effective, in part because it records final deglaciation of the area.
Time lags
The lag time records the interval between accumulation of the outwash, burial of the outwash by lacustrine sediment, and melting of the ice blocks until woody plants begin colonizing the landscape. The difference between the oldest OSL and radiocarbon ages represents a time lag of ~7000 yr (Table 5). For comparison, there are numerous cores from a variety of lakes and channels associated with moraines on the western side of the Lake Michigan Lobe that have been used to constrain when deglaciation began and when buried ice had melted out to form kettle lakes. The approach in Illinois to determine melt-out time lags is to use basal dates from sediment cores in ice-walled lake plains (IWLP) to record minimum ages of earliest deglaciation, and basal dates from kettles to record maximum ages of final melt-out of buried ice. IWLP begin as depressions surrounded and underlain by stagnant glacier ice and permafrost, and radiocarbon ages from their basal sediment are expected to be a close minimum age for deglaciation (Clayton et al., Reference Clayton, Attig, Ham, Johnson, Jennings and Syverson2008; Curry et al., Reference Curry, Konen, Larson, Yansa, Hackley, Alexanderson and Lowell2010; Curry and Petras, Reference Curry and Petras2011; Curry et al., Reference Curry, Caron, Thomason and Florea2018c). Individual radiocarbon ages from tundra plants in basal sediment in IWLP and kettle lakes for the Westmont and Valparaiso, Woodstock, and Minooka and Bloomington (De Kalb Mounds) moraines (Fig. 1) are listed in Supplementary Table 2 and shown graphically in Figure 7. Table 5 summarizes lag times for this study area, and between basal dates in IWLP and kettle lakes in northeastern Illinois where lag times range from 700 to 4300 yr.
Table 5. Summary of lag times.

a Cal yr BP for radiocarbon ages, calendar yr for OSL ages.
For this study area, lag times are calculated as the difference between the average OSL ages and the oldest radiocarbon age from the same core (Table 5). Note the ages from Thompson and Bullhead lakes were not included because in Thompson Lake the age is from the brecciated lithofacies, and the Bullhead Lake age is considerably younger than other lakes on the proximal side of the Sturgis Moraine. The average median lag time for northeast Illinois is 3590 yr (Table 5), which is comparable to the lag time of 3400 yr for the Sturgis Moraine. The lag time of 7400 yr for the Shipshewana Moraine is nearly double that. Variations in lag time could be expected from varying depths of permafrost and insulating layer thicknesses above ice blocks, and the processes that lead to ice melting (Blaszkiewicz, Reference Błaszkiewicz2010). Preliminary coring into IWLP associated with the Sturgis Moraine to search for tundra plants resulted in thin sedimentary sequences, all of which were oxidized. Future efforts to evaluate the Shipshewana and Sturgis moraines lag times using IWLP requires targeting lower-relief landforms containing thicker sedimentary sequences.
SUMMARY
Nine cores from lakes bracketing the Shipshewana and Sturgis moraines in northern Indiana and southern Michigan have similar lithofacies. Penetration of the entire postglacial succession was limited by gravel or sand in outwash or diamicton. The basal recovered sediment was dominated by clastic sediment that graded up-core to finer and more organic-rich sediment. In cores without brecciated (disturbed) sediment, the radiocarbon, OSL, and pollen ages overlapped within the same sedimentary unit, with all chronologic ages in stratigraphic order. We have documented at Hunter and Bullhead lakes (Fig. 4) that OSL and radiocarbon ages overlap in basal clastic-rich units, but we caution that each age-dating situation is unique, and should be tested in other situations (e.g., Loope et al., Reference Loope, Antinao, Monaghan, Autio, Curry, Grimley, Huot, Lowell, Nashp and Florea2018).
To account for the wide range in age between the basal OSL and radiocarbon samples, a model of lake-basin formation from melting-out of buried ice requires that during ice-block melt-out the OSL dated sand may have been faulted, deformed, reworked (colluviated outwash), or passively lowered into a position on which lacustrine sediment eventually accumulated. Some of the outwash was exposed to sunlight and reset during ice-block melt-out or when mass wasting or fluvial processes mixed in organics
The OSL results require deglaciation of the Shipshewana Moraine of the Saginaw Lobe of the LIS shortly after the local LGM (~24 cal ka BP; Heath et al., Reference Heath, Loope, Curry and Lowell2018; Loope et al., Reference Loope, Antinao, Monaghan, Autio, Curry, Grimley, Huot, Lowell, Nashp and Florea2018). Conservative lag times between initial deglaciation as recorded by OSL ages of outwash deposition and the oldest radiocarbon ages of organics in the base of lakes is 7400 yr for the Shipshewana Moraine and 3400 yr for the Sturgis Moraine. Lag times from IWLP and kettle lakes from moraines on the western side of the Lake Michigan Lobe are shorter, ranging from 700 to 4300 yr (Curry et al., Reference Curry, Caron, Thomason and Florea2018c).
The primary result from this study is that deglaciation from the Shipshewana (23.4 ± 2.2 ka) and Sturgis (19.7 ± 2.2. ka) moraines is 2000 to 5000 yr earlier than estimates from the literature that relied upon geomorphic correlations with adjacent lobes and moraines. This relatively early deglaciation of the Saginaw Lobe may be tested with additional OSL dating of outwash directly associated with the studied moraines (e.g., ice-contact fans). The model of melting ice blocks in kettles and the palimpsest tunnel channels can account for the long lag time and the difference in ages from early deglacial lithofacies. Permafrost likely was present during the early stage of deglaciation to account for buried glacial ice within the tunnel channels (Fig. 7). The long time gap, as much as about 7400 yr, between the maximum to syndepositional ages of the deglacial “basement” outwash based on OSL and minimum basal ages of organic-bearing collapse fill and subsequent lacustrine sediment, implies suspended geomorphic and basin-filling activity likely maintained by perennially cold conditions. Once temperature ameliorated to the point of seasonal melt, the basin likely received sediment; wood and reed macrofossils suggest growth of emergent or water-loving species, such as black spruce, that may have collapsed into the lake margin as permafrost melted and the kettle expanded.
ACKNOWLEDGMENTS
Funding was provided through the USGS Great Lakes Geologic Mapping Coalition (grants G13AC00254, G14AC00307, and G15AC00335) to Loope. Radiocarbon ages were obtained from the National Ocean Sciences Accelerator Mass Spectrometry (NOSAMS) facility supported through NSF Cooperative Agreement OCE-0753487. Horton and Dziekan received research grants from the Geological Survey of America and the University of Toledo (UToledo). LacCore provided a visiting graduate student travel award to split and describe cores to Dziekan. The USDA ARS unit at UToledo provided support for the C/N analysis. John Dilworth assisted with coring Meteer Lake, with Marni Karaffa, Jon Luczak, and Amy Towell helping at other lakes. Cheyanne Jacobs contributed to OSL sample preparation and data collection at NDSU. We acknowledge the support of The Ohio State University Nuclear Reactor Laboratory and the assistance of reactor staff for the neutron irradiation and gamma spectroscopy capabilities as well as Joe Talnagi of Scientific Consulting Services for INAA data reduction. Andrea Kalinoski, Roy Schneider, and Daniel Brainard at the UTMC assisted with CT scanning of sediment cores. Bill Monaghan is recognized for a detailed review of an earlier version of this paper. Journal reviewers Ken Munyikwa, Randy Schaetzl, and Editor Derek Booth are thanked for their detailed and thoughtful reviews.
SUPPLEMENTARY MATERIAL
The supplementary material for this article can be found at https://doi.org/10.1017/qua.2020.12.


