INTRODUCTION
Proxy-based quantifications of late Pleistocene and, specifically, last glacial maximum (LGM; ~23–19 ka BP; Mix et al., Reference Mix, Bard and Schneider2001) paleoclimate conditions are fundamental to assessing and refining climate model simulations of past and future climate states with varied atmospheric pCO2. Marine proxy records (e.g., MARGO Project Members, 2009) have proven effective for LGM proxy-model comparisons (Otto-Bliesner et al., Reference Otto-Bliesner, Schneider, Brady, Kucera, Abe-Ouchi, Bard and Braconnot2009; Hargreaves et al., Reference Hargreaves, Paul, Ohgaito, Abe-Ouchi and Annan2011; Schmittner et al., Reference Schmittner, Urban, Shakun, Mahowald, Clark, Bartlein, Mix and Rosell-Melé2011; Annan and Hargreaves, Reference Annan and Hargreaves2013, Reference Annan and Hargreaves2015) due to their relative completeness and coherence. In comparison, LGM model benchmarking with terrestrial proxy records (e.g., Bartlein et al., Reference Bartlein, Harrison, Brewer, Connor, Davis, Gajewski and Guiot2011) is inherently more challenging due to enhanced climate sensitivity in terrestrial settings (i.e., land–sea contrast; Braconnot et al., Reference Braconnot, Harrison, Kageyama, Bartlein, Masson-Delmotte, Abe-Ouchi, Otto-Bliesner and Zhao2012; Annan and Hargreaves, Reference Annan and Hargreaves2013, Reference Annan and Hargreaves2015; Harrison et al., Reference Harrison, Bartlein, Izumi, Li, Annan, Hargreaves, Braconnot and Kageyama2015) and the relative incompleteness and lower preservation potential for terrestrial deposits. As a result, there is an ever-present need for new and robust quantitative records of terrestrial paleoclimate.
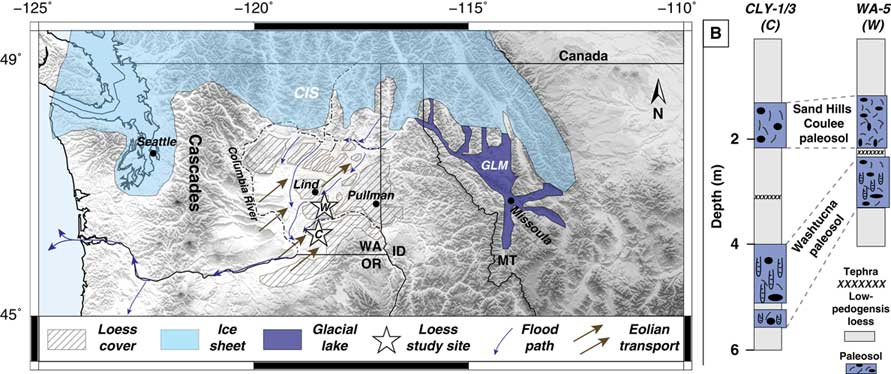
The Channeled Scabland–Palouse region of Washington State (USA) (Fig. 1A) preserves a rich geomorphic, sedimentological, and pedogenic record of late Pleistocene terrestrial paleoclimate and last glacial–interglacial climate change. Nearly a century of research has clarified links between late Pleistocene climate change and Cordilleran Ice Sheet growth/retreat cycles, glacial-outburst megafloods, and Palouse loess–paleosol development (Bretz, Reference Bretz1923, Reference Bretz1969; Baker and Bunker, Reference Baker and Bunker1985; Waitt, Reference Waitt1985; Busacca, Reference Busacca1989; Baker et al., Reference Baker, Bjornstad, Busacca, Fecht, Kiver, Moody, Rigby, Stradling and Tallman1991; McDonald and Busacca, Reference McDonald and Busacca1990, Reference McDonald and Busacca1992; O’Connor and Baker, Reference O’Connor and Baker1992; Busacca and McDonald, Reference Busacca and McDonald1994; Richardson et al., Reference Richardson, McDonald and Busacca1997; Clague et al., Reference Clague, Barendregt, Enkin and Foit2003; Gaylord et al., Reference Gaylord, Busacca and Sweeney2003; Sweeney et al., Reference Sweeney, Busacca, Richardson, Blinnikov and McDonald2004, Reference Sweeney, Busacca and Gaylord2005, Reference Sweeney, Gaylord and Busacca2007; Pluhar et al., Reference Pluhar, Bjornstad, Reidel, Coe and Nelson2006; Baker, Reference Baker2009; Hanson et al., Reference Hanson, Lian and Clague2012; McDonald et al., Reference McDonald, Sweeney and Busacca2012; Bader et al., Reference Bader, Spencer, Bailey, Gastineau, Tinkler, Pluhar and Bjornstad2016). Covering ~50,000 km2 of the Columbia Plateau (Fig. 1A) and being up to ~75 m thick in places (McDonald et al., Reference McDonald, Sweeney and Busacca2012), the Palouse loess, in particular, preserves a protracted history of Quaternary climate change in the Pacific Northwest (PNW).

Figure 1 (color online) Study area during the late glacial period. (A) Last glacial period map of the greater Palouse region imposed on modern shaded-relief digital elevation model. Cordilleran Ice Sheet (CIS) and Glacial Lake Missoula (GLM) extents shown are average positions throughout the late–last glacial period (~35–15 ka). Approximate megaflood paths from McDonald et al. (Reference McDonald, Sweeney and Busacca2012). Loess study sites marked by stars (C, CLY-1/3; W, WA-5). Lind, Soil Climate Analysis Network soil-monitoring site in Lind, WA. (B) Loess–paleosol study sections (see A for locations). CLY-1/3 refers to a combined CLY-1 and CLY-3 stratigraphic section (individual sections ~200 m apart) using the base of the Washtucna paleosol as a stratigraphic tie point. Sand Hills Coulee and Washtucna paleosol intervals preserved in each section.
As the ultimate product of late Pleistocene megafloods that sculpted the Channeled Scabland of the PNW (e.g., Baker, Reference Baker2009; Baker et al., Reference Baker, Bjornstad, Gaylord, Smith, Meyer, Alho, Breckenridge, Sweeney and Zreda2016), the Palouse loess was a sensitive recorder of regional late Pleistocene climate fluctuations. Periods of loess accumulation occurred during and immediately following times of increased megaflood frequency associated with ice sheet retreat; these megafloods delivered sediments to slackwater depocenters along the Columbia River in SE Washington and NE Oregon that were subsequently entrained by prevailing southwesterly winds and deposited across the Palouse (Busacca and McDonald, Reference Busacca and McDonald1994; Sweeney et al., Reference Sweeney, Gaylord and Busacca2007; McDonald et al., Reference McDonald, Sweeney and Busacca2012; Fig. 1A). Under peak glacial conditions, anticyclonic winds developed over the Laurentide Ice Sheet appear to have effectively shut down loess-transporting winds, leading to periods of reduced loess accumulation and more sustained pedogenic development across the Palouse (Sweeney et al., Reference Sweeney, Busacca, Richardson, Blinnikov and McDonald2004; Fig. 1A). The resulting Palouse loess–paleosol sequences (Fig. 1B) thus preserve a record of the alternating periods of ice sheet growth and retreat that characterized North America throughout the Late Quaternary.
Loess–paleosols developed throughout the late last glacial period (~35–15 ka; Sweeney et al., Reference Sweeney, Busacca, Richardson, Blinnikov and McDonald2004) and early Holocene are well preserved across the Palouse, making them valuable pedosedimentary archives of regional last glacial–Holocene terrestrial climate change. Here we present the first clumped isotope temperature records from Palouse loess–paleosol carbonates in combination with new carbonate stable-isotope analyses (δ18O, δ13C) and radiocarbon (14C) ages to provide insight into the magnitudes and character of late Pleistocene–Holocene climate change in a terrestrial region proximal to the Cordilleran Ice Sheet (Fig. 1A).
Background
Modern climate and soils of the Palouse
The modern Palouse is a winter precipitation–dominated, C3 grassland in the rain shadow of the Cascades Range. Mean annual temperature (MAT) and precipitation (MAP) vary with elevation across the region. MAT ranges from ~12°C at low-elevation (<500 m asl) sites in the westernmost Palouse to 6°C at elevations >1500 m asl in the Blue Mountains of southeast Washington. Modern soil types transition with climate across the Palouse with Aridisols in the west (MAP<230 mm), Mollisols in steppe/meadow steppe (MAP=230–600 mm) environments in the central Palouse, and Alfisols/Andisols in higher-elevation forest settings to the east (MAP>600 mm; Boling et al., Reference Boling, Frazier and Busacca1998).
Modern precipitation δ18O values in the Palouse vary seasonally, higher (−8‰ to −14‰ Vienna Standard Mean Ocean Water [VSMOW]) in the warm season (April–September) than during the winter (−11‰ to −17‰), with weighted mean annual δ18O values of −13‰ to −14‰ (Takeuchi et al., Reference Takeuchi, Goodwin, Moravec, Larson and Keller2009). Regional soil waters (δ18O~−12‰ to −16‰; Takeuchi et al., Reference Takeuchi, Goodwin, Moravec, Larson and Keller2009) generally reflect the dominance of cool-season precipitation in the region but can be impacted by significant evaporative 18O enrichment at shallow-soil depths (Stevenson et al., Reference Stevenson, Kelly, McDonald, Busacca and Welker2010).
Paleoclimate setting and records
There is abundant evidence for ice sheets extending into and covering parts of the PNW throughout the last glacial period (e.g., Booth et al., Reference Booth, Troost, Clague and Waitt2003; Clague, Reference Clague2009; Fig. 1A). Additional constraints on the last glacial climate history of the region come from lake and loess–paleosol records and general circulation model (GCM) simulations. Together, these studies suggest a measurably colder and more arid regional paleoclimate across the Palouse during the LGM.
LGM GCM simulations (Kutzbach and Wright, Reference Kutzbach and Wright1985; COHMAP Members, 1988; Bartlein et al., Reference Bartlein, Anderson, Anderson, Edwards, Mock, Thompson, Webb, Webb and Whitlock1998; Whitlock et al., Reference Whitlock, Bartlein, Markgraf and Ashworth2001; Bromwich et al., Reference Bromwich, Toracinta, Wei, Oglesby, Fastook and Hughes2004, Reference Bromwich, Toracinta, Oglesby, Fastook and Hughes2005) and ensemble studies (Braconnot et al., Reference Braconnot, Harrison, Kageyama, Bartlein, Masson-Delmotte, Abe-Ouchi, Otto-Bliesner and Zhao2012; Annan and Hargreaves Reference Annan and Hargreaves2013, Reference Annan and Hargreaves2015) show magnitudes of regional LGM cooling in excess of 15°C across the interior of the Laurentide–Cordilleran Ice Sheet, significantly greater than the average global LGM–Holocene temperature change of ~4°C (Annan and Hargreaves Reference Annan and Hargreaves2013, Reference Annan and Hargreaves2015). Such amplification appears to have led to pronounced meridional temperature gradients near the southern margin of the Cordilleran Ice Sheet (Schmittner et al., Reference Schmittner, Urban, Shakun, Mahowald, Clark, Bartlein, Mix and Rosell-Melé2011; Annan and Hargreaves, Reference Annan and Hargreaves2013, Reference Annan and Hargreaves2015), with simulations showing LGM cooling across the Palouse region of 5–15°C (Paleoclimate Modeling Intercomparison Project [PMIP3], https://pmip3.lsce.ipsl.fr [accessed October 15, 2017]).
Phytolith records preserved in Palouse loess (Blinnikov et al., Reference Blinnikov, Busacca and Whitlock2001, Reference Blinnikov, Busacca and Whitlock2002) and pollen records from Carp Lake in the western Columbia Plateau (Barnosky, Reference Barnosky1985; Thompson et al., Reference Thompson, Whitlock, Bartlein, Harrison and Spaulding1993; Whitlock and Bartlein, Reference Whitlock and Bartlein1997) provide additional information about late Pleistocene-to-Holocene climate and vegetation change and support interpretations of measurably colder and drier LGM climate across the region. Estimates of LGM MAT and MAP derived from these records (Whitlock and Bartlein, Reference Whitlock and Bartlein1997; Blinnikov et al., Reference Blinnikov, Busacca and Whitlock2002) generally agree with magnitudes of GCM-simulated MAT cooling (4–8°C) and MAP decrease (on the order of 500–1000 mm/yr) for the greater Palouse region during the LGM (Bartlein et al., Reference Bartlein, Harrison, Brewer, Connor, Davis, Gajewski and Guiot2011). However, quantifying LGM MAT/MAP using such paleovegetation proxy records is limited by uncertainties inherent to the modern analog approaches used to derive paleo-MAT and paleo-MAP values (Bartlein et al., Reference Bartlein, Harrison, Brewer, Connor, Davis, Gajewski and Guiot2011, and references therein) and by the fact that reduced pCO2 during the LGM (~190 ppm; Monnin et al., Reference Monnin, Indermühle, Daellenbach, Flueckiger, Stauffer, Stocker, Raynaud and Barnola2001) likely impacted regional paleovegetation independent from and/or in addition to MAT/MAP-induced changes (Braconnot et al., Reference Braconnot, Harrison, Kageyama, Bartlein, Masson-Delmotte, Abe-Ouchi, Otto-Bliesner and Zhao2012).
Palouse loess–paleosol sequences have also been subject to prior carbonate stable isotopic study (Takeuchi et al., Reference Takeuchi, Goodwin, Moravec, Larson and Keller2009; Stevenson et al., Reference Stevenson, Kelly, McDonald and Busacca2005, Reference Stevenson, Kelly, McDonald, Busacca and Welker2010). On the basis of higher δ18O and δ13C values for presumed last glacial period carbonates in comparison to those from Holocene intervals, Takeuchi et al. (Reference Takeuchi, Goodwin, Moravec, Larson and Keller2009) presented an interpretation of a colder, drier, and seasonally distinct (drier winters) LGM paleoclimate across the Palouse. However, the authors noted the difficulty in quantifying paleotemperature and paleoprecipitation values on the basis of pedogenic carbonate (PC) δ18O alone, because unconstrained values for paleosoil temperature and water δ18O both impact carbonate δ18O.
Carbonate clumped isotope thermometry
Independent temperature constraints from carbonate clumped isotope thermometry can further clarify paleoenvironmental reconstruction from Palouse proxy records. Clumped isotope thermometry (Schauble et al., Reference Schauble, Ghosh and Eiler2006; Ghosh et al., Reference Ghosh, Adkins, Affek, Balta, Guo, Schauble, Schrag and Eiler2006; Eiler, Reference Eiler2011) has been applied across a spectrum of earth science subdisciplines, from tectonics and structural diagenesis applications (for review, see Huntington and Lechler, Reference Huntington and Lechler2015) to paleoclimate studies in both terrestrial and marine realms (for reviews, see Eiler, Reference Eiler2007, Reference Eiler2011; Affek, Reference Affek2012; Passey, Reference Passey2012). The method uses the thermodynamically driven increase in the abundance of 13C-18O bonds in the carbonate crystal lattice with decreasing mineral formation temperatures (Schauble et al., Reference Schauble, Ghosh and Eiler2006; Ghosh et al., Reference Ghosh, Adkins, Affek, Balta, Guo, Schauble, Schrag and Eiler2006; Eiler, Reference Eiler2011). The abundance of “clumped” 13C-18O bonds in a carbonate sample relative to the abundance that would be expected for the random distribution of isotopes is measured with high-precision mass spectrometry and quantified as the Δ47 parameter, where “47” refers to measurements of mass-47 CO2 (mostly clumped 13C18O16O) gas produced from phosphoric acid digestion of the carbonate sample.
As a direct and quantitative measure of carbonate formation temperature, T(Δ47) offers valuable (paleo)climate information on its own. When combined with carbonate δ18O and δ13C measurements, T(Δ47) also allows for direct calculation of water δ18O and CO2 δ13C for the aqueous solution from which carbonates precipitated. Accordingly, application of carbonate clumped isotope thermometry extends the potential for loess–paleosol proxy records to contribute to mechanistic understandings of Late Quaternary climate variability (e.g., Eagle et al., Reference Eagle, Risi, Mitchell, Eiler, Seibt, Neelin, Gaojun and Tripati2013).
SAMPLING AND ANALYTICAL METHODS
Loess–paleosol study sections and sampling strategy
The most recent phase of late Pleistocene megafloods occurred as climate transitioned from the LGM into the present interglacial (~15.3–12.7 14C cal ka BP; Waitt, Reference Waitt1985). Mount St. Helens (MSH) set S tephras commonly preserved at the base of the associated loess sequence (L1 loess of McDonald and Busacca, Reference McDonald and Busacca1992) indicate a maximum depositional age of ~16 ka for the interval (Clynne et al., Reference Clynne, Calvert, Wolfe, Evarts, Fleck and Lanphere2008). Also contained within L1 loess is the Sand Hills Coulee (SHC) paleosol, a weakly developed paleosol characterized by filamentous soil carbonate and sparse cylindrical burrows (McDonald and Busacca, Reference McDonald and Busacca1992). Age of SHC soil development is uncertain, but its stratigraphic position within L1 loess suggests formation during the latest Pleistocene–early Holocene (McDonald and Busacca, Reference McDonald and Busacca1992; Sweeney et al., Reference Sweeney, Busacca and Gaylord2005). Marking the boundary between L1 and underlying L2 loess across much of the Palouse is the prominent Washtucna paleosol, an identifiable interval highly indurated with calcium carbonate and characterized by cylindrical soil fabric interpreted as a product of cicada burrows (O’Geen and Busacca, Reference O’Geen and Busacca2001; Fig. 2B). Early thermoluminescence (TL) studies of loess and MSH tephras contained within the L2 sequence suggest L2 loess was deposited between latest Marine Isotope Stage (MIS) 4 and latest MIS 2 (~70 and 15 ka, respectively; Berger and Busacca, Reference Berger and Busacca1995; Richardson et al., Reference Richardson, McDonald and Busacca1997); within this interval; TL ages of 40 and 20 ka bracket the Washtucna paleosol (Richardson et al., Reference Richardson, McDonald and Busacca1997).

Figure 2 (color online) High-CaCO3-density macroscopic PC targets for clumped and isotopic analysis. (A) CLY-1 roadcut. Student researchers (~1.7 m tall) measuring thickness of carbonate-rich, bifurcated Washtucna paleosol interval. (B) Carbonate burrow fills within Washtucna paleosol at CLY-1. (C) Rhizolith complex in Washtucna paleosol (outlined with dashed line; sample CLY1_-15). (D) A 1-cm-diameter rhizolith (sample WA5_290295). Carbonate root-pore cements (sample WA5_122130p) shown picked (E) and in situ (F).
For this study, we present conventional (δ18O, δ13C) and clumped (Δ47) isotopic analyses and new radiocarbon data for loess–paleosol carbonates from two Palouse sections, CLY-1/3 (46.31348°N, 118.48927°W) and WA-5 (46.77343°N, 118.35604°W; Fig. 1), that have been subject to prior stratigraphic and isotopic study (McDonald and Busacca, Reference McDonald and Busacca1990, Reference McDonald and Busacca1992; Sweeney et al., Reference Sweeney, Busacca, Richardson, Blinnikov and McDonald2004; Takeuchi et al., Reference Takeuchi, Goodwin, Moravec, Larson and Keller2009; McDonald et al., Reference McDonald, Sweeney and Busacca2012). Both CLY-1/3 and WA-5 study sections are characterized by loess with intervals of weak pedogenesis alternating with CaCO3-cemented paleosols. SW-to-NE eolian transport of Palouse loess from megaflood depocenters along the Washington–Oregon border (Fig. 1A) resulted in downwind fining and thinning of Palouse loess sequences (Sweeney et al., Reference Sweeney, Busacca and Gaylord2005; McDonald et al., Reference McDonald, Sweeney and Busacca2012). As a result, the more proximal (<20 km from loess source) CLY-1/3 section is significantly thicker than the downwind WA-5 site (~60 km from source). L1 and L2 loess at CLY-1/3 are ~4.5 and 9 m thick, respectively, in comparison to 2 m (L1) and 2.5 m (L2) at WA-5 (McDonald et al., Reference McDonald, Sweeney and Busacca2012). The SHC and Washtucna paleosols are preserved in each study section, with the Washtucna soil being thicker and bifurcated at the CLY site (Figs. 1B and 2A).
Carbonate content varies with the degree of pedogenic development in Palouse loess–paleosol sequences, increasing from ~2 wt% CaCO3 in loess intervals that have experienced minimal pedogenesis to ≥10 wt% CaCO3 in well-developed paleosols like the Washtucna paleosol (McDonald and Busacca, Reference McDonald and Busacca1992). Locally, and particularly widespread throughout the Washtucna paleosol, carbonate burrow fills and rhizoliths with >25 wt% CaCO3 (hereafter referred to as “macroscopic PCs”; Fig. 2) are present. Given the potential for detrital carbonate in the loess matrix (measured at 2–8 wt% in Palouse loess sequences lacking identifiable pedogenesis; Baker et al., Reference Baker, Bjornstad, Busacca, Fecht, Kiver, Moody, Rigby, Stradling and Tallman1991), macroscopic PCs that are demonstrably pedogenic in origin were targeted for sampling where present.
Loess matrix samples were collected from study sections in ~5-cm-thick intervals at ~10-cm-depth spacing from the top of the shallowest (youngest) carbonate-bearing horizon down through the Washtucna paleosol, which corresponds to modern depths of 1.3–6.3 m and 0.8–4 m at CLY-1/3 and WA-5, respectively. At CLY-1/3, the shallowest sampled interval is a Bk horizon with incipient carbonate formation presumed to be Holocene in age. At WA-5, the shallowest sampled interval has been identified as a Bk horizon with uncertain age (McDonald and Busacca, Reference McDonald and Busacca1990).
Carbonate Δ47, δ18O, δ13C, and 14C analysis
For sampled intervals at CLY-1/3 and WA-5, we measured carbonate δ18O and δ13C values for 83 aliquots of loess soil carbonate (Fig. 3); sample subsets (Table 1) were chosen for clumped (n=32) and radiocarbon (n=25) analysis to target carbonate-rich paleosol intervals (e.g., Washtucna paleosol) as well as samples characterized by endmember (i.e., maximum and minimum) carbonate δ18O-δ13C values. Carbonate in the loess matrix is widely disseminated (3–12 wt%; Table 1) in the form of submillimeter aggregrates and loess grain coatings. As a result, loess matrix carbonate was analyzed unmodified (i.e., without physical or chemical separation from noncarbonate loess) with no cleaning or pretreatment. Macroscopic PCs were isolated from matrix loess via hand picking (root-pore cements; Fig. 2E and F) and light brushing and cleaning of carbonate burrow fills and rhizoliths (Fig. 2B, C, and D).

Figure 3 Carbonate δ18O and δ13C records for CLY-1/3 and WA-5 study sections. WA-5 isotopic data of Takeuchi et al. (Reference Takeuchi, Goodwin, Moravec, Larson and Keller2009) shown for reference. Macroscopic PCs (rhizoliths, burrow fills, root-pore cements; see Fig. 2) denoted by different symbols. SHC, Sand Hills Coulee paleosol; W, Washtucna paleosol.
Table 1 Clumped and Isotopic Data for Palouse study sections.

Italicized samples denote macroscopic PCs (rhizoliths, root pore cements, burrow fills).
* Reported 14C age uncertainties are 95% confidence intervals calculated using raw 14C analytical errors (1σ) as input to OxCal 4.2 online calibration calculator (https://c14.arch.ox.ac.uk/oxcal/OxCal.html)
** ∆47 values reported in absolute reference frame (ARF) of Dennis et al. (Reference Dennis, Affek, Passey, Schrag and Eiler2011). ∆47 standard error calculated as (sample ∆47 standard deviation)/√n . Minimum ∆47 st. dev. used=0.19‰ (value for UW IsoLab carbonate standard C64).
§ T(∆47) calculated from sample average ∆ 47 values using T-∆47 empirical calibration of Kelson et al. (Reference Kelson, Huntington, Schauer, Saenger and Lechler2017).
+ Soil CO2 δ13C value calculated using measured carbonate δ13CVPDB, T(∆47), and calcite-CO2 13C fractionation equation of Romanek et al. (Reference Romanek, Grossman and Morse1992).
‡ Water δ18O value calculated using measured carbonate δ18OVPDB, T(∆47), and calcite-water 18O fractionation equation of Coplen (Reference Coplen2007). Uncertainties calculated using corresponding T(∆47) S.E. values.
Carbonate Δ47, δ18O, and δ13C values were measured at the University of Washington IsoLab. Carbonate δ18O and δ13C values were measured using a Kiel III carbonate device coupled to a dual-inlet Finnigan Delta Plus mass spectrometer using the methods of Tobin et al. (Reference Tobin, Schauer and Lewarch2011). Measured isotope ratios were converted to the Vienna Pee Dee Belemnite (VPDB) and VSMOW reference scales using internal laboratory standards calibrated against NBS-18 and NBS-19 (International Atomic Energy Agency, Vienna, Austria) and LSVEC (National Institute of Standards and Technology, Gaithersburg, MD, USA) international standards, which were analyzed along with the samples.
Sample preparation for clumped isotope analysis followed the methods of Burgener et al. (Reference Burgener, Huntington, Hoke, Schauer, Ringham, Latorre and Díaz2016). In brief, for each sample, an appropriate mass containing ~8 mg of CaCO3 was reacted for 10 minutes in a common phosphoric acid bath held at 90°C. To separate out water, the liberated CO2 gas was cryogenically purified through a sequence of ethanol–dry ice (~ −80°C) and liquid nitrogen traps. The CO2 was subsequently entrained in helium and passed through a Porapaq Q column (50/80 mesh, 15 cm long, 4.5 mm ID, 0.635 mm OD) held between −10°C and −20°C. Purified CO2 was then analyzed on a dual-inlet Thermo MAT 253 configured to measure m/Z 44-49.
Carbonate Δ47 values were calculated from mass spectrometer data based on Huntington et al. (Reference Huntington, Eiler, Affek, Guo, Bonifacie, Yeung and Thiagarajan2009), but using the pressure baseline (He et al., Reference He, Olack and Colman2012) measurement, data reduction, and 17O correction methods and scripts of Schauer et al. (Reference Schauer, Kelson, Saenger and Huntington2016). The Δ47 values (Table 1) were placed in the absolute reference frame (Dennis et al., Reference Dennis, Affek, Passey, Schrag and Eiler2011) using CO2 gases heated (1000°C) or equilibrated to 4°C and 60°C.
All samples analyzed for Δ47 were subject to triplicate analysis at minimum (175 total Δ47 analyses; Table 1), with the exception of one small rhizolith sample (CLY1_-80), which provided enough carbonate for only two replicates. Pierce outlier tests (Ross, Reference Ross2003) were applied to identify replicate outliers (14 of 175 Δ47 analyses [8%] identified as outliers), following which mean Δ47 and standard error (SE) of the mean values were calculated. Reported clumped isotope temperature (T(Δ47)) values (Table 1) were calculated from mean Δ47 values using the empirical calibration of Kelson et al. (Reference Kelson, Huntington, Schauer, Saenger and Lechler2017), which is based on data produced in the same laboratory and using the same 17O correction as our samples.
Palouse carbonate T(Δ47) values reported in Table 1 are interpreted as measures of the equilibrium temperature of carbonate formation in Palouse (paleo)soils. δ18O values of soil water in equilibrium with carbonate during the time of formation were calculated using measured T(Δ47) and carbonate δ18O values and temperature-sensitive, calcite-water oxygen isotope fractionation factors (Coplen, Reference Coplen2007). Soil CO2 δ13C values were determined from T(Δ47) and measured carbonate δ13C values using the expression for Σcalcite-CO2 from Romanek et al. (Reference Romanek, Grossman and Morse1992) (Table 1).
We constrain loess–paleosol chronology using carbonate radiocarbon (14C) dating. Radiocarbon activities of select carbonate samples were measured by DirectAMS (www.directams.net). Carbonate samples were digested under vacuum in phosphoric acid, and the liberated CO2 was converted to graphite for analysis by accelerator mass spectrometry. Radiocarbon ages were calibrated using OxCal 4.2 (https://c14.arch.ox.ac.uk/oxcal/OxCal.html). All radiocarbon ages listed in Table 1 are reported in calibrated years before present (i.e., before 1950; abbreviated as cal ka BP). Given the potential for reservoir effects to bias soil carbonate 14C ages older than they actually are (Yang et al., Reference Yang, Amundson and Trumbore1994) and the possibility that some component of analyzed loess matrix carbonate could be detrital and not formed in situ, reported radiocarbon ages should be interpreted as maximum values.
RESULTS
Carbonate 14C
Radiocarbon ages for carbonate samples from CLY-1/3 and WA-5 vary systematically with depth (Fig. 4, Table 1). The 14C analysis confirms that the shallowest, carbonate-bearing depths in each section contain Holocene-aged carbonate. Radiocarbon ages for carbonate sampled from the SHC paleosol at each section are consistent with a pre-Holocene, deglacial age of ~15–11 ka BP for the paleosol, as suggested by Sweeney et al. (Reference Sweeney, Busacca and Gaylord2005). At CLY-1/3, an ~2.5-m-thick interval (modern depth 2.5–5 m) encompassing the Washtucna paleosol is characterized by uniform matrix carbonate 14C ages of ~24 cal ka BP. Dated macroscopic PCs from throughout the Washtucna paleosol at CLY-1/3 range in 14C age from ~30 to 21 cal ka BP. A similar age range (~31–20 cal ka BP) is observed across the Washtucna paleosol at WA-5. In both sections, loess matrix carbonates collected at depths below the Washtucna paleosol yield 14C ages of ~31–28 cal ka BP. Carbonate 14C ages thus confirm >10 ka pedogenic development (~31–20 cal ka BP) of the Washtucna paleosol leading up to and during the LGM (McDonald et al., Reference McDonald, Sweeney and Busacca2012).

Figure 4 Carbonate 14C records. Carbonate 14C ages (this study) as a function of loess–paleosol column depth. Dashed boxes denote Sand Hills Coulee (SHC) paleosol at CLY-1/3 (blue) and WA-5 (green) study sections. Washtucna paleosol marked with solid boxes. Calibrated 14C age uncertainties (95%) are smaller than symbol sizes (< ±1 ka). Published loess thermoluminescence (TL) ages from Berger and Busacca (Reference Berger and Busacca1995) and Richardson et al. (Reference Richardson, McDonald and Busacca1997) shown for reference. Published depths of loess TL samples reported for CLY-1/2 section in Richardson et al. (Reference Richardson, McDonald and Busacca1997) have been converted to equivalent stratigraphic depths in CLY-1/3 section of this study. (For interpretation of the references to color in this figure legend, the reader is referred to the web version of this article.)
Carbonate δ18O and δ13C
Measured loess matrix carbonate δ18O and δ13C values agree with published records at WA-5 (Takeuchi et al., Reference Takeuchi, Goodwin, Moravec, Larson and Keller2009; Fig. 3). The δ13C values generally increase with depth at both CLY-1/3 and WA-5, ranging from~−7‰ to −7.5‰ at shallow depths (<2 m) to~−4‰ within and near the last glacial–aged Washtucna paleosol. Carbonate δ18O values also vary with depth. Maximum δ18O values of~−10‰ to −12‰ are observed at the shallowest carbonate-bearing depths (0.8–1.5 m). Minimum δ18O values (~ −13‰ to −15‰) characterize macroscopic PCs collected from within the Washtucna paleosol in both sections. At WA-5, similar minimum δ18O values also characterize SHC interval carbonates, as observed in published loess matrix records (Takeuchi et al., Reference Takeuchi, Goodwin, Moravec, Larson and Keller2009). In each section, δ18O values of loess matrix carbonates are consistently 1–2‰ higher than those of macroscopic PCs at similar depths.
Carbonate T(Δ47)
Similar to carbonate δ18O and δ13C trends, measured carbonate Δ47 and calculated T(Δ47) values (Fig. 5, Table 1) vary with depth, carbonate type (loess matrix carbonate vs. macroscopic PC), and degree of pedogenesis (i.e., paleosol vs. poorly indurated loess). The total range of calculated T(Δ47) values for samples from CLY-1/3 (1±2°C to 42±7°C [1 SE]) is similar to that of WA-5 (5±2 to 40±6°C) (Fig. 5, Table 1). In each section, macroscopic PCs collected from the Washtucna paleosol have the lowest T(Δ47) values (1±2°C to 10±5°C). T(Δ47) for Washtucna-paleosol loess matrix carbonates analyzed from each section overlap the warmer end of the T(Δ47) range for macroscopic PCs but extend to warmer temperatures (10±4°C to 25±4°C). Although T(Δ47) grossly varies with CaCO3 wt% as a function of carbonate type (i.e., lower average T(Δ47) for macroscopic PCs relative to loess matrix carbonates), among each carbonate type, T(Δ47) values are not correlated with CaCO3 wt% (Table 1; Online Supplementary Material, Fig. DR1).

Figure 5 Carbonate T(Δ47) records. Carbonate T(Δ47) stratigraphic records for CLY-1/3 and WA-5 study sections. T(Δ47) error bars show 1 standard error (Table 1). Carbonate 14C ages for analyzed samples (Fig. 4) listed at depth of sampling (italics denotes macroscopic PC sample; see Table 1). Stratigraphic columns (Fig. 1B) shown for reference. SHC, Sand Hills Coulee paleosol; W, Washtucna paleosol.
The highest T(Δ47) values (>30°C) observed in the CLY-1/3 and WA-5 study sections are associated with loess matrix samples from intervals exhibiting weak pedogenesis. At CLY-1/3, samples with T(Δ47)>30°C characterize intervals both above and below the defined Washtucna paleosol (modern depths 2.3–3.5 m and >6 m). At the more distal WA-5 site, where the SHC and Washtucna paleosols are separated by only a thin tephra layer (Fig. 1B), T(Δ47) values >30°C are only observed for samples collected from depths below the Washtucna paleosol (>3.4 m depth). Samples with T(Δ47)>30°C are consistently characterized by the highest measured carbonate δ13C and calculated T(Δ47) standard error values (≥ ±4°C) in this sample data set (Fig. 5, Table 1). Conversely, carbonate δ18O values do not covary with T(Δ47) and instead are consistently low (< −11‰) for high-T(Δ47) samples (Fig. 3, Table 1).
T(Δ47) values are similar for Holocene-aged loess matrix carbonate from the shallowest Bk horizons in each section (18±3°C to 19±3°C at CLY-1/3, 15±3°C to 25±3°C at WA-5) and are within uncertainty (1 SE) of T(Δ47) for samples from the SHC paleosol at CLY-1/3 (16±3°C to 19±3°C) and WA-5 (14±4°C to 23±4°C). However, root pore cements picked from the SHC paleosol at WA-5 (sample WA5_122136p; Fig. 2E and F) are offset to colder T(Δ47) of 10±3°C compared with loess matrix carbonate at the same depth (23±4°C).
Water δ18OVSMOW values calculated using the equilibrium fractionation equation of Coplen (Reference Coplen2007) (Fig. 6, Table 1) exhibit greater variability than corresponding carbonate δ18O values (Fig. 3) and, in general, covary with carbonate T(Δ47) (Fig. 7). Samples with T(Δ47)>30°C are characterized by the highest calculated water δ18OVSMOW values (−8‰ to −10‰). Washtucna paleosol macroscopic PCs with the lowest T(Δ47) yield the lowest water δ18O values, as low as −18.5‰ and −18.9‰ at CLY-1/3 and WA-5, respectively. Water δ18O values calculated with the synthetic calcite–derived fractionation equation of Kim and O’Neil (Reference Kim and O’Neil1997) are ~1.7‰ higher than those calculated with the Coplen (Reference Coplen2007) equation, but differences are near-uniformly shifted, such that water δ18O variance, T(Δ47)-water δ18O covariance, and time/depth trends do not change significantly (Online Supplementary Material, Table DR1).

Figure 6 Water δ18O and soil CO2 δ13C records. Calculated water δ18O and soil CO2 δ13C for sample subsets analyzed for Δ47 (Fig. 5, Table 1). Error bars show 1 standard error propagated from T(Δ47) standard error (Table 1). Note some samples have standard errors less than those of marker symbol sizes. Published modern soil water and summer precipitation δ18O shown for reference: Stevenson et al. (Reference Stevenson, Kelly, McDonald, Busacca and Welker2010) modern soil water δ18O at Palouse sites with <400 mm MAP (sampled in June at 70 cm depth); Takeuchi et al. (Reference Takeuchi, Goodwin, Moravec, Larson and Keller2009) soil water and summer precipitation δ18O at Pullman, WA (Fig. 1A) (soil water sampled December–June at depths of 25–90 cm; summer precipitation sampled April–September). SHC, Sand Hills Coulee paleosol; W, Washtucna paleosol.

Figure 7 Summary of isotopic data. Note covariance of carbonate T(Δ47) with calculated water δ18O (A) and soil CO2 δ13C (B). Gray swaths in A and B show T(Δ47) range (>30°C) and corresponding isotopic values interpreted to reflect conditions of shallow-soil formation (see text for discussion). (C) Calculated water δ18O vs. soil CO2 δ13C with isotopic windows defined on basis of measured carbonate radiocarbon ages (Table 1) and interpretations from A and B. Modern soil water (December–June) and summer (April–September) precipitation δ18O reported in Takeuchi et al. (Reference Takeuchi, Goodwin, Moravec, Larson and Keller2009) shown for reference (see Fig. 6). Note agreement of Marine Isotope Stage (MIS) 1 carbonate-derived and modern water δ18O values.
Depth profiles of calculated soil CO2 δ13C (Fig. 6, Table 1) also track those of carbonate T(Δ47) in study sections. Loess matrix samples with T(Δ47)>30°C have maximum soil CO2 δ13CVPDB of −10.7‰ to −13.1‰ (Fig. 7). Minimum calculated soil CO2 δ13C values of −16.1‰ to −17.4‰ characterize the shallowest sampled intervals in each study section (Fig. 6). Similarly low soil CO2 δ13C values characterize macroscopic PCs with T(Δ47) ≤ 10°C sampled within the Washtucna and SHC paleosols (Figs. 6 and 7). Washtucna paleosol loess matrix carbonates in each section yield intermediate soil CO2 δ13C estimates of −14‰ to −16.7‰.
DISCUSSION
Radiocarbon and isotopic results support the interpretation that the Palouse loess–paleosol carbonates examined here are pedogenic in origin and record meaningful paleoclimate information. That said, the variability in δ13C, δ18O, and T(Δ47) values observed for penecontemporaneous Palouse carbonates suggests the need to consider potential impacts from PC type as well as variable depths and/or seasonal timings of PC formation. In the following subsections, we discuss how integration of radiocarbon geochronology and clumped isotope thermometry with conventional stable isotope study (δ13C, δ18O) of Palouse loess–paleosol carbonates aids paleoclimate reconstruction from these records.
Identifying a pedogenic origin for Palouse loess–paleosol carbonates
Paleoclimate interpretation of loess–paleosol proxy records requires that the studied carbonate is demonstrably pedogenic in origin or that pedogenic (secondary) components can be distinguished from any detrital (primary) carbonate present (e.g., Kemp, Reference Kemp2001; Zamanian et al., Reference Zamanian, Pustovoytov and Kuzyakov2016). Carbonates preserved in CaCO3-cemented paleosol intervals, including the macroscopic PCs (burrow fills, rhizoliths, and root-pore cements) analyzed for this study (Fig. 2), are demonstrably pedogenic (formed in situ) and thus suitable for paleoclimate interpretation. In contrast, submillimeter grain size prevents morphological identification of loess matrix carbonate origin, which can complicate paleoclimate reconstruction, given the potential for detrital carbonate components to remain unmodified in the loess matrix. Here, radiocarbon study of Palouse loess–paleosol carbonates provides needed insights.
Radiocarbon ages indicate a pedogenic origin for carbonates analyzed in this study, including loess matrix samples. If detrital carbonate was a significant component in studied intervals, carbonate radiocarbon ages would likely predate the age of loess deposition (“limestone dilution effect”; Williams and Polach, Reference Williams and Polach1971; Chen and Polach, Reference Chen and Polach1986). Conversely, PCs formed in situ should yield radiocarbon ages equal to or younger than the depositional ages of the loess that hosts them. Throughout the loess–paleosol sections studied here, carbonate radiocarbon ages are younger than or equal to published TL measures of depositional ages for the encompassing loess (Berger and Busacca, Reference Berger and Busacca1995; Richardson et al., Reference Richardson, McDonald and Busacca1997; Fig. 4), as expected for PCs. This suggests any detrital carbonate components incorporated into the loess when it was deposited were effectively overprinted by pedogenic processes during and/or following loess aggradation.
Additionally, minimum carbonate 14C ages of ~8 cal ka BP at both CLY-1/3 and WA-5 suggest there has been minor (if any) incorporation of modern carbon into older PC via recrystallization and/or isotopic exchange after initial formation. Even where modern soil development occurs in close depth proximity to the SHC paleosol at WA-5 (Fig. 1B), 14C ages for WA-5 SHC carbonates (20–13 cal ka BP) do not exhibit a bias toward younger ages that would reflect recrystallization or later-stage isotopic exchange. Palouse carbonate radiocarbon ages thus support interpretation of the loess soil carbonates analyzed for this study as pedogenic in origin and suitable for interpretation of last glacial period and Holocene soil conditions in the Palouse.
Impact of carbonate type and shallow-soil effects on Palouse loess–paleosol proxy records
We integrate carbonate geochronology, δ13C, δ18O, and T(Δ47) data to evaluate the impacts of PC type and shallow-soil processes on our loess–paleosol proxy records. Stable and clumped isotope values vary by carbonate type, with macroscopic PCs characterized by δ13C, δ18O, and T(Δ47) values equal to or lower than those of loess matrix carbonates of similar age and/or stratigraphic position (Figs. 3 and 5, Table 1). Macroscopic PCs analyzed here come from well-developed paleosols characterized by stage III–IV carbonate morphologies (McDonald and Busacca, Reference McDonald and Busacca1990), whereas loess matrix samples were collected from both paleosols and intervals of poorly indurated loess. Systematic variability in δ13C and 14C between macroscopic PCs and loess matrix carbonates was observed for loess–paleosol carbonates from the Nussloch sequence of SW Germany (Gocke et al., Reference Gocke, Pustovoytov, Kühn, Wiesenberg, Löscher and Kuzyakov2011). There, loess matrix carbonates with δ13C values ~10‰ higher and 14C ages >10 ka older than rhizolith carbonates at the same depth were identified to be detrital in origin (Gocke et al., Reference Gocke, Pustovoytov, Kühn, Wiesenberg, Löscher and Kuzyakov2011). However, carbonate radiocarbon ages obtained here rule out detrital effects to explain isotopic variability between macroscopic PCs and loess matrix carbonates at Palouse study sites. Instead, lower δ13C, δ18O, and T(Δ47) values for macroscopic PCs relative to penecontemporaneous in situ loess matrix carbonates suggest macroscopic PCs record more protracted (during the year) and sustained (occurring over multiple years/decades) periods of carbonate formation and more commonly formed at greater depth within the same (paleo)soil.
Carbonate encrustations of plant roots (rhizoliths) may form in direct association with active plant growth and respiration (e.g., Becze-Deák et al., Reference Becze-Deák, Langohr and Verrecchia1997; Gocke et al., Reference Gocke, Pustovoytov, Kühn, Wiesenberg, Löscher and Kuzyakov2011). In the winter precipitation–dominated Palouse, peak growing season occurs as soils warm and dry out during the late spring to summer (Fig. 8), presumably making this the time of Palouse rhizolith formation. Association with root systems also promotes rhizolith development at depths of >0.5 m and in some cases >1 m below the (paleo)surface (e.g., Gocke et al., Reference Gocke, Pustovoytov, Kühn, Wiesenberg, Löscher and Kuzyakov2011). Accordingly, we interpret Palouse rhizoliths and other macroscopic PCs as proxies for warm-season, deeper (>0.5 m) soil conditions during the time of their formation.

Figure 8 (color online) Modern soil-monitoring data for Lind, WA (see Fig. 1A for location). Note conditions that promote pedogenic carbonate formation (soil drying and warming) generally occur during the warm season (April–September). Data from http://www.wcc.nrcs.usda.gov (accessed July 28, 2015).
In contrast, disseminated carbonate in the loess matrix can form via varied and potentially abiogenic mechanisms (Zamanian et al., Reference Zamanian, Pustovoytov and Kuzyakov2016) making the seasonal timing/duration and depth of formation more difficult to ascertain. Further complicating interpretation of loess matrix proxies is the isotopic variability exhibited by Palouse loess matrix carbonates of similar 14C age and/or stratigraphic position. Particularly notable are last glacial–aged (~31–24 cal ka BP) loess matrix samples from within and near the Washtucna paleosol that exhibit wide-ranging values of carbonate T(Δ47) (10–42°C), δ13CVPDB (−3.8‰ to −6‰), and calculated soil CO2 δ13C (−11.1‰ to −16.2‰) and water δ18O (−8.6‰ to −14.3‰) (Figs. 3, 5, and 6, Table 1). We interpret this isotopic variability to reflect variable depths and seasonal timings of loess matrix carbonate formation during the >10 ka development of the Washtucna paleosol.
Covariance of Palouse carbonate T(Δ47) with calculated soil CO2 δ13C and water δ18O values (Fig. 7) can be used to constrain paleo-depths of formation in last glacial period soils of the Palouse. In modern soils, soil CO2 δ13C, water δ18O, and temperature all exhibit a systematic decrease with depth during the warm season (e.g., Breecker et al., Reference Breecker, Sharp and McFadden2009; Quade et al., Reference Quade, Eiler, Daëron and Achyuthan2013), which we presume is the dominant season of PC formation for both the modern and last glacial period Palouse. Decreasing δ13C (both carbonate and soil CO2) with depth results from the increased component of low-δ13C, biologically respired CO2 at greater depth in the soil. In arid to semiarid environments like the Palouse, this effect, along with probable kinetic isotope effects during calcite precipitation in the top several centimeters of soils, results in shallow-soil carbonate and CO2 δ13C values that are on the order of 5–10‰ higher than those at depth (>0.5 m) (Quade et al., Reference Quade, Cerling and Bowman1989; Breecker et al., Reference Breecker, Sharp and McFadden2009). Similarly, as documented in the modern Palouse (Stevenson et al., Reference Stevenson, Kelly, McDonald, Busacca and Welker2010), soil water evaporation commonly results in shallow-soil waters having maximum δ18O values. Soil temperature also decreases with depth during the summer, with shallow-soil (<0.25 m) temperatures up to 10–15°C higher than maximum daily air temperatures (Passey et al., Reference Passey, Levin, Cerling, Brown and Eiler2010; Quade et al., Reference Quade, Eiler, Daëron and Achyuthan2013), which in the modern Palouse can reach ~40°C during the summer. In light of these trends, we interpret the association of maximum values of carbonate T(Δ47) (>30°C), δ13C (> −5‰), and calculated soil CO2 δ13C (> −14‰) and water δ18O (> −10‰) values observed for some glacial-aged loess matrix samples to reflect formation at shallow (<0.5 m) depths in the paleo-soil (Fig. 7).
Shallow-soil formation helps explain the distribution of loess matrix carbonates with uniform radiocarbon ages ~24 cal ka BP and high T(Δ47), δ13C, and water δ18O values throughout the depth interval of ~2.5–4 m at CLY-1/3 (Figs. 4–6, Table 1). Immediately below, at ~4–5 m depth, loess matrix carbonates within the indurated Washtucna paleosol have equivalent radiocarbon ages but significantly lower T(Δ47) (10–25°C), δ13C (< −5‰), and water δ18O (< −11‰) values that are consistent with formation at depth (>0.5 m) in the paleosoil. We interpret the uniformity of radiocarbon ages across the 2.5–5 m interval to reflect a period of rapid loess accumulation at the CLY study site, dated here to ~24 cal ka BP, during which the active Bk horizon migrated upward and out of the indurated Washtucna interval, with only deep-penetrating roots continuing to reach the progressively buried paleosol (e.g., 21 cal ka BP rhizolith sample CLY1_-160; Table 1). Loess matrix carbonates with high T(Δ47), δ13C, and water δ18O values at the 2.5–4 m depth are thus interpreted to reflect incipient PC formation that occurred within the uppermost portion of the aggrading loess soil column. Refined luminescence ages of loess deposition for the interval of 2.5–5 m depth are needed to fully evaluate this mechanism, but this plausibly explains why such a thick interval of uniform carbonate age is observed in the loess source proximal location of CLY-1/3, but not at the more distal WA-5 site, where loess accumulation rates were lower.
Potential influences from kinetic isotope effects and summer storm events on carbonate T(Δ47), δ13C, and δ18O
Warm T(Δ47) (34–42°C) for ~31–24 cal ka BP Palouse loess matrix samples are generally consistent with shallow depths of formation in the paleosoil column; however, shallow-soil (~10 cm depth) temperatures measured at the Lind, WA, Soil Climate Analysis Network site (Fig. 1A) rarely exceed 32°C, even when maximum daily temperatures are in excess of 40°C (Fig. 8). This calls into question whether apparent T(Δ47) values >32°C can be explained by warm-season carbonate formation in the shallow soil and suggests additional impacts from (1) kinetic isotope effects and/or (2) transient PC formation following summer storm events should also be considered.
Due to the slow rate of calcite precipitation at depth in (paleo)soils, PC should theoretically form in isotopic equilibrium with soil water and CO2 (Cerling and Quade, Reference Cerling and Quade1993). However, disequilibrium and associated kinetic isotope effects (KIE) are known to impact carbonates precipitated in response to rapid CO2 degassing. Such KIE have been shown to result in cave calcite T(Δ47), δ13C, and δ18O values higher than those expected for equilibrium formation (Kluge and Affek, 2012) and have also been proposed to explain elevated T(Δ47), δ13C, and δ18O values observed in modern high-elevation, hyperarid soils (Burgener et al., Reference Burgener, Huntington, Hoke, Schauer, Ringham, Latorre and Díaz2016). Consistent with KIE, Palouse samples with apparent T(Δ47)>32°C have the highest carbonate δ13C values in the sample suite (> −5‰; Table 1), but this association is well explained by formation in the shallow (paleo)soil, as discussed. Moreover, carbonate δ18O values for high-T(Δ47) Palouse samples are not anomalously high (Fig. 3), suggesting KIE did not measurably impact Palouse samples examined here. Accordingly, we interpret all analyzed Palouse carbonates to have formed in equilibrium.
To explain Palouse samples characterized by T(Δ47)>32°C, we propose these loess matrix carbonates reflect brief and intermittent carbonate formation in the shallow paleosoil following individual warm-season precipitation events. This was shown to be a viable mechanism to explain T(Δ47) variability observed at shallow depths (≤40 cm) in modern soils in the western United States (Hough et al., Reference Hough, Fan and Passey2014) and the Andes of South America (Burgener et al., Reference Burgener, Huntington, Hoke, Schauer, Ringham, Latorre and Díaz2016; Ringham et al., Reference Ringham, Hoke, Huntington and Aranibar2016). Such short-duration formation makes PC more sensitive to transient shallow-soil conditions, which in the case of summer rain events in the Palouse would commonly be associated with the maximum values of soil temperature and water δ18O that appear to have been recorded by some glacial-aged Palouse loess matrix carbonates (Fig. 7).
Quantification of late glacial–Holocene climate change in the Palouse
Palouse loess matrix carbonates that record only shallow- and/or transient-soil conditions may provide limited or misleading insight into last glacial paleoenvironmental conditions. Accordingly, we base our last glacial climate reconstruction on samples interpreted to record integrated, deeper (>0.5 m depth) soil conditions, specifically those from the macroscopic PC–rich, well-indurated portion of the Washtucna paleosol (Fig. 9). Macroscopic PCs were not located during sampling of Holocene horizons at CLY-1/3 and WA-5, limiting reconstruction of Holocene paleoenvironmental conditions to loess matrix carbonates. Measured carbonate δ13C and δ18O and calculated water δ18O values for Holocene loess matrix carbonates of this study are consistent with published records of regional Holocene carbonate δ13C and δ18O (Fig. 3) and modern soil water δ18O (Takeuchi et al., Reference Takeuchi, Goodwin, Moravec, Larson and Keller2009; Stevenson et al., Reference Stevenson, Kelly, McDonald, Busacca and Welker2010; Figs. 6 and 7). T(Δ47) values for Holocene carbonates analyzed here also overlap modern, shallow-soil (upper 1 m) temperatures in the Palouse that average ~20°C during the summer (Fig. 8). Together, these agreements suggest Holocene-aged loess matrix carbonates at CLY-1/3 and WA-5 are robust proxies for warm-season Holocene climate of the Palouse.

Figure 9 Paleoclimate interpretation of CLY-1/3 T(Δ47) record. Light-colored boxes show full T(Δ47) uncertainty and depth ranges for sample groupings discussed in the text. Average T(Δ47) for samples from the indurated portion of the Washtucna paleosol (blue; 9±4°C) is significantly colder than that for the Holocene Bk interval (green, 18±2°C). Note Holocene T(Δ47) overlaps modern regional warm-season soil temperatures (WSSoilT) (Fig. 8). The ~24 cal ka BP loess matrix samples with T(Δ47) >30°C (red) are interpreted to reflect shallow-soil effects in an aggrading soil column (see text for discussion). Regional mean annual air temperature (MAAT) and maximum warm season air temperature (WSMaxAirT) shown for reference. (For interpretation of the references to color in this figure legend, the reader is referred to the web version of this article.)
Presumably, loess matrix carbonates from the indurated portion of the Washtucna paleosol record comparable warm-season conditions for the late–last glacial period. Macroscopic PC development in last glacial Palouse soils was also likely promoted during the warm season, although lower T(Δ47), soil CO2 δ13C, and water δ18O values relative to loess matrix carbonates of similar age and/or depth suggest that macroscopic PC formation was more distributed seasonally (i.e., not only during summer) and/or commonly occurred at greater depths in the paleosoil where soil temperature and water δ18O more closely approximate mean annual rather than warm-season values (Breecker et al., Reference Breecker, Sharp and McFadden2009; Quade et al., Reference Quade, Eiler, Daëron and Achyuthan2013). We consider the potential effects from differences in the seasonal timing and/or depth of formation among Washtucna paleosol carbonate phases when quantifying last glacial–Holocene climate change in the Palouse.
Protracted development of the Washtucna paleosol throughout ~31–20 cal ka BP (Fig. 4) limits paleoclimate interpretation of its isotopic records to a multimillennial time scale. Accordingly, for interpretation of last glacial period paleoclimate, we group samples dated to the LGM proper (23–19 ka BP) with samples having slightly older, near-LGM 14C ages of ~31–24 cal ka BP (grouping hereafter referred to as “late glacial”). Similarly, we group samples from the SHC paleosol with those dated to the Holocene, because there is no identifiable stratigraphic distinction between the modern Bk horizon and the late deglacial SHC paleosol, which is dated here to 15–11 cal ka BP (Fig. 4).
Identification of distinct late glacial and Holocene pedogenic intervals and quantification of magnitudes of late glacial–Holocene climate change is most reliably determined for the loess source-proximal CLY sequence. At CLY-1/3, average carbonate δ13CVPDB for Holocene samples (−7.3±0.1‰ [± 1 standard deviation]) is lower than the late glacial average (−6.0±0.6‰); however, calculated late glacial soil CO2 δ13CVPDB values (−16.7±1.1‰) are within error of those for the Holocene (−16.9±0.2‰; Fig. 8). Given the preponderance of evidence suggesting a more arid late glacial paleoclimate in the Palouse (Barnosky, Reference Barnosky1985; Thompson et al., Reference Thompson, Whitlock, Bartlein, Harrison and Spaulding1993; Whitlock and Bartlein, Reference Whitlock and Bartlein1997; Blinnikov et al., Reference Blinnikov, Busacca and Whitlock2001, Reference Blinnikov, Busacca and Whitlock2002; Takeuchi et al., Reference Takeuchi, Goodwin, Moravec, Larson and Keller2009; PMIP3 simulations), we presume such aridity changes are imprinted on Palouse proxy records despite the apparently unchanging soil CO2 δ13C values. Under conditions of lower atmospheric pCO2 during the LGM (~190 ppm; Monnin et al., Reference Monnin, Indermühle, Daellenbach, Flueckiger, Stauffer, Stocker, Raynaud and Barnola2001) in a region of stable C3-vegetation dominance like the Palouse (Blinnikov et al., Reference Blinnikov, Busacca and Whitlock2001, Reference Blinnikov, Busacca and Whitlock2002), no change in soil respiration rates would have resulted in lower LGM soil CO2 δ13CVPDB values (i.e., less high-δ13C atmospheric input). Therefore, similar soil CO2 δ13C for the late glacial and Holocene intervals suggests that influence on soil CO2 δ13C from lower pCO2 during the LGM was offset by either (1) lower LGM soil respiration rates as a result of increased regional aridity, (2) higher LGM organic matter δ13C values due to higher aridity/lower pCO2 (see Schubert and Jahren, Reference Schubert and Jahren2015; Breecker, Reference Breecker2017), or (3) both LGM soil respiration rates were lower and organic matter δ13C values were higher. In any case, we interpret the stability of calculated soil CO2 δ13C values from the late glacial into the Holocene as a record of the approximate balance between atmospheric and vegetative controls on Palouse soil CO2 δ13C through time.
The T(Δ47) record at CLY also enables us to quantify the magnitude of regional cooling during the late glacial. The difference in average T(Δ47) for Washtucna paleosol rhizolith and burrow-fill carbonates (7±4°C; n=5) and for loess matrix carbonates (13±5°C; n=2) at CLY-1/3 is not statistically significant (Student’s t-test P value=0.13). As a result, we group together Washtucna macroscopic PCs and loess matrix carbonates when quantifying paleoenvironmental conditions of the late glacial Palouse (Fig. 9). The resulting average late glacial T(Δ47) of 9±4°C is significantly lower than average T(Δ47) for SHC Holocene carbonates of 18±1°C (P value=0.003; Fig. 9) as well as the observed range for modern warm-season soil temperatures in the Palouse (~18–22°C; Fig. 8). Interpreted simply, this T(Δ47) difference indicates regional warm-season soil and surface temperatures leading up to and during the LGM were 9±5°C colder than modern which agrees with simulated magnitudes of LGM–Holocene warm-season (June-September) temperature change across the Palouse region (~5–15°C; PMIP3 simulations; Bartlein et al., Reference Bartlein, Harrison, Brewer, Connor, Davis, Gajewski and Guiot2011). This magnitude of temperature change could be an overestimate, given the typically higher temperatures for loess matrix carbonates compared with penecontemporaneous macroscopic PCs. Using only equivalent loess matrix phases from late glacial and Holocene intervals at CLY-1/3 yields a conservative estimate of late glacial–Holocene warming of ~5°C. PMIP3 outputs show that magnitudes of LGM–Holocene warm-season temperature change in the Palouse were similar to regional MAT change. As a result, we interpret the calculated Holocene–late glacial T(Δ47) difference of 9±5°C also as the magnitude of late glacial mean annual cooling across the Palouse region, a magnitude that matches that of recent proxy-model synthesis (4-12°C; Annan and Hargreaves, Reference Annan and Hargreaves2013).
Calculated soil water δ18O values also reflect a measurably colder late glacial Palouse region. The observed shift in average soil water δ18OVSMOW values from the late glacial (−16±2‰) to the Holocene (−11±1‰; Fig. 7) suggests late glacial precipitation/soil water δ18O values were 2–8‰ lower than those of the Holocene. This magnitude of change is generally consistent with GCM-simulated changes in precipitation δ18O across the most recent glacial–interglacial transition, which have been interpreted to have resulted from colder mean annual temperatures during the LGM (Jouzel et al., Reference Jouzel, Koster, Suozzo and Russell1994; Jasechko et al., Reference Jasechko, Lechler, Pausata, Fawcett, Gleeson, Cendón and Galewsky2015).
Paleoclimate interpretation of the WA-5 record is less clear than that of CLY-1/3, because the lack of a single-age paleosoil column at WA-5 makes it difficult to assess the depths of WA-5 carbonate sample formation in the paleosoil and the associated influences on isotopic values. That said, overall T(Δ47), δ13C, and δ18O trends and variability for the WA-5 record are consistent with those observed at CLY-1/3 (Fig. 7). At WA-5, Washtucna paleosol T(Δ47) ranges from 5±2°C for a 30.5 cal ka BP rhizolith up to 40±6°C for loess matrix carbonate bracketed by 31.1 and 31.2 cal ka BP radiocarbon ages (Fig. 5). Similar to our interpretation of the CLY-1/3 record (Fig. 9), we interpret the ~35°C spread in carbonate T(Δ47) across the Washtucna paleosol at WA-5 to reflect variable seasonal timings and influences from shallow-soil processes during the ~10 ka development of the late glacial Washtucna paleosol. This T(Δ47) variability limits our ability to quantify late glacial–Holocene temperature change from the WA-5 record; however, like CLY-1/3, minimum T(Δ47) at WA-5 (5±2°C) is preserved in the Washtucna paleosol and is significantly colder than both modern warm-season soil temperatures (Fig. 8) and the range of T(Δ47) values measured for Holocene carbonates (15–25°C) in the WA-5 section. Together, CLY-1/3 and WA-5 carbonate T(Δ47) records indicate a measurably colder late glacial climate across the Palouse region with a magnitude of warm-season and mean annual temperature change of 9±5°C that is in agreement with published LGM model simulations (PMIP3) and proxy-model syntheses (Bartlein et al., Reference Bartlein, Harrison, Brewer, Connor, Davis, Gajewski and Guiot2011; Annan and Hargreaves, Reference Annan and Hargreaves2013).
CONCLUSIONS
Integrated T(Δ47) and radiocarbon study of Palouse loess–paleosol carbonates offers new insight into quantitative magnitudes of regional surface/soil temperature, soil CO2 δ13C, and meteoric water δ18O change across the most recent glacial–interglacial transition in a region proximal to the Cordilleran Ice Sheet. Our work helps to discern which carbonate-bearing intervals in Palouse loess–paleosols serve as robust paleoclimate archives. Carbonate 14C ages suggest all loess–paleosol carbonates analyzed for this study formed in situ in Palouse loess (paleo)soils, including loess matrix carbonates. Association of high T(Δ47), soil CO2 δ13C values, and calculated meteoric water δ18O values for loess matrix carbonates dating to the late glacial period (~31–20 cal ka BP) points to the influence that shallow-soil and transient PC formation processes can imprint on these proxy records. Accounting for these effects, Palouse loess–paleosol T(Δ47) and water δ18O records vary coherently with paleoclimate state. Average T(Δ47) for carbonates from the late glacial Washtucna paleosol (9±4°C) in comparison to Holocene T(Δ47) (18±2°C) suggests the regional paleoclimate of the Palouse leading up to and during the LGM was 9±5°C cooler than that of the Holocene. Changes in calculated soil water δ18O values from the late glacial (−16±2‰) to the Holocene (−11±1‰) also reflect impacts of a cooler last glacial paleoclimate on regional precipitation δ18O. These magnitudes of last glacial–Holocene change in the Palouse agree with published LGM paleoclimate simulations and ensemble studies and aid understanding of the impact that extensive and thick (>1 km) North American continental ice sheets had for the late Pleistocene paleoclimate of the PNW. Our work supports previous findings that clumped isotope thermometry of loess–paleosols can provide valuable, quantitative paleoenvironmental information (Eagle et al., Reference Eagle, Risi, Mitchell, Eiler, Seibt, Neelin, Gaojun and Tripati2013) and highlights the importance of considering potential influences from PC type, shallow-soil processes, and seasonal timing of carbonate formation when reconstructing paleoclimate from these proxy archives.
ACKNOWLEDGMENTS
This work was supported by grants awarded from the M.J. Murdock College Research Program for Natural Sciences (grant #2014273 to A.R. Lechler), the U.S. National Science Foundation (EAR-125206 to K.W. Huntington), and the Quaternary Research Center at the University of Washington, in addition to student research support provided to A.R. Lechler by the Pacific Lutheran University Division of Natural Sciences. We thank Landon Burgener, Kelly Egaas, Dave Ruppert, Kyle Gosnell, Justin Johnsen, and Isabellah von Trapp for assistance with field sampling and sample preparation, and Kyle Samek for assistance with laboratory analysis. Two anonymous reviewers, associate editor Matthew Lachniet, and senior editor Nicholas Lancaster are thanked for reviews that enhanced the presentation and clarity of this article.
SUPPLEMENTARY MATERIAL
To view supplementary material for this article, please visit https://doi.org/10.1017/qua.2018.47