


INTRODUCTION
Tierra del Fuego Island was repeatedly glaciated during the late Quaternary (Caldenius, Reference Caldenius1932; Meglioli,Reference Meglioli1992; Rabassa et al., Reference Rabassa, Coronato, Bujalesky, Roig, Salemme, Meglioli and Heusser2000, Reference Rabassa, Gordillo, Ocampo and Rivas Hurtado2008; Coronato et al., Reference Coronato, Martinez, Rabassa, Ehlers and Gibbard2004). Outlet glaciers spread out in different directions from the Darwin Cordillera mountain ice sheet (Fig. 1). Cirque- and alpine-type glaciers also flowed from the Fuegian Andes summits to the lowlands. The main glaciers flowed along the Magellan Strait to the north, the Inútil-San Sebastián bay depressions to the northeast, the Fagnano Lake to the east in the middle of the island, and the Beagle Channel to the east (Fig. 1). Other minor glacier systems, such as Blanco, Lynch, and Lasifarshaj, flowed along the tectonic valleys of the Fuegian Andes, shaping their landscapes.

Figure 1. Main glacial axis (white arrows) in Tierra del Fuego Island, along which outlet glaciers from the Darwin Cordillera mountain ice sheet flowed to the lowlands. Image source: Google Earth.
The Quaternary glacial chronostratigraphy is poorly constrained by absolute dating, but geologic and geomorphic surveys offer a basis for the glacial history. Glacial chronology is tied to the Magellan Strait and to the southern Patagonian glacial model. The most extensive glacial advance in this region occurred during the middle Pleistocene (Caldenius, Reference Caldenius1932; Meglioli, Reference Meglioli1992) and it was named the Great Patagonian Glaciation (GGP), according to the first observations by Mercer (Reference Mercer1976) in the southern Patagonian Andes. Figure 2 shows the maximum extent of each glacial advance along the main glaciarization axes in Tierra del Fuego, based on previous geomorphic and sedimentological surveys.

Figure 2. Glacial limits in Tierra del Fuego and Magellan strait region (modified from Rabassa et al., Reference Rabassa, Coronato and Martínez2011). GGP: Great Patagonian Glaciation; Post GPG I, II, and III: Middle Pleistocene glaciations after the Great Patagonian Glaciation; LGM: last glacial maximum.
The northern regions of Tierra del Fuego Island preserve more glacial geomorphic and sedimentary evidence than the southern regions of the island (Fig. 2). This evidence has been interpreted as different glaciations (Fig. 3), mainly due to geomorphic relationships, erosion patterns, and weathering rinds on till boulders (Meglioli, Reference Meglioli1992). It was proposed that the late Pleistocene glacial advances in the southern regions eroded the evidence of ancient glaciations (Rabassa et al., Reference Rabassa, Coronato, Bujalesky, Roig, Salemme, Meglioli and Heusser2000). It is assumed that during the last glacial maximum (LGM) the nearness to the ice source at Darwin Cordillera and at Fuegian Andes summits promoted more powerful glacial action in the southern, mountainous regions than in the northern lowlands. Along the Beagle Channel, only one glacial advance prior to the LGM was recognized in addition to the last interglacial marine deposits (Rabassa et al., Reference Rabassa, Gordillo, Ocampo and Rivas Hurtado2008) (Fig. 3).

Figure 3. (color online) Chrono-stratigraphic chart of middle Pleistocene glacial drifts along the main glaciarization axes of Tierra del Fuego (modified from Coronato et al., Reference Coronato, Martinez, Rabassa, Ehlers and Gibbard2004; Rabassa et al., Reference Rabassa, Coronato and Martínez2011).
Only one absolute local dating is available for the middle Pleistocene glaciations in Tierra del Fuego (Walther et al., Reference Walther, Rabassa, Coronato, Tassone and Vilas2007) for the Río Cullen Drift (Fig. 3), at the southern margin of San Sebastián Bay (Fig. 1). Based on the Bruhnes magnetic polarity revealed by the till, this drift was interpreted as belonging to a middle Pleistocene glaciation (Coronato et al., Reference Coronato, Martinez, Rabassa, Ehlers and Gibbard2004).
In the Fagnano Lake region, the glacial advances Río Valdéz and Lago Chepelmut were proposed by Meglioli (Reference Meglioli1992) as middle Pleistocene glaciations but were later discarded based on detailed geomorphic surveys (Coronato et al., Reference Coronato, Roig and Mir2002, Reference Coronato, Ponce, Rabassa and Sepälä2008a, Reference Coronato, Seppälä, Ponce and Rabassa2009). Lateral and frontal moraines surrounding the Chepelmut Lake were interpreted as the last recessional phase of the LGM, and other external moraines in the Río Ewan valley were interpreted as the maximum frontal positions of the ice (Fig. 2). The same model was also found immediately to the west, along the Río Fuego valley. Both valleys were glaciated by ice lobes that diverged northwards from the Fagnano paleoglacier (Coronato et al., Reference Coronato, Ponce, Rabassa and Sepälä2008a, Reference Coronato, Seppälä, Ponce and Rabassa2009) (Fig. 2). The strength and extent of the LGM in the Fagnano Lake region were misunderstood by these pioneer works. Caldenius's two last glacial advances stages would be represented by morainic arcs in the Fagnano Lake region.
The ice-covered area of the Fagnano paleoglacier flowed along a tectonic depression, which today is partially occupied by the present Fagnano Lake. The lake extends over 105 km in length and 5–10 km in width and has a maximum depth between 120–200 m below mean lake level (Waldmann et al., Reference Waldmann, Ariztegui, Anselmetti, Coronato and Austin2010). Most of its surface is located in the Argentine territory but some of it is in Chile. The present lake extent in a half-graben, pull-apart basin developed along the South America–Scotia transform boundary plates (Menichetti et al., Reference Menichetti, Lodolo and Tassone2008), repeatedly occupied by ice during the Pleistocene (Coronato et al., Reference Coronato, Seppälä, Ponce and Rabassa2009). One of the most important glacial lobes of the region flowed in this depression, from a very extensive mountain ice sheet and tributary glaciers from the Fuegian Andes, forming a glacier network that provided a large volume of ice and debris. The Fagnano paleoglacier spread over the low ranges and lowlands of central Tierra del Fuego through three different lobes and was drained by four main outwash basins, directly into the Atlantic Ocean (Coronato et al., Reference Coronato, Seppälä, Ponce and Rabassa2009). The paleoglacier surface during the LGM (approximately 25 ka) was estimated at 4000 km2, with the maximum length of the main lobe at 132 km and the general ice surface slope at 8° (Coronato et al., Reference Coronato, Seppälä, Ponce and Rabassa2009). Terminal moraine and kettle and knob complexes have been recognized farther east and northeast of the studied outcrops (Coronato et al., Reference Coronato, Seppälä, Ponce and Rabassa2009), while submerged recessional moraines have been identified to the west (Waldmann et al., Reference Waldmann, Ariztegui, Anselmetti, Coronato and Austin2010). Based on geomorphological evidence, it was proposed that ice would have receded in three stabilization stages, which generated recessional moraine complexes in different positions along the present lake (Coronato et al., Reference Coronato, Seppälä, Ponce and Rabassa2009) (Fig. 4).
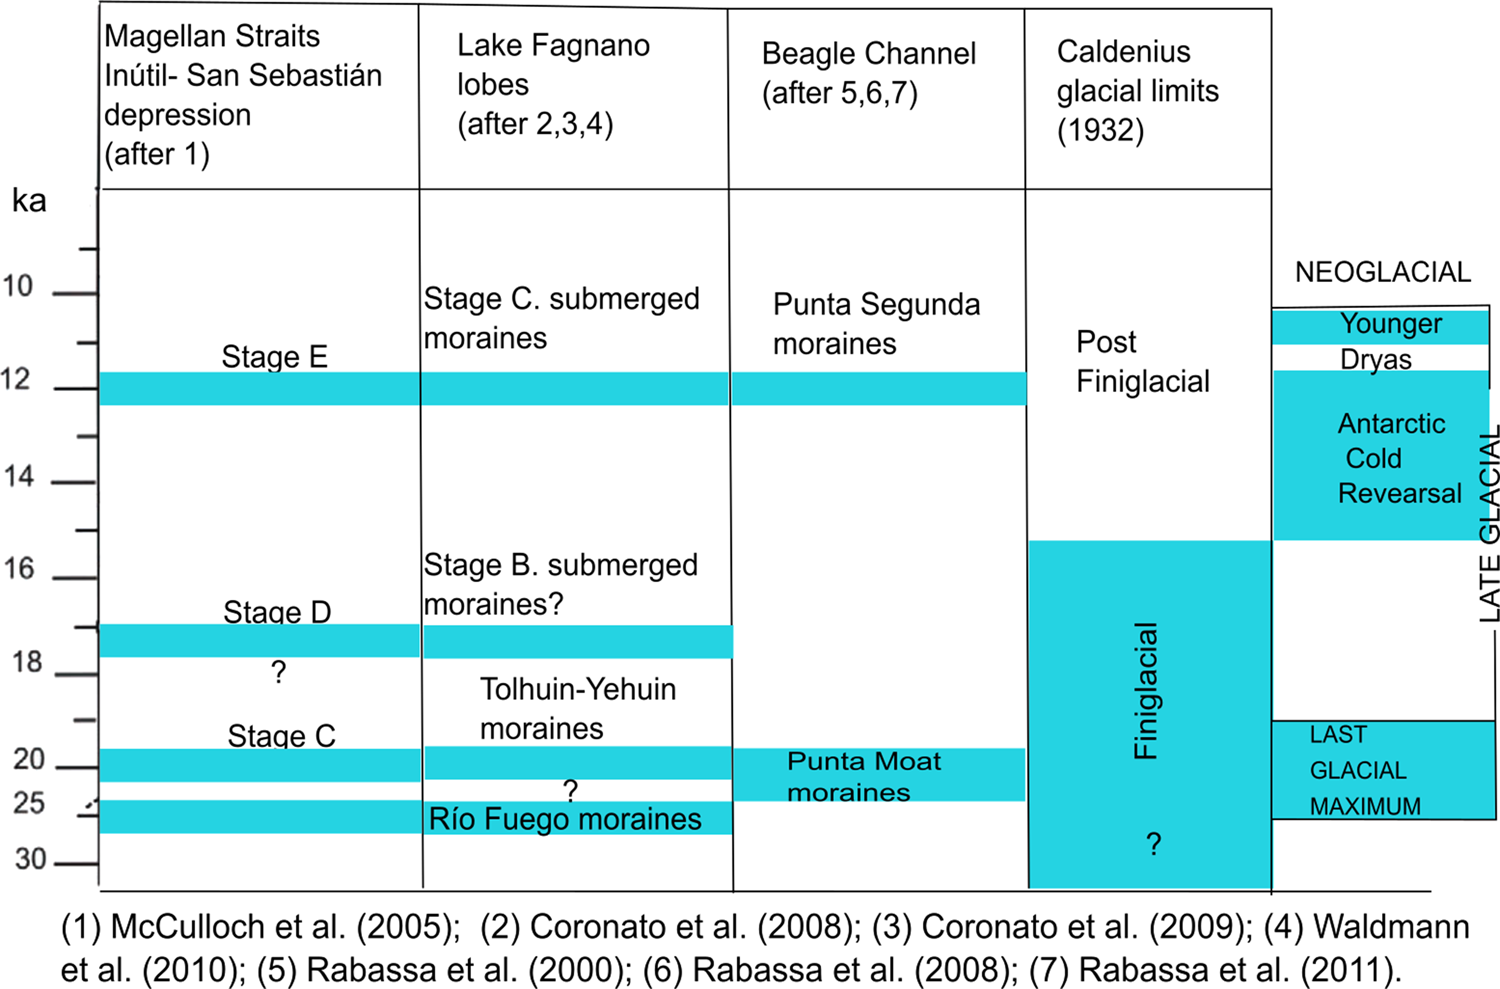
Figure 4. (color online) Chrono-stratigraphic chart of the late Pleistocene drifts along the main glaciarization axes of Tierra del Fuego (modified from Rabassa et al., Reference Rabassa, Coronato and Martínez2011).
Near the southeast coast of Fagnano Lake, beside a main road, 7–8 m thick lacustrine sediments (54°35´S, 67°20´W) crop out at 62 m asl and 25 m above the lakeshore (Coronato et al., Reference Coronato, Seppälä, Ponce and Rabassa2009). A maximum east-west extent of ca. 220 m, a minimum NNW-SSE extent of 180 m, and a minimum thickness of ca. 20 m were estimated for this deposit by magnetic and resistivity surveys of the outcrop (Prezzi et al., Reference Prezzi, Orgeira, Coronato, Quiroga, Ponce, Nuñez Demarco and Palermo2019). According to the results, the deposits cover an area of around 170,000 m2. A maximum deposition period of ~54 ka was estimated by these authors. This estimated age is similar to that obtained from fossil peat in the surrounding till deposits (Bujalesky et al., Reference Bujalesky, Heusser, Coronato, Roig and Rabassa1997; Coronato et al., Reference Coronato, Seppälä, Ponce and Rabassa2009; Ponce et al., Reference Ponce, Borromei, Coronato, Rabassa and Onorato2014). Coronato et al. (Reference Coronato, Seppälä, Ponce and Rabassa2009) also suggested an ice advance in the region sometime between 48.3 ka and 36.1 ka.
This study analyzes the exposed stratigraphic profiles and provides new radiocarbon ages, in order to propose an ice advance in the area during the late Pleistocene before Marine Isotope Stage (MIS) 2 (sensu Lisiecki and Raymo, Reference Lisiecki and Raymo2005).
STUDY AREA
The Río Valdéz outcrop is located close to the mouth of the homonym river, on the southeast coast of Fagnano Lake (Fig. 5). The locality is part of the physiographic region known as Serranías y Cuencas Lacustres (“Mountain ranges and lacustrine basins”, after Coronato, Reference Coronato, Oría and Tívoli2014). In this region, parallel low-altitude (1000–600 m asl) mountain ranges composed of metamorphic and sedimentary rocks extend west-east separated by lacustrine basins of different sizes. The main basin, Fagnano Lake, extends along a tectonic depression repeatedly excavated by glacier systems (Coronato et al., Reference Coronato, Seppälä, Ponce and Rabassa2009; Waldmann et al., Reference Waldmann, Ariztegui, Anselmetti, Coronato and Austin2010).

Figure 5. (color online) Lithology distribution of Río Valdéz outcrop surroundings (modified from Olivero, et al., Reference Olivero, Malumián and Martinioni2004).
There are no rock exposures immediately around the studied outcrop, but Quaternary glacial deposits are the dominant lithology (Fig. 5). Regionally, Eocene deep marine sedimentary rocks form the northern part of the tectonic depression, while talus marine meta-sedimentary rocks of the Yahgan and Beauvoir formations (Olivero et al., Reference Olivero, Malumián and Martinioni2004) extend in the south and east, at the base of the glacial cliffs of the lake. To the northeast of the study area, one of the few plutonic outcrops of Tierra del Fuego underlies Mount Jeujepen (800 m asl), the highest elevation in the area (Fig. 5). The Magellan-Fagnano Fault System extends eastwards along the northern side of the lake (Lodolo et al., Reference Lodolo, Menichetti, Bartole, Ben-Avraham, Tassone and Lippai2003) and the Turbio River to the Atlantic Ocean (Onorato, Reference Onorato2018). Structural alignments and inferred faults in the region (Onorato, Reference Onorato2018) generated deep fluvial erosion and impeded drainage streams with peatland development (Onorato et al., Reference Onorato, Prezzi, Orgeira, Perucca, Coronato, López and Magneres2019).
The geomorphic landscape is dominated by glacial landforms (Fig. 6) such as moraines, which extend from the lake coast to the mountain foot (2.5 km inland from the coast), where other glacial landforms show the flow of paleoglaciers from the mountains (Coronato et al., Reference Coronato, Seppälä, Ponce and Rabassa2009). The moraines (40–90 m asl) extend along the southern coast of the lake; in some localities, the cliffs show the basal till composition. The Valdéz River carved its valley between these deposits, triggering landslides (Fig. 6) of part of the moraine. Also, landslides and sediment fall occur along the morainic cliffs on the lake coastline. Pebbles and boulders that are part of the basal till are the material for gravel beaches, while silts and sands are transported into the lake by littoral drift.

Figure 6. (color online) Distribution of glacial, fluvial and littoral landforms in the Río Valdéz outcrop surroundings.
The glaciolacustrine plain formed by the Río Valdéz lacustrine deposits, presented in this paper, is clearly surrounded by moraines (Fig. 6). There are no topographic or sedimentary evidences in the other side of the river to infer the continuation of this glaciolacustrine plain northwards. Fluvial deposition landforms, such as terraces (33–39 m asl), are developed on both margins of the valley, 2 to 6 m above the present river channel. At the mouth of the river, an accretional landform composed of gravel and sands is developing (Fig. 6) due to the migration of the beach and fluvial gravels. Wave dynamics promote the formation of a 500-m-long barrier spit from northeast to southwest, while flood channels promote wetland formation.
The cold-humid oceanic climate of the area (Coronato et al., Reference Coronato, Coronato, Mazzoni and Vázquez2008b) with strong westerlies allows the development of the present Subantarctic Deciduous Magellanic Forest (Pisano, Reference Pisano1977), which covers the landscape, and peatland vegetation, which grows in former shallow lakes or flooded river sides.
METHODOLOGY
Two detailed profiles were studied in Río Valdéz outcrop: Rio Valdéz 1 (RV1), 11 m in depth, and Río Valdéz 2 (RV2), approximately 7 m in depth. The studied deposits cover an area of approximately 170,000 m2 (Prezzi et al., Reference Prezzi, Orgeira, Coronato, Quiroga, Ponce, Nuñez Demarco and Palermo2019). RV1 and RV2 are exposed on a wall of these deposits. Sedimentary units were described based on bed thickness, color, geometry, bed contacts, sedimentary structures, and texture characteristics. Different sedimentary units were also sampled for magnetic susceptibility properties, particle size, and geochemical-isotopic analyses. The chart of chromatic patterns from the Rock Color Chart Committee (1951) was used for color determination. The lithofacies code was modified Miall (Reference Miall1981, Reference Miall2006). Terminology for thickness of laminae follows Ingram (Reference Ingram1954) and Boggs (Reference Boggs2014).
Sediment samples of about 500 g were collected in the outcrop (n = 23 for RV1 and n = 15 for RV2) and analyzed for both carbonate component and organic content by calcimeter and loss-on-ignition (LOI), respectively, at CADIC-CONICET (Ushuaia, Argentina). Representative samples (n = 6) were collected from massive units to perform particle size analysis by Malvern Mastersizer 2000 laser sedigraph at CADIC-CONICET. These analyses were not carried out on the laminated deposits, since the thickness of the laminae made it impossible to sample each lithology separately. More detailed magnetic susceptibility measurements were performed at Laboratorio de Paleomagnetismo y Magnetismo Ambiental (Universidad Nacional del Centro, Tandil, Argentina) with additional sediments taken from the outcrop using cubic plastic boxes (8 cm3). They were pushed into the outcrop at a vertical distance between 2.5 cm and 5 cm (n = 224 for RV1 and n = 144 for RV2) and removed with a plastic spatula. Magnetic susceptibility was measured at low frequency using a Bartington MS2 magnetic susceptibility meter at 0.47 kHz.
The radiocarbon ages were obtained at the AMS Laboratory of the University of Arizona and later calibrated with OxCal v4.3 software (Bronk Ramsey and Lee, Reference Bronk Ramsey and Lee2013) using the Southern Hemisphere calibration curve SHCal13 (Hogg et al., Reference Hogg, Hua, Blackwell, Niu, Buck, Guilderson, Heaton, Palmer, Reimer, Reimer, Turney and Zimmerman2013). A Bayesian age-depth model was constructed with the 14C radiocarbon dates obtained. Poisson process (‘P_Sequence’) deposition models were applied to each of the RV1 and RV2 sediment profiles, applying a prior outlier probability of p = 0.05 to each of the constituent 14C dates by means of objective outlier analysis (Bronk Ramsey, Reference Bronk Ramsey2008). A null effect reservoir offset of 0 ± 500 years was applied. The regularity of the sedimentation rate was determined iteratively with OxCal by linear interpolation based upon the likelihood (calibrated 14C) data included within the model (Bronk Ramsey and Lee, Reference Bronk Ramsey and Lee2013). The median (μ) of the age intervals was used to calculate mean deposition rates.
Samples (n = 23 for RV1) were analyzed for carbon isotopes at Instituto de Geología Isotópica (INGEIS-UBA-CONICET, Buenos Aires, Argentina). Given the relatively low content of organic matter, ca. 8 mg, samples were loaded in tin capsules. Samples were measured in an elemental analyzer (Carlo Erba EA1108) coupled to a continuous flow isotope ratio mass spectrometer (Thermo Scientific Delta V Advantage), using a ConFlo IV interface. The CO2 obtained was diluted to 80% via the ConFlo IV interface. To normalize the 13C results, samples were measured together with internal references calibrated using the international standards L-SVEC, NBS-19, and NBS-22. The δ13C values were normalized on the L-SVECNBS-19 scale, according to Coplen et al. (Reference Coplen, Brand, Gehre, Gröning, Meijer, Toman and Verkouteren2006), with an uncertainty of ± 0.2‰.
RESULTS
Sedimentary description
The sequence from Río Valdéz outcrop consists of a succession of three units (A, B, and C) recognized in 6.50-m-thickness of the RV1 profile, whereas only B and C were identified in the 4.5-m-thickness of the RV2 profile (Fig. 7). A 2-m-thick diamictite deposit overlies the sequence, on which the present soil develops. Sediment outcropping in Río Valdéz contains neither carbonates nor fossils.

Figure 7. Stratigraphic correlation between RV1 (left) and RV2 (right) profiles at Río Valdéz outcrop.
Unit A. This unit is 1.50 m thick and has a covered base and an undulated top composed of silty-clayey sediments (Fl1 lithofacies with subordinate Fsm lithofacies, Fig. 8 a,b) (Table 1). Fl1 lithofacies is composed of medium-dark gray silt and clay layers with parallel thin laminae (1–3 mm in thickness), whereas Fsm lithofacies is composed of massive, medium-dark gray layers, with unimodal size distribution (Table 2). The mode is well defined within the silt fraction, with subordinate clay. Scattered throughout the deposit, there are clasts of up to 4 cm in diameter, with a predominance of rounded to sub-rounded granules, which deform the lamination.

Figure 8. (a) Fsm lithofacies composed of silt and clay material with dropstones (white arrows). (b) Fl1 lithofacies generated by silt and clay layers. (c) Fl2 lithofacies composed of silt and clay material with lenses and discontinuous layers of silt-sand. (d) Fl3 lithofacies of wavy bedding formed by alternated clay and sand layers. (e) Convolute structure showing marked crumpling of laminae. (f) Diamictite overlying the deposits.
Table 1. Lithofacies codes adapted from Miall (Reference Miall1981, Reference Miall2006).

Table 2. Results of particle size from representative samples (n = 6) of a massive unit (Fsm) by a laser sedigraph.

Unit B. This unit is 95 cm thick and has an undulated base and top, composed of fine sand and silty-clay layers with thin and very thin bedding (1–10 cm in thickness). Two lithofacies are recognized (Fl2 and Fl3) (Table 1). Fl2 is composed of silt and clay at the base, medium-dark gray, with lenses and discontinuous layers, up to 2 cm thick, of light-gray silt-sand, forming a lenticular structure (Fig. 8c). Towards the top of the deposit, Fl3 shows an increase in sand clasts, which form 3–10-mm-thick laminae interspersed with thin (1–5 mm) clay and silt, generating a wavy bedding structure (Fig. 8d), where the sand layers occasionally present normal grading.
Unit C. This unit is 400 cm thick and has an undulated base and top, composed of medium-dark gray clay and silt. Three lithofacies are recognized (Fsm, Fl1, and Fl2) (Table 1). Fsm is composed of massive silt, with a unimodal size distribution (Table 2). The mode is well defined within the silt fraction, with a predominance of medium silt, while Fl1 has diffuse lamination at the base, which grades to a well-defined parallel fine lamination (1–3 mm thick). At 300 cm from the base of the section, the layers show deformation, resulting from complex folding or crumpling of laminations into irregular, small-scale anticlines and synclines, forming a convoluted structure (Fig. 8e). Towards the top, Fl2 shows intercalations of sandy-silt lenses, which are 1 mm thick and very pale orange (10YR 8/2 as assessed on a Munsell color chart).
The diamictite (Fig. 8f) observed at the top of the outcrop is an unstratified deposit. It is composed of unsorted debris, with grain size ranging from pebbles and granules to silt and clay (Gms lithofacies) (Table 1).
The RV2 profile is 4.5 m in length and comprises units B and C of the RV1 profile, the former being 1.35 m thick and the latter 3.15 m thick (Fig. 7). After careful visual examination of the profiles, a good correlation can be obtained (Fig. 7).
Magnetic susceptibility
Oscillations of magnetic susceptibility (k) throughout the profiles are limited, with values comprised within the same order of magnitude. In particular, k fluctuates around a mean value of 10 x 10−8 m3/Kg in RV1 and 11 × 10−8 m3/Kg in RV2, with a full range of variability from ca. 5 x 10⁻⁸ m3/Kg to 15 × 10−8 m3/Kg in both profiles (Fig. 7). The obtained magnetic results allowed a comparison between both logs (Fig. 9), in good agreement with lithostratigraphic profiles.

Figure 9. Correlation between lithology facies and magnetic susceptibility curves for RV1 (left) and RV2 (right) profiles at Río Valdéz outcrop.
Geochemical data
Organic matter (OM) content was around 2% for both profiles (RV1 and RV2). The δ13C-OM values ranged from -26.2‰ to -25.1‰ with no variations with depth (Table 3). Carbonate sediments and fossils were absent in both profiles.
Table 3. RV1 profile values for depth of samples, organic matter content (%), δ13C (‰) of organic matter, radiocarbon ages, and calibrated ages with 2σ uncertainties. Note that RV1-1is the base and RV1-23 is the top of the profile.

Some samples from RV1 and RV2 profiles were dated. Tables 3 and 4 contain the conventional radiocarbon ages BP (years before 1950) for eight samples from RV1 and RV2 profiles, covering the time span from 42.80 to 17.25 14C ka BP. Samples RV1-1, RV1-9, and RV1-23 were eliminated because of contamination during sampling, confirmed by the lack of convergence observed when running the age model. This left five radiocarbon dates available for age-depth modeling (RV1-17, RV1-22; RV2-5, RV2-11, and RV2-15).
Table 4. RV2 values for depth of samples, organic matter content (%), radiocarbon ages and calibrated ages with 2σ uncertainties. Note that RV2-15 is the base and RV2-1 is the top of the profile.

Bulk organic matter on whole samples was the only component suitable for 14C dating because sediments are sterile, i.e., they do not bear fossil or modern remains. The Poisson depth-age model (OxCal v4.3 software; Bronk Ramsey and Lee, Reference Bronk Ramsey and Lee2013) reached a global convergence factor of ca. 99%, overall agreement (A) = 88.5% (Fig. 10). The results (Table 5) show that radiocarbon dates could be calibrated from 49.29 cal ka BP to 32.07 cal ka BP. Taking these results as prior likelihood, the model generated a 49.01 cal ka BP to 32.14 cal ka BP modeled interval (Table 5). An average sedimentation rate (ASR) of 32.3 cm/ka was obtained by linear fitting of depth z (cm) vs. the mean of the age in x axis (μ) obtained from the depth model. In this case z = 0.0323x – 854.52 with a R2 = 0.9678.

Figure 10. Deposition model performed for 14C ages of RV1–17, RV1–22; RV2–15, RV2–11, and RV2–5 samples using Oxcal v4.3 (Bronk Ramsey and Lee, Reference Bronk Ramsey and Lee2013).
Table 5. Modeled age for RV1 and RV2 profiles of Río Valdéz outcrop, including 14C date and calibrated and modeled ages (RV1-22; RV1-17; RV2-5; RV2-11; RV2-15).

DISCUSSION
The defined lithofacies help delineate the evolution of the sedimentary environment during the deposition of the studied record. The base of the outcrop is represented by Unit A with Fsm and Fl1 lithofacies. The first facies was formed by deposition from suspension during periods with no current activity in the water body, whereas the genesis of Fl1 is consistent with alternating deposition of low-energy tractive currents moving as a plane bed, when currents ceased and clay in suspension settled down (Reineck and Singh, Reference Reineck and Singh1980, Reference Reineck and Singh2012). The coarse clasts that deform the lamination are interpreted as dropstones resulting from ice rafting (Bennett et al., Reference Bennett, Doyle and Mather1996).
Unit B is composed of Fl2 and Fl3 lithofacies, the former being generated when incomplete small sand ripples are formed in a mud-silt substratum and preserved as a result of the deposition of a new mud layer, thus giving rise to lenticular bedding, where sand lenses are discontinuous and isolated in both a vertical and a horizontal direction (Reineck and Singh, Reference Reineck and Singh2012). Lenticular bedding is produced in environments where conditions favor deposition and preservation of mud over sand (Boggs, Reference Boggs2014). When the conditions alternate, but are such that they favor both the deposition and preservation of clay and sand, wavy stratification is formed, generating the Fl3 lithofacies.
Unit C at the top is composed of Fsm, Fl1, and Fl2 lithofacies. Fsm comprises massive sediments deposited from suspended load. In F11 the bedload moves as a plane bed, and in F12 the bedload moves as a discontinuous rippled bed, forming lenticular bedding. The convolute structure is produced by plastic deformation of partially liquefied sediment soon after deposition. Liquefaction of sediment can be caused by such processes as differential overloading (Reineck and Singh, Reference Reineck and Singh2012).
Variations in lithology and structures indicate changes in the energy of transport and deposition agents. Because layers of two different kinds of material are repeated, they can be named rhythmites. The reasons for such rhythmic repetition are regular changes in the transport or production of material (Reineck and Singh, Reference Reineck and Singh2012). In this case, the regular changes can be seasonal.
The sediment characteristics are compatible with glacial lake environments, and the absence of fossils could indicate a lake water temperature related to direct contact with an ice margin. These lakes receive their sediment supply during relatively warmer periods, when ice melts and glacial streams bring a large amount of sediment to the lake. Coarse particles are deposited at the margins. Fine sand, silt, and clay are transported to the central part of the lake. The coarser fraction, composed of sand and coarse silt, settles down at once. Clay remains in suspension and settles down slowly. During cooler periods, the clay layer is deposited on the top of the silt layer. Underflow currents along the bottom of the lake deposit the laminated, commonly graded, or rippled sand and silt that characterize the coarse layers of the rhythmite sediments. Throughout the lake, sediment particles settle from suspension throughout the year, whenever and wherever water velocity is low enough to allow it. As soon as underflows cease (especially during winter) or shift laterally, the fine silt and clay that characterize the winter layer settle to the lake bottom (Reineck and Singh, Reference Reineck and Singh2012).
The characteristics of the diamictite sediments that cover the outcrop indicate that they were directly laid down by ice once the lake disappeared, forming a till. This deposit could represent a late stage of the LGM.
The obtained magnetic results allowed comparison between both profiles, in good agreement with lithostratigraphic profiles. Unit A, registered exclusively in the RV1 profile, shows a decreasing tendency of magnetic susceptibility; this tendency could be assigned to a decrease in magnetic particle size. Unit B shows an oscillation of magnetic susceptibility values in both profiles; this behavior could be associated with the alternation of heterolytic sediments, with lenses and discontinuous sand-silt laminae in a pelitic matrix. The lowest magnetic susceptibility values could be associated with the mud sediments. Towards the top of this unit, a susceptibility peak is observed in both profiles, which may be associated with a relative increase in magnetic particle size and/or an event related to higher magnetic mineral input. Unit C in both profiles also shows an oscillation of magnetic susceptibility values, with an increasing tendency towards the top. This agrees with the variations in sedimentary facies, where the mud sediments with thin lamination grade to other sediments with intercalations of sandy silt lenses; again, the magnetic susceptibility is closely linked to magnetic particle grain size. There is a noticeable susceptibility peak at the top of the unit that could be associated with a relative increase in magnetic particle size and/or an event related to higher magnetic mineral input.
The OxCal deposition model (Bronk Ramsey and Lee, Reference Bronk Ramsey and Lee2013) for the Pleistocene section yielded calibrated 14C ages (2σ) that ranged from 49.29 cal ka BP to 32.07 cal ka BP (Table 5). Since the age-depth model for the Pleistocene segment (Fig. 10) yielded a reliable chronology for an interval of 49.01 cal ka to 32.14 cal ka (modeled age), it was possible to estimate the average sedimentation rate of 32.3 cm/ka. This value is quite coincident with the average sedimentation rate estimated in other lakes of southern South America (Kliem et al., Reference Kliem, Enters, Hahn, Ohlendorf, Lisé-Pronovost, St-Onge and Zolitschka2013).
Assuming that it is possible to estimate the period involved during the deposition of the studied glaciolacustrine deposits, the average sedimentation rate of 32.3 cm/ka was used to estimate the maximum deposition period. A previous study (Prezzi et al., Reference Prezzi, Orgeira, Coronato, Quiroga, Ponce, Nuñez Demarco and Palermo2019) calculated twice the depth for the complete sedimentary sequence. These deposits could represent a deposition period of approximately 58.8 ka.
The age model and sedimentation rates of the lacustrine sedimentary sequence support the hypothesis that the Fagnano paleoglacier was present in central Tierra del Fuego before MIS 2, between 49 to 32 cal ka BP, which corresponds to the period in which Heinrich cold events H5 to H3 of MIS 3 occurred in Greenland (Denton, Reference Denton2000) and in the central Laurentide Ice Sheet (Dalton et al., Reference Dalton, Finkelstein, Forman, Barnett, Pico and Mitrovica2019). Although terrestrial paleoenvironmental data previous to the LGM is still scarce for the high latitudes of the Southern Hemisphere, some evidences from pre-LGM lacustrine deposits have been found along the Southern Andes Patagonian valleys (Horta et al, Reference Horta, Georgieff, Aschero and Goñi2017; Reference Horta, Belardi, Georgieff and Carballo Marina2019). The δ13C organic matter record shows homogeneous values, around -25‰, corresponding to vegetation cover or to a C3 photosynthetic pathway. In C3 plants, atmospheric CO2 is fixed during the Calvin cycle, yielding C3 compounds as first products and an isotopic signature that varies between -32 and -21‰, with an average of -25‰ (Badeck et al., Reference Badeck, Tcherkez, Nogués, Piel and Ghashghaie2005). These plant types are typical of relatively wet environments. Plants with the C3 photosynthetic pathway dominate Extra-Andean Patagonia (Paruelo et al., Reference Paruelo, Beltrán, Jobbágy, Sala and Golluscio1998). Recent evidence from isotopic studies on shrub-steppe, gramineous steppe, and forest also shows values of δ13C between -30.35‰ to -20.60‰, characteristic of C3 plants in southern Patagonia (Santa Cruz province) (Tessone, Reference Tessone2012). At 2.5 km from the studied area, Ponce et al. (Reference Ponce, Borromei, Coronato, Rabassa and Onorato2014) recognized fossil deposits of peat of ages comparable to the paleo-lacustrine sequence, which contain pollen associations of herbaceous (dominated by Poaceae), shrubby (Empetrum rubrum, Asteroideae), and cushions (Azorella, Myrteolanummularia) communities, without trees.
The closest lake to compare climate records and environmental changes during the late Pleistocene is located 500 km north of the study area, at Laguna Potrok Aike (51°58′ S, 70°22′ W, Santa Cruz province). It is located in the Extra-Andean tablelands, in the Pali Aike volcanic field, and it originated from phreatomagmatic eruptions during the middle Pleistocene, probably during the post-GGP 1 glaciation in the Magellan Strait region (Coronato et al., Reference Coronato, Ercolano, Corbella and Tiberi2013). It is 90 km north of the last glacial moraines of the Magellan Straits paleoglacier but contains one of the longest high-resolution and continuous continental archives for the late Pleistocene in South America. Paleoenvironmental reconstructions at Laguna Potrok Aike show stadial and interstadial conditions from 51.2 to 33.1 cal ka BP (Hahn et al., Reference Hahn, Kliem, Ohlendorf, Zolitschka, Rosen and Team2013), a lapse in which a sedimentation rate (37 cm/ka) was estimated by Kliem et al. (Reference Kliem, Enters, Hahn, Ohlendorf, Lisé-Pronovost, St-Onge and Zolitschka2013). In addition, δ13C results (Hahn et al., Reference Hahn, Kliem, Ohlendorf, Zolitschka, Rosen and Team2013) show an increase in productivity indicators, suggesting periods of ameliorated climatic conditions and/or increased nutrient input, which favor the development of aquatic macrophytes and diatom blooms.
Mayr et al. (Reference Mayr, Lücke, Maidana, Wille, Haberzettl, Corbella and Ohlendorf2009) showed that the C/N ratio is a reliable tool for the distinction of diatomaceous ooze, cyanobacteria, and soils from vascular plants including aquatic (macrophytes and mosses) and terrestrial vegetation. Despite C/N values being useful in distinguishing aquatic from terrestrial sources because aquatic organic matter has a significantly higher bulk N content than that of terrestrial organic matter (Tyson, Reference Tyson2001), the low content of organic matter in RV1 and RV2 samples did not allow nitrogen isotope ratio measurements (15N/14N) on organic matter. The Río Valdéz outcropping sequence contains neither carbonate nor fossils, and has low organic matter of C3 plant origin; this evidence suggests cold and wet conditions for 49.01 ka to 32.14 cal ka BP. There are two possibilities for the origin of C3 plants in the study area. One is the presence of aquatic plant macrophytes in situ, and the other one is the contribution of plants from the surrounding area. Given the absence of fossil records in the lake sediments, the latter hypothesis is the most plausible.
The sedimentology and chronology of Rio Valdéz glaciolacustrine deposits, with dropstones, absence of a fossil record, and scarce presence of organic matter, suggest deposition in an ice-contact lake, possibly dammed by the Fagnano paleoglacier. Moreover, the constancy of the isotopic values (C3 photosynthetic pathway) suggests a stable climate with cold and wet conditions. The rhythmic deposit indicates climate seasonality.
These data are in agreement with the obtained radiocarbon ages, ranging between 41.8–31.08 cal ka BP, for fossil peat layers and clasts incorporated into till deposits presented by Coronato et al. (Reference Coronato, Seppälä, Ponce and Rabassa2009) and with palynological data (Ponce et al., Reference Ponce, Borromei, Coronato, Rabassa and Onorato2014). The development of peatlands in ice-marginal or frontal terrains where glaciers advance explains its incorporation into the glacial mass and, later, into till deposits.
It seems that the ameliorating climatic conditions proposed from the Extra-Andean Potrok Aike sediment record during that period were not so prevalent at Río Valdéz. The influence of the Fuegian Andes mountain ice caps fed by the humid westerlies would have promoted the presence of ice lobes advancing into the lowlands at least 20,000 years before the LGM reached its maximum extent and coverage.
This estimation is in accordance with fossil peat ages obtained from the surrounding glaciodeltaic deposits by Bujalesky et al. (Reference Bujalesky, Heusser, Coronato, Roig and Rabassa1997) and the basal moraine tills reported by Coronato et al. (Reference Coronato, Seppälä, Ponce and Rabassa2009). Ponce et al. (Reference Ponce, Borromei, Coronato, Rabassa and Onorato2014) described glacial sediments interbedded with the peat levels dated by Coronato et al. (Reference Coronato, Seppälä, Ponce and Rabassa2009) near the study area. Based on the peat calibrated ages and their paleoenvironmental interpretation, these organic deposits can be assigned to MIS 3, as they are deposited close to the ice-front position, with rapid and frequent ice margin fluctuations. This evidence supports the hypothesis that glaciers were present in this area before MIS 2, or probably ca. 57 ka BP, the boundary between MIS 3 and 4 (sensu Lisiecki and Raymo, Reference Lisiecki and Raymo2005). These results are also in agreement with those of Stage A of the Inútil Bay glacial model in northwestern Tierra del Fuego (McCulloch et al., Reference McCulloch, Fogwill, Sudgen, Bentley and Kubik2005).
Concerning the data herein presented and the estimation of lake sediment thickness proposed by Prezzi et al. (Reference Prezzi, Orgeira, Coronato, Quiroga, Ponce, Nuñez Demarco and Palermo2019), this glaciolacustrine environment could have been active during MIS 4. Evidence from the Rio Valdéz outcrop suggests that the climate amelioration of MIS 3 was not strong enough to generate a non-glacial environment in central Tierra del Fuego. These new data improve the current paleoglacial model of Tierra del Fuego Island (Figs 3 and 4). More absolute dating is necessary to confirm the proposal presented here. Also, terrestrial paleoclimatic data previous to the LGM are still scarce for high latitudes of the Southern Hemisphere.
Finally, the Río Valdéz glaciolacustrine deposit suggests that the Fagnano paleoglacier was present in the study area prior to the LMG, at the same time as the Inútil-San Sebastián paleoglacier. As both glaciers flowed from the same mountain ice sheet in the Darwin Cordillera, a different behavior between this ice cap and the ones from the Patagonian Andes is inferred. This could have been forced by the occurrence of different atmospheric dynamics and the closeness to the wet and cold subantarctic air mass circulation.
CONCLUSIONS
The defined lithofacies of Río Valdéz outcrops delineates the evolution of the sedimentary lake environment. Variations in lithology and structures indicate regular changes in the energy of transport and deposition agents. During repeated relative warmer periods, fine sand and coarse silt were transported to the central part of the lake, and settled down at once, while clay remained in suspension. During cold periods, the clay layer was deposited on top of the silt or sand layer. The presence of dropstones and the absence of a fossil record indicate an ice-contact lake. The Río Valdéz outcropping sequence is carbonate-free with no fossils and has low organic matter of C3 plant origin, which suggests cold and wet conditions. This interpretation suggests the C3 biochemistry signal comes from the surrounding area.
The 14C age model suggests an age between 49.01 cal ka BP to 32.14 cal ka BP for these glaciolacustrine sediments. This means that the Fagnano paleoglacier was present in the study area prior to the LMG, at the same time as the Inútil-San Sebastián paleoglacier, both flowing from the same mountain ice sheet in the Darwin Cordillera. This evidence makes it possible to infer a different behavior between this ice cap and the ones from the Patagonian Andes, perhaps forced by different atmospheric dynamics and the closeness to wet and cold subantarctic air masses.
ACKNOWLEDGMENTS
Ignacio Mageners performed the grain-size analyses at CADIC-CONICET (Ushuaia, Argentina). This research was funded by Proyectos de Investigación Científica y Tecnológica (PICT) 2012-068, Universidad de Buenos Aires, Ciencia y Técnica (UBACyT) 20020170100312BA (2018-2021) and Proyectos de Investigación Plurianuales (PIP) 11220120100573CO. English improvement was carried out by Alejandra Scotti, professional English translator.


