INTRODUCTION
In East Africa, the role of orbital forcing on climate change in the rift and its implications for hominin evolution remain highly debated (deMenocal, Reference deMenocal2004; Ashley, Reference Ashley2007; Trauth et al., Reference Trauth, Maslin, Deino, Strecker, Bergner and Dühnforth2007; Maslin et al., Reference Maslin, Shultz and Trauth2015; Cuthbert et al., Reference Cuthbert, Gleeson, Reynolds, Bennett, Newton, McCormack and Ashley2017; see also Behrensmeyer [Reference Behrensmeyer2006], Bonnefille [Reference Bonnefille2010], and Levin [Reference Levin2015] for paleoclimate of early human evolution). Over the last decade, paleoclimatic and paleohydrologic hypotheses have been developed not only from distant deep-sea sediment cores (deMenocal, Reference deMenocal2004), but also from paleolake exposures much closer to hominin fossil sites (Trauth et al., Reference Trauth, Maslin, Deino and Strecker2005, Reference Trauth, Maslin, Deino, Strecker, Bergner and Dühnforth2007, Reference Trauth, Maslin, Deino, Junginger, Lesoloyia, Odada, Olago, Olaka, Strecker and Tiedemann2010; Deino et al., Reference Deino, Kingston, Glen, Edgar and Hill2006; Ashley, Reference Ashley2007). In this context, records from several episodes of large, deep lakes have been analyzed from the Plio-Pleistocene in Tanzania, Ethiopia, and Kenya, focusing on the occurrence of diatomites along the East African Rift (Trauth et al., Reference Trauth, Maslin, Deino and Strecker2005, Reference Trauth, Maslin, Deino, Strecker, Bergner and Dühnforth2007). These paleolakes would have been relatively synchronous and controlled by periodic arid/humid shifts driven by a ~23 ka precessional insolation cycle. Extreme arid/humid shifts would have occurred every ~400 ka, in response to Earth’s eccentricity minima/maxima. Before ~2.7 Ma, extensive deep-water lakes would have been centered on the ~400 ka component of the eccentricity cycle. After ~2.7 Ma, deep paleolakes would have appeared every “~800 ka” only, with periods of precessionally forced extreme arid/humid climate variability (Trauth et al., Reference Trauth, Maslin, Deino, Strecker, Bergner and Dühnforth2007). Thus, recent syntheses linking lake level changes to climate and hominin evolution have proposed the “pulsed climate variability hypothesis” (Maslin et al., Reference Maslin, Brierley, Milner, Shultz, Trauth and Wilson2014, Reference Maslin, Shultz and Trauth2015). In this model, a cause-effect relationship is established between extreme arid to humid climate swings and hominin evolution 1.9–1.7 Ma ago, in response to Earth’s eccentricity maxima (Maslin et al., Reference Maslin, Brierley, Milner, Shultz, Trauth and Wilson2014, Reference Maslin, Shultz and Trauth2015). Applied in the Turkana basin, a key basin for hominin occupations in East Africa, this hypothesis would suggest that Lake Turkana’s levels changed in response to extreme climate shifts during the early Pleistocene. However, Lake Turkana is a closed/terminal lake that formed by a succession of major volcanic events that reorganized the Omo River drainage basin at that time (Haileab et al., Reference Haileab, Brown, McDougall and Gathogo2004; Bruhn et al., Reference Bruhn, Brown, Gathogo and Haileab2011). Therefore, it could be expected that this lake should respond not only to orbital climate forcing as suggested by Maslin et al. (Reference Maslin, Brierley, Milner, Shultz, Trauth and Wilson2014), but also to regional tectono-volcanic activity.
Research objectives
The intent of this article is fourfold: (1) to establish clearly the chronology of lake level changes in the Turkana basin during the early Pleistocene; (2) to reevaluate the role of orbital forcing on lake level changes; (3) to estimate the contribution of tectono-volcanism to a simpler astronomical modulation of the early Pleistocene lake level changes; and (4), after placing the evolution of Lake Turkana into its regional hydrovolcanic context, to discuss the relationships between lake level changes and hominin occupations, with a special emphasis on the evolution of hydrologic conditions.
BACKGROUND
The Turkana basin
The Turkana basin is located within the East African Rift System (EARS) at the junction of two uplifted zones, the Ethiopian dome (>1800 m) and the Kenyan dome (>1000 m; Fig. 1), in the deepest segment of the Kenyan rift (<500 m). This sedimentary basin has accumulated a large amount of lacustrine to volcanic deposits within a series of six half-grabens (Dunkelman et al., Reference Dunkelman, Karson and Rosendahl1988) since the formation of the EARS 30 Ma ago (Chorowicz, Reference Chorowicz2005). The first paleolakes were initiated in the west of the basin during the late Oligocene to early Miocene (Chorowicz, Reference Chorowicz2005). The Plio-Pleistocene deposits defined as the Omo Group include the Nachukui, Koobi Fora, and Shungura Formations (de Heinzelin, Reference de Heinzelin1983). Of these, the Nachukui Formation on the western side of the basin exposes the most continuous sequence of sediments that are primarily controlled by rift-lake margin dynamics with ~900 m of cumulative strata (Harris et al., Reference Harris, Brown and Leakey1988; Brown and McDougall, Reference Brown and McDougall2011). This sediment package extends from ~4.5 to 0.7 Ma with no major gap, and the chronostratigraphy is constrained by 40Ar/39Ar radiometric dating of volcanic tuffs (Harris et al., Reference Harris, Brown and Leakey1988; Feibel et al., Reference Feibel, Brown and McDougall1989; McDougall and Brown, Reference McDougall and Brown2008; Brown and McDougall, Reference Brown and McDougall2011; see also McDougall et al. [Reference McDougall, Brown, Vasconcelos, Cohen, Thiede and Buchanan2012] for the correlations between the volcanic tuffs throughout the Omo-Turkana basin and Brown et al. [Reference Brown, Sarna-Wojcicki, Meyer and Haileab1992] for the correlations with tuffs from the Gulf of Aden) and magnetostratigraphic studies (Hillhouse et al., Reference Hillhouse, Ndombi, Cox and Brock1977, Reference Hillhouse, Cerling and Brown1986; Lepre and Kent, Reference Lepre and Kent2010; Lepre et al., Reference Lepre, Roche, Kent, Harmand, Quinn, Brugal, Texier and Feibel2011). Based on the tephrostratigraphy, eight geologic members have been delimited since the 1980s (Harris et al., Reference Harris, Brown and Leakey1988; see also McDougall et al., Reference McDougall, Brown, Vasconcelos, Cohen, Thiede and Buchanan2012): Lonyumun (>4–3.97 Ma), Kataboi (3.97–3.44 Ma), Lomekwi (3.44–2.53 Ma), Lokalalei (2.53–2.33 Ma), Kalochoro (2.33–1.87 Ma), Kaitio (1.87–1.5 Ma), Natoo (1.5–1.3 Ma), and Nariokotome (1.3–0.7 Ma). The Nachukui Formation also includes the Apak (>4.22 Ma), Muruongori (~4 Ma), and Kaiyumung (3.9–3.0 Ma) members (see Feibel, Reference Feibel2003; Brown and McDougall, Reference Brown and McDougall2011). The geology of the members expresses large-scale deposits and basin dynamics (Harris et al., Reference Harris, Brown and Leakey1988).
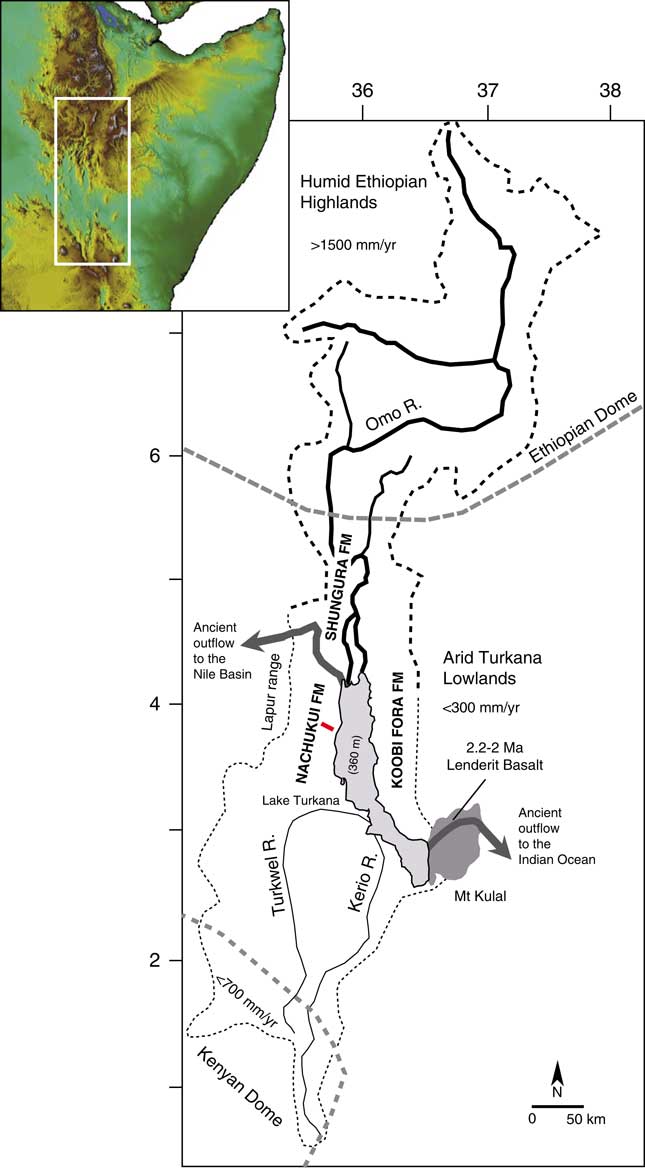
Figure 1. (color online) Map of the Omo-Turkana drainage basin (dashed lines) showing the location of the geologic cross section (red bar) for the stratigraphic interval between 2.4 and 1.72 Ma presented in Figures 2 and 3. The drainage boundaries and elevation were calculated from Global Multi-resolution Terrain Elevation Data 2010 (GMTED2010; Danielson and Gesch, Reference Danielson and Gesch2011).
Hydroclimatic context of Lake Turkana
In the Turkana basin, the Lake Turkana drainage basin (130,000 km2; Fig. 1) occupies two very contrasted hydroclimatic zones: the arid-hot Turkana lowlands (<500 meters above sea level [m asl]; <300 mm/yr of precipitation; mean annual temperature of 30°C; Lien et al., Reference Lien, Liti and Kallqvist1988) and the tropical-humid Ethiopian highlands (>1500 m asl; >1500 mm/yr of precipitation; mean annual temperature of 19°C; Olaka et al., Reference Olaka, Odada, Trauth and Olago2010). In contrast to the tropical monsoonal climate in the Ethiopian highlands, the Turkana lowlands have a desert climate according to the Köppen classification (550 cal/cm2/d; Peel et al., Reference Peel, Finlayson and McMahon2007). The Turkana lowlands have been constantly arid during the past 4 million yr (Passey et al., Reference Passey, Levin, Cerling, Brown and Eiler2010). The regional aridity was initiated ~10 Ma ago, since tectonic uplift of East Africa created a topographic barrier for atmospheric circulation and precipitation (Sepulchre et al., Reference Sepulchre, Ramstein, Fluteau, Schuster, Tiercelin and Brunet2006). In this orographic context, the low-level Turkana jet produces patterns of descending air that enhance aridity in the Turkana depression (orographic channeling effect; Nicholson, Reference Nicholson2016).
Although Lake Turkana is located within the arid-hot Turkana closed depression, it is the largest lake (7500 km2) in an arid environment on the planet (Bloszies and Forman, Reference Bloszies and Forman2015). The lake is 260 km long but averages only 30 m depth, with a maximum of 110 m. Today, Lake Turkana is terminal/endorheic with no outflow to the Indian Ocean or Mediterranean Sea (via the Nile basin). Thus, the existence of this large closed interior basin lake depends almost completely on inflows from the tropical Ethiopian highlands: 80% to 90% of freshwater inflow is supplied by the perennial Omo River. The other main tributaries are the intermittent Turkwel and Kerio Rivers (southern basin; Fig. 1), which provide the other 10% to 20% (Bloszies and Forman, Reference Bloszies and Forman2015). If the drainage basin was restricted to the Turkwel and Kerio, there would be no permanent lake in the arid Turkana depression. Because the Omo River drainage basin ends in Lake Turkana today, the modern lake equilibrates between freshwater inputs from the Omo River (<500 m3/s, Lien et al., Reference Lien, Liti and Kallqvist1988) and evaporation outputs (2.5–3.5 m/yr; Lien et al., Reference Lien, Liti and Kallqvist1988). The lake water is therefore currently alkaline (21–34 meq/L; Lien et al., Reference Lien, Liti and Kallqvist1988; Olago and Odada, Reference Olago and Odada1996; see also Cerling, Reference Cerling1979), with a moderate salinity/Total Dissolved Solids (2500 ppm; Yuretich and Cerling, Reference Yuretich and Cerling1983).
Turkana paleolakes
Paleolakes have fluctuated up to +100 m above the modern level (360 m asl), providing evidence for hydrologic history that is exceptional for East Africa (Halfman, Reference Halfman1987; Olaka et al., Reference Olaka, Odada, Trauth and Olago2010; Garcin et al., Reference Garcin, Melnick, Strecker, Olago and Tiercelin2012). On the western margin of the Turkana basin, stratigraphic evidence of lake fluctuations is found within the Nachukui Formation at: >4–3.99 Ma (Lonyumun Lake phase; Feibel, Reference Feibel2011); ~3.5 to 3.3 Ma (Lokochot Lake phase; Feibel, Reference Feibel2011); ~3.15 Ma (Waru Lake phase; Feibel, Reference Feibel2011); ~2.5 Ma (Lokeridede Lake phase; Feibel, Reference Feibel1997); 2.4 to 2.3 Ma (Kokiselei Lake phase; this study); 2.25–2.2 Ma (Nasura Lake phase; this study); 2.17 to ~1.95 Ma (pre–Lorenyang Lake phase; this study); ~1.95 to ~1.76 Ma (Lorenyang Lake phase; this study); ~1.1–0.9 Ma (Silbo Lake phase; Feibel, Reference Feibel1997). Most of the depositional environments in west Turkana appear to be related to these paleolake systems, and very few are fluvial and terrestrial sensu stricto; some lacustrine carbonates became “pedogenic” following exposure. In the rift axis, paleolake levels (paleoshorelines) are deformed by tectonics, but paleolake fluctuations are well expressed by the stratigraphic sequences of offshore, shoreface, beachface, and backshore systems (see Nutz et al., Reference Nutz, Schuster, Boës and Rubino2017; Schuster and Nutz, Reference Schuster and Nutz2018).
Volcanic closure of Lake Turkana
Tectonics and volcanism have played an important role in the reorganization of Paleolake Turkana and paleo–Omo River outflow systems (see Haileab et al., Reference Haileab, Brown, McDougall and Gathogo2004; Gathogo et al., Reference Gathogo, Brown and McDougall2008; Opdyke et al., Reference Opdyke, Kent, Huang, Foster and Patel2010; Bruhn et al., Reference Bruhn, Brown, Gathogo and Haileab2011). Before 4.5 Ma, the Omo-Turkana drainage system had a northern outlet channel to the west and the Mediterranean Sea (Haileab et al., Reference Haileab, Brown, McDougall and Gathogo2004; Bruhn et al., Reference Bruhn, Brown, Gathogo and Haileab2011). This outlet channel was cut off by subsidence and the formation of a lower southeastern outflow sill to the Indian Ocean (the Hoi channel; see Bruhn et al., Reference Bruhn, Brown, Gathogo and Haileab2011). After 3.95 Ma, the southeastern outlet channel was probably relocated north of Loiyangalani (southeastern end of the lake) because of the eruptions of the Gombe Basalts at 4.5–3.95 Ma (Bruhn et al., Reference Bruhn, Brown, Gathogo and Haileab2011). From 2.5 to 2 Ma, successive channel outlet routes formed between the southeastern end of the lake and the entrance to the modern Chalbi desert. Outflows to the Indian Ocean were finally cut off by several eruptions of lava flows (Lenderit, Marsabit, and Balo; Fig. 1) from 2.2 to 1.8 Ma (Haileab et al., Reference Haileab, Brown, McDougall and Gathogo2004; Bruhn et al., Reference Bruhn, Brown, Gathogo and Haileab2011). Since the final closure of the southern route to the Indian Ocean, outflows to the Nile basin were temporarily open thereafter (e.g., during the African Humid Period lake high stand; Garcin et al., Reference Garcin, Melnick, Strecker, Olago and Tiercelin2012).
Hominin coastal occupations
In the western side of Lake Turkana, the Nachukui Formation is a key field survey area because it exposes nearly continuous stratigraphic sequences of paleolake margin deposits along with numerous associated archaeological sites from the late Pliocene and early Pleistocene (Kibunjia et al., Reference Kibunjia, Roche, Brown and Leakey1992; Kibunjia, Reference Kibunjia1994; Roche et al., Reference Roche, Delagnes, Brugal, Feibel, Kibunjia, Mourre and Texier1999, Reference Roche, Brugal, Delagnes, Feibel, Harmand, Kibunjia, Prat and Texier2003; Prat et al., Reference Prat, Brugal, Roche and Texier2003, Reference Prat, Brugal, Tiercelin, Barrat, Bohn, Delagnes and Harmand2005; Tiercelin et al., Reference Tiercelin, Schuster, Roche, Brugal, Thuo, Prat, Harmand, Gourguen, Barrat and Bohn2010; Harmand et al., Reference Harmand, Lewis, Feibel, Lepre, Prat, Lenoble and Boës2015). Despite the Nachukui Formation deposits being mostly related to subaqueous environments, the number of archaeological sites is high (Roche et al., Reference Roche, Brugal, Delagnes, Feibel, Harmand, Kibunjia, Prat and Texier2003) because of a cumulative effect of hominin occupations along shifting shorelines, which also favored site formation processes through time (for the geologic context, see Roche et al., Reference Roche, Delagnes, Brugal, Feibel, Kibunjia, Mourre and Texier1999, Reference Roche, Brugal, Delagnes, Feibel, Harmand, Kibunjia, Prat and Texier2003; Prat et al., Reference Prat, Brugal, Roche and Texier2003, Reference Prat, Brugal, Tiercelin, Barrat, Bohn, Delagnes and Harmand2005; Tiercelin et al., Reference Tiercelin, Schuster, Roche, Brugal, Thuo, Prat, Harmand, Gourguen, Barrat and Bohn2010; Harmand et al., Reference Harmand, Lewis, Feibel, Lepre, Prat, Lenoble and Boës2015). Thus, this region is an important piece of the puzzle in terms of hominin behavioral evolution: the earliest known knapped stone artifacts are found at 3.3 Ma at Lomekwi 3 (Harmand et al., Reference Harmand, Lewis, Feibel, Lepre, Prat, Lenoble and Boës2015; Lewis and Harmand, Reference Lewis and Harmand2016), early Oldowan stone artifacts are found at Lokalalei 1 and 2C at 2.34 Ma (Kibunjia, Reference Kibunjia1994; Roche et al., Reference Roche, Delagnes, Brugal, Feibel, Kibunjia, Mourre and Texier1999; Delagnes and Roche, Reference Delagnes and Roche2005), and the earliest known Acheulean bifaces occur at Kokiselei 4 at 1.76 Ma (Lepre et al., Reference Lepre, Roche, Kent, Harmand, Quinn, Brugal, Texier and Feibel2011).
The Nachukui Formation also provides the highest number of hominin species from the Omo Group, shedding light on key questions for human evolution and dispersal (e.g., Brown et al., Reference Brown, Harris, Leakey and Walker1985; Walker et al., Reference Walker, Leakey, Harris and Brown1986; Brown and Feibel, Reference Brown and Feibel1988; Leakey and Walker, Reference Leakey and Walker1988; Walker and Leakey, Reference Walker and Leakey1993; Brown et al., Reference Brown, Brown and Walker2001; Leakey et al., Reference Leakey, Spoor, Brown, Gathogo, Kiarie, Leakey and McDougall2001; Prat et al., Reference Prat, Brugal, Tiercelin, Barrat, Bohn, Delagnes and Harmand2005). Indeed, several fossil discoveries made in West Turkana have changed previous phylogenies and ideas about hominin evolution (Australopithecus, Paranthropus, and early Homo lineages; see, e.g., Wood and Constantino, Reference Wood and Constantino2007; Wood and Leakey, Reference Wood and Leakey2011; see also Feibel et al. [Reference Feibel, Brown and McDougall1989] for the stratigraphic context of fossils). We can mention, for example, the specimens KNM-WT 40000 (Kenyanthropus platyops; 3.5–3.2 Ma; Leakey et al., Reference Leakey, Spoor, Brown, Gathogo, Kiarie, Leakey and McDougall2001), KNM-WT 17000 (Paranthropus aethiopicus; 2.5 Ma; Walker et al., Reference Walker, Leakey, Harris and Brown1986), KNM-WT 42718 (early Homo; 2.4–2.3 Ma; Prat et al., Reference Prat, Brugal, Tiercelin, Barrat, Bohn, Delagnes and Harmand2005), and KNM-WT 15000 (Homo erectus/ergaster; 1.6–1.5 Ma; Walker and Leakey, Reference Walker and Leakey1993). Comparatively, the ~2.5–2 Ma key interval in hominin evolution is not well exposed/preserved in the Koobi Fora Formation on the eastern side of the basin.
MATERIAL AND METHODS
Site location
Because of the time period of interest (early Pleistocene evolution of Lake Turkana), we have concentrated our field surveys on the Kalochoro Member of the Nachukui Formation (2.33–1.87 Ma). The upper Lokalalei Member has also been surveyed to extend our reconstruction up to 2.4 Ma, as well as the lower Kaitio Member, for the stratigraphic interval between 1.87 and ~1.7 Ma. This stratigraphic interval includes four volcanic tephra that have been identified and radiometrically dated since the 1980s (Harris et al., Reference Harris, Brown and Leakey1988; Feibel et al., Reference Feibel, Brown and McDougall1989; McDougall and Brown, Reference McDougall and Brown2008; Brown and McDougall, Reference Brown and McDougall2011; McDougall et al., Reference McDougall, Brown, Vasconcelos, Cohen, Thiede and Buchanan2012): the Kokiselei Tuff (2.4 ± 0.05 Ma) is exposed at the top of the Lokalalei Member; the Kalochoro Tuff (2.33 ± 0.02 Ma) and Tuff G (2.27 Ma ± 0.04 Ma) are exposed at the base of the Kalochoro Member; and the KBS (Kay Behrensmeyer Tuff) Tuff (1.87 ± 0.02 Ma) is found at the base of the Kaitio Member. In this tephrostratigraphic context, two Oldowan archaeological site complexes, Kokiselei and Nasura (Roche et al., Reference Roche, Brugal, Delagnes, Feibel, Harmand, Kibunjia, Prat and Texier2003; Harmand et al., manuscript in preparation), have been intensively surveyed and excavated between 2010 and 2017 by the West Turkana Archaeological Project (WTAP).
Geologic survey
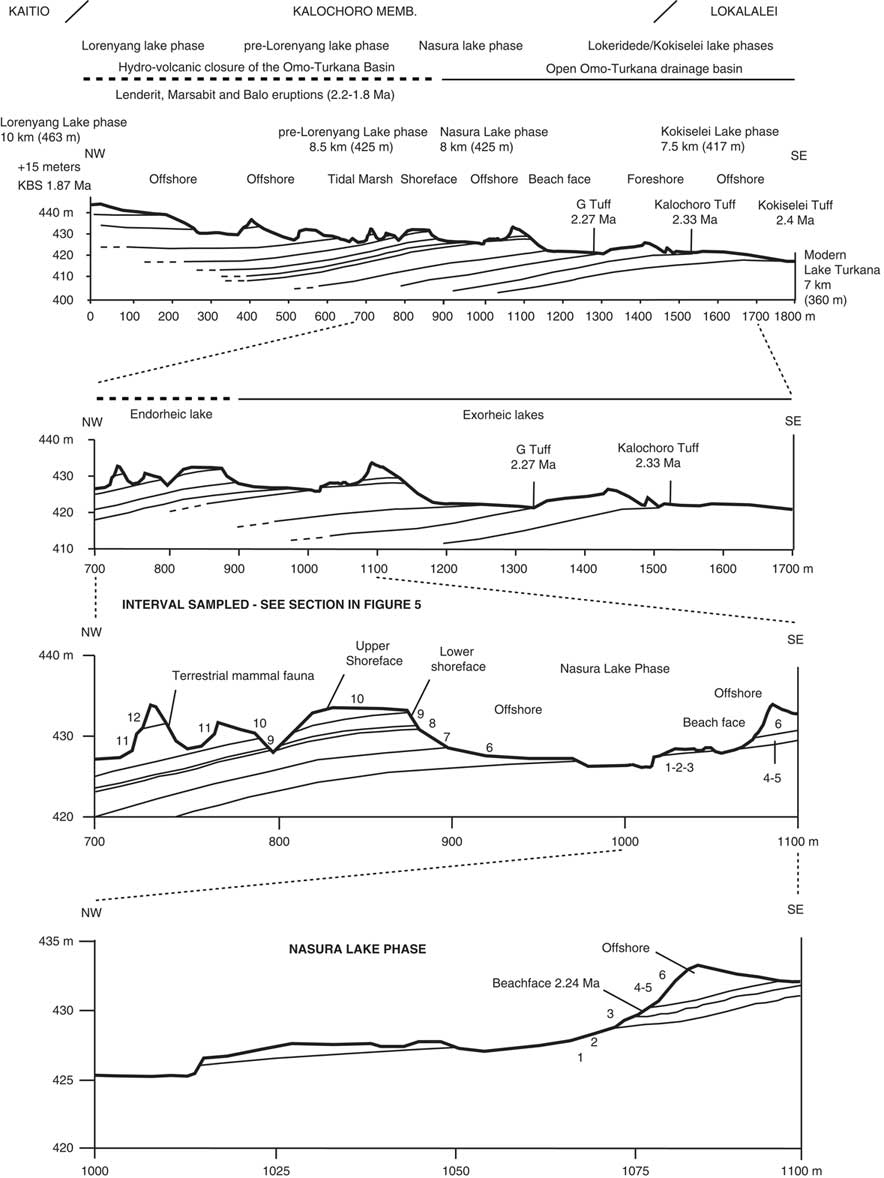
Following the geologic members, we have established a geologic section across the upper Lokalalei, Kalochoro, and lower Kaitio Members (Figs. 2, 3). The geologic section begins with the Kokiselei Tuff at an elevation of 417 m and ends at 442 m. Stratigraphically, the section ends ~15 m below the KBS bentonite that delimits the Kalochoro/Kaitio Member boundary. For the stratigraphic interval of 15 m below and 24 m above the KBS, our cross section is completed by that of Nutz et al. (Reference Nutz, Schuster, Boës and Rubino2017), which has been established in the continuation of our section up to 463 m. The stratigraphic interval of 15 m below the KBS is characterized by offshore muds, and the sediments 24 m above are mostly marked by shoreface oncolite-rich silty-sands from the end of Lorenyang Lake phase (see Nutz et al., Reference Nutz, Schuster, Boës and Rubino2017). The geologic section can be observed along the Kokiselei ephemeral stream (base: 4°0.197′N, 35°47.946′E; top: 4°0.387′N, 35°46.863′E; WGS84). The top of the section from Nutz et al. (Reference Nutz, Schuster, Boës and Rubino2017) is located at the Kokiselei locality (top: 4°0.307′N, 35°46.518′E; WGS84).

Figure 2. Geologic cross sections with the location of the studied paleolakes and volcanic tuffs. The 2.33 ± 0.02 Ma Kalochoro Tuff delimits the transition between the Lokalalei and Kalochoro Members. The 1.87 ± 0.02 Ma KBS Tuff delimits the Kalochoro and Kaitio boundary. Distances to modern Lake Turkana are reported for each paleolake phase. Numbers denote lithostratigraphic units described in Figure 5.
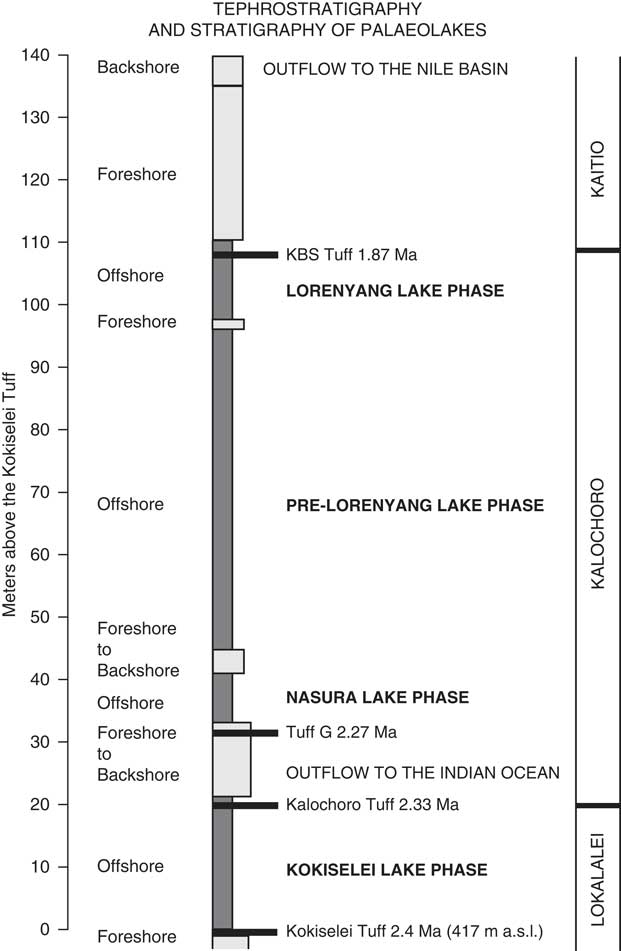
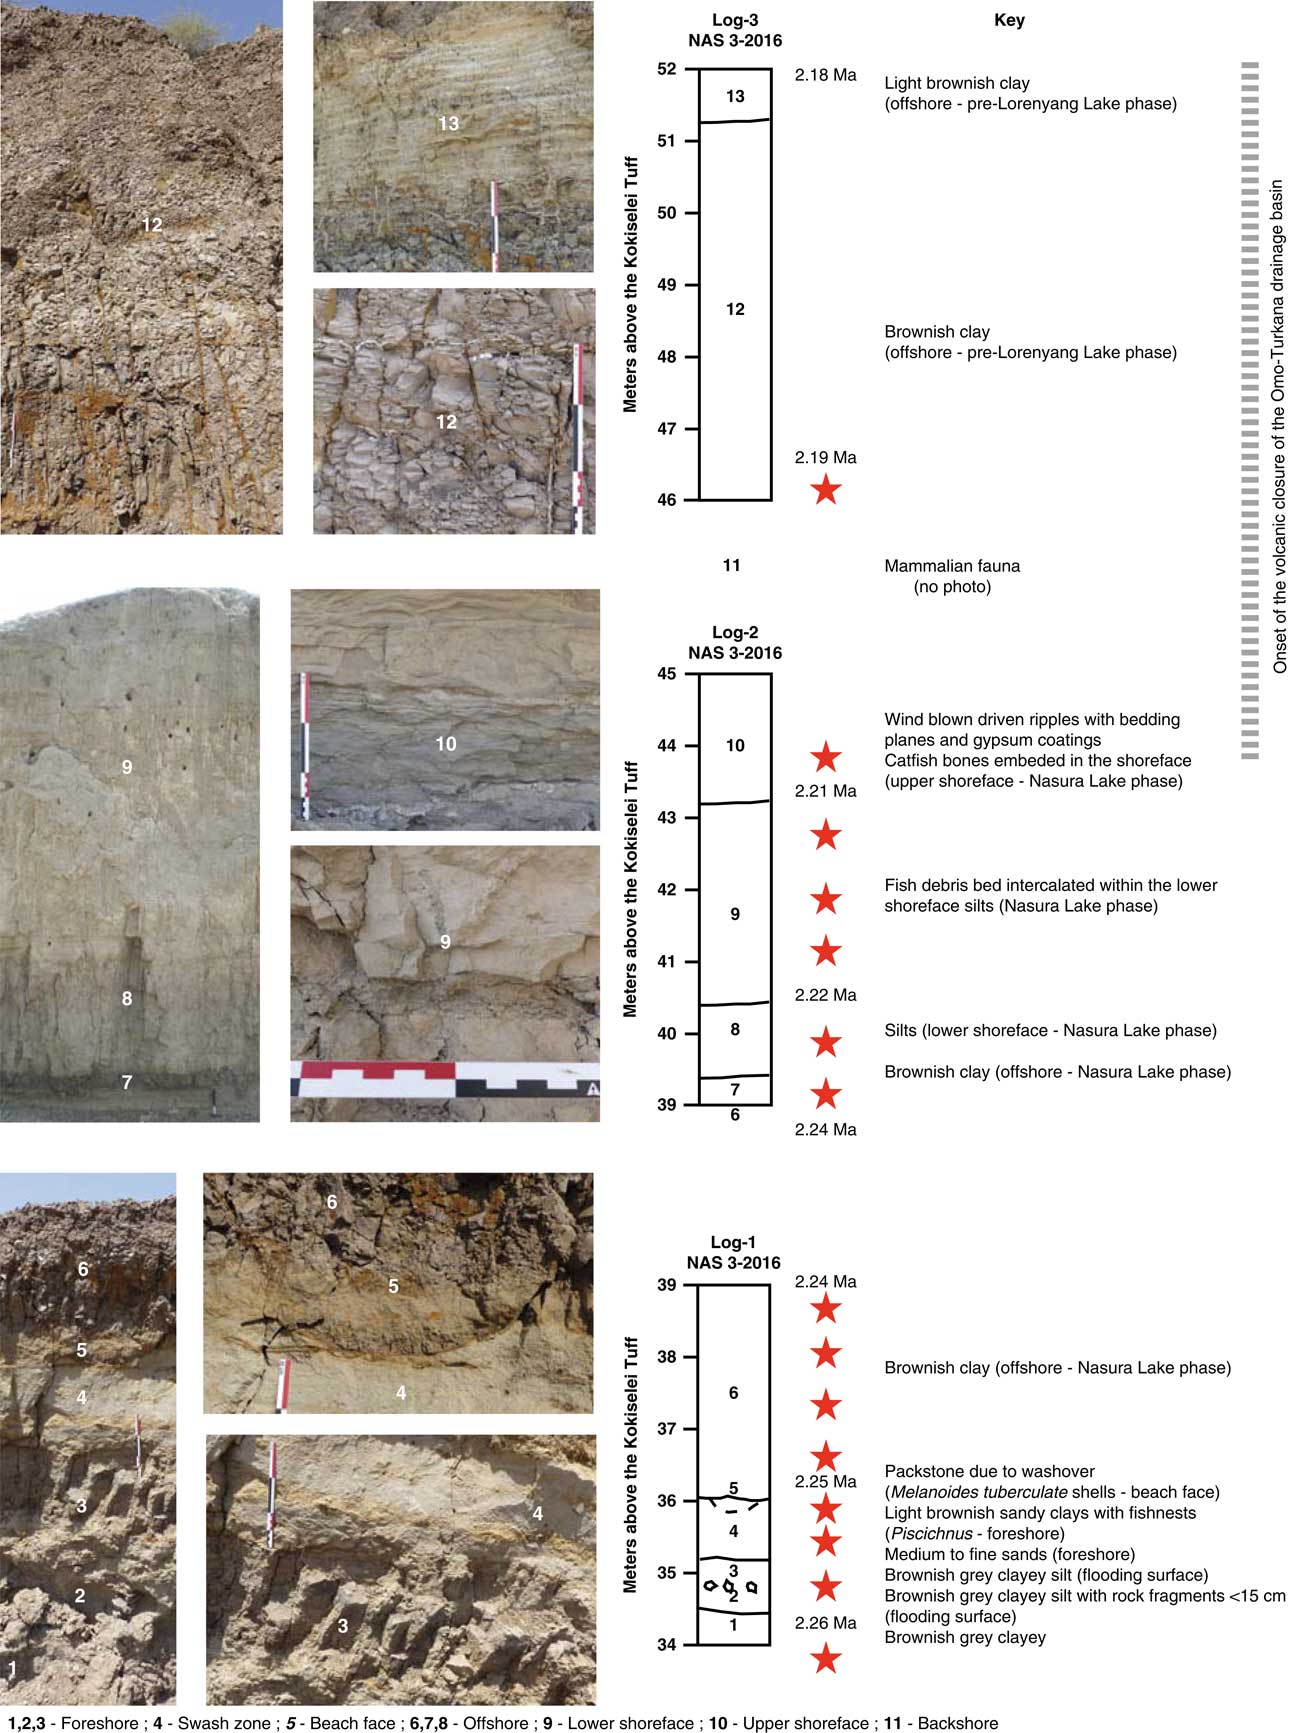
Figure 3. Stratigraphic column of the upper Lokalalei, Kalochoro, and lower Kaitio Members, linking the lacustrine sediments (offshore clays to foreshore sands) with the volcanic tuffs locally identified within these geologic members (see the identified volcanic tuffs presented in the Table 1).
Total station survey
The method applied to carry out the geologic cross section is the routing method supported by the method of radiation with a total station (measure angle and distance to each feature; X, Y, Z of the surveyed points, Leica TS06 total station). The routing is represented in the plan as a broken polygonal line in which the mutual position of the points is determined by measuring the distances between the breaking points and by measuring the angles in the breaking points of the polygonal route. The routing supposes the increase of the geodesic network to determine the detail point coordinates in the field. The increase of the geodesic network was done by determining the coordinates of some points that become the main elements of the topographic survey. The main elements are volcanic beds and lake sediment successions. A paleolake phase is defined as a conformable succession of genetically related beds, including sand and pebbles (high-energy fluviolacustrine deposits; flooding surface); sands (high-energy deposits/foreshore system); sands and shells (high-energy waves deposits/beachface system; see Nutz et al., Reference Nutz, Schuster, Boës and Rubino2017; Schuster and Nutz, Reference Schuster and Nutz2018); homogeneous clays (very low-energy lake deposits/offshore system); bioturbated silts with wave ripple laminations (low-energy lake deposits/lower shoreface system); cross-bedded silts to medium sand (low- to high-energy lake deposits/upper shoreface system). The bottom and top of each system have been measured with the total station (Fig. 2).
Geochronology
The geochronology is established using the projection of the volcanic tuffs in the stratigraphy as measured by the total station (Figs. 3, 4). The volcanic tuffs were located and sampled, and their GPS coordinates were compared to samples analyzed and identified by Haileab (Reference Haileab1995) at the same localities. The volcanic beds that correspond to the GPS coordinates of the identified beds are Kokiselei, Kalochoro, and G (see Table 1 for the coordinates of the tuffs). This confirms interpretations made in the field, based on the geology of the members after Harris et al. (Reference Harris, Brown and Leakey1988). For the KBS Tuff, a bentonite found at the transition between the Kalochoro and Kaitio Members (4°0.375′N, 35°46.553′E; WGS84) corresponds to the KBS bed identified in Lepre et al. (Reference Lepre, Roche, Kent, Harmand, Quinn, Brugal, Texier and Feibel2011). An age model has been calculated using the sedimentation rate estimates between each volcanic bed (Fig. 4). The mean sedimentation rates are 30 cm/ka between the Kokiselei Tuff and Tuff G, and 20 cm/ka between the Tuff G and KBS Tuff. For the interval above the KBS, the sedimentation rate was estimated at 22 cm/ka by Lepre et al. (Reference Lepre, Roche, Kent, Harmand, Quinn, Brugal, Texier and Feibel2011; see also Nutz et al., Reference Nutz, Schuster, Boës and Rubino2017). The lacustrine cycles are reconstructed along the geologic section from 2.4 to ~1.7 Ma using stratigraphic facies to associate water/depth-controlled sediments to lake-level changes.
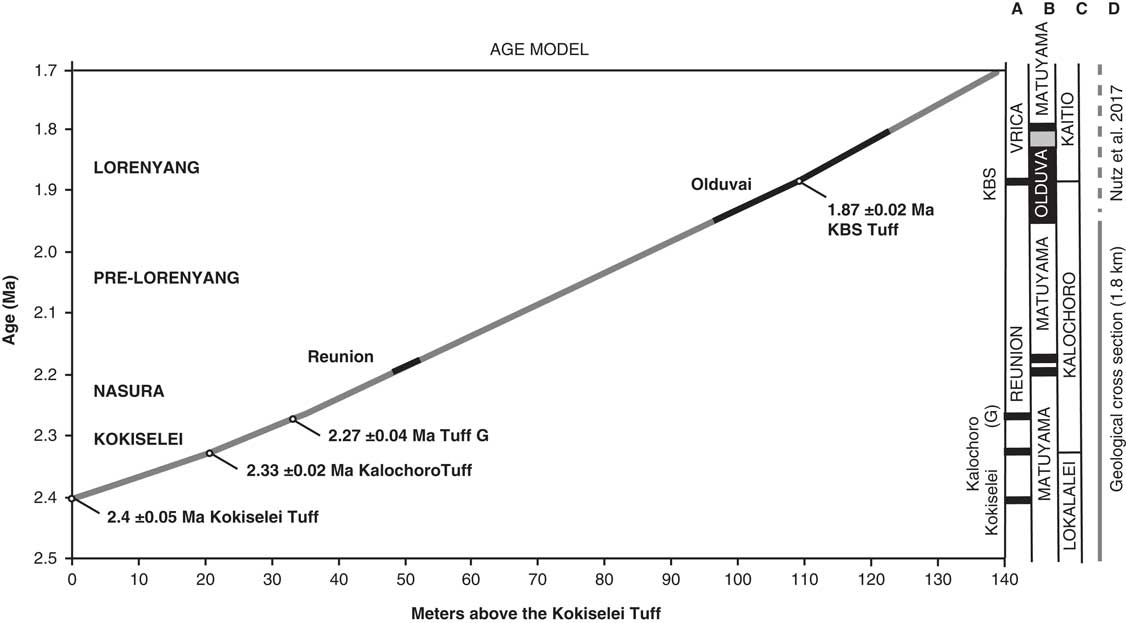
Figure 4. Age models obtained for the 1.8-km-long geologic cross section presented in Figures 2 and 3. The stratigraphic distances are measured in meters above the Kokiselei Tuff with a total station. Ages for the Reunion events are placed according to Quidelleur et al. (Reference Quidelleur, Holt, Salvany and Bouquerel2010) and Singer et al. (Reference Singer, Jicha, Condon, Macho, Hoffman, Dierkhising, Brown, Feinberg and Kidane2014).
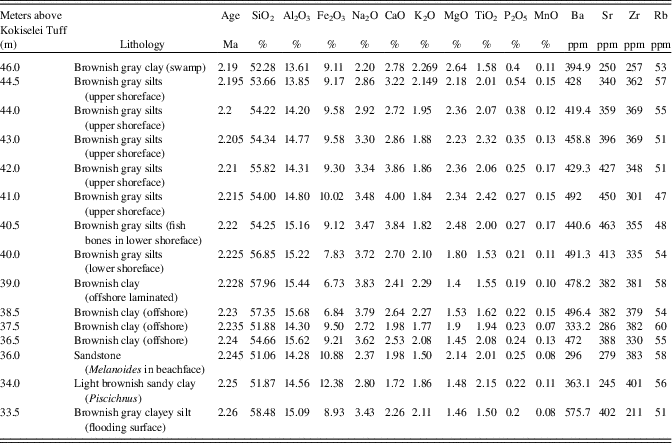
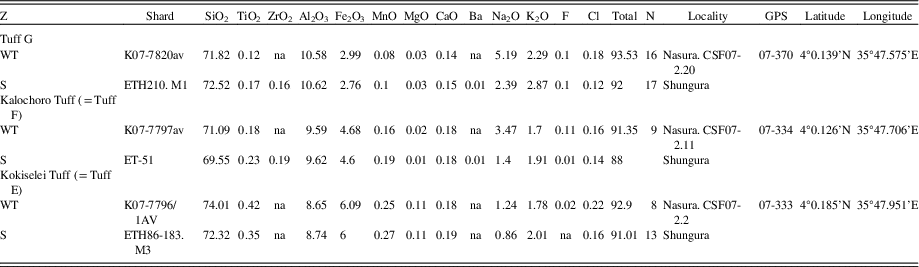
Table 1. Geochemical correlations for tephra sampled at the Nasura locality. All values are in wt%. Analytical methods as reported in Roman et al. (Reference Roman, Campisano, Quade, DiMaggio, Arrowsmith and Feibel2008) for K07 samples and Haileab (Reference Haileab1995) for ETH samples. S, Shungura; WT, West Turkana.
Geochemical analyses
The evolution of lake water with depth is also evaluated from the geochemical component of sediment samples collected from 2.26 to 2.19 Ma, just after the onset of volcanic closure of the Omo-Turkana drainage connection to the Indian Ocean (Haileab et al., Reference Haileab, Brown, McDougall and Gathogo2004; Gathogo et al., Reference Gathogo, Brown and McDougall2008; Opdyke et al., Reference Opdyke, Kent, Huang, Foster and Patel2010; Bruhn et al., Reference Bruhn, Brown, Gathogo and Haileab2011). Sediment samples have been collected from bottom to top of each type of system (flooding surface, foreshore, offshore, lower and upper shoreface; Fig. 5) that was easily accessible at the Nasura locality (Nasura Lake phase). Superficial sediments were removed before sampling in order to retrieve sediment with as little physical and chemical weathering as possible. Each sample was reduced to powder in an agate ring mill. Major element concentrations (Si, Ti, Mn, Na, P) were analyzed by inductively coupled plasma optical emission spectrometry (Thermo Fischer ICP-OES Icap 6500) at the “Centre de Recherches Pétrographiques and Géochimiques” (CRPG), Nancy, France. Analytical procedures and uncertainties are described in detail in Carignan et al. (Reference Carignan, Hild, Mevelle, Morel and Yeghicheyan2001). Data are reported in Table 2. The precision and accuracy is better than 1% for >10 wt% oxide proportion, within 1–5% for 1–5 wt% oxide proportion and 5–15% for >0.5 wt% oxide proportion. Trace element concentrations (Rb, Sr, Zr, Ca, Ba) were analyzed by inductively coupled plasma mass spectrometry (Thermo Elemental ICP-MS X7) at the CRPG. The precision and accuracy of the analyses were assessed by measuring four rock standards.

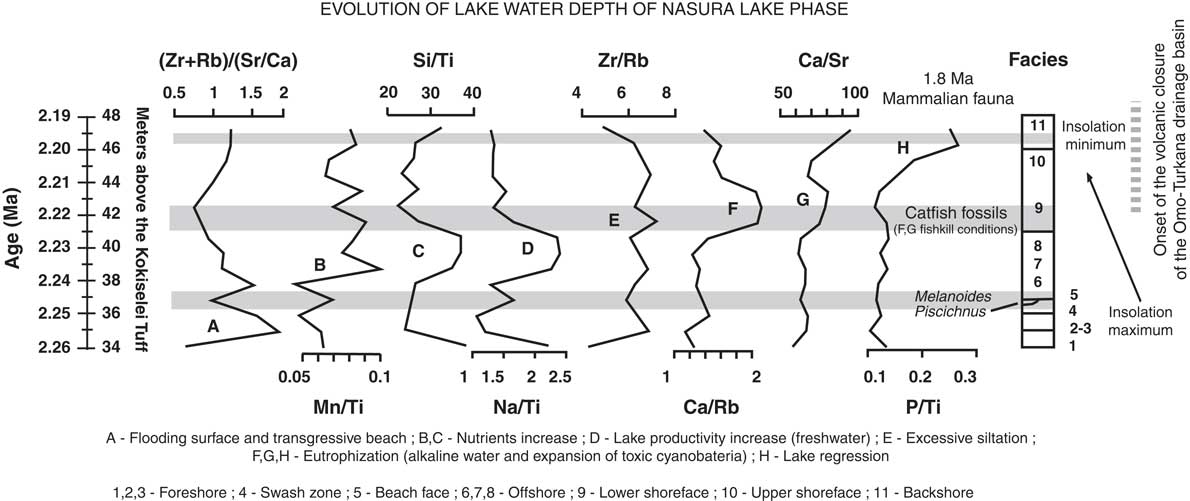
Figure 5. Lithology and stratigraphy of the Nasura Lake phase (Nasura locality). The red stars represent the analyzed geochemical samples. See Figure 2 for the location of the examined outcrops. (For interpretation of the references to color in this figure legend, the reader is referred to the web version of this article.)
Table 2. Geochemical results obtained from the composition of bulk sediments of the Nasura Lake phase (see also Fig. 7). See text for explanations.

Paleohydrologic tracers
The geochemical tracers used to reconstruct paleohydrologic changes in lake sediments are presented in detail in Last and Smol (Reference Last and Smol2006) (see also Yan et al., Reference Yan, Hinderer and Einsele2002; Volkova, Reference Volkova1998). In sedimentary successions, strontium (Sr) is normally associated with carbonate minerals, calcite and aragonite in particular (e.g., Cohen, Reference Cohen2003). Strontium can be associated with feldspar and biotite, but at much lower concentrations than in carbonate minerals. In this context, (Zr + Rb)/(Sr + Ca) reflects the balance between clastic (water runoff) and carbonate (stagnant water) components. This relationship expresses foreshore systems in association with (Zr + Rb)/(Sr + Ca) increases. Manganese (Mn) forms a highly insoluble oxide in oxygen-rich waters and migrates up to bottom river and lake sediments (e.g., Cohen, Reference Cohen2003). Manganese is thus a good proxy indicator of vertical transport of oxygen in the water, reflecting decreasing or increasing biological activity. Manganese precipitation could be interpreted as a result of a turnover, when oxygen becomes mixed along the entire water column. The Mn/Ti ratio expresses lake level rise and bottom water oxygenation by wind (offshore systems). Biogenic silica production is evaluated from an elemental ratio: the total amount of silicon oxide (Si)—that is, clastic to biogenic sources—is normalized by the amount of a lithogenic reference element as a proxy for clastic sources only. Titanium oxide (Ti) is chosen, as it is common and relatively abundant. An increase in the Si/Ti ratio is therefore related to high lake productivity in offshore systems (Peinerud et al., Reference Peinerud, Ingri and Pontér2001). The variations of sodium (Na) in lake sediments can be explained by water runoff and nutrient supply, which is essential for growing biomass in aquatic environments (offshore systems). The excess of sodium in offshore clays is estimated from Na/Ti in comparison with Si/Ti. Zirconium (Zr) is a good proxy indicator of allochthonous siliciclastic inputs (shoreface systems). Zirconium as well as Rubidium (Rb) is common in fluviolacustrine mineral assemblages. Rubidium has its highest concentration in the <2 μm fraction (i.e., clays), whereas Zr is linked to silts and heavy mineral enrichment. In the fine-grained lacustrine sediments, Zr/Rb ratio can therefore be used as a grain size proxy, with lower values representing fine-grained material in lower shoreface systems and higher values representing coarse-grained material in upper shoreface systems. Authigenic calcium (Ca) is very sensitive to thermal changes (e.g., Kelts and Talbot, Reference Kelts and Talbot1990). Calcium carbonate has both allogenic (erosion) and authigenic (photosynthesis) sources. The authigenic production is evaluated from Ca/Rb and Ca/Sr. An increase in the ratio is therefore regarded as indicating increased authigenic carbonate precipitation. This trend is associated with thermal stratification of a water body, low inflows, and/or high evaporation with algae and microbial activities such as cyanobacteria blooms (expansion and proliferation of cyanobacteria toxins in water). In our paleohydrologic context, thermal stratification and evaporation increase refer to endorheic/closed basin conditions, by contrast to exorheic/open basin conditions. Phosphorous (P) is a good proxy indicator of lake water eutrophication (excess of nutrients, algal blooms, and toxic water). Dissolved barium (Ba) with alkalinity in the water column supports the application of Sr/Ba ratios as a proxy for paleoalkalinity and endorheic conditions: barium is an alkaline-earth metal that is found in more than 80 minerals, principally barite (BaSO4; see McGrath et al., Reference McGrath, Davison and Hamilton-Taylor1989).
RESULTS
Age and cyclostratigraphy of Turkana lakes
A total of four lake phases have been dated between 2.4 and ~1.76 Ma (Figs. 2, 3): Kokiselei Lake phase (2.4 to 2.3 Ma), Nasura Lake phase (2.25 to 2.2 Ma), and pre–Lorenyang and Lorenyang Lake phases (2.17 to ~1.76 Ma). Here the “pre–Lorenyang Lake phase” refers to the lake evolution from 2.17 to ~1.95 Ma, whereas “Lorenyang Lake phase” refers to the lake evolution from ~1.95 to ~1.76 Ma only. The Kokiselei Lake phase is exposed within the upper Lokalalei Member; the Nasura Lake phase occurs within the lower Kalochoro Member (Fig. 2). The pre–Lorenyang Lake phase expands within the lower and upper Kalochoro Member, and the Lorenyang Lake phase occupies the upper Kalochoro Member and lower Kaitio Member (Fig. 2). Each of these lake phases is marked by offshore clays interrupted by foreshore sands (Figs. 2, 3).
At the bottom of the stratigraphic record, foreshore sand deposits include the Kokiselei Tuff at 2.4 Ma (Figs. 2, 3). This depositional environment evolves to offshore clays from the Kokiselei Lake phase (2.4 to 2.3 Ma, including the Kalochoro Tuff at 2.33 Ma; Figs. 2, 3). The offshore clays are replaced by foreshore sands at ~2.29 Ma, including the G Tuff at 2.27 Ma (Figs. 2, 3). The foreshore deposits include a flooding surface with pebbles that are overlain by sands with numerous traces of nest-excavating activities of fish (Fig. 5; i.e., trace fossil of Piscichnus; see Feibel, Reference Feibel1987). The fish nests are immediately overlain by a beachface system of sandstone and packstone with dense accumulation of freshwater mollusc shells of various species attributable to washover (Melanoides sp., Bellamya sp., Cleopatra sp.; Fig. 5). This is overlain by offshore clays containing some fish bones (Fig. 5) at 2.25 Ma, forming the beginning of the Nasura Lake phase. These offshore deposits are overlaid by lower and upper shoreface silts with ripples at 2.2–2 Ma from the end of the Nasura Lake phase. This depositional environment rapidly changes from foreshore to backshore deposits enriched in terrestrial mammal fossils (such as hippopotamus and elephant; see also the description of the same level in Harris et al. [Reference Harris, Brown and Leakey1988]) at ~2.18 Ma. Immediately above this surface, the offshore clays from the pre–Lorenyang Lake phase (2.17 to ~1.95 Ma) occur ~25 m above the Kalochoro Tuff and ~45 m above the Kokiselei Tuff; Fig. 3). From 2.17 to ~1.95 Ma, the depositional environments are characterized by low-energy dynamics (offshore muds to shoreface silts; Figs. 2, 5). The same depositional environment continues until 1.87 Ma (KBS Tuff) through the Lorenyang Lake phase. The Lorenyang Lake phase is then characterized by higher-energy dynamics and by an accretion of successive foreshore to backshore deposits from 1.87 to ~1.76 Ma (see section in Nutz et al., Reference Nutz, Schuster, Boës and Rubino2017). This system is overlaid by oncolite-rich silts to fine sands from ~1.76 to 1.72 Ma (including the Olduvai/Matuyama paleomagnetic transition; see Lepre et al., Reference Lepre, Roche, Kent, Harmand, Quinn, Brugal, Texier and Feibel2011). If we consider that the sediments were affected by subsidence since the early Pleistocene, these lake sediments still occur at the level of the outflow sill to the west and the Nile basin (~460 m). The total thickness of the lake sediments above the Kokiselei Tuff suggests that the level of the lake was +100 m above Kokiselei Lake level during the Lorenyang Lake phase (see Fig. 3).
Our data show that from 2.4 to 1.87 Ma, offshore clays occur synchronously with 100 ka insolation maxima and foreshore silts to sands with 100 ka insolation minima (Fig. 6). An asynchronous lake phase is, however, found at 2.17 to ~1.95 Ma (Fig. 6) during a 400 ka insolation minimum. During this asynchronous lake phase, the level of the lake had risen up to +50 m (Fig. 3).
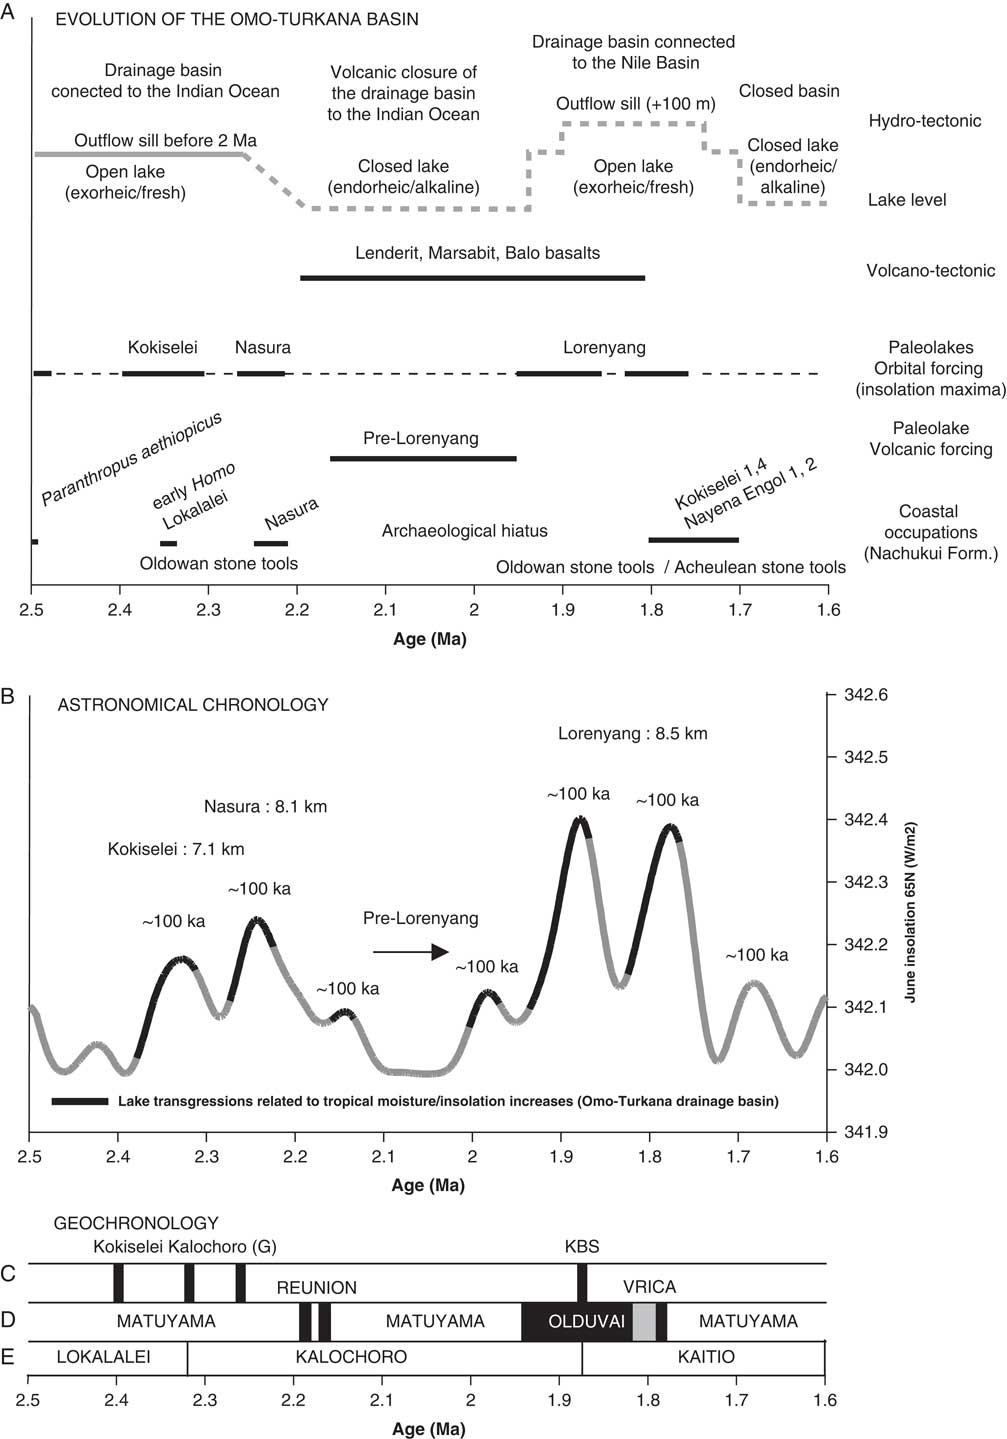
Figure 6. Comparison of different information from 2.5 to 1.6 Ma. (A) Volcano-tectonic evolution of the Omo-Turkana drainage basin (after Bruhn et al., Reference Bruhn, Brown, Gathogo and Haileab2011) and limnological evolution of paleolakes; astronomical and tectonic forcing on the lake phases; coastal occupations (after Walker et al., Reference Walker, Leakey, Harris and Brown1986; Roche et al., Reference Roche, Brugal, Delagnes, Feibel, Harmand, Kibunjia, Prat and Texier2003; Prat et al., Reference Prat, Brugal, Tiercelin, Barrat, Bohn, Delagnes and Harmand2005; Lepre et al., Reference Lepre, Roche, Kent, Harmand, Quinn, Brugal, Texier and Feibel2011) in relation to the insolation cycle. (B) Evolution of the paleolakes in relation to the 100 and 400 ka components of insolation cycle (after Laskar et al., Reference Laskar, Robutel, Joutel, Gastineau, Correia and Levrard2004). We have taken June insolation at 65°N because of the influence of the Northern Hemisphere glaciation on African climate and thermohaline circulation between 3 and 2 Ma (see Gupta and Thomas, Reference Gupta and Thomas2003; see also Raymo et al., Reference Raymo, Hodell and Jansen1992). (C) Argon-argon dated tuffs of the Nachukui Formation (after McDougall et al., Reference McDougall, Brown, Vasconcelos, Cohen, Thiede and Buchanan2012). (D) Magnetostratigraphy of the Nachukui Formation; ages for the Reunion events are placed according to Quidelleur et al. (Reference Quidelleur, Holt, Salvany and Bouquerel2010) and Singer et al. (Reference Singer, Jicha, Condon, Macho, Hoffman, Dierkhising, Brown, Feinberg and Kidane2014). (E) Geologic members of the Nachukui Formation (after Harris et al., Reference Harris, Brown and Leakey1988).
Evolution of lake water
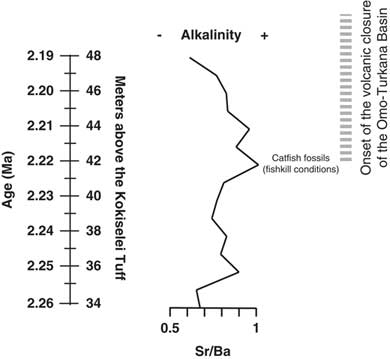
Prior to 2.17 Ma, the paleohydrologic evidence indicates that the lake waters were still well mixed at the beginning of the lake transgression: the (Zr + Rb)/(Sr + Ca) ratio suggests an increase of water runoff from 2.26 to 2.24 Ma (Fig. 7). The Mn/Ti ratio suggests also that the lake waters were still well oxygenated at 2.24–2.23 Ma, during the insolation maximum (Fig. 6). As a consequence, lake productivity probably increased, as water runoff and photosynthesis increased at the same time (Si/Ti, Na/Ti increases). The comparison between Si/Ti and Na/Ti suggests that nutrients increased from 2.24 to 2.22 Ma, still during the insolation maximum (Fig. 6), but lake productivity collapsed after 2.22 Ma, which corresponds with the transition between offshore clays to shoreface silts (Figs. 5, 7). The top of the offshore mud package is overlain by a lower shoreface system composed of silts with typical wind-blown ripples (Fig. 5). The period at 2.22–2.21 Ma is associated with the progradation of an upper shoreface system containing some distinct beds enriched in fish bones (freshwater catfish group; Fig. 5). The upper shoreface silts contain small fish debris beds along bedding planes and gypsum coatings. The sediments show an enrichment of silts versus clay from Zr/Rb ratios (Fig. 7). The water level progressively diminished after 2.21 Ma, as seen from Ca/Rb ratio decreases and Ca/Sr ratio increases (see Fig. 7), illustrating the evolution of the Ca source. From 2.22 to 2.21 Ma, the source of Ca was lake carbonate precipitation in the lower and upper shoreface (Ca/Rb and Ca/Sr increase). After 2.21 Ma, the Ca source changes from lake (upper shoreface) to more terrestrial sources (abiogenic: Ca/Rb decrease and Ca/Sr increase). The precipitated lake carbonate estimated from Ca/Rb ratio suggests that photosynthesis increased from 2.22 to 2.21 Ma in the lower and upper shoreface, and then decreased after 2.21 Ma during lake regression (Fig. 7). Carbonate was less soluble, and thus biogenic carbonate did not precipitate after 2.21 Ma (Fig. 7). Alkalinity increased from 2.22 to 2.21 Ma as suggested from Sr/Ba ratios (Fig. 8), if we consider that the distribution of dissolved barium in the lake water changes with alkalinity. This evolution illustrates the end of the Nasura Lake phase at ~2.2 Ma, which occurred during an insolation minimum centered at 2.17 Ma. After this chronostratigraphic level, P/Ti ratio increased as the lake system was rapidly replaced by a short-lived swamp with mammalian bones at ~2.18 Ma (Fig. 7). Lake waters were probably toxic at that time because of nutrient increase and algal blooms (probably toxic cyanobacteria). The horizon enriched by terrestrial fossils is rapidly replaced by offshore muds at 2.17 Ma (onset of pre–Lorenyang Lake phase).

Figure 7. Evolution of lake depth reconstructed from geochemical tracers and evolution of the depositional environments from 2.26 to 2.19 Ma, including paleolimnological/thermal evolution of the Nasura Lake phase, concomitant to volcanic closure of the Omo-Turkana drainage basin.
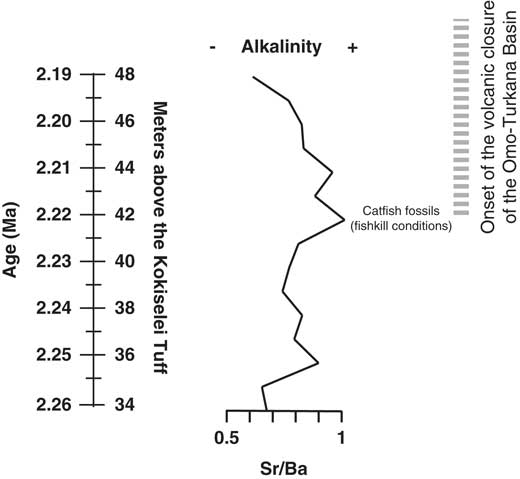
Figure 8. Evolution of the Nasura Lake phase during tectonic closure of the Turkana drainage connection to the Indian Ocean. Alkalinity and water turbulence are estimated from Sr/Ba ratio.
DISCUSSION
Monsoonal and astronomical forcing on Turkana lakes
Although located in the arid Turkana depression, Lake Turkana is supported by the monsoon rains in Omo River highlands (Joordens et al., Reference Joordens, Vonhof, Feibel, Lourens, Dupont-Nivet, van der Lubbe, Sier, Davies and Kroon2011). The contribution of the East African monsoon is caused by the zonal advection of Indian Ocean–derived moisture to the Ethiopian highlands (Camberlin, Reference Camberlin1997). The East African monsoon rains reflect the northward movement of the Intertropical Convergence Zone over East Africa (see, e.g., Nicholson, Reference Nicholson1996, Reference Nicholson2009). The “long rains” reach a northward limit in summer coeval with a maximum discharge from the Omo River (Bloszies and Forman, Reference Bloszies and Forman2015). On the astronomical time scale, changes in eccentricity, insolation, and precession cycles control the strength of vapor transport and monsoons (Merlis et al., Reference Merlis, Schneider, Bordoni and Eisenman2013). In the tropical highlands/forests, the summer monsoonal moisture increases during eccentricity/insolation maxima (Rossignol-Strick, Reference Rossignol-Strick1983). In addition, with the initiation of Northern Hemisphere glaciation paced by 100 ka eccentricity/insolation cycles (Lisiecki, Reference Lisiecki2010; Abe-Ouchi et al., Reference Abe-Ouchi, Saito, Kawamura, Raymo, Okuno, Takahashi and Blatter2013), monsoonal climate was controlled by the development of cold glacial North Atlantic sea surface temperature (see deMenocal, Reference deMenocal1995). Thus, the East African monsoons increased in duration and strength during the early Pleistocene (Gupta et al., Reference Gupta, Dhingra, Mélice and Anderson2001; Gupta and Thomas, Reference Gupta and Thomas2003; see also Raymo et al. [Reference Raymo, Hodell and Jansen1992] for the influence of thermohaline circulation between 3 and 2 Ma).
Influence of insolation on lake level changes
As suggested by our data, the insolation cycle plays a role in lake level changes and coastal geomorphology in the Turkana basin (see also Nutz et al. [Reference Nutz, Schuster, Boës and Rubino2017] for similar observation in the Turkana basin, Kingston et al. [Reference Kingston, Deino, Edgar and Hill2007] in the Baringo basin, and Ashley [Reference Ashley2007] in the Olduvai basin). Turkana paleolake levels should increase during higher monsoonal inflows from the Omo River every 100 ka insolation/eccentricity maximum (Figs. 6, 9). In our record, Turkana paleolake levels indeed appear to rise in response to the 100 and 400 ka components of the insolation/eccentricity maxima cycle (Figs. 6, 9). At the bottom of our record, the Kokiselei and Nasura Lake phases can be explained by the increase in monsoonal moisture available in the tropical Ethiopian highlands during the 100 and 400 ka component of the cycle centered at 2.24 Ma (Figs. 6, 9). However, from 2.17 to ~1.95 Ma, the pre–Lorenyang Lake phase expands during a 400 ka insolation minimum centered at 2.0 Ma (Figs. 6, 9), and the depositional environments evolve rapidly toward offshore system (+50 m of lacustrine muds; Fig. 3). This main paleolake phase is not in good synchronicity with insolation/eccentricity forcing and hydroclimatic context, implying that a different factor was involved–namely, volcanism.
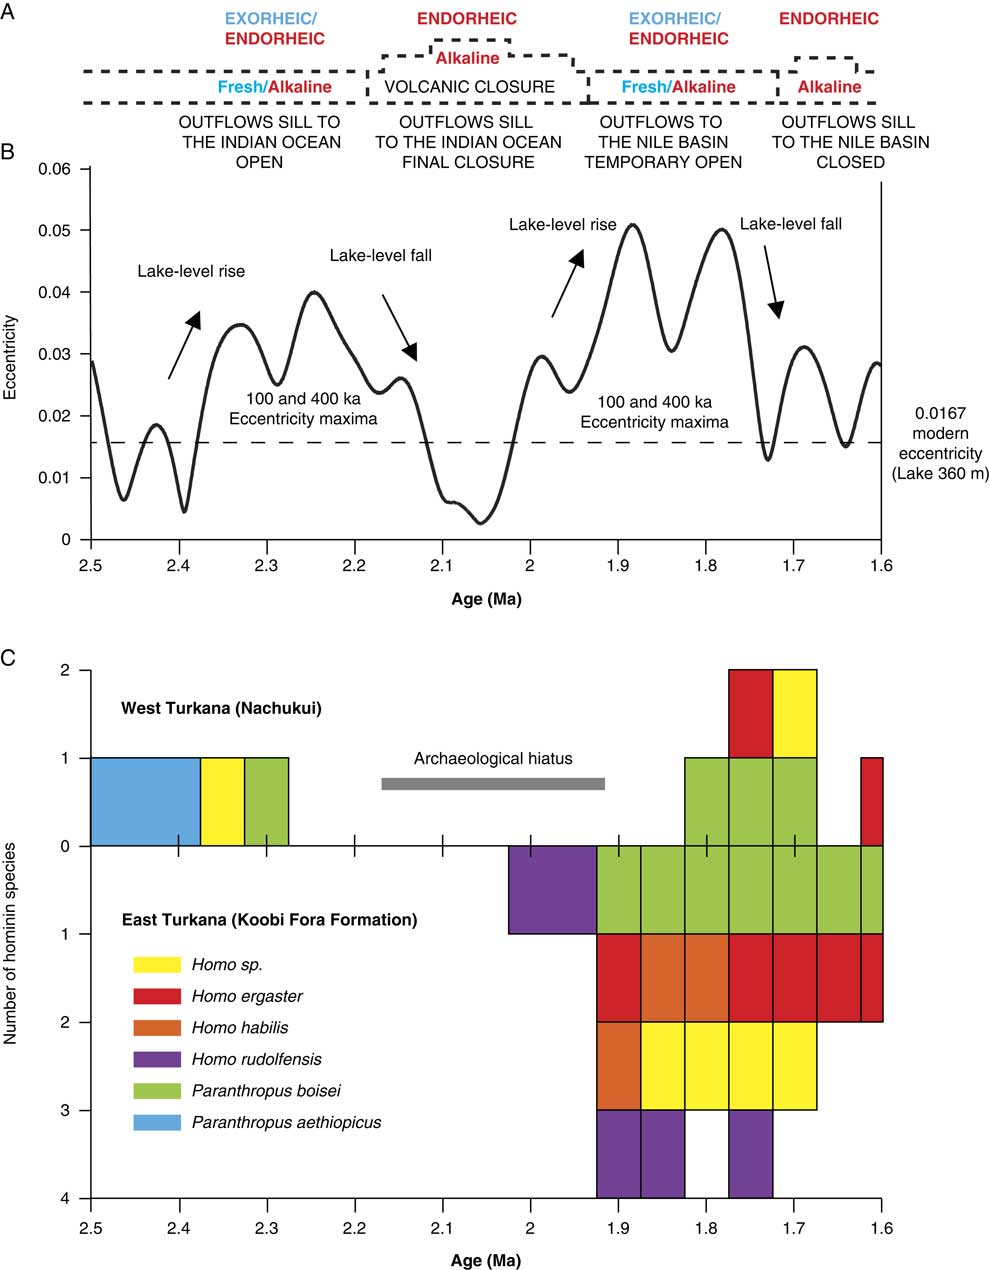
Figure 9. (color online) Comparison of the hydrovolcanic-tectonic evolution of the Turkana basin, the eccentricity cycles, and hominin occurrences between 2.5 and 1.6 Ma. (A) Evolution of Lake Turkana water and limnology. (B) Earth’s eccentricity cycles (after Laskar et al., Reference Laskar, Robutel, Joutel, Gastineau, Correia and Levrard2004). (C) Number of hominin species found in the Nachukui Formation and in the Koobi Fora Formation from 2.5 to 1.6 Ma (specimens allocated to hominin indet. were not included).
Influence of volcanism
Volcanism has reorganized the course of the Omo River from the Ethiopian highlands through Turkana to either the Mediterranean Sea or the Indian Ocean, greatly modulating paleolake responses to astronomical forcing factors during the early Pleistocene (Watkins, Reference Watkins1986; Haileab et al., Reference Haileab, Brown, McDougall and Gathogo2004; Gathogo et al., Reference Gathogo, Brown and McDougall2008; Opdyke et al., Reference Opdyke, Kent, Huang, Foster and Patel2010; Bruhn et al., Reference Bruhn, Brown, Gathogo and Haileab2011). From 2.2 to 1.8 Ma, different channel outlets were cut off by the eruptions of the Lenderit (2.2–2 Ma), Marsabit (2.0–1.8 Ma), and Balo (1.8 Ma) lava flows at the south end of the Turkana rift segment (Bruhn et al., Reference Bruhn, Brown, Gathogo and Haileab2011). These volcanic events progressively caused the closure of the Omo-Turkana outflow sill to the Indian Ocean and may therefore be responsible for the pre–Lorenyang Lake phase (Figs. 6, 9). During these eruptions, Paleolake Turkana probably alternated from endorheic/alkaline to exorheic/freshwater because several river outflows were successively connected and disconnected with the Indian Ocean by lavas. Exorheic conditions returned during the insolation/eccentricity maxima at 1.9 to 1.8 Ma, as the lake rose up to +100 m above the closed outflow to the east and a new outflow sill temporary opened toward the west and the Mediterranean Sea. Stable isotope records (δ18O and δ13C) of fossil bivalve shells confirm that Lake Turkana was temporarily exorheic/fresh around 1.9 Ma (Lorenyang and G Tuff level; Vonhof et al., Reference Vonhof, Joordens, Noback, van der Lubbe, Feibel and Kroon2013). After 1.7 Ma, this outflow sill was closed by the lake level fall, and the outflow sill to the Indian Ocean was blocked by Lenderit, Marsabit, and Balo basalts. Thus, Lake Turkana became more permanently endorheic since these volcanic events that transformed the evolution of the drainage basin during the early Pleistocene. Our reconstruction echoes the interpretations from Bruhn et al. (Reference Bruhn, Brown, Gathogo and Haileab2011) and Lepre (Reference Lepre2014), which suggested a nonclimatic origin for the onset of the pre–Lorenyang lake phase in the Turkana basin.
Lake water evolution following volcanic closure of the Omo River outflows to the Indian Ocean
In central Kenya, Bergner et al. (Reference Bergner, Strecker, Trauth, Deino, Gasse, Blisniuk and Duehnforth2009) have suggested that rift lakes evolve toward freshwater ecosystems during humid–high lake phases and revert back to alkaline conditions during arid–low lake phases. In Turkana, volcanism probably played also a role in lake level evolution and paleoalkalinity. In our paleochemical record (Figs. 7, 8), the Sr/Ba ratio suggests that paleolakes evolved toward more alkaline conditions at the end of the Nasura Lake phase, which could be attributable to the onset of hydrovolcanic closure of the Omo-Turkana basin. Our data suggest that Paleolake Turkana had alkalinity increase around 2.22–2.21 Ma, where more dense fish debris beds are found in the upper shoreface. Two main mechanisms can be proposed for the occurrence of these dense fish debris beds. Methane-producing bacteria in lake-floor sediments may generate excess methane gas in the lake waters if the production rate is higher than the diffusion rate in the uppermost layers (Caliro et al., Reference Caliro, Chiodini, Izzo, Minopoli, Signorini, Avino and Granieri2008). This interpretation would be consistent with temperature increase, high microbial photosynthesis activity during the day, and abrupt oxygen depletion during the night. The fish debris beds could therefore be interpreted as mass fish die-off events explained by critical limnological conditions for the fish: a negative oxygen balance between day and night or alkalinity increase (Tilapia can survive with alkalinity of 40 meq/L, but less adaptable fish are absent). According to Cerling (Reference Cerling1979), concentration of consistently small-size fish remains may indicate high salinities and alkalinities that exceeded 40 meq/L. Thus, alkalinity increase would explain the accumulation of fish debris within wind-driven beds formed within the shoreface. Another hypothesis is that the fish debris beds were caused by an overturn of the water column and hydrogen sulfide saturation during a major underwater disturbance (i.e., an earthquake or volcanic eruption) as has been observed in modern lakes (Caliro et al., Reference Caliro, Chiodini, Izzo, Minopoli, Signorini, Avino and Granieri2008).
The paleochemical range of the ostracods (Cohen, Reference Cohen1981) also shows that alkalinity increased during the closure of the drainage connection to the Indian Ocean (see also Abell [Reference Abell1982] for alkalinity fluctuations during the same interval). Comparatively, freshwater malacofauna and paleochemistry of Lake Turkana suggest that paleolakes were fresh during the late Pliocene with an alkalinity range from 2 to 8 meq/L (Cerling, Reference Cerling1979; Bocxlaer et al., Reference Bocxlaer, Damme and Feibel2008; Bocxlaer, Reference Bocxlaer2011). According to Cerling (Reference Cerling1979), freshwater molluscs could survive in East African waters with an alkalinity range of about 0.5 to 15 meq/L. In Lake Turkana, freshwater mollusc extinction occurs at an alkalinity of ~16 meq/L (Abell, Reference Abell1982). In East Turkana, freshwater molluscan assemblages (Williamson, Reference Williamson1982; Bocxlaer et al., Reference Bocxlaer, Damme and Feibel2008) gradually impoverish upward in the Okote Member, which is equivalent to the Natoo Member (1.6–1.3 Ma) in West Turkana. Fossils of endemic freshwater stingrays (Dasyatidae) found within the Turkana basin suggest that freshwater conditions persisted until ~1.6 Ma (see Feibel, Reference Feibel1994).
Implications for hominin coastal occupations
Most of the archaeological sites and terrestrial fossils (including hominins) are trapped within lake margin deposits formed during 100 ka insolation/eccentricity maxima and fresh–high lake phases (Figs. 6, 9). For example, the 2.34 Ma archaeological complex of Lokalalei (Roche et al., Reference Roche, Delagnes, Brugal, Feibel, Kibunjia, Mourre and Texier1999) is located within the lower Kalochoro Member, during a 100 ka cycle of insolation maximum centered at 2.33 Ma. Most of the Lokalalei sites are found above the 2.34 Ma Ekalalei Tuff (Kibunjia et al., Reference Kibunjia, Roche, Brown and Leakey1992; Kibunjia, Reference Kibunjia1994; Roche et al., Reference Roche, Delagnes, Brugal, Feibel, Kibunjia, Mourre and Texier1999; Prat et al., Reference Prat, Brugal, Tiercelin, Barrat, Bohn, Delagnes and Harmand2005; Tiercelin et al., Reference Tiercelin, Schuster, Roche, Brugal, Thuo, Prat, Harmand, Gourguen, Barrat and Bohn2010). The archaeological sites of Kokiselei 4 (1.76 Ma; Lepre et al., Reference Lepre, Roche, Kent, Harmand, Quinn, Brugal, Texier and Feibel2011), Kokiselei 1 (1.79–1.69 Ma; Prat et al., Reference Prat, Brugal, Roche and Texier2003; Roche et al., Reference Roche, Brugal, Delagnes, Feibel, Harmand, Kibunjia, Prat and Texier2003), Naiyena Engol 1 (1.75 Ma; Prat et al., Reference Prat, Brugal, Roche and Texier2003; Roche et al., Reference Roche, Brugal, Delagnes, Feibel, Harmand, Kibunjia, Prat and Texier2003) and 2 (1.8–1.7 Ma; Roche et al., Reference Roche, de la Torre, Arroyo, Brugal and Harmand2018) occur during fresh–high lake phases related to the insolation maximum centered at 1.77 Ma and transition toward the beginning of an insolation minimum.
Before ~2.17 Ma, freshwater lakes driven by insolation maxima were not necessarily high in elevation, because the outflow sill to the Indian Ocean was ~100 m lower than the outflow sill to the Nile basin. Although not necessarily high, lakes that outflowed to the Indian Ocean were exorheic and fresh. After ~2.17 Ma, freshwater lakes driven by insolation maxima had to rose up to +100 m above the closed outflow sill to the Indian Ocean, so they potentially reached the outflow sill to the Nile basin (Figs. 2, 3, 6, 9). In this context, archaeological sites occur during exorheic/freshwater lake phases driven by insolation maxima. Comparatively, periods of insolation minima are associated with hydrologic conditions that were more endorheic/alkaline with “archaeologically sterile” sediments (Fig 6).
In the Nachukui Formation, researchers noted the presence of an archaeological hiatus initially evaluated between 2.3 and 1.8 Ma (Roche et al., Reference Roche, Brugal, Delagnes, Feibel, Harmand, Kibunjia, Prat and Texier2003). The hiatus is now reduced to the period 2.17–1.8 Ma thanks to the discovery of new archaeological sites by the WTAP (Harmand et al., manuscript in preparation). This archaeological hiatus coincides with hydrovolcanic closure of the basin and the development of the endorheic pre–Lorenyang Lake phase (Figs. 6, 9). During the ~2.2–1.95 Ma period of insolation minimum (Fig. 6), the lake margins may not have contained as many suitable onshore environments as during insolation maxima. From 2.17 to ~1.95 Ma, Lake Turkana expanded but had no outflows and was endorheic/alkaline and not exorheic/fresh. The hydrologic conditions were probably not as suitable for hominin occupations as when the lake was exorheic/fresh. This is suggested by the temporal distribution of coastal archaeological sites and hominin occupations around the lake (Figs. 6, 9). No archaeological sites are found through the pre–Loreyang Lake phase (Fig. 6). Hominin occupations are found again from ~1.8 to 1.7 Ma, during insolation/eccentricity maxima, as freshwater/exorheic conditions were temporary restored by lake level rise up to the outflow sill to the west and the Mediterranean Sea.
CONCLUSIONS
Today, the Turkana basin is home to the largest endorheic alkaline-saline lake in an arid environment on Earth. This terminal lake is supplied by the Omo River, and its water level (360 m asl) is in equilibrium with evaporation output. The particularity of Lake Turkana is that over its long-term evolution, the lake alternated from exorheic to endorheic conditions because of volcanic and astronomical forcings, with strong implications for lake water chemistry. Before the early Pleistocene, Lake Turkana outflowed to the east and the Indian Ocean and was exhoreic/open/fresh. Following volcanic closure of the outflow sill to the east in the early Pleistocene (Lenderit, Marsabit, and Balo eruptions from 2.2 to 1.8 Ma), the lake became endorheic/closed/alkaline during periods of insolation/eccentricity minima (low lake levels), like present-day conditions. However, during periods of insolation/eccentricity maxima (high lake levels), the lake became potentially exorheic/fresh when the overflow sill to the west and the Mediterranean Sea was reached (+100 m above the closed outflow sill to the Indian Ocean). Thus, lake levels changed following the reorganization of the drainage basin in the early Pleistocene, and this should not be interpreted in terms of extreme climate change.
Our study shows that from 2.4 to 2.17 Ma, hominin coastal occupations occur within the lake margin deposits related to insolation/eccentricity maxima and exorheic/freshwater conditions. An archaeological hiatus occurs during insolation/eccentricity minimum from 2.17 to 1.9 Ma, which is concomitant to endorheic/alkaline conditions caused by volcanic closure of the Omo-Turkana drainage basin. Hominin occupations are found again during insolation/eccentricity maximum from 1.8 to 1.7 Ma, as freshwater/exorheic conditions were temporary restored by lake level rise up to the outflow sill to the Mediterranean Sea. In the Turkana basin, the role of volcanism appears to have modulated the role of astronomical forcing on lake level changes. The reorganization of the Omo-Turkana drainage basin during the early Pleistocene seems to have had broad implications for the occupation of the basin by hominins, although no extreme humid-arid climate shifts are involved as previously thought.
ACKNOWLEDGMENTS
This research is based on successive fieldwork with the Mission Préhistorique au Kenya–West Turkana Archaeological Project (MPK-WTAP) in the Turkana basin between 2010 and 2016. We thank the Office of the President of Kenya; the Ministry of Education, Science and Technology of the Republic of Kenya; the National Council for Science and Technology (NCST/RCD/12B/012/25); and the National Museums of Kenya for permission to conduct research in the field. This research was funded by the Agence Nationale de la Recherche (ANR-12-CULT-0006), by the Ministère des Affaires Etrangères (Direction générale de la mondialisation, du développement et des partenariats, N°681/DGM/ATT/RECH, N°986/DGM/DPR/PRG), by the LSB Leakey Foundation, by OASIC/AAP2017-UMI-CNRS-France (Project MobHom), and by S. Para (NTM INDIGO-France). We are particularly grateful to H. Roche who has encouraged this research since the beginning. We thank S. Jeremie, K. Salas Rossenbach, S. Nourissat, and D. Pelletier for their support at INRAP. We also thank F. Brown, M. Schuster, A. Nutz, and C. Lepre for interactive discussions in the field. We thank N. Taylor, S. Clement, M. Brenet, S. Lokorodi, and the 2010–2016 MPK-WTAP team members for assistance in Turkana. We thank D. Booth, T. Faith, and the anonymous reviewers for their constructive comments, which helped to improve the manuscript. This work is dedicated to F. Brown (1943–2017) and Jean-Jacques Tiercelin (1949–2017).