INTRODUCTION
Historically, fluvial and eolian processes in dryland environments have been regarded as mutually exclusive, with the claim that eolian and fluvial processes were dominant during dry and humid phases, respectively (Bullard and Livingstone, Reference Bullard and Livingstone2002). Over the past few decades, there has been a rising interest in the interactions between eolian and fluvial processes among geomorphologists, sedimentologists, and ecologists (e.g., Bohncke et al., Reference Bohncke, Vandenberghe and Huijzer1993, Reference Bohncke, Kasse and Vandenberghe1995; Bullard and McTainsh, Reference Bullard and McTainsh2003; Field et al., Reference Field, Breshears and Whicker2009; Ravi et al., Reference Ravi, Breshears, Huxman and D’Odorico2010; Belnap et al., Reference Belnap, Munson and Field2011; Habeck-Fardy and Nanson, Reference Habeck-Fardy and Nanson2014). The interactions of fluvial and eolian processes are now widely accepted to have been important in dryland environments (e.g., Fitzsimmons et al., Reference Fitzsimmons, Rhodes, Magee and Barrows2007, Reference Fitzsimmons, Miller, Spooner and Magee2012; Belnap et al., Reference Belnap, Munson and Field2011; Habeck-Fardy and Nanson, Reference Habeck-Fardy and Nanson2014) and are also typical of cold climates (e.g., in Europe, Iceland) (e.g., Bohncke et al., Reference Bohncke, Vandenberghe and Huijzer1993; Van Huissteden et al., Reference Van Huissteden, Vandenberghe, Van der Hammen and Laan2000; Vandenberghe et al., Reference Vandenberghe, Derese, Kasse and Van den haute2013; Zielinski et al., Reference Zielinski, Sokołowski, Woronko and Fedorowicz2016); these interactions can significantly change Earth surface morphology (Liu and Coulthard, Reference Liu and Coulthard2015; Martin, Reference Martin2015). Rivers can provide sand and space for dune development, and vice versa, eolian activity can modify fluvial-process dynamics and landform generation (e.g., Ellwein et al., Reference Ellwein, Mahan and McFadden2015; Rittner et al., Reference Rittner, Vermeesch, Carter, Bird, Stevens, Garzanti, Vezzoli, Dutt, Xu and Lu2016). Eolian sand supply can increase the sediment load of a river, leading to changes in channel pattern (such as a change from meandering to a braided style) (Huisink, Reference Huisink2000) and even to diversion and damming of rivers (Mason et al., Reference Mason, Swinehart and Loope1997), channel avulsion (McIntosh, Reference McIntosh1983; Jacobberger, Reference Jacobberger1988; Jones and Blakey, Reference Jones and Blakey1997; Bourke and Pickup, Reference Bourke and Pickup1999), and bifurcation (Tooth, Reference Tooth1999). Such interactions, in turn, may depend on climatic factors, and their implications are not necessarily spatially confined and may have global significance (Bullard and McTainsh, Reference Bullard and McTainsh2003). However, linking the interactions of eolian and fluvial activity to particular climatic conditions is often not straightforward (e.g., Kocurek and Lancaster, Reference Kocurek and Lancaster1999). For example, it has been demonstrated that in the central deserts of Australia, dunes have been formed by sands supplied from rivers during wetter (albeit strongly seasonal) periods, whereas other dunes have had their sands reworked during arid periods (Fitzsimmons et al., Reference Fitzsimmons, Rhodes, Magee and Barrows2007; Cohen et al., Reference Cohen, Nanson, Larsen, Jones, Price, Coleman and Pietsch2010; Habeck-Fardy and Nanson, Reference Habeck-Fardy and Nanson2014).
Studies of fluvial landscapes, such as terrace formation in China, especially in the areas of the Tibetan Plateau, have focused on fluvial response to tectonic and climatic changes (e.g., Yang et al., Reference Yang, Zhu, Jaekel, Owen and Han2002; Lu et al., Reference Lu, Wang, An, Tan, Zhu, Ma, Li, Miao and Wang2004; Owen et al., Reference Owen, Finkel, Ma and Barnard2006; Miao et al., Reference Miao, Lu, Li and Cao2008; Pan et al., Reference Pan, Su, Hu, Hu, Gao, Li and Kirby2009; Vandenberghe et al., Reference Vandenberghe, Wang and Lu2011; Wang et al., Reference Wang, Lu, Vandenberghe, Zheng and Van Balen2012, Reference Wang, Vandenberghe, Yi, Vandenberghe, Lu, Van Balen and Van den Haute2013, Reference Wang, Van Balen, Yi, Vandenberghe and Lu2014, Reference Wang, Vandenberghe, Yi, Van Balen and Lu2015a; Hu et al., Reference Hu, Pan, Bridgland, Vandenberghe, Guo, Fan and Westaway2017; Jia et al., Reference Jia, Hu, Wu, Zhao, Chang, You and Zhang2017) or climate-related paleofloods (e.g., Huang et al., Reference Huang, Pang, Zha, Su, Jia and Zhu2007; Hu et al., Reference Hu, Huang, Zhou, Pang, Zha, Guo, Zhang and Zhao2016; Zhao et al., Reference Zhao, Wang, Wei, Lai, Fan, Zhao, Pan, Zhao, Li and Zhao2017). In the dryland area of northwestern China, the interaction of the fluvial and eolian processes is quite common at present (Fig. 1; Yan et al., Reference Yan, Li, Ma, Wu and Qian2015; Han et al., Reference Han, Zhang, You, Wang, Yang, Yang, Zhou, Yuan, Zou and Cheng2016; Wang and Ta, Reference Wang and Ta2016). For instance, the channels of the Yellow River are diverted and deflected by sand dunes in the Ningxia–Inner Mongolia reach (Yan et al., Reference Yan, Li, Ma, Wu and Qian2015). However, relating eolian–fluvial interactions to climate changes requires past geologic case studies. Hitherto there have been almost no records of past interactions of fluvial and eolian processes as a function of climatic changes in these semiarid environments. Here, we discuss the sediment records of past eolian–fluvial interactions from the last glacial period and Holocene, located south of the Tengger Desert at the northern margin of the Southeast Asian summer monsoon (Fig. 1). The response of the evolution of fluvial and eolian sediment processes to regional (monsoon) climate change is discussed, based on structural interpretation of sediment logs, sediment grain-size analysis, and optically stimulated luminescence (OSL) ages.

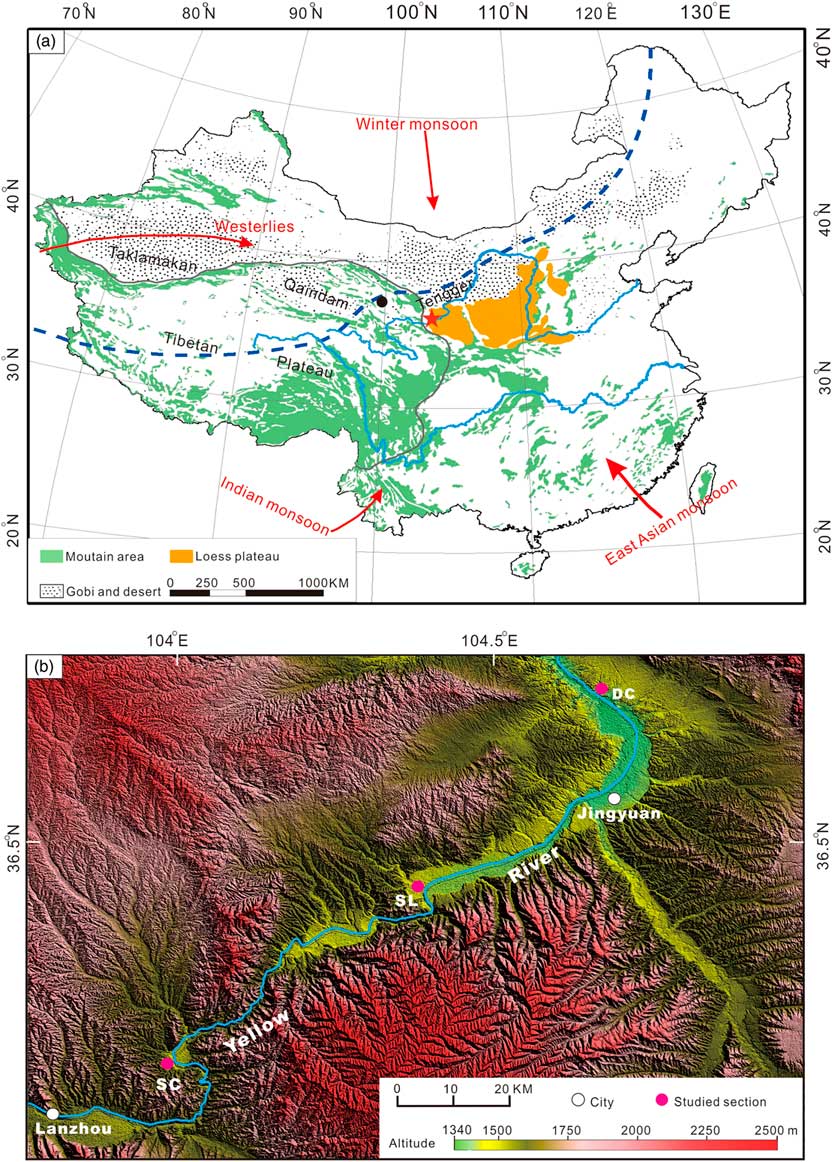
Figure 1. (a) Geographic setting of study area (star) and regional atmospheric circulation patterns (after Shen et al., Reference Shen, Liu, Wang and Matsumoto2005; Long et al., Reference Long, Fuchs, Yang and Cheng2016). The black dot shows the location of Qinghai Lake. The blue dashed line is the northern limit of the modern summer monsoon. The green shading represents mountains. (b) The location of the study sections and the morphological features of the study area. The Yellow Rover (Huang He) flows through a series of gorges and depressions with wide terrace surfaces in the depressions. (For interpretation of the references to color in this figure legend, the reader is referred to the web version of this article.)
GEOGRAPHIC SETTING
The study area is located around Jingyuan, at the northern limit of the Southeast Asian summer monsoon, where the climate is semiarid, possibly sensitive to both the Asian monsoon and the westerly jet stream (Fig. 1a) (Shen et al., Reference Shen, Liu, Wang and Matsumoto2005; Vandenberghe et al., Reference Vandenberghe, Renssen, van Huissteden, Nugteren, Konert, Lu, Dodonov and Buylaert2006; An et al., Reference An, Colman, Zhou, Li, Brown, Timolthy and Cai2012). This area is ~140 km south of the Tengger Desert. The mean annual temperature and precipitation in this region are 6–9°C and 180–450 mm, respectively, and the mean annual evaporation may reach up to ~1500 mm. Precipitation falls mainly in summer, caused by invasions of the Asian summer monsoon. In winter, the climate of this region is controlled by the winter monsoon, with strong winds in cold and dry conditions. This is also typical of the Pleistocene climate situation in this area.
The altitude of the study area is between 1390 and 2400 meters above sea level (m asl). Originating in the northeast Tibetan Plateau, where the average altitude is about 4000 m asl, the Yellow River (Huang He) flows southwest to northeast through this area in a series of successive morphologically small gorges and depressions (Fig. 1b). In this area, the Yellow River has incised into a basin filling comprising sedimentary successions representing playa to fluviolacustrine environments, thus forming well-shaped terrace staircases, consisting of at least seven individual levels (clearly distinguished by their elevation) since around 1.24 Ma (Pan et al., Reference Pan, Su, Hu, Hu, Gao, Li and Kirby2009). In depressions, terrace stairs of the Yellow River are well developed and covered by a few tens of meters of loess (Fig. 1b). In this study, three sediment sequences that represent three different terraces, located at different altitudes, are described from Doucheng (DC; 36°44.4'N, 104°40.8'E), Silong (SL; 36°25.8'N, 104°23.4'E), and Shichuan (SC; 36°9.0'N, 103°59.4'E).
METHODS
Fieldwork
In the field, the sedimentary facies of the fluvial and eolian units were described in detail in the three typical terrace sediment sections (SC, SL, and DC). Their sedimentary structures and dimensions were documented using lithofacies characteristics according to Miall (Reference Miall1996). Twenty-two samples from different units were taken for grain-size measurement in order to interpret and distinguish different sedimentary environments, together with 14 samples for OSL dating, in order to build a chronological framework for the different sedimentary environments.
Grain-size measurements
Grain-size samples were prepared following a well-established procedure in order to ensure complete disaggregation of the individual grains. A few grams of bulk sediment were pretreated with H2O2 and HCl to remove organic matter and carbonates, respectively, largely according to the preparation method described by Konert and Vandenberghe (Reference Konert and Vandenberghe1997). This ensures that the results reflect the grain-size distribution of the siliciclastic fraction. The purified samples were then measured using a Malvern master-size laser particle analyzer, which resulted in a grain-size distribution with 100 size classes in the size range 0.025–2000 μm. The grain-size distribution is primarily characterized by the modal value(s), sand and clay content, and, occasionally, the sorting.
OSL dating
Sediment samples for OSL dating were collected by hammering light-tight tubes into freshly exposed sediments. Fine sand-sized (63–90 µm) quartz grains were extracted from the inner material of the sampling tubes in the standard manner (10% HCl, 30% H2O2, wet sieving, 40% HF). All samples were analyzed using large aliquots (about 5 mm diameter). Luminescence measurements were made using automated Risø-readers equipped with blue (470±30 nm) LEDs and an IR laser diode (830 nm). The luminescence emissions were detected through a 7.5 mm Hoya U-340 UV filter.
A single-aliquot regenerative-dose (SAR) protocol (Murray and Wintle, Reference Murray and Wintle2000) was used to determine the equivalent dose (D e ). Preheating of natural and regenerative doses was for 10 s at 240°C, and the response to the test dose was measured after a cut-heat to 200°C. Optical stimulation with the blue diodes was for 40 s at 125°C. The initial 0.32 s of the decay curve was used in the calculations, minus a background derived from the following 0.64 s. After measuring the response to the test dose, a high-temperature bleach was performed by stimulating with the blue diodes for 40 s at 280°C (Murray and Wintle, Reference Murray and Wintle2000). For each aliquot, the dose response was obtained by measuring the response to four regenerative doses. This was followed by three additional measurements to obtain estimates of recuperation and recycling (Murray and Wintle, Reference Murray and Wintle2000) and purity (OSL IR depletion ratio; Duller, Reference Duller2003).
The material from the outer ends of the sampling tubes was retained for radioisotope and water-content analysis. A subsample of ~20 g dried sediment was ground to a fine powder to determine concentrations of U, Th, and K by neutron activation analysis. The elemental concentrations were converted into external beta and gamma dose rates using the conversion factors of Adamiec and Aitken (Reference Adamiec and Aitken1998) and beta attenuation factors of Mejdahl (Reference Mejdahl1979). The water content may have varied over the entire burial period of the samples, but it is difficult to determine the degree of such changes; we have assumed 50% of the saturation water content as representative for the time-averaged degree of wetness and assigned a relative uncertainty of 25% to this value to allow for possible fluctuations. An internal dose rate in quartz grains of 0.013 ± 0.003 Gy/ka was assumed (based on Vandenberghe et al., Reference Vandenberghe, De Corte, Buylaert, Kučera and Van den haute2008), although most OSL dating studies do not apply a dose for internal dose in quartz, and the contribution from cosmic rays was calculated following Prescott and Hutton (Reference Prescott and Hutton1994).
RESULTS
Description of the three typical sections and grain-size analyses
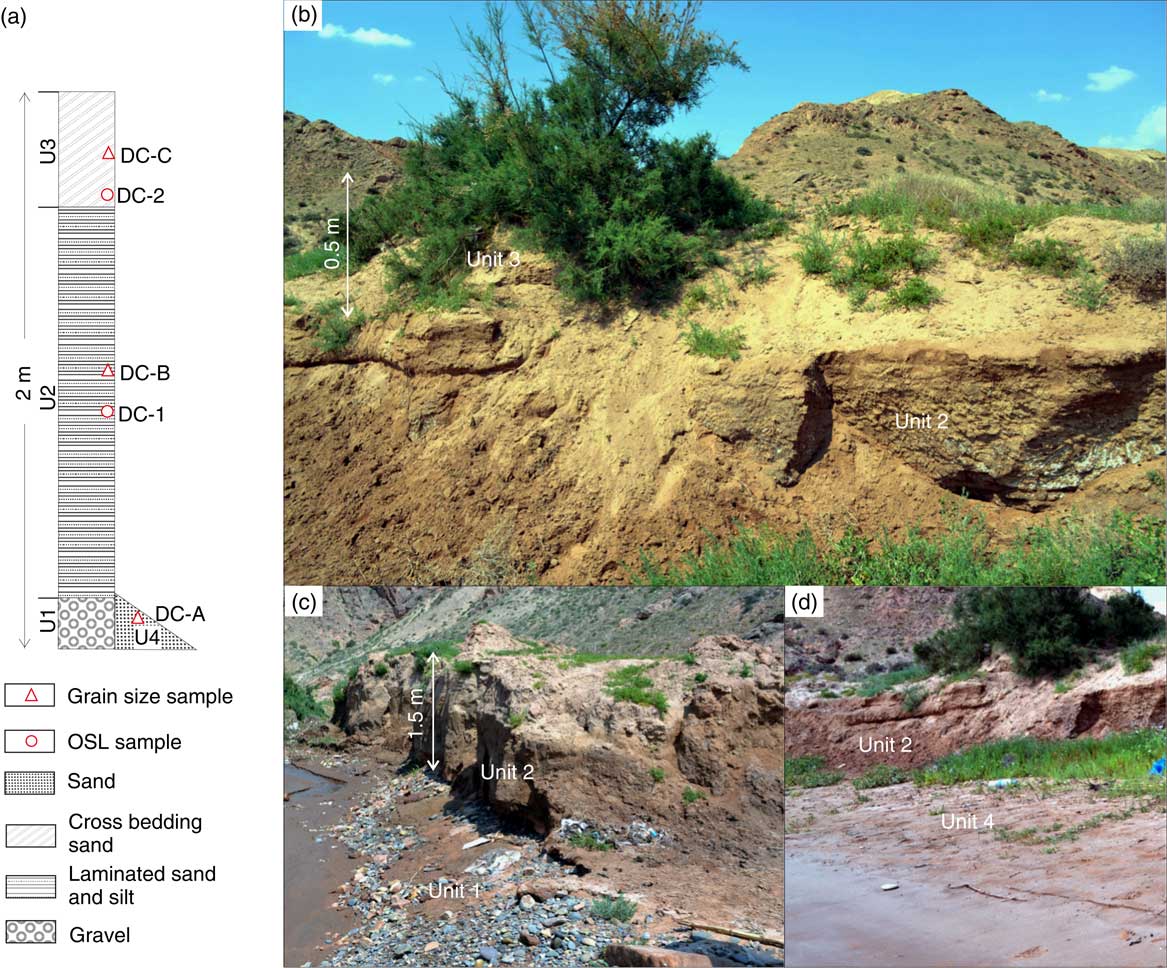
The DC section coincides with a terrace about 2 m above the present floodplain (apf) of the Yellow River, and it is overlain by small rolling dunes about 0.5 m high. The sediment series of the terrace is composed of four units (Fig. 2). The basal (first) unit (U1) is ~0.5 m thick and composed of well-rounded gravels (Gp) (base not exposed) (Fig. 2c). The second (middle) unit (U2), at a depth of 0.5–2.0 m, is a laminar-bedded silty sand (Sh). The uppermost (third) unit (U3), at 0–0.5 m depth, is dune sand, characterized by steep planar cross bedding (Fig. 2b). Additionally, 1 m of fine-grained, mica-bearing sand (U4) covers the basal unit (terrace gravel) and parts of the second unit (Fig. 2a and d) and grades, with a steep angle, to the present channel of the Yellow River. It represents the high-flood stage deposits of the modern river. The first and second units form an integrated fining-upward fluvial sequence, composed of channel gravel deposits (basal unit) covered by fine-grained overbank sand and silt accreted at waning flow. Two OSL samples, DC-1 from the laminated sand and silt (U2) and DC-2 from the upper dune (U3), were taken from this section (Fig. 2a).

Figure 2. (color online) Sediment sequences of the Doucheng (DC) section (units 1, 2, and 3). (a) Stratigraphic column and location of samples. (b) Sediment unit 3, sand dune with steep cross bedding; sediment unit 2, laminar fine sand and silt. (c) Sediment units 2 and 1 (planar cross-bedded gravel). (d) Sediment units 2 and 4, fine to medium sand dipping to the river channel. OSL, optically stimulated luminescence.
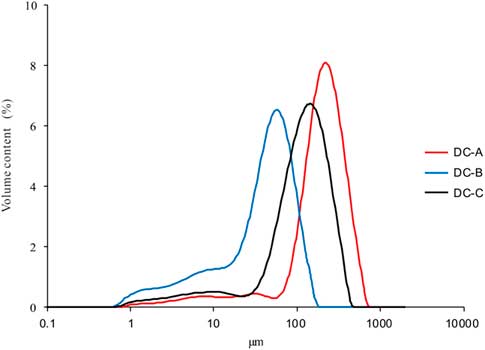
To characterize and interpret the different sedimentary environments (eolian and overbank sediments), the grain-size distribution of the sediment units of the DC section (DC-A, DC-B, and DC-C from units 4, 2, and 3, respectively) has been analyzed. DC-A, from the modern flood sediment (U4), is well-sorted, fine-to-medium sand almost without clay and silt, with a modal value of 220 µm (Fig. 3). DC-B, from the overbank sediment on top of the terrace gravel (U2), is mainly composed of coarse silt and very fine sand with a small fraction of fine silt and clay (Fig. 3), which is similar to paleoflood sediments along the Yellow River (Zhao et al., Reference Zhao, Wang, Wei, Lai, Fan, Zhao, Pan, Zhao, Li and Zhao2017). It is poorly sorted with a modal value of 55 µm. It is interpreted as sediment deposited from suspension in floodwater, during the terminal calm phase of the flooding event, in pools on the floodplain. In addition, a small admixture with fine silt, with secondary mode of ~10 µm, may be interpreted as background eolian material, albeit reworked and redeposited by the river on the floodplain (Vandenberghe, Reference Vandenberghe2013; Vandenberghe et al., Reference Vandenberghe, Sun, Wang and Abels2018). The dune sand DC-C (U3) is fine sand with a small component of silt and is rather well sorted. The frequency distribution curve is similar to those of DC-A and the main component of DC-B, but the modal value (130 µm) is in between those of the latter two overbank samples (Fig. 3). According to the similar grain-size distribution, the age (see Dating results), and the stratigraphic position, we deduce that the overbank sediments DC-B acted as the source for the overlying dune sand. The eolian drift process has apparently brought about improved sorting: fine sand and silt sediment were probably blown farther away, thus slightly coarsening the mean grain size of the dune sands. This phenomenon is not uncommon, as for instance previously reported by De Ploey (Reference De Ploey1961) and Vandenberghe and Krook (Reference Vandenberghe and Krook1981) in inland dunes and Bohncke et al. (Reference Bohncke, Vandenberghe and Huijzer1993) in river dunes in Belgium and the Netherlands.
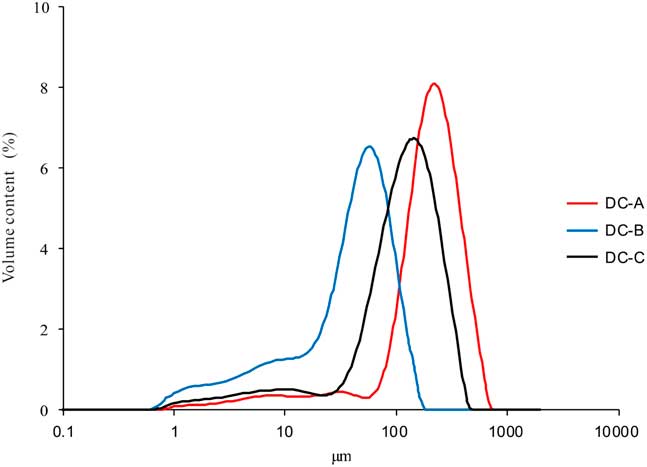
Figure 3. (color online) Grain-size distribution curves of sediment units in the Doucheng (DC) section (DC-A, from sediment unit 4, coarse sand; DC-B, from sediment unit 2, laminar fine sand and silt; DC-C, from sediment unit 3, sand dune).
The SL section coincides with the second terrace of the Yellow River at ~8 m apf. The sediment series is composed of a fining-upward ensemble of four sediment units covered by ~1.5 m yellowish–orange loess (Fig. 4). The lowermost (first) unit (U1) is composed of well-rounded gravel (Gt, Gp) with interbedded coarse sand (St) (Fig. 4b). This unit was exposed to a thickness of >8 m, although the base was not visible. The second unit (U2), 0.5 to 0.8 m thick, consists of alternating horizontally bedded, laminated layers of fine, silty sand and coarse sand with current ripples (Sh, Sr) (Fig. 4b and e); the thickness of the individual laminae is 2–5 cm (Fig. 4e). The sedimentary sequence of units 1 and 2 is interpreted as a fining-upward fluvial sediment sequence, from high-energy braided channel sediments of gravel and coarse sand (U1) to horizontal bedded sand (U2) at waning flow. The overlying (third) unit (U3) is loose, homogenous and massive, gray, fine sand (Sm) (Fig. 4b, c, and d). In this third unit, two dunes composed of fine sand were distinguished (Fig. 4b); the thickness of U3 varies from 2 to 3.8 m at different locations in the exposure (Fig. 4b). This unit is brown colored at the top, indicating weak soil formation. The fourth (upper) unit (U4) below the loess is internally laminated and consists of yellowish coarse silt with occasional ripples and light-brown fine silt or clay (Fl); the thickness of the individual laminae is 5–10 cm (Fig. 4b and d). This shows that after an eolian phase (U3), the site was invaded again by the Yellow River, more specifically in an overbank position and expressed by unit 4 that is interpreted as a flood loam. Six OSL samples (SL-1 from an interbedded sand in the gravel of unit 1, SL-2 and 4 from U2, SL-3 and 5 from U4, and SL-6 from U3) were taken from this section (Fig. 4a).
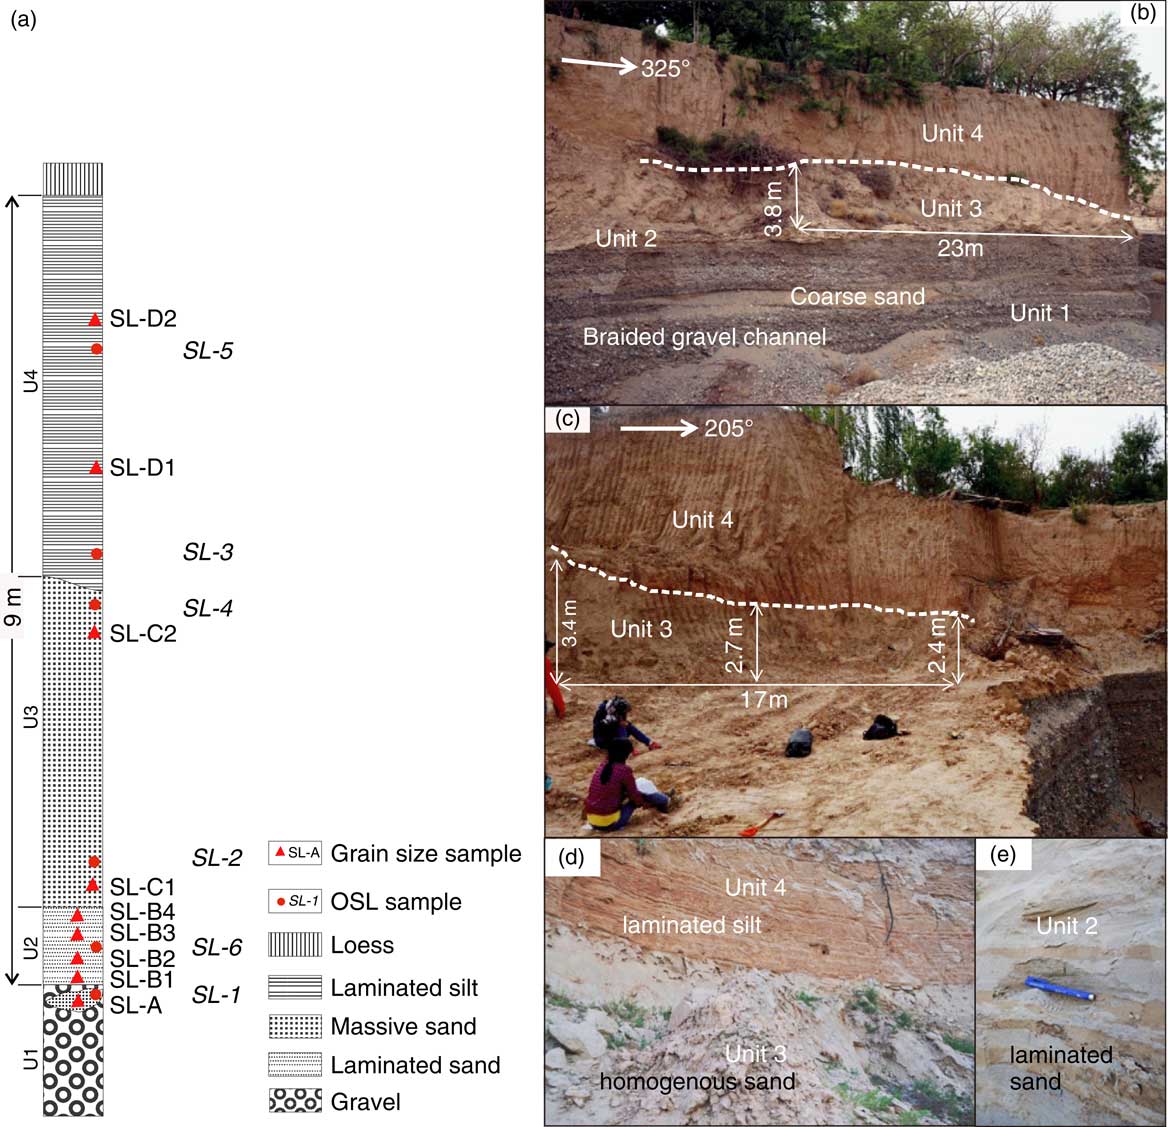
Figure 4. (color online) Sediment sequences of the Silong (SL) section (units 1, 2, 3, and 4). (a) Stratigraphic column and location of samples. (b) Sediment units 1, 2, 3, and 4 (exposed to the northeast, 325°). The dashed line is the boundary between sediment unit 3, homogeneous sand and unit 4, laminar silt. (c) Sediment units 3 and 4 (exposed to the southwest, 205°); the dashed line is the boundary between unit 3, homogeneous sand and unit 4, laminar silt. (d) Laminar silt of unit 4 and gray homogeneous sand of unit 3. (e) Laminated sand structure of sediment unit 2. OSL, optically stimulated luminescence.
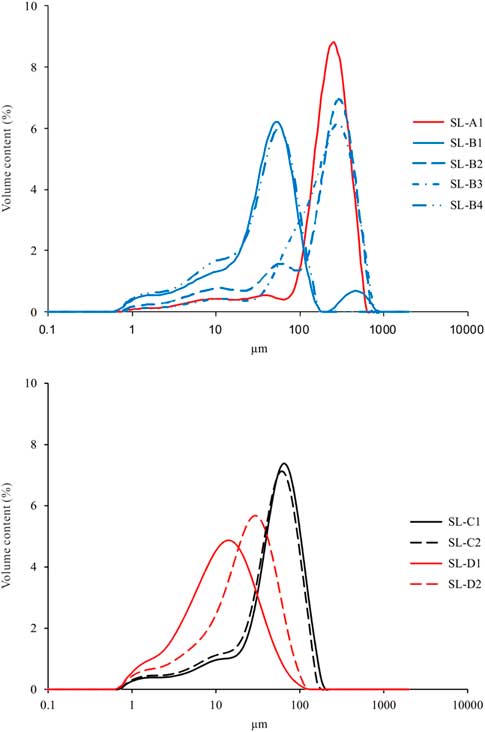
Seven samples were taken for grain-size analysis (SL-A from a sand layer in the lowest sediment (U1); SL-B1, B4, from a layer of fine sandy silt in the second sediment unit (U2), and SL-B2, B3, from sand layers in that same sediment unit (U2); SL-C1, C2, from, respectively, the bottom and top of the third sediment unit (U3); SL-D1, from a layer of fine silt, and SL-D2, from a layer of coarse silt in the top sediment unit (U4) (Fig. 4a). SL-A, from a channel fill within the lower gravel body, is mainly composed of well-sorted, coarse sand (modal value 256 µm) and a very small amount of silt (Fig. 5). SL-B1 and B4 are mainly composed of coarse silt and fine sand (major mode at 55 µm) and, in the case of B1, a small amount of coarse sand (minor mode at 450 µm) (Fig. 5). SL-B2 and B3 are in general much coarser, mainly composed of medium-to-coarse sand (modal values 287 µm), a minor amount of fine sandy silt (modal value 55 µm in B2), and a very small amount of fine silt (mode 10 µm) (Fig. 5). SL-C1 and C2 are almost identical, composed of fine sand to coarse silt, very well sorted and with a modal value of 65 µm (Fig. 5); they are very similar to B1 and B4. SL-D1 consists of silt and clay and has a modal value of 13 µm (Fig. 5). SL-D2 is composed of silt and very fine sand, with a modal value of 29 µm (Fig. 5). Both D samples are rather poorly sorted.
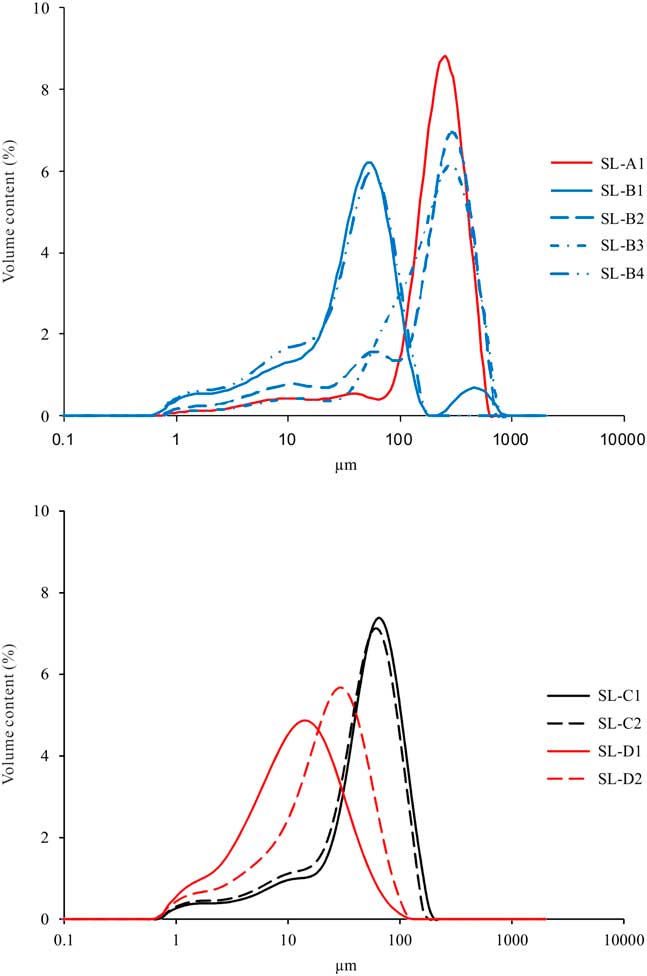
Figure 5. (color online) Grain-size distribution curves of sediment units in the Silong (SL) section (SL-A from sand layer in unit 1; SL-B1, B4 from the layer of fine sand in unit 2; SL-B2, B3 from the layer of coarse sand in unit 2; SL-C1, C2 from the bottom and top of unit 3, respectively; SL-D1 from the layer of fine silt; and SL-D2 from the layer of coarse silt in unit 4).
Thin horizontally laminated sands with cross bedding and ripples (Sh, Sr) in unit 2 clearly point to a fluvial origin. The large differences in the grain-size populations of samples SL-B1, B2, B3, and B4 in a 0.5-m-thick sediment sequence show significant variability in transport energy. The coarse component in U2 (SL-B2 and B3) is predominantly well-sorted sand, resembling the channel fill in the lowest fluvial unit 1 and sample DC-A of modern flood sand in the DC section, whereas the fine components in U2 (SL-B1 and B4) resemble sample DC-B of overbank sediment from that DC section. The overbank or flood-loam origin of unit 2 is confirmed by the presence of alternating coarse (B2-B3) and fine-grained (B1-B4) laminae. However, each of these laminae shows a multimodal composition consisting of medium-to-coarse sand, coarse silt, and fine silt. The equal grain-size distribution from top to bottom in the ~3 m sediment sequence of U3 (samples SL-C1 and C2) indicates relatively equal transport energy resulting in the massive structure of this unit, which is characteristic of its eolian origin. Unit 4 (with samples SL-D1 and D2) is characterized by similar horizontal laminations and ripple structures as in the overbank sediments (unit 2) of the DC section and is thus also interpreted as a floodplain deposit. However, on average the latter two samples are clearly finer grained and contain considerably less sand. Apparently, they resemble an original loess deposit, but here in a reworked state, according to the sedimentary structure; it means they are redeposited in pools on the floodplain.
The SC section, located at a terrace of the Yellow River ~30 m apf, is composed of five sediment units and covered by more than 20 m of yellowish-orange primary loess. The first (lowermost) unit is ~1.5 m thick, composed of laminar sand, interbedded silt, with horizontal bedding and ripple structures, and a thin clay band (Sh, Sr, Fl) (Fig. 6d and f). The second unit is ~1 m thick, composed of two interfingering subunits (U2a and 2b). Unit 2a is a laminar silt and clay (Fl), whereas unit 2b is loose, homogenous, gray, fine sand with massive structure (Sm) (Fig. 6c). The third unit (U3) is composed of 1.1 m laminar silt overlying 0.5 m of more laminated clay or silt consisting of (reworked) soil material (Fl, Fsm) (Fig. 6c and f). The fourth unit (U4) is composed of 3.5 m loose, homogenous, gray, fine sand with massive structure (Sm) (Fig. 6b) containing one ~0.5-m-thick red clay or soil lens buried inside. The uppermost (fifth) unit (U5) is a horizontally laminated, coarse and fine silt (Fl) (Fig. 6b and e), very similar to U4 in the SL section. These five units occur on top of a maximum 6-m-thick gravel layer and finally bedrock. Five OSL samples (SC-1 from the top of U1, SC-2 from U2b, SC-3 from U2a, SC-4 from U4, SC-5 and 6 from U5) were taken from this section (Fig. 6a).
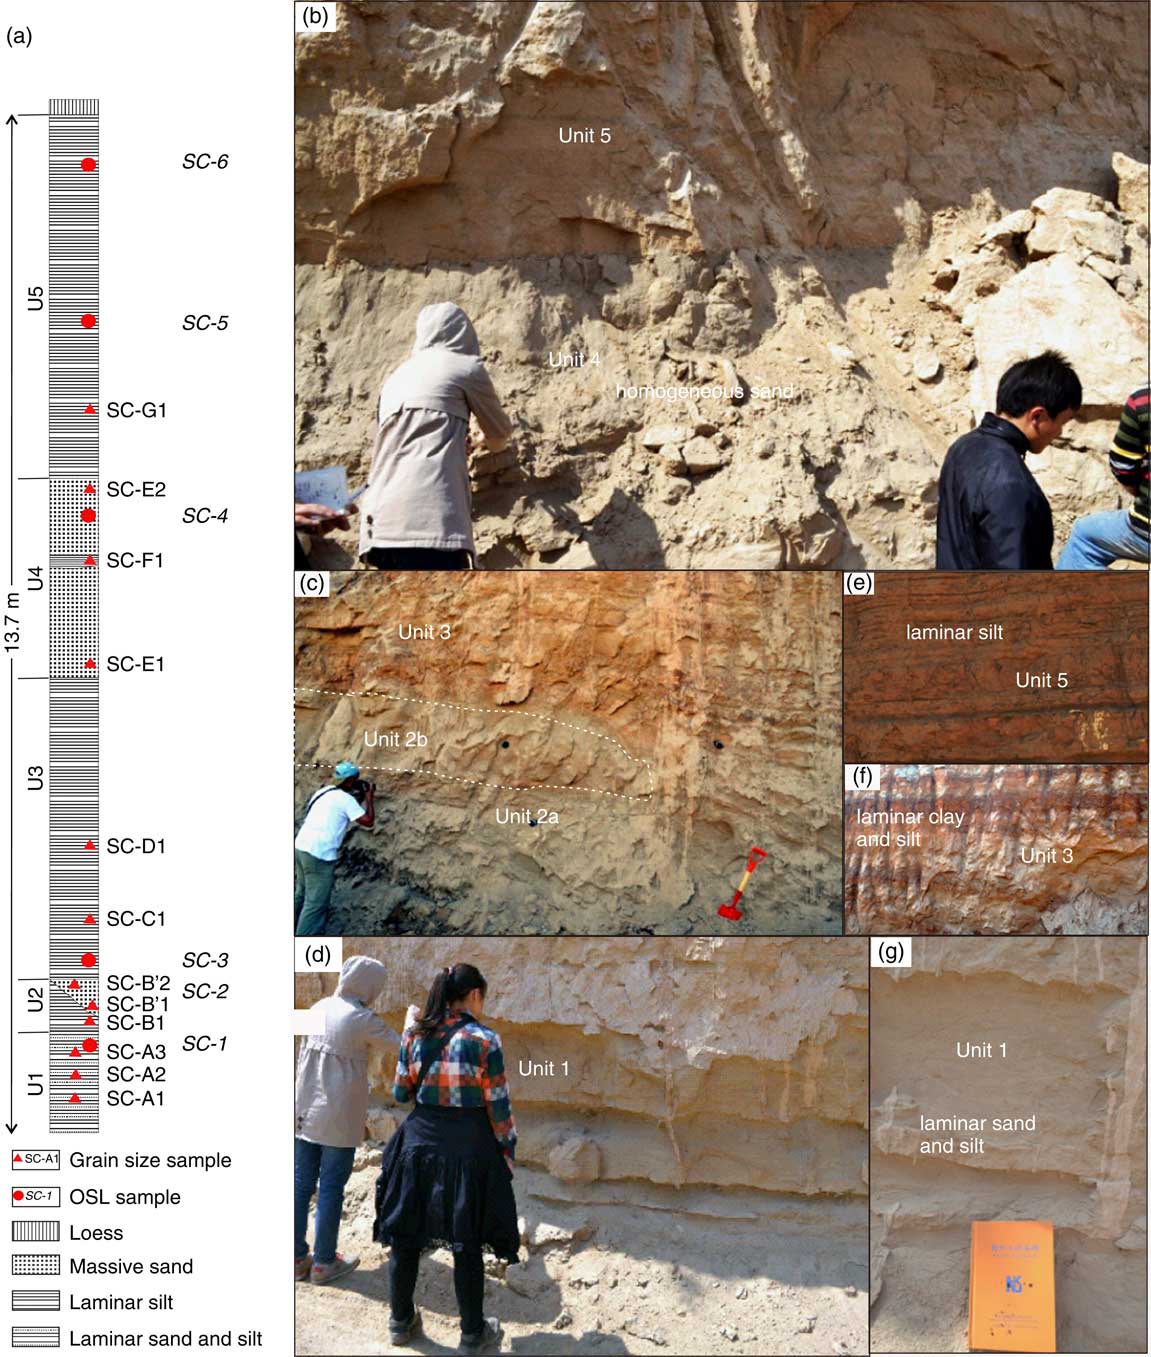
Figure 6. (color online) Sediment sequences of the Shichuan (SC) section. (a) Stratigraphic column and location of samples. (b) Sediment unit 5, laminated silt; and unit 4, gray homogeneous sand. (c) Sediment unit 3, laminar silt and clay or soil; sediment unit 2a, laminar silt and clay; and sediment unit 2b, loose homogenous gray fine sand. (d) Sediment unit 1, laminar sand, interbedded silt with horizontal bedding and ripple lamination, and thin clay band. (e) Laminated silt structure of sediment unit 5. (f) Laminated silt and clay of sediment unit 3. (g) Horizontal sand and laminated silt with ripples of sediment unit 1. OSL, optically stimulated luminescence.
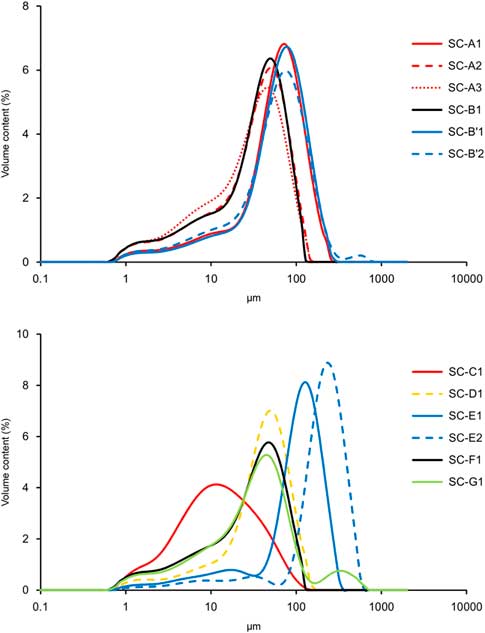
Twelve samples were analyzed to determine their grain-size distribution (SC-A1 from sand layer and SC-A2, A3 from silt layers in U1; SC-B1 from U2a, SC-B’1 and B’2 from U2b; SC-C1 from the laminar clay in U3, SC-D1 from the overlying laminar silt in U3; SC-E1, E2 from homogenous sand in U4; SC-F1 from a red clay lens in U4; SC-G1 from U5) (Fig. 6a). SC-A1 is mainly composed of very fine sand and coarse silt with a modal value of 70 µm, mixed up with a small amount of fine silt (Fig. 7). Samples, SC-A2 and A3, also from unit 1, are slightly finer grained (modal value of 46 µm) and contain some more silt than sample A1. Samples SC-B’1 and B’2 from unit 2b are also very similar to SC-A1 (very fine sand with modal value of 70 µm and minor amount of fine silt) (Fig. 7). Sample SC-C1 (U3) is poorly sorted with modal value of 11 µm (Fig. 7). SC-D1 is similar to SC-A2, A3, and B1 with same modal value of 46 µm (Fig. 7), although the sand content was a bit higher and the clay content a bit lower. SC-E1 and E2 are fine sands, mixed up with a very small amount of silt, and moderately to well sorted (Fig. 7). SC-F1 and G1 are almost identical to SC-A3 and A2, mainly composed of silt with modal value of 46 µm (Fig. 7). Compared with SC-A2, A3 and SC-F1, SC-G1 clearly shows a secondary modal value in the sand fraction (320 µm) (Fig. 7).
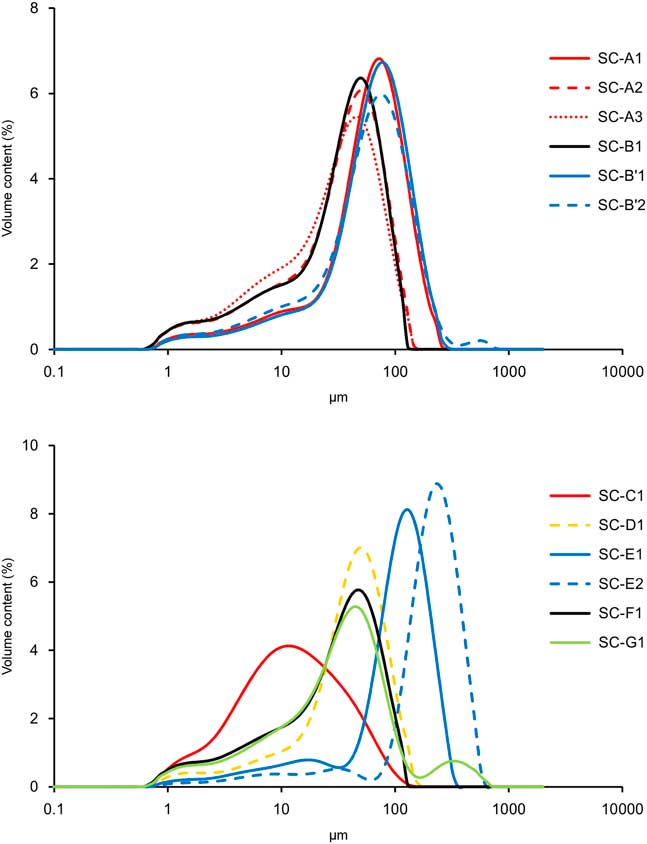
Figure 7. (color online) Grain-size distribution curves of sediment units in the Shichuan (SC) section (SC-A1 from sand layer and SC-A2, A3 from silt layers in unit 1; SC-B1 from unit 2a; SC-B’1, B’2 from unit 2b; SC-C1 from laminar clay in unit 3; SC-D1 from laminar silt in unit 3; SC-E1, E2, from homogenous sand in unit 4; SC-F1 from red clay lens in unit 4; SC-G1 from unit 5).
Small horizontally laminated layers of sand and silt with horizontal cross bedding and ripple lamination (Sh, Sr) in units 1 and 2a point to low-energy fluvial transport. The mixture of fine–coarse silt with fine sand causes the bimodality in the grain-size distribution and the rather poor sorting. These sediments are quite similar to the overbank deposits at DC (U2, sample DC-B). In addition, thin clay bands in units 1 and 2a, typical of settling in pools, indicate that a floodplain environment is represented. The homogeneous structure of unit 2b (samples SC-B’1 and B’2) suggests that this sediment was blown up from the underlying U1 (sample SC-A1), practically without any change in grain size. SC-C1 and D1 from U3 are again interpreted as flood loams. D1 is similar to SC-A2, A3 and B1 from U1, while the fine silt of C1 is almost identical to the reworked loess SL-D1 of the SL section. Unit 4 (SC-E1 and E2), consisting of moderately to well-sorted, massive, rather pure and homogeneous sand, looks similar to the eolian dune at DC. The thin silty layer within U4 (SC-F1) is almost identical to SC-A3 and also resembles DC-B, similarly reflecting deposition of a flood loam intercalated between different eolian phases (SC-E1 and SC-E2). SC-G1, from a coarse intercalation within otherwise fine-grained laminated flood loam (U5), is similar to SC-F1, but the distinct presence of a coarse sand component points to an occasional flood event, resembling sample SL-B1.
Dating results
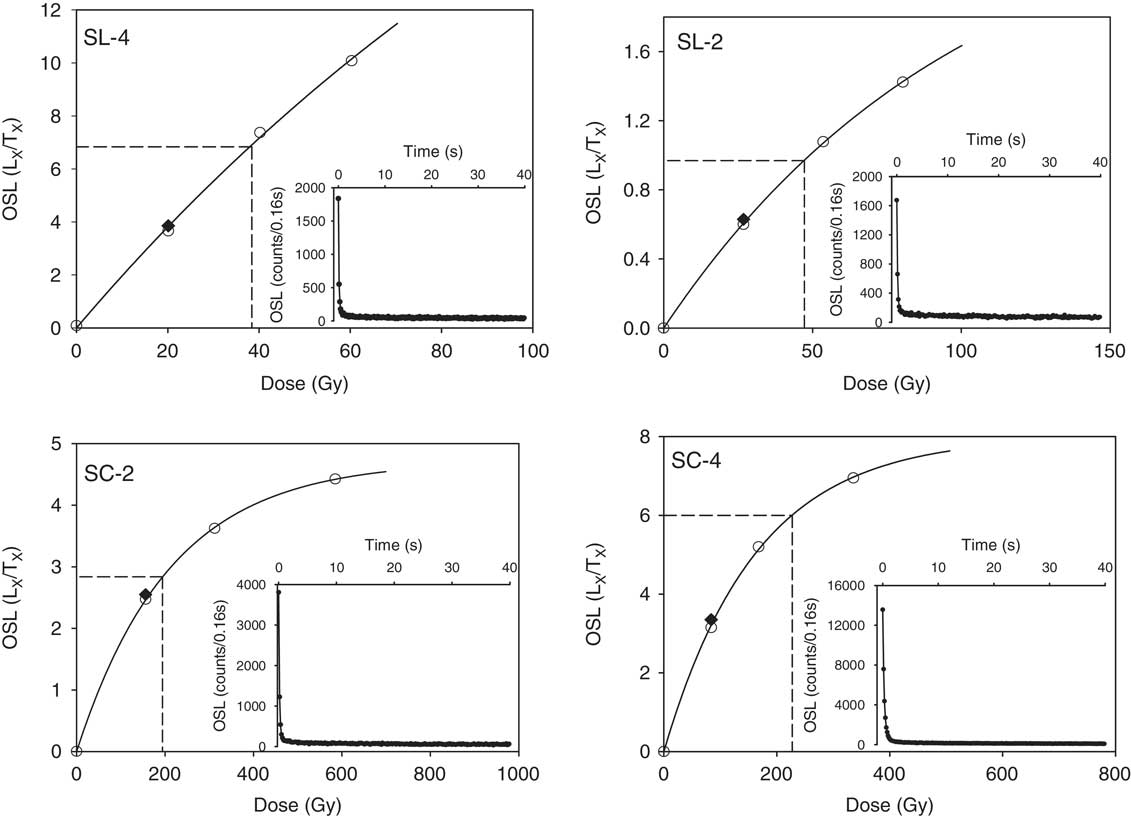
From all samples, a small but sufficient amount of fine-sand–sized quartz could be extracted to permit standard SAR-OSL analysis. The dose response can be well represented by either a single saturating exponential or the sum of a single saturating exponential and a linear component (Fig. 8). In general, sensitivity changes occurring during the measurement procedure are accurately corrected (as indicated by recycling ratios within the range 0.90–1.10), and the growth curves pass very close to the origin (recuperation values well below 10% of the corrected natural OSL signal). Table 1 summarizes the analytical data and OSL ages. The uncertainties on the OSL ages are calculated following the error assessment system proposed by Aitken and Alldred (Reference Aitken and Alldred1972) and Aitken (Reference Aitken1976).

Figure 8. Representative growth curves for a single aliquot of very fine quartz sand (63–90 μm) extracted from samples SL-2, SL-4, SC-2, and SC-4. The inset shows the optically stimulated luminescence (OSL) decay curve.
Table 1. Summary of U, Th, and K concentrations; estimates of past water content (W.C.); calculated dose rates; and equivalent doses (D e ). The number of aliquots used for the D e data is given as a subscript in parentheses.
In the DC section, samples DC-1 and DC-2, from flood loam and covering dune, are dated at ~2.0 ka and ~0.8 ka, respectively. As these ages were obtained using large aliquots, they should, at least in principle, be considered as maximum ages.
Sample (SL-1), from a sand lens in the top of sediment unit 1, is dated to ~23.6 ka. This result is in agreement with the gravel aggradation period of a terrace of the Yellow River west of Lanzhou, situated at 14 m apf (Wang et al., Reference Wang, Vandenberghe, Yi, Van Balen and Lu2015a). Sample (SL-6), from sediment unit 2, was dated at ~18.9 ka, while the sand dune (unit 3) covering this unit was dated from ~20.7 (sample SL-2) to ~16.0 ka (sample SL-4). Samples SL-3 and SL-5, from the laminar flood loam of unit 4, were dated at ~14.8 and ~13.2 ka, respectively. As in the DC section, the ages in the SL section were obtained using large aliquots, although incomplete resetting was not considered to be a significant source of error (cf. Murray and Olley, Reference Murray and Olley2002; Jain et al., Reference Jain, Murray and Bøtter-Jensen2003).
Six samples from the SC section were dated between ~94.7 and 67.4 ka, and some ages were inconsistent with their stratigraphic position (e.g., the top of the section dated as 94.7 ka, whereas the base dated as 76 ka). Murray and Funder (Reference Murray and Funder2003) and Buylaert et al. (Reference Buylaert, Vandenberghe, Murray, Huot, De Corte and Van den haute2007), for example, have shown that OSL ages derived from the high-dose area of the dose response curve may be inaccurate, with D e being underestimated from about 150–200 Gy onward. Thus, these results from the SC section should be interpreted with caution as minimum ages. In any case, they demonstrate that these samples are at least older than 67 ka.
DISCUSSION
Interlink between eolian and fluvial process
The grain-size distributions of the dunes from the three studied sections are very similar to the nearby overbank sediments. In general, however, the dune sands are strikingly better sorted than the overbank sediments, which is caused by winnowing of these overbank sediments from the underlying flood sands. When comparing all the overbank sediments in both the DC and SL sections, it appears that their mean grain sizes are quite different. Likewise, it is difficult to correlate mean grain sizes of the dune sands that are supposed to be reworked by wind from the overbank deposits. Moreover, the dune sands have been transported over a certain distance and thus should not necessarily correspond to the directly underlying deposits at the same spot. Eolian dunes from DC, SL, and SC were dated at ~0.8, ~20.7–16.3, and older than ~76 ka (or even 94.7 ka), respectively. Dune formation must have therefore taken place at least at several occasions since the last glacial period alternating with fluvial deposition.
All of the studied grain-size distributions of overbank and dune sediments show a nonnegligible (2–5%) fine–medium silt component. Sediment unit 3 in the DC and sediment unit 4 in the SL (laminar silt) sections even show a major component with modes at 10 and 29 µm. The finest silt component in all samples could be interpreted as originally background dust transported in high-suspension clouds at heights of tens or a maximum of a few hundred meters (Prins et al., Reference Prins, Vriend, Nugteren, Vandenberghe, Lu, Zheng and Weltje2007; type 1c.2 by Vandenberghe, Reference Vandenberghe2013). Component with a mode of 29 µm could be an original dust population transported in low-suspension clouds near to the surface, probably during cyclonal dust storm outbreaks in springtime, especially in cold conditions at the decline of the Siberian High Pressure Cell in the case of eastern Asia (Prins et al., Reference Prins, Vriend, Nugteren, Vandenberghe, Lu, Zheng and Weltje2007; type 1b.3 by Vandenberghe, Reference Vandenberghe2013). However, both eolian sediment populations occur here within the overbank sediments as demonstrated amply by the sedimentary structures and the general grain-size distributions. Therefore, these eolian components have to be considered as secondary (reworked) loess. Although those loess components may have been (partly) fluvially reworked from older deposits, we assume that they were (at least partly) contemporaneous with extensive dust input into the study region from surrounding arid regions, next to strong dune activity in the Tengger Desert (Qiang et al., Reference Qiang, Chen, Wang, Niu and Song2010) and Qingwangchuan basin, at some 50 km distance north of Lanzhou during the same periods (Long et al., Reference Long, Fuchs, Yang and Cheng2016).
Interaction of fluvial and eolian processes in response to climate change
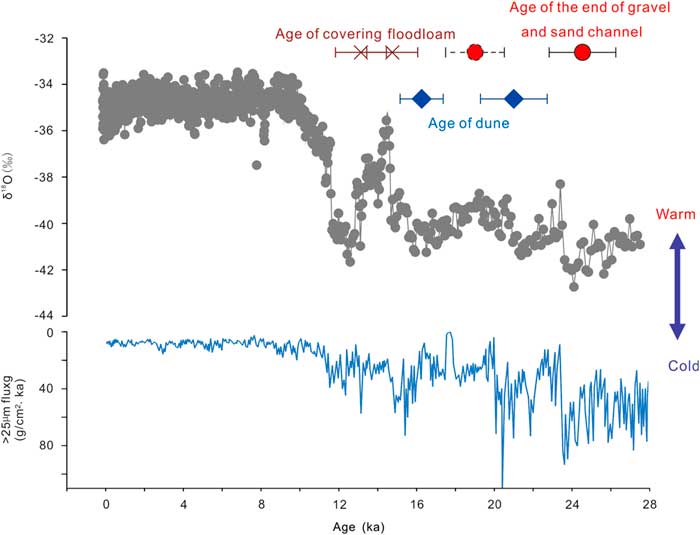
In contrast to the claim that eolian and fluvial process were respectively dominant during dry and humid phases in dryland environments (Bullard and Livingstone, Reference Bullard and Livingstone2002), our study shows that eolian dunes were also formed within the fluvial terrace sediment sequence of the Yellow River irrespective of glacial-interglacial alternations. In addition, small (2–5%) amounts of dust were supplied into the river floodplain, at least since the last glacial period. In order to study the response of fluvial and eolian processes to climate change in the studied area, we compared the sediment process evolution in the best-dated section (SL) of this study with high-resolution climatic change records. Paleoclimatic information was provided by the flux of the >25 µm fraction of nearby Lake Qinghai sediments (An et al., Reference An, Colman, Zhou, Li, Brown, Timolthy and Cai2012) and the ice core isotopic record from North Greenland (North Greenland Ice Core Project members, 2004). The >25 µm fraction of Lake Qinghai sediments was viewed as eolian input during cold-dry conditions in the region (An et al., Reference An, Colman, Zhou, Li, Brown, Timolthy and Cai2012). Cooling and ice expansion in high northern latitudes likely leads to an increased meridional (latitudinal) temperature gradient, southward migration of the polar front, and intensification of the Mongolian high-pressure cell, which should cause a cold and dry climate with strong wind in northeastern China (including the studied area) (e.g., Cooperative Holocene Mapping Project Members, 1988; Vandenberghe et al., Reference Vandenberghe, Renssen, van Huissteden, Nugteren, Konert, Lu, Dodonov and Buylaert2006; Lu et al., Reference Lu, Yi, Mason, Jiang, Cheng, Stevens and Xu2013; Wang et al., Reference Wang, Yi, Lu, Vandenberghe and Han2015b; Xu et al., Reference Xu, Lu, Yi, Vandenberghe, Mason, Zhou and Wang2015).
The final gravel deposition in the SL section, dominated by assemblages of gravel traction-current deposits in a braided system and dated at 23.6 ka occurred during a cold period (Fig. 9). This is in accordance with the braided gravel aggradation during cold climate in the Yellow River basin (Wang et al., Reference Wang, Vandenberghe, Yi, Van Balen and Lu2015a) and the general model of fluvial development derived for temperate and periglacial environments (Bridgland and Westaway, Reference Bridgland and Westaway2008; Vandenberghe, Reference Vandenberghe2015). The dune between the lower flood sand (U2) and upper flood loam (U4) in the SL section was dated from 20.7 to 16.0 ka, which corresponds with gradual warming after the last glacial maximum (Fig. 9). The floodplain sedimentation (flood loam), dated to 14.8 and 13.2 ka in the SL section was deposited at the very end of that cold period and the start of the next warm period (Fig. 9). This evolution is in accordance with rivers in lower latitudes and in mountain settings (e.g., Vandenberghe, Reference Vandenberghe1995, Reference Vandenberghe2002; Stokes et al., Reference Stokes, Mather, Belfoul, Faik, Bouzid, Geach, Cunha, Boulton and Thiel2017) that the resumption of vegetation cover at the transition from a cold to a warm period reduces sediment supply to the rivers, which therefore progressively incised enabling fine-grained floodplain sediments to be deposited on top of the gravels at high stage. After that, eolian loess without any further fluvial reworking accumulated on the abandoned floodplain.
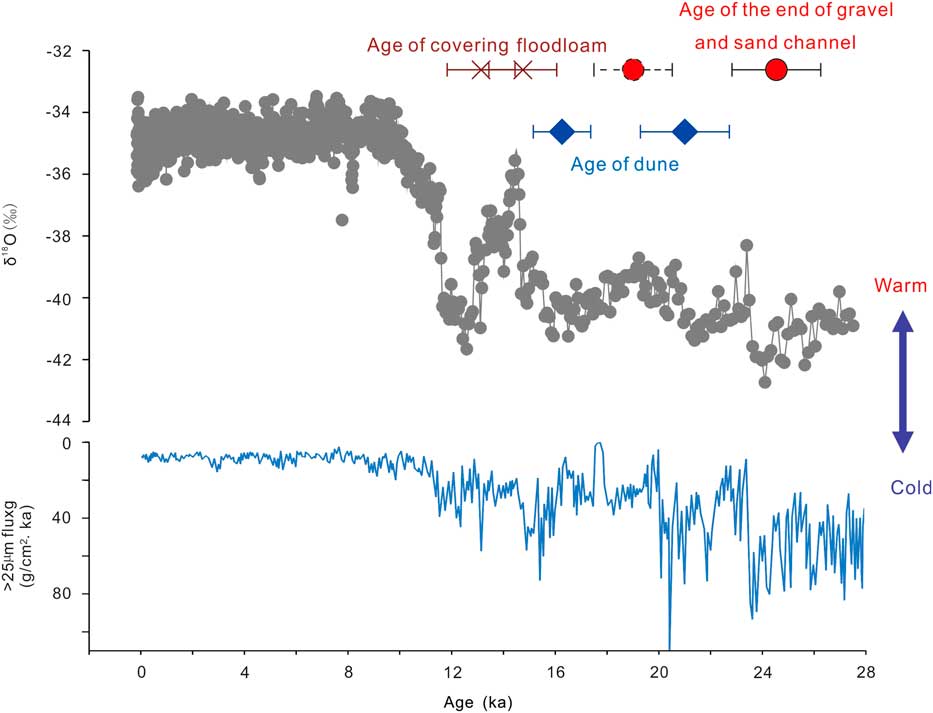
Figure 9. (color online) Comparison of ages of sediment units in the Silong (SL) section and climate changes as recorded by the flux of the >25 µm fraction of Lake Qinghai sediments (An et al., Reference An, Colman, Zhou, Li, Brown, Timolthy and Cai2012) and the ice core isotopic record from North Greenland (North Greenland Ice Core Project members, 2004).
Dunes are commonly associated with deserts (e.g., Qiang et al., Reference Qiang, Chen, Wang, Niu and Song2010) and dune fields (Lu et al., Reference Lu, Zhao, Mason, Yi, Zhao, Zhou, Ji, Swinehart and Wang2011; Long et al., Reference Long, Fuchs, Yang and Cheng2016) in northwestern China. However, fluvial evolution may also have played a major role in eolian process through its effect on sand sources for dunes. The fluvial incision at the termination of the last glacial (from cold to warm climate) not only transformed the former braid plain gradually into a terrace, but also lowered the groundwater table in that terrace, resulting in dry surface conditions. At the same time, the river was able to occupy the emerging terrace level with flood sands at high stages. When the final entrenchment was reached during the next warm period, the river was no longer able to reach the former terrace level (Vandenberghe, Reference Vandenberghe2015) and thus provided no sediment for dune formation. In addition, vegetation had reinvaded the terrace surface at that time, thus further hindering dune development. The combination of the presence of dry-source sediment, a still poor vegetation cover, and strong winter monsoonal winds created favorable conditions for eolian activity when rivers had started their incision at the end of the cold period (in this case at the end of last glacial period, when dunes formed on the terrace surface and dust was redeposited by the river during flooding of the terrace). The late Holocene dune formation at DC shows that dune formation could be initiated at any time, provided that dry floodplain sands without dense vegetation cover were present. This means that, as well as climatic changes, human intervention may also have played a role by removing the vegetation. In addition, the very latest Holocene was a time of huge paleofloods on large Chinese rivers (e.g., Zhao et al., Reference Zhao, Wang, Wei, Lai, Fan, Zhao, Pan, Zhao, Li and Zhao2017), and the dune sands at DC site at this period could be the re-reworking of those flood deposits.
CONCLUSIONS
Sedimentologic structures and grain-size analysis have shown that there were several periods of eolian dune accumulation within the terrace sediment sequences of the Yellow River in the semiarid Jingyuan area during the last glacial and postglacial period: two at >70 ka, one at around 20–16 ka, and one at 0.8 ka. Based on the results of OSL dating and the correlation of the evolution of sedimentary processes with climate change, it was demonstrated that the basal part of the terrace sediment series of the Yellow River consists of braided channel deposits accumulated under fully cold conditions. Toward the terminal part of cold periods, the terrace was abandoned as a result of river entrenchment but covered by floodplain deposits. Dry surface conditions and an absence of vegetation at that time favored eolian activity. The floodplain sediments were the source for dune formation, as confirmed by grain-size analysis. Our major conclusion from this study is that at times of initial climate warming, eolian activity alternated with flooding on the terrace surface, leading to sediment successions in which eolian sediments alternated with floodplain deposits.
ACKNOWLEDGMENTS
This research is funded by the National Natural Science Foundation of China (41522101), National Key Research and Development Program (2016YFA0600500), and Dutch–Chinese Exchange Program. The authors thank the reviewers (M. Stokes and anonymous) and the editors (Lewis Owen and David R. Bridgland) for their constructive suggestions.