INTRODUCTION
Southern African climatic variability is determined by the influence of two primary circulation systems: (1) the tropical easterlies, which advect moisture to the continent from the Indian Ocean, and (2) the southern westerlies and associated storm track (Tyson and Preston-Whyte, Reference Tyson and Preston-Whyte2000). Precipitation across most of the subcontinent is related to the tropical easterlies and falls primarily in the summer months (the “summer rainfall zone” [SRZ]; sensu Chase and Meadows, Reference Chase and Meadows2007), when evaporation and convective potential are highest. In contrast, the southwestern Cape receives the bulk of its rainfall in the winter months (the “winter rainfall zone” [WRZ]), when the westerly storm track shifts equatorward. This seasonal dynamic has been widely applied as a model to understand and explore Quaternary climatic dynamics, with a coeval inverse relationship being proposed wherein summer (winter) rainfall systems are relatively more invigorated during interglacial (glacial) periods (van Zinderen Bakker, Reference van Zinderen Bakker1976; Cockcroft et al., Reference Cockcroft, Wilkinson and Tyson1987; Chase and Meadows, Reference Chase and Meadows2007).
In recent years, focused efforts to test and refine this model have shown that, while it may be applicable in broad terms (Chase et al., Reference Chase, Chevalier, Boom and Carr2017), there exists a much greater degree of spatiotemporal complexity than was previously predicted. Evidence indicates, for example, that the eastern SRZ cannot be treated as a homogeneous region, as there exist at least two (southern-central and northern) subregions (Chevalier and Chase, Reference Chevalier and Chase2015), and that climatic variability across much of the interior is driven by the interaction between temperate and tropical systems, rather than by either system in isolation (Chase et al., Reference Chase, Chevalier, Boom and Carr2017). It has also been suggested that the influence of the tropical easterlies has at times been a key determinant of climatic variability not only in the SRZ, but in parts of the modern WRZ as well (Chase et al., Reference Chase, Lim, Chevalier, Boom, Carr, Meadows and Reimer2015b), and a comparison of records from sites along the interface between the SRZ and WRZ seem to suggest that strong dipoles may exist over very short distances (<100 km) (Chase et al., 2015a, Reference Chase, Lim, Chevalier, Boom, Carr, Meadows and Reimer2015b).
In this paper, we apply a selection of recent data sets to explore the spatiotemporal distribution of millennial-scale hydroclimatic anomalies during the Holocene in the southern Cape of South Africa. This region receives precipitation from both tropical and temperate systems (in what is referred to here as the “aseasonal rainfall zone” [ARZ]; cf. “YRZ” definition of Chase and Meadows, Reference Chase and Meadows2007) and is further influenced by the warm Agulhas Current, which may induce either localised precipitation (Jury et al., Reference Jury, Valentine and Lutjeharms1993) or may contribute to the development of larger regional convective systems (Tyson and Preston-Whyte, Reference Tyson and Preston-Whyte2000). As such, the southern Cape is recognised as being a climatically complex region, and while it is currently one of the most mesic regions in South Africa, it may also be one of the most sensitive to change as a result of perturbations in any one of the elements that comprise its climatic system.
SITE SELECTION
For this study, we consider sites from the central and eastern SRZ and both the interior and coastal zones of the southern Cape (Fig. 1). As we focus on identifying millennial-scale hydroclimatic anomalies, we have selected only those records that (1) are continuous, (2) have sampling intervals that are a consistently less than 500 yr, and (3) can be related with reasonable certainty to changes in precipitation and/or aridity. Underpinning our analyses at the regional scale are the northern and southern-central SRZ (N-SRZ and SC-SRZ, respectively) summer precipitation reconstructions of Chevalier and Chase (Reference Chevalier and Chase2015) (Fig. 2a and e). These reconstructions (1) include data from the best-resolved fossil pollen records from eastern southern Africa, (2) analyse the data using the CREST software (Chevalier et al., Reference Chevalier, Cheddadi and Chase2014) to obtain quantified estimates of past precipitation, and (3) allow for the identification the N-SRZ and SC-SRZ as two largely distinct regions based on differences observed between the records considered (see Chevalier and Chase [Reference Chevalier and Chase2015] for more details). To explore the extent of the climatic anomalies observed in these regional reconstructions and the influence of the dominant climatic systems, we consider four additional records (Fig. 1). The first, a δD record recovered from a marine core off the coast from the Zambezi River mouth (Schefuß et al., Reference Schefuß, Kuhlmann, Mollenhauer, Prange and Patzold2011), is of relatively low resolution, but as an indicator of rainfall amount/intensity it provides information regarding the northern extent of the patterns observed. Along the southeastern African coastal margin, Holocene pollen records have been recovered from Lake Eteza (Neumann et al., Reference Neumann, Scott, Bousman and van As2010) and the Mfabeni Peatland (Finch and Hill, Reference Finch and Hill2008), but the resolution of these records is too low (sampling intervals exceed 500 yr in some portions of the records) for the level of analysis undertaken in this study. We instead use the δ13C record from the Mfabeni Peatland, which provides a higher-resolution measure of C3 (primarily trees and shrubs) versus C4 (primarily tropical drought-adapted grasses) vegetation and has been interpreted as relating to general changes in humidity during the Holocene (Baker et al., Reference Baker, Routh, Blaauw and Roychoudhury2014). While general, this index of vegetation change is similar to the interpretive basis of the Mfabeni and Lake Eteza pollen records, and the patterns of change observed in the records are similar. From the southern Cape coast, the high-resolution pollen record from Eilandvlei provides valuable insight into regional hydroclimatic conditions, with changes in afrotemperate taxa being strongly linked to changes in humidity (Quick et al., Reference Quick, Chase, Wündsch, Kirsten, Chevalier, Mäusbacher, Meadows and Haberzettl2018). Inland of Eilandvlei, 130 km to the northwest in the Groot Swartberg mountains, rock hyrax middens from Seweweekspoort have provided a detailed δ15N record, reflecting changes in hydroclimate over the last 22,000 yr (Chase et al., 2013, Reference Chase, Chevalier, Boom and Carr2017). While other records do exist from this region of southern Africa—such as those recovered from Groenvlei (Martin, Reference Martin1968) and Rietvlei-Stillbaai (Quick et al., Reference Quick, Carr, Meadows, Boom, Bateman, Roberts, Reimer and Chase2015)—and results do share similarities with the Eilandvlei record (see Quick et al., Reference Quick, Chase, Wündsch, Kirsten, Chevalier, Mäusbacher, Meadows and Haberzettl2018), their continuity, resolution, chronologic control, and/or significance in terms of hydroclimatic variability limit their suitability for this study (see Deacon and Lancaster [Reference Deacon and Lancaster1988], Chase and Meadows [Reference Chase and Meadows2007], and Scott et al. [Reference Scott, Neumann, Brook, Bousman, Norström and Metwally2012] for further information).

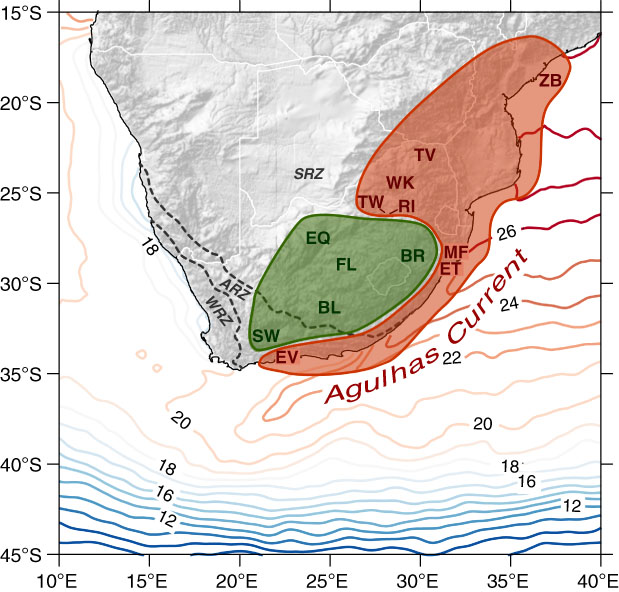
Figure 1 Map of southern Africa showing sea-surface temperature isolines (°C), the extent of the southern African winter rainfall zone (WRZ), aseasonal rainfall zone (ARZ), and summer rainfall zone (SRZ) (sensu Chase and Meadows, Reference Chase and Meadows2007), and the location of the sites considered in this study. They are: the palaeoenvironmental sites used for the reconstruction (Chevalier and Chase, Reference Chevalier and Chase2015) of northern summer rainfall zone climates (Tate Vondo [TV; Scott, Reference Scott1987a], Wonderkrater [WK; Scott, Reference Scott1982], Tswaing Crater [TW; Scott, Reference Scott1999; Metwally et al., Reference Metwally, Scott, Neumann, Bamford and Oberhänsli2014], and Rietvlei [RI; Scott and Vogel, Reference Scott and Vogel1983]); southern-central summer rainfall zone climates (Braamhoek [BR; Norström et al., Reference Norström, Scott, Partridge, Risberg and Holmgren2009], Florisbad [FL; Scott and Nyakale, Reference Scott and Nyakale2002], Equus Cave [EQ; Scott, Reference Scott1987b], and Blydefontein [BL; Scott et al., Reference Scott, Bousman and Nyakale2005] according to Chevalier and Chase [Reference Chevalier and Chase2015]); the GeoB9307-3 marine core (ZB; Schefuß et al., Reference Schefuß, Kuhlmann, Mollenhauer, Prange and Patzold2011); Mfabeni Peatland (MF; Baker et al., Reference Baker, Routh, Blaauw and Roychoudhury2014); Lake Eteza (ET; Neumann et al., Reference Neumann, Scott, Bousman and van As2010); Eilandvlei (EV; Quick et al., Reference Quick, Chase, Wündsch, Kirsten, Chevalier, Mäusbacher, Meadows and Haberzettl2018); and Seweweekspoort (SW; Chase et al., Reference Chase, Chevalier, Boom and Carr2017). Sites are colour coded to reflect similarities in climatic variability phasing, and regions (as defined by these findings) are described by shaded areas. (For interpretation of the references to color in this figure legend, the reader is referred to the web version of this article.)
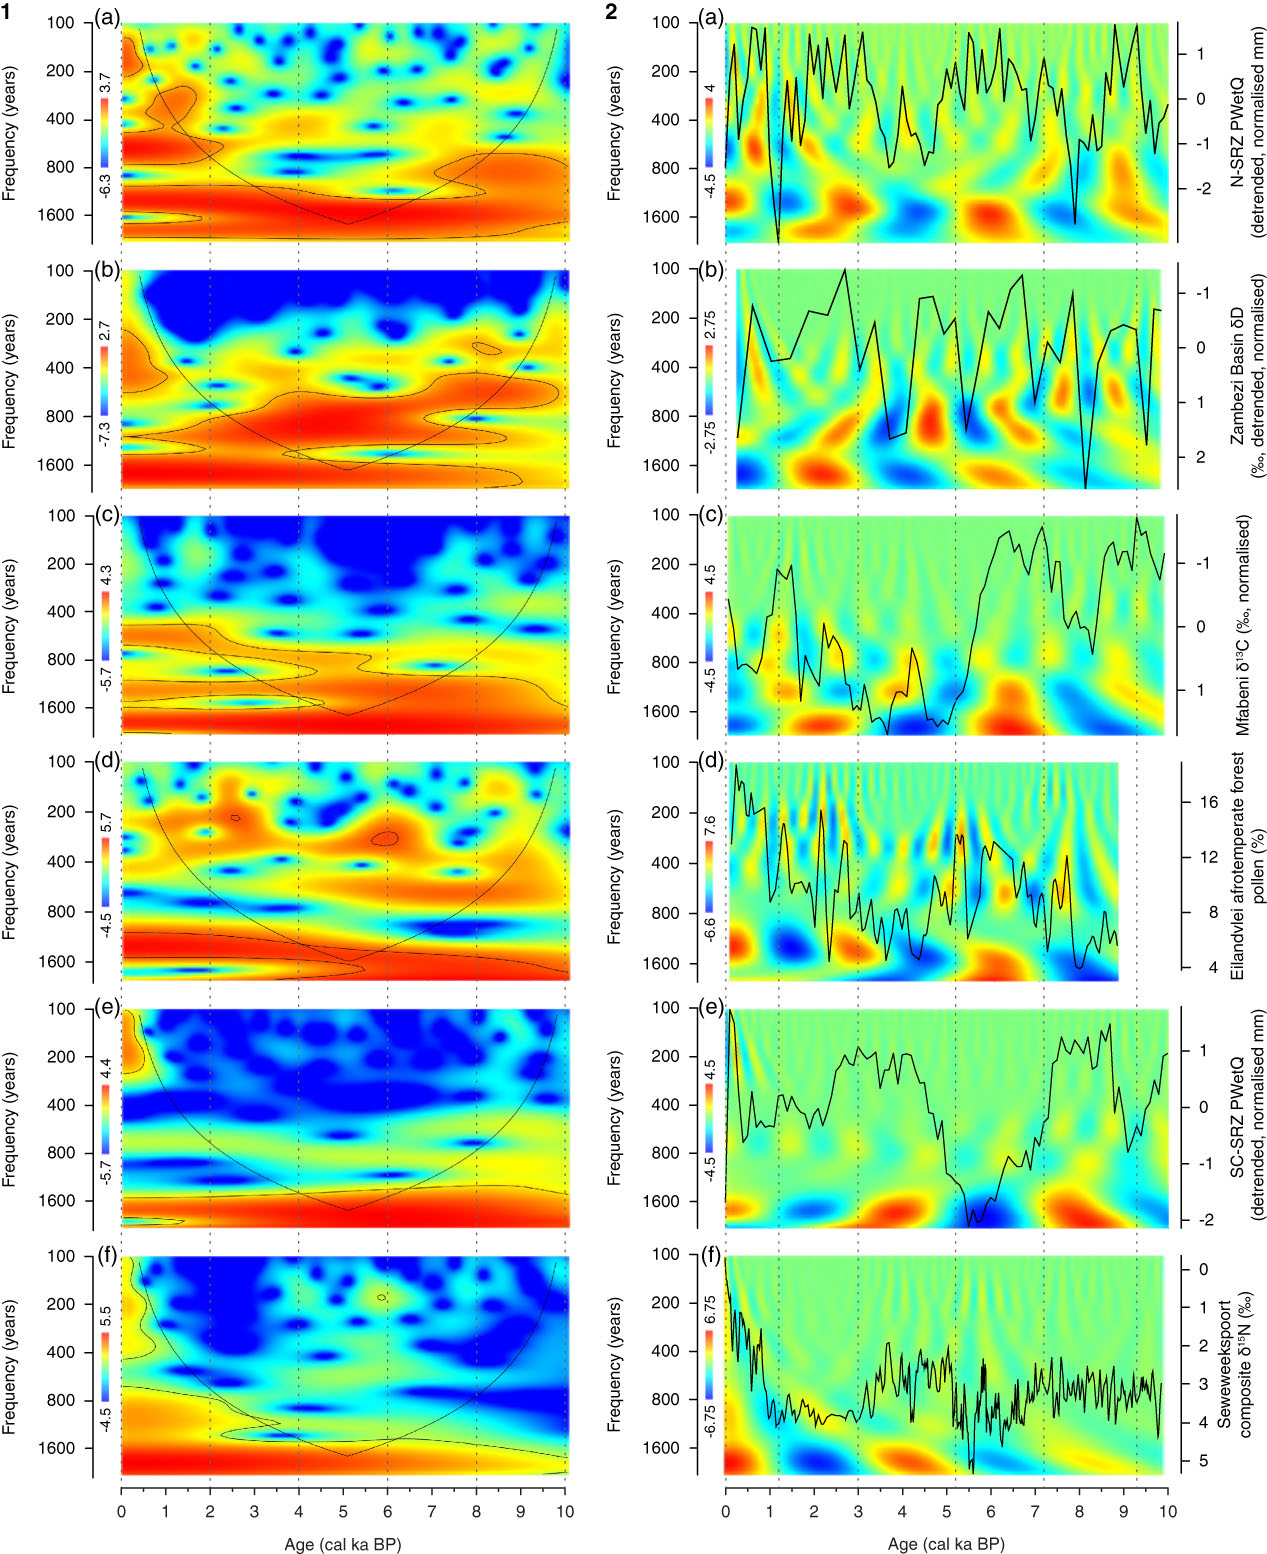
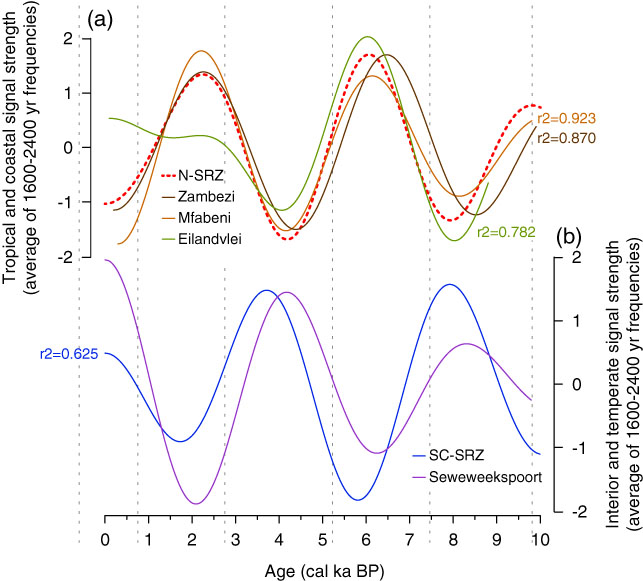
Figure 2 (color online) Comparison of the records considered for this study: (a) the northern summer rainfall zone (N-SRZ) and (e) southern-central summer rainfall zone (SC-SRZ) summer precipitation stacks (Chevalier and Chase, Reference Chevalier and Chase2015), (b) the δD record from the GeoB9307-3 marine core (Schefuß et al., Reference Schefuß, Kuhlmann, Mollenhauer, Prange and Patzold2011), (c) the δ13C record from the Mfabeni Peatland (Baker et al., Reference Baker, Routh, Blaauw and Roychoudhury2014), (d) the Eilandvlei afrotemperate forest pollen record (Quick et al., Reference Quick, Chase, Wündsch, Kirsten, Chevalier, Mäusbacher, Meadows and Haberzettl2018), and (f) the Seweweekspoort δ15N composite record (Chase et al., Reference Chase, Chevalier, Boom and Carr2017). Each record has been analysed using continuous Morlet wavelet transforms. Panel 1 shows the local wavelet power spectrum for each record, with black lines indicating the cone of influence to show where boundary effects are present and the regions of greater than 95% confidence using a white-noise model. Panel 2 highlights the real-value signal power at different time scales. In this paper, we are considering the common millennial-scale variability identified at >1600 yr frequencies, which highlights an antiphase relationship between tropical and coastal sites (panels a–d) and those from the interior (panels e and f). Each record has been oriented according to interpretations of aridity, with “wetter” conditions towards the top of the graph and with higher real-value signal power.
DEFINING MILLENNIAL-SCALE CLIMATIC VARIABILITY IN THE STUDY REGION
As we are concerned here with the mechanistic relationships between sites/regions, we focus primarily on the direction and timing of change rather than amplitude. To highlight this clearly, we have removed low-frequency multimillennial/orbital-scale trends (cubic polynomial) from the SRZ stacks and the Zambezi Basin record, as they are dominated by a signal linked to direct insolation forcing during the Holocene (Schefuß et al., Reference Schefuß, Kuhlmann, Mollenhauer, Prange and Patzold2011; Chevalier and Chase, Reference Chevalier and Chase2015). For this study, we have also removed the pollen records from the coastal sites of Lake Eteza and the Mfabeni Peatland from the SC-SRZ stack, as defined by Chevalier and Chase (Reference Chevalier and Chase2015), to more clearly differentiate between coastal and interior signals. Chronologies for all records presented were established by the original authors using Bacon (Blaauw and Christen, Reference Blaauw and Christen2011) and the SHCal13 (Hogg et al., Reference Hogg, Hua, Blackwell, Niu, Buck, Guilderson and Heaton2013) or Marine13 (Reimer et al., Reference Reimer, Bard, Bayliss, Beck, Blackwell, Bronk Ramsey and Grootes2013) calibration data. We have updated the Mfabeni Peatland and Zambezi Basin records using these same calibration data to ensure comparability.
To identify patterns of millennial-scale climatic variability within the Holocene, we have used continuous Morlet wavelet transforms (Torrence and Compo, Reference Torrence and Compo1998) (Fig. 2). Before analysis, each record was linearly interpolated to a common 100 yr resolution for analytical purposes, but the differing sampling resolutions limit the scope of robust comparisons to lower, millennial-scale frequencies. While the variable sampling resolutions result in the appearance of significant bands at different frequencies, we focus here on the common bands of high significance in the 1600 to 2400 yr frequencies to distil millennial-scale variability (Fig. 2, panel 1). Real-value wavelets show positive or negative oscillations in the data, and strength of the anomalies at these frequencies (Fig. 2, panel 2). These results indicate that common cycles of variability are identifiable in records from across the study region, and anomalies can be seen to manifest between approximately 0–1.2 cal ka BP, 1.2–3 cal ka BP, 3–5.2 cal ka BP, 5.2–7.2 cal ka BP, and 7.2–9.3 cal ka BP. These signals have been isolated in Figure 3, which plots the average signal strength and sign for the 1600 to 2400 yr frequencies for each record across the Holocene.

Figure 3 (color online) Comparison of millennial-scale signals (1600–2400 yr frequencies) from (a) the northern summer rainfall zone (N-SRZ; Chevalier and Chase, Reference Chevalier and Chase2015), Zambezi Basin (Schefuß et al., Reference Schefuß, Kuhlmann, Mollenhauer, Prange and Patzold2011), Mfabeni Peatland (Baker et al., Reference Baker, Routh, Blaauw and Roychoudhury2014), and Eilandvlei (Quick et al., Reference Quick, Chase, Wündsch, Kirsten, Chevalier, Mäusbacher, Meadows and Haberzettl2018); and (b) the southern-central summer rainfall zone (SC-SRZ; Chevalier and Chase, Reference Chevalier and Chase2015) and Seweweekspoort (Chase et al., Reference Chase, Chevalier, Boom and Carr2017). In panel a, correlations are calculated relative to the N-SRZ signal, which is considered to be most representative of tropical variability in the region.
DISCUSSION
When considered together, records from the study region indicate a strong antiphase relationship between the N-SRZ and the SC-SRZ over millennial time scales (Figs. 2a and e, and 3), and the pattern exhibited in the SC-SRZ extends well into the ARZ. It has been proposed that this latter phenomenon may be determined by the interaction between temperate and tropical systems to create composite synoptic systems such as tropical–temperate troughs (Chase et al., Reference Chase, Chevalier, Boom and Carr2017).
Of particular interest is the strong dipole that has been revealed to exist within the ARZ between Eilandvlei (Quick et al., Reference Quick, Chase, Wündsch, Kirsten, Chevalier, Mäusbacher, Meadows and Haberzettl2018) on the southern Cape coast and Seweweekspoort (Chase et al., Reference Chase, Boom, Carr, Meadows and Reimer2013, Reference Chase, Chevalier, Boom and Carr2017) (Fig. 2). Considering their position and proximity, it would be expected that they share similar climatic histories. Instead, for most of the Holocene, the progression of hydroclimatic anomalies are strongly opposed between the sites. The differences between these sites are unlikely to be related to Seweweekspoort’s position closer to the WRZ, as a similarly antiphase relationship can be observed between the Eilandvlei record and the SC-SRZ stack (Figs. 2 and 3).
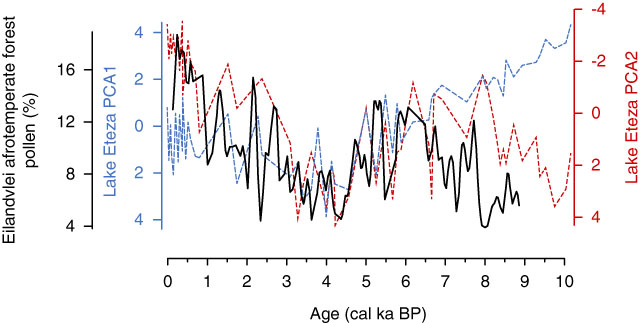
We propose that the similarities in phasing between Eilandvlei and the N-SRZ are the result of the transport of warm waters along the east coast via the Agulhas Current, which, by modifying the surface heat flux and the onshore flow of moist air (Jury et al., Reference Jury, Valentine and Lutjeharms1993, Reference Jury, Rouault, Weeks and Schormann1997), effectively propagates a tropical climate signal along its zone of influence. As suggested earlier, the influence of this vector is apparently both strong and highly localized. While its resolution precludes it from the methods of analysis employed here, analyses of the Lake Eteza pollen record indicate distinct similarities with the Eilandvlei data, supporting this finding (Fig. 4).

Figure 4 (color online) Comparison of Eilandvlei afrotemperate pollen percentages (Quick et al., Reference Quick, Chase, Wündsch, Kirsten, Chevalier, Mäusbacher, Meadows and Haberzettl2018) with PCA1 and PCA2 from the Lake Eteza pollen record (Neumann et al., Reference Neumann, Scott, Bousman and van As2010). Each record has been oriented according to interpretations of aridity, with “wetter” conditions towards the top of the graph.
The consideration of the interior-coastal dipole may thus be critical when either (1) extrapolating results from coastal sites to understand broader palaeoenvironmental conditions across the subcontinent or (2) drawing on data from noncoastal sites to establish a context for the rich archaeological sites of the southern Cape coastal region (Klein, Reference Klein1975; Henshilwood et al., Reference Henshilwood, d’Errico, Yates, Jacobs, Tribolo, Duller and Mercier2002; Marean, Reference Marean2010). However, at this stage, the observation of this phenomenon is restricted to those few records of sufficient resolution and palaeoclimatic significance that have been recovered from the southern Cape coastal region. Thus, several key questions await the recovery of suitable records:
1. What is the spatial extent of the dominant Agulhas influence? Similarities between records from Mfabeni (Baker et al., Reference Baker, Routh, Blaauw and Roychoudhury2014) and Eilandvlei (Quick et al., Reference Quick, Chase, Wündsch, Kirsten, Chevalier, Mäusbacher, Meadows and Haberzettl2018) (Figs. 2, 3, and 4) may indicate that the Agulhas has a strong influence along the whole of the southeastern South African coast, but confirmation will require the recovery of further records from the region between these sites. Further, it may be predicted that the signal observed at Eilandvlei will diminish to the west of Eilandvlei, towards the zone of Agulhas Current retroflection and the cooler waters of the Benguela Current (Lutjeharms and Van Ballegooyen, Reference Lutjeharms and Van Ballegooyen1988; Jury et al., Reference Jury, Valentine and Lutjeharms1993), but better-resolved records from the southwestern Cape coast will be required to test this hypothesis.
2. Is the dominance of the Agulhas Current restricted to specific climate states? Even within the Holocene there are some indications that the localized influence of the Agulhas Current and the establishment of the coastal-interior dipole may be restricted to specific global boundary conditions. As an example, the strong relationship between the Eilandvlei and N-SRZ records at millennial time scales appears to break down over the last 2000 yr (Fig. 3). Recent work has shown that the dominant drivers of millennial-scale climate change across the interior may have changed significantly as global climates evolved from glacial to interglacial states (Chase et al., Reference Chase, Chevalier, Boom and Carr2017). Considering changing spatial relationships in the earliest Holocene and the last millennium (Fig. 2), it may be that the coastal-interior dipole did not exist during the last glacial period, and it may not exist in the future. Here again, more records from the region are required to study these possibilities.
3. How might changes in sea-surface temperatures versus changes in the position, strength, and/or extent of Agulhas Current flow combine or counteract each other to modulate the degree of Agulhas influence on terrestrial environments? To some degree, a positive relationship exists between the temperature of the Agulhas Current and the strength and extent of its flow along the southern Cape coast. During glacial periods, the source regions for the Agulhas Current were cooler (Bard et al., Reference Bard, Rostek and Sonzogni1997; Sonzogni et al., Reference Sonzogni, Bard and Rostek1998; Caley et al., Reference Caley, Kim, Malaizé, Giraudeau, Laepple, Caillon and Charlier2011) and the westward flow of the Agulhas may have been restricted as the subtropical front shifted equatorward (Rau et al., Reference Rau, Rogers, Lutjeharms, Giraudeau, Lee-Thorp, Chen and Waelbroeck2002; Peeters et al., Reference Peeters, Acheson, Brummer, de Ruijter, Schneider, Ganssen, Ufkes and Kroon2004; Bard and Rickaby, Reference Bard and Rickaby2009). At finer spatiotemporal scales, however, the relationship between temperature and flow, and the influence on the climates of the subcontinent may be significantly more complex (Cohen and Tyson, Reference Cohen and Tyson1995), and it remains to be seen to what extent changes in the Agulhas Current’s sea-surface temperatures may be applied as a proxy for coastal-zone humidity during periods not covered by the available records. To date, no sea-surface temperature records of sufficient resolution have been recovered from the region to adequately explore these dynamics.
CONCLUSIONS
Recent data from South Africa highlight the existence of a strong dipole in hydroclimatic conditions between interior and coastal regions of the southern Cape during the Holocene. The coastal signal appears to be highly localized, and observations of its spatial extent suggest that the Agulhas Current is a strong determinant of Holocene coastal climatic variability, operating to propagate climate change signals from the tropics to the southern Cape coast. Consideration of this mechanism is critical for understanding the extent to which data from interior or coastal sites may be extrapolated to understand or predict change in other regions of the subcontinent. Research targeting coastal and marine sites with the goal of obtaining high-resolution hydroclimatic and sea-surface temperature records extending into the last glacial period will allow for a clearer understanding of the stability and dynamics of the relationship observed during the Holocene. This is ISEM contribution no. 2018-112.
ACKNOWLEDGMENTS
This study was funded in part by the European Research Council under the European Union’s Seventh Framework Programme (FP7/2007-2013)/ERC Starting Grant HYRAX, grant agreement no. 258657, and by the German Federal Ministry of Education and Research through the collaborative project Regional Archives for Integrated Investigations, which is embedded in the international research program Science Partnership for the Assessment of Complex Earth System Processes. We would like to thank Nicholas Lancaster, Tyler Faith, and Claude Hillaire-Marcel for their thought-provoking comments.