INTRODUCTION
The response of the vegetation across tropical South America to long-term climate change is of great concern, given the importance of the ecosystem services this region provides. Of particular concern is how vegetation will respond to a drier climate, given the future projections of more intense dry seasons and increased frequency of severe drought events (Joetzjer et al., Reference Joetzjer, Douville, Delire and Ciais2013; Boisier et al., Reference Boisier, Ciais, Ducharne and Guimberteau2015; Duffy et al., Reference Duffy, Brando, Asner and Field2015). The extensive work carried out by the RAINFOR ecological monitoring project (Malhi et al., Reference Malhi, Phillips, Lloyd, Baker, Wright, Almeida and Arroyo2002) has demonstrated the short-term vulnerability of Amazonian forests to severe drought events (Phillips et al., Reference Phillips, Aragão, Lewis, Fisher, Lloyd, Lopez-Gonzalez and Malhi2009; Doughty et al., Reference Doughty, Metcalfe, Girardin, Amézquita, Cabrera, Huasco and Silva-Espejo2015; Feldpausch et al., Reference Feldpausch, Phillips, Brienen, Gloor, Lloyd, Lopez-Gonzalez and Monteagudo-Mendoza2016). However, whilst the effects of these short-term severe drought events are relatively well understood (e.g., Rowland et al., Reference Rowland, da Costa, Galbraith, Oliveira, Binks, Oliveira and Pullen2015), considerable uncertainty exists as to how long-term climate change will affect the vegetation of tropical South America. Results of future model simulations using process-based dynamic global vegetation models (DGVMs) range from catastrophic large-scale Amazonian forest die-back as a result of positive feedbacks between the biosphere and atmosphere (Cox et al., Reference Cox, Betts, Jones, Spall and Totterdell2000, Reference Cox, Betts, Collins, Harris, Huntingford and Jones2004), to other studies suggesting that the forests will be resilient to climate change (Cowling and Shin, Reference Cowling and Shin2006; Huntingford et al., Reference Huntingford, Zelazowski, Galbraith, Mercado, Sitch, Fisher and Lomas2013). One problem in predicting future vegetation dynamics is the lack of direct long-term observational data of vegetation responses to long-term climate change in the past. However, the use of proxy-based vegetation reconstructions allows us to extend our observational period back millennia through times of significant, long-term climate change. The role of paleoecology in increasing our understanding of long-term vegetation dynamics is well established within the paleo-data community, and is playing an increasingly important role in helping to understand mechanisms and uncertainties within model simulations through initiatives such as the Paleoclimate Modelling Intercomparison Project (PMIP; Joussaume and Taylor, Reference Joussaume and Taylor1995; Braconnot et al., Reference Braconnot, Harrison, Otto-Bliesner, Abe-Ouchi, Jungclaus and Peterschmitt2011).
Several mid- to late Holocene paleoecological syntheses have been undertaken in the past, but these are now relatively outdated (e.g., Mayle and Power, Reference Mayle and Power2008; Marchant et al., Reference Marchant, Cleef, Harrison, Hooghiemstra, Markgraf, van Boxel and Ager2009) due to the publication of both new paleoecological and paleoclimate records over the past decade. Furthermore, more recent syntheses (e.g., Prado et al., Reference Prado, Wainer, Chiessi, Ledru and Turcq2013b; Flantua et al., Reference Flantua, Hooghiemstra, Vuille, Behling, Carson, Gosling and Hoyos2016) have used paleoecological data (predominantly pollen) to reconstruct past climate, which precludes examination of vegetation-climate relationships. We therefore present an updated multi-proxy synthesis of published paleoecological records from across lowland tropical South America from the mid-Holocene (ca. 6 ka) to the present. This period is important both paleoecologically and paleoclimatologically, as there is widespread evidence that millennial-scale changes in insolation (driven by the precessional cycle of Earth’s orbit) caused long-term precipitation changes, and associated vegetation changes, across the region (Mayle and Power, Reference Mayle and Power2008; Prado et al., Reference Prado, Wainer and Chiessi2013a; Baker and Fritz, Reference Baker and Fritz2015). Therefore, we will consider the paleoecological records alongside key paleoclimate records from across the study region in order to assess any vegetation changes in the context of long-term climate change.
This synthesis will provide new insights into the spatio-temporal dynamics of biome-scale vegetation changes on a sub-continental scale over the past 6 ka, in the context of climate change inferred from independent paleoclimate data. Although there is increasing evidence that pre-Columbian (pre-AD 1492) peoples managed the floristic composition of their forest resources (especially by promoting palms, e.g. Watling et al., Reference Watling, Iriarte, Mayle, Schaan, Pessenda, Loader, Street-Perrott, Dickau, Damasceno and Ranzi2017), there is little evidence, to date, that they practiced large-scale deforestation. We therefore expect natural drivers (i.e., climate change) to be the most likely explanation for any biome-scale vegetation shifts over the broad, regional scales that we consider in this synthesis – an assumption borne out by a recent study of local-scale human land use nested within regional-scale, climate-driven, forest-savannah biome turnover (Carson et al., Reference Carson, Whitney, Mayle, Iriarte, Prümers, Soto and Watling2014). However, if the vegetation history of a given site(s) is inconsistent with independent paleoclimate data from the area, we will consider whether human land use can reconcile this apparent vegetation-climate mismatch.
Modern environmental setting
Modern climatic setting
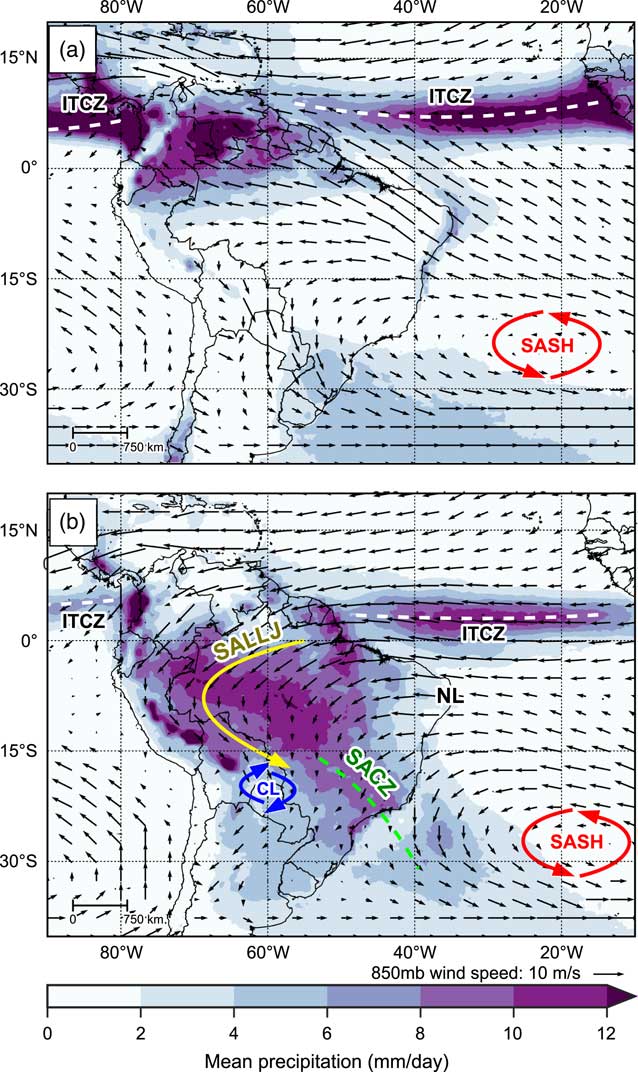
Figure 1 shows long-term mean precipitation over South America for austral winter (June, July, and August; Fig. 1a) and austral summer (December, January, February; Fig. 1b), along with mean wind speed and direction at 850 mb. The relatively narrow, longitudinally orientated belt of precipitation over the tropical oceans marks the location of the Intertropical Convergence Zone (ITCZ). The ITCZ refers to a band of low pressure and convergence of the moist trade winds over the equatorial oceans and is associated with rising air and intense convective precipitation. The rising air at the ITCZ diverges polewards when it nears the tropopause, and descends when over the subtropics, causing semi-permanent high-pressure cells over the subtropical oceans such as the South Atlantic subtropical high (SASH; Fig. 1); this loop of air movement is known as the Hadley cell circulation (Garreaud et al., Reference Garreaud, Vuille, Compagnucci and Marengo2009).

Figure 1 (color online) Observed long-term mean precipitation (mm/day), 850 mb wind speed and wind direction for (a) June, July, and August (JJA), and (b) December, January, and February (DJF). Labels indicate key climate features: Intertropical Convergence Zone, ITCZ; South American Low Level Jet, SALLJ; Chaco Low, CL; South Atlantic Convergence Zone, SACZ; South Atlantic Subtropical High, SASH; and Nordeste Low, NL. See text for details. Precipitation data taken from Tropical Rainfall Measuring Mission v7 (TRMM) 3B43 dataset (1998–2014; Huffman et al., Reference Huffman, Bolvin, Nelkin, Wolff, Adler, Gu, Hong, Bowman and Stocker2007). Wind data taken from NCEP Climate Forecast System Reanalysis (CFSR) dataset (1979–2010; Saha et al., Reference Saha, Moorthi, Pan, Wu, Wang, Nadiga and Tripp2010a, Reference Saha, Moorthi, Pan, Wu, Wang, Nadiga and Tripp2010b).
The different thermal properties of the continental landmass of South America and the surrounding oceans gives rise to a distinct seasonal cycle of precipitation over most of the tropical South American continent. During austral winter, when the thermal equator and ITCZ are located farther north, maximum precipitation over the continent is located in northern South America, whereas central South America experiences its dry season (Fig. 1a). Southern Brazil maintains an important source of moisture from both moist winds fed into the region by the circulation of the SASH and extra-tropical frontal systems (Cruz et al., Reference Cruz, Burns, Karmann, Sharp, Vuille and Ferrari2006; Garreaud et al., Reference Garreaud, Vuille, Compagnucci and Marengo2009).
During austral spring/summer the thermal equator moves south and heats the central South American land mass up relative to the surrounding oceans. This continental heating causes areas of intense convection to form over central Brazil and southern Amazonia, which are fed with moist easterly trade winds blowing in from the Atlantic Ocean, helped by an intensified SASH. This marks the onset of a system commonly referred to as the South American Summer Monsoon (SASM; Fig. 1b; Zhou and Lau, Reference Zhou and Lau1998; Raia and Cavalcanti, Reference Raia and Cavalcanti2008; Silva and Kousky, Reference Silva and Kousky2012). As the moist easterly trade winds reach the Andean mountain range, they are diverted southward and are intensified by an area of deep low pressure that forms over the Gran Chaco region (the Chaco Low). This flow creates a feature known as the South American Low-Level Jet (SALLJ), associated with very strong low-level winds that are channeled southwards by the eastern Andes and the Brazilian planalto highlands (Marengo et al., Reference Marengo, Douglas and Dias2002). The SALLJ helps to transport moisture from Amazonia into subtropical southeast Brazil where the South Atlantic Convergence Zone (SACZ) is intensified (Carvalho et al., Reference Carvalho, Jones and Liebmann2004).
In contrast to the central and southern areas of tropical South America, the northeast of Brazil is conspicuously dry throughout most of the year (Garreaud et al., Reference Garreaud, Vuille, Compagnucci and Marengo2009). The intense updrafts in the central part of the continent (in particular the Chaco Low) during the mature phase of the SASM require compensating subsidence in surrounding regions. This subsidence manifests as an upper tropospheric low-pressure feature called the Nordeste Low, which suppresses rainfall over the region of northeast Brazil (Chen et al., Reference Chen, Weng and Schubert1999; Cruz et al., Reference Cruz, Vuille, Burns, Wang, Cheng, Werner, Edwards, Karmann, Auler and Nguyen2009). This east-west difference in precipitation caused by zonal overturning circulations has been referred to as the east-west South American precipitation dipole (Cheng et al., Reference Cheng, Sinha, Cruz, Wang, Edwards, d’Horta, Ribas, Vuille, Stott and Auler2013). Interannual variability in precipitation over tropical South America is linked to the El Niño Southern Oscillation (ENSO); during El Niño episodes, precipitation rates are below average across eastern Amazonia and northeastern Brazil (Garreaud et al., Reference Garreaud, Vuille, Compagnucci and Marengo2009).
Modern vegetation setting
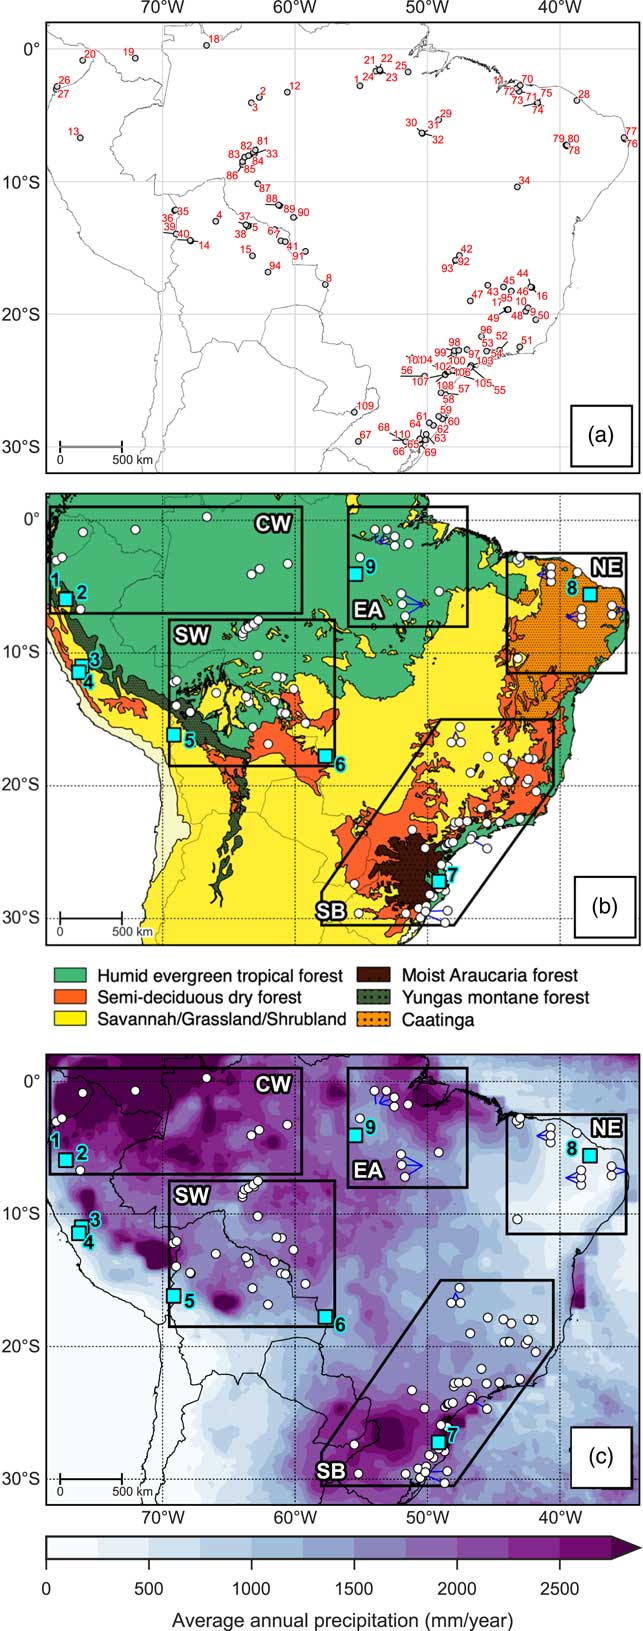
The lowlands of tropical South America support a wide variety of ecoregions, ranging from humid rainforests to xeric scrublands (Fig. 2a). The ecoregions described here refer to the potential ecoregions, as the actual vegetation cover has been highly affected by modern deforestation, agriculture, and industrialisation. The Amazon humid evergreen tropical forest (HETF) is the largest biome of tropical South America, covering most of northern and western Brazil and extending into neighboring countries to the west and north where annual precipitation is high (>1600 mm). The southern and eastern ecotonal margins of the Amazon HETF exist in a much more seasonal climate with longer dry seasons. Small patches of savannah can occur within the Amazon HETF where edaphic conditions are favorable (Adeney et al., Reference Adeney, Christensen, Vicentini and Cohn-Haft2016). Along the foothills of the Andes lies a band of Yungas forest, a transitional area ranging from moist evergreen lowland forest to montane forests. The Atlantic forest biome, supporting a mix of lowland and montane evergreen forests, exists on the east coast of Brazil where coastal and orographic rainfall maintains a moist climate (Fig. 2c). The Araucaria moist forest biome (characterized by the high abundance of the evergreen tree Araucaria angustifolia) exists on the highlands of southern Brazil where annual precipitation is high (~2000 mm) and there is a short dry season (<2 months; Hueck, Reference Hueck1953; Behling and Pillar, Reference Behling and Pillar2007).

Figure 2 Overview maps of study area. (a) Location and numeric ID of each site corresponding to Table 1. (b) Broad modern vegetation biomes, modified from Olson et al. (Reference Olson, Dinerstein, Wikramanayake, Burgess, Powell, Underwood and D’amico2001). (c) Long-term average annual precipitation based on Tropical Rainfall Measuring Mission v7 (TRMM) 3B43 dataset (1998–2014; Huffman et al., Reference Huffman, Bolvin, Nelkin, Wolff, Adler, Gu, Hong, Bowman and Stocker2007). The polygons shown in (b) and (c) represent the regions discussed in text: CW, Central and western lowland Amazonia; EA, Eastern Amazonia; SW, Southwestern Amazonia; SB, Southeastern Brazil; NE, Northeastern Brazil. The blue squares in (b) and (c) show locations of the paleoclimate sites discussed in text: 1=El Condor, 2=Cueva del Tigre Perdido, 3=Lake Junin, 4=Huaguapo, 5=Lake Titicaca, 6=Laguna La Gaiba, 7=Botuvera Cave, 8=Rio Grande do Norte, 9=Paraíso Cave. (For interpretation of the references to color in this figure legend, the reader is referred to the web version of this article.)
In between the Amazon and Atlantic rainforests exists the “dry diagonal” (Prado and Gibbs, Reference Prado and Gibbs1993). This is a large area, characterized by highly seasonal rainfall, which contains a mixture of deciduous and semi-deciduous trees, shrubland, and savannah. Most of this area is covered by the Cerrado savannah biome. Due to the variety of climatic, edaphic, and topographic features in the region, the savannah types range from open grassland to denser shrub and savannah tree cover (Silva and Bates, Reference Silva and Bates2002). Gallery forests can occur along the streams that flow through the Cerrado, as well as small patches of closed canopy deciduous and semi-deciduous trees where edaphic conditions are favorable (Silva and Bates, Reference Silva and Bates2002; Werneck, Reference Werneck2011). Larger areas of semi-deciduous tropical dry forests (SDF) exhibit a fragmentary distribution. “Nuclei” of SDF exist across: the Chiquitano region of eastern lowland Bolivia; southern Brazil along the Paraná and Paraguay rivers and into the Misiones province of northern Argentina; and inland areas of the Atlantic forest biome. SDF exist in highly seasonal climates, with annual precipitation <1600 mm and a dry season length of ~5–6 months (Gentry, Reference Gentry1995; Werneck, Reference Werneck2011). These SDF areas exist under similar climatic conditions to the Cerrado savannah, but are restricted to soils with higher nutrient content and high pH (Pennington et al., Reference Pennington, Prado and Pendry2000; Werneck, Reference Werneck2011). The Caatinga region of northeastern Brazil supports a complex mosaic of xerophytic vegetation types, ranging from dense SDF cover, more open tree cover with a shrubby sub-canopy, to open thorn scrubland and savannah. The semi-arid climate is the main control upon this Caatinga vegetation; precipitation rates are low and erratic, meaning that long periods of drought are common (Sampaio, Reference Sampaio1995). However, small “islands” of humid evergreen rainforest and semi-deciduous tropical dry forests do exist on isolated plateaus inland and near the coast where orographic and coastal rainfall can maintain a humid microclimate (Sampaio, Reference Sampaio1995; Montade et al., Reference Montade, Ledru, Burte, Martins, Verola, da Costa and Silva2014).
METHODS
A database of 110 paleoecological sites from 87 previously published papers was created through literature searches and interrogation of repositories such as the Latin American Pollen Database (LAPD; Flantua et al., Reference Flantua, Hooghiemstra, Grimm, Behling, Bush, González-Arango and Gosling2015) and Neotoma (Table 1; http://www.neotomadb.org). This synthesis considers sites from the Southern Hemisphere tropical lowlands, extending into the subtropics of southeast Brazil (a latitudinal range extending from the equator to 30°S; Fig. 2). We do not include coastal mangrove sites, as vegetation changes at these sites are predominantly driven by sea-level change (e.g., Behling et al., Reference Behling, Cohen and Lara2001b; Guimarães et al., Reference Guimarães, Cohen, Pessenda, França, Smith and Nogueira2012, Reference Guimarães, Cohen, França, Pessenda and Behling2013b; Lorente et al., Reference Lorente, Pessenda, Oboh-Ikuenobe, Buso, Cohen, Meyer and Giannini2014). For each paleoecological site, we assign a vegetation classification at 500-year time slices from the mid-Holocene (6 ka) to the present, based on a critical evaluation of the authors’ interpretations of the proxy data. The broad scale vegetation classifications we use are outlined in Table 2. A “mosaic” classification (a combination of any two vegetation types) was used when interpretation suggests that the vegetation cover at a site was most likely a mixture of vegetation types. Ideally, a site will cover the whole period from 6 ka to the present, although there are a number of sites that cover a shorter period. It does not seem appropriate to ignore sites that do not quite cover the whole period, as they may still provide valuable information about vegetation trends in a particular area. Therefore, the sites included in our synthesis must have a vegetation reconstruction spanning from earlier than 4 ka, up to at least 2 ka; this ensures that the sites cover a period where there is strong evidence that the region underwent long-term climate change.
Table 1 List of paleoecological sites. “ID” number refers to location number in Figure 2a. Size categories refer to those outlined in Table 3. Superscript numbers next to site names refer to the proxy types used in that study: 1=pollen analysis; 2=charcoal analysis; 3=isotopic analysis; 4=physio-chemical analysis. Asterisk next to site ID indicates a site where an independent age-depth model was created (see Methods).
1 Pollen analysis.
2 Charcoal analysis.
3 Isotopic analysis.
4 Physio-chemical analysis.
Table 2 Description of the broad vegetation classifications used in this study

Imposing strict criteria on the chronological quality of each site is problematic in this research area. Sedimentation rates are highly variable between samples; sites with low sedimentation rates are particularly problematic, as a relatively short core could encompass many millennia. Sub-sampling resolution also varies between sites depending on the length of the record and the specific research questions of the authors. The paucity of sites across tropical South America means that rejecting sites based on low chronological resolution would result in only a handful of sites being considered. Therefore, we have been relatively flexible in our consideration of sites with lower chronological resolution; this means that this synthesis can only provide an overview of the broad scale vegetation trends in the region over the last 6 ka, rather than exact timings of any changes. Where possible, calibrated radiocarbon dates and age-depth models that are presented in the original paper(s) of each site are used to inform the timings of any changes at that site. If a site records key vegetation changes through its record but does not present calibrated dates or an age-depth model, we use the Bacon age-depth model v2.2 in R (Blaauw and Christen, Reference Blaauw and Christen2011) to produce an independent age-depth model for that site using the raw chronological data from the paper. This is the case with 26 of the sites, indicated in Table 1. The IntCal13 calibration curve (Reimer et al., Reference Reimer, Bard, Bayliss, Beck, Blackwell, Ramsey and Buck2013) was chosen over SHCal13 (Hogg et al., Reference Hogg, Hua, Blackwell, Niu and Buck2013), given the hydrological links of the study area with the Northern Hemisphere (through the SASM and ITCZ).
We acknowledge that other more quantitative methods of classifying vegetation from paleoecological data are available, such as Biomisation (Prentice et al., Reference Prentice, Guiot, Huntley, Jolly and Cheddadi1996; Prentice and Webb, Reference Prentice and Webb1998) and the REVEALS/LOVE Landscape Reconstruction Algorithm (Sugita, Reference Sugita2007a, Reference Sugita2007b). However, these methods are based predominantly on pollen data from lakes, require access to the raw data of each site, and, in the case of REVEALS, require a high density of sites of multiple sizes in a given area. Furthermore, the REVEALS model has yet to be proven in a Neotropical setting where important assumptions about anemophily are violated by most taxa. The paucity of pollen sites that extend back to the mid-Holocene in our research area limits the usefulness of these quantitative methods (which focus solely on pollen data) in producing a thorough synthesis. For example, in the most recent application of the Biomisation method across Latin America (Marchant et al., Reference Marchant, Cleef, Harrison, Hooghiemstra, Markgraf, van Boxel and Ager2009), there are only around 24 pollen records in our research area that date back to the mid-Holocene. Our method allows us to consider other vegetation proxies in addition to pollen (e.g., phytoliths, stable carbon isotopes) and other paleoecological archives in addition to lakes (e.g., soil pits), thus increasing the number of sites we can include in our synthesis by utilizing the full suite of paleovegetation data available. In addition, our method allows us to take advantage of the in-depth knowledge that the author(s) will have about their site (e.g., pollen taphonomy, catchment), which is lost when using a standardized objective method.
Proxy types
This synthesis includes a variety of paleoecological proxy types, all of which have strengths and limitations that must be considered. The two most common proxy types in this synthesis are fossil pollen and stable carbon isotopes (δ13C). Fossil pollen analysis is the most widely used paleovegetation proxy, as it gives a direct indication of what vegetation was growing in an area at a given time. However, care must be taken in interpreting a fossil pollen record, as pollen loading into a basin does not necessarily reflect the true vegetation assemblage in the catchment area due to taxonomic differences in pollen productivities and dispersal characteristics. Additionally, the taxonomic resolution of pollen is highly variable: very few are identifiable to species level, some are identifiable to genus level, and many are only identifiable to family level. These issues mean that reliable interpretation of fossil pollen records is dependent upon modern “pollen rain” studies, whereby pollen traps are left in an area for a set time, after which the pollen assemblages are compared with floristic inventories to determine pollen-vegetation relationships (e.g., Behling et al., Reference Behling, Negrelle and Colinvaux1997; Bush and Rivera, Reference Bush and Rivera2001; Gosling et al., Reference Gosling, Mayle, Tate and Killeen2005, Reference Gosling, Mayle, Tate and Killeen2009; Jeske-Pieruschka et al., Reference Jeske-Pieruschka, Fidelis, Bergamin, Vélez and Behling2010; Guimarães et al., Reference Guimarães, Souza-Filho, Alves, de Souza, da Costa, Reis and Sahoo2014).
Stable carbon isotope fractionation (δ13C) utilises the fact that C3 vegetation (woody plants) and C4 vegetation (savannah grasses and sedges) have distinct δ13C carbon isotope signatures (Boutton, Reference Boutton1996; Pessenda, Reference Pessenda2004). Whilst this differentiation between C3 and C4 vegetation is quite broad, it does reveal whether the landscape was closed-canopy forest or open savannah, especially if bolstered by knowledge of the modern isotopic-vegetation relationships in a given area. We also include a small number of sites with phytolith (plant silica bodies) based vegetation reconstructions (Piperno, Reference Piperno2006). Unlike pollen, phytoliths preserve well in oxidized environments (e.g., soils) and are particularly useful in increasing the taxonomic resolution of grass. Although few phytolith-based paleoecological studies have yet been undertaken, recent studies have shown the effectiveness of phytoliths in distinguishing between modern tropical ecosystems in the Amazon (Dickau et al., Reference Dickau, Whitney, Iriarte, Mayle, Soto, Metcalfe, Street-Perrott, Loader, Ficken and Killeen2013; Watling et al., Reference Watling, Iriarte, Whitney, Consuelo, Mayle, Castro, Schaan and Feldpausch2016).
Several other proxies can provide important complementary information for pollen, δ13C, and/or phytolith studies. Charcoal analysis is commonly used to reconstruct past fire activity, which can be an indication of past changes in climate and vegetation characteristics (Power et al., Reference Power, Marlon, Ortiz, Bartlein, Harrison, Mayle and Ballouche2008). Isotopic analysis of nitrogen (δ15N) and chemical analyses of carbon/nitrogen (C/N) ratios can indicate whether the organic matter in a sediment record originates from an aquatic source (elevated levels of 15N, low C/N ratios) or a terrestrial source (low levels of 15N, high C/N ratios; Meyers, Reference Meyers1994; Horák et al., Reference Horák, Vidal-Torrado, Silva and Pessenda2011). Measurements of chemical element concentrations, using methods such as X-ray fluorescence (XRF), can reveal catchment erosion, which, in turn, may be linked to local/regional environmental change.
Archive types and spatial scale of reconstructions
When drawing paleoecological inferences from vegetation proxy data, it is important to consider the spatial scale that the latter represents. This spatial scale is influenced by both the type of proxy, as well as the size and type of deposit that the proxy came from. It is widely accepted in the field of palynology that the spatial scale represented by pollen assemblages in lake sediments is related to the size of that lake; small lakes (and bogs) represent local-scale vegetation, whereas large lakes represent regional-scale vegetation (Davis, Reference Davis2000). This relationship has been shown through practical experiments that correlate pollen signals from lake-surface sediment samples to vegetation inventories at increasing distances from the lake, as well as being formerly quantified in a pollen deposition/dispersal model (Prentice, Reference Prentice1985; Sugita, Reference Sugita1993, Reference Sugita1994). Whilst most of this research has been done for mid to high latitudes, the pattern is expected to be valid for the tropics. Soil pits are a common archive type that usually use δ13C isotope as a paleoecological proxy (and, in some cases, phytoliths). These records essentially represent a “point” scale (i.e., a record of the vegetation that grew directly in that soil) and, as such, transects/networks of soil pits are often taken to help represent a larger spatial area. For this synthesis, we categorize each site into one of 4 archive types: lakes, peat bogs, terrestrial (e.g., unspecified sediment hollows or swamps), and soil pits. In an attempt to visually represent the spatial scale that each record represents, we display different sized circles in Figure 4 based on the rules defined in Table 3. In some cases, the display of soil profiles that are very close together have been combined; this has been indicated in Table 1 whenever this is the case.
Table 3 Size categories representing the different catchment areas of the paleoecological sites.
Paleoclimate records
To assess the relationship between vegetation change and long-term climate change, we have selected 8 key paleoclimate records from across the region (Fig. 2 and 3). Five of these sites (El Condor, Tigre Perdido, Huaguapo, Botuvera Cave, and Rio Grande do Norte) have precipitation reconstructions based on speleothem stable oxygen isotope (δ18O) records, while precipitation records of the other sites are based upon lake-level reconstructions (Lake Titicaca and Laguna La Gaiba) or δ18O analyses of lake calcite deposits (Lake Junin). As with the paleoecological records, we rely upon the authors’ expert knowledge of these sites to inform our interpretations. This is particularly important for the speleothem records, as changes in isotopic composition can be influenced by a number of factors, including changes in moisture source, temperature, and/or rainfall amount (Lachniet, Reference Lachniet2009).

Figure 3 (color online) Selected paleoclimate records representing proxy records for precipitation changes through the last 6 ka, shown alongside calculated January insolation at 15°S (Berger and Loutre, Reference Berger and Loutre1991; Berger, Reference Berger1992). (a) δ18O of stalagmite Core A and Core B from El Condor Cave (Cheng et al., Reference Cheng, Sinha, Cruz, Wang, Edwards, d’Horta, Ribas, Vuille, Stott and Auler2013). (b) δ18O of stalagmite records NC-A and NC-B from Cueva del Tigre Perdido (van Breukelen et al., Reference van Breukelen, Vonhof, Hellstrom, Wester and Kroon2008). (c) δ18O of calcite from Lake Junin (Seltzer et al., Reference Seltzer, Rodbell and Burns2000). (d) δ18O of speleothem record Huaguapo (Kanner et al., Reference Kanner, Burns, Cheng, Edwards and Vuille2013). (e) Lake-level changes as measured by δ13C at Lake Titicaca (Rowe et al., Reference Rowe, Dunbar, Mucciarone, Seltzer, Baker and Fritz2002). (f) Pediastrum-inferred lake-level change at Laguna La Gaiba (Whitney and Mayle, Reference Whitney and Mayle2012). (g) δ18O of speleothem record BTV3a, Sr/Ca of speleothem BTV21a from Botuvera Cave (BTV) site (Wang et al., Reference Wang, Auler, Edwards, Cheng, Ito, Wang, Kong and Solheid2007; Bernal et al., Reference Bernal, Cruz, Stríkis, Wang, Deininger, Catunda, Ortega-Obregón, Cheng, Edwards and Auler2016). (h) δ18O of speleothem records FN1, RN1, and RN4 from the Rio Grande do Norte (RGDN) record (Cruz et al., Reference Cruz, Vuille, Burns, Wang, Cheng, Werner, Edwards, Karmann, Auler and Nguyen2009).
SYNTHESIS AND DISCUSSION
Figure 4 shows the paleovegetation reconstruction for each site at 500-year time slices from 6 ka to present. Supplementary Figure 1 provides a summary of the changes at each site for each area defined in Figure 2. Our discussion of these paleovegetation records is divided into the areas defined in Figure 2, within the context of precipitation changes inferred from key paleoclimate records from across the study area (Fig. 3). The main mechanism for these millennial scale precipitation changes has been attributed to changes in austral summer insolation driven by the precessional cycle of Earth’s orbit. During the mid-Holocene, lower austral summer insolation levels caused a northward shift in the mean position of the ITCZ (Haug et al., Reference Haug, Hughen, Sigman, Peterson and Röhl2001) and a decrease in intensity of the SASM (Cruz et al., Reference Cruz, Burns, Karmann, Sharp, Vuille, Cardoso, Ferrari, Dias and Viana2005; Wang et al., Reference Wang, Auler, Edwards, Cheng, Ito, Wang, Kong and Solheid2007; Vuille et al., Reference Vuille, Burns, Taylor, Cruz, Bird, Abbott, Kanner, Cheng and Novello2012). In addition, lower austral summer insolation during the mid-Holocene dampened ENSO activity and reduced associated interannual variability of rainfall associated with El Niño/La Niña events (Moy et al., Reference Moy, Seltzer, Rodbell and Anderson2002; Koutavas and Joanides, Reference Koutavas and Joanides2012). Individual interpretations of the paleoclimate records will be drawn upon in the sections below.

Central and western lowland Amazonia (CW)
Speleothem records from the western Peruvian Amazon show slightly elevated δ18O values at the mid-Holocene (Fig. 3a and b). This finding suggests that convective precipitation may have been slightly reduced at this time, consistent with a weakened SASM linked to lower summer insolation (Haug et al., Reference Haug, Hughen, Sigman, Peterson and Röhl2001; van Breukelen et al., Reference van Breukelen, Vonhof, Hellstrom, Wester and Kroon2008). However, an overall reduction in total rainfall amount across western lowland Amazonia was probably relatively small due to mechanisms such as the important source of moisture from transpiration processes across central and eastern Amazonia (Eltahir and Bras, Reference Eltahir and Bras1994; Spracklen et al., Reference Spracklen, Arnold and Taylor2012; Cheng et al., Reference Cheng, Sinha, Cruz, Wang, Edwards, d’Horta, Ribas, Vuille, Stott and Auler2013). The paleovegetation records support the idea that moisture levels have been relatively stable in this region from 6 ka to present. The sites from across central and western lowland Amazonia show that the HETF biome stayed largely intact in this region throughout the mid- to late Holocene. Evidence of this biome stability comes from consistent HETF pollen signals from large lake sites (reflecting regional scale vegetation signals; e.g., Behling et al., Reference Behling, Keim, Irion, Junk and Nunes de Mello2001c; Horbe et al., Reference Horbe, Behling, Nogueira and Mapes2011) and small sites (reflecting local vegetation signals; e.g., Liu and Colinvaux, Reference Liu and Colinvaux1988; Behling et al., Reference Behling, Berrio and Hooghiemstra1999; Bush et al., Reference Bush, Silman and Urrego2004b). Even if moisture levels were slightly lower during the mid-Holocene, it is clear this was not enough to cause biome turnover. This is currently one of the wettest parts of tropical South America (annual precipitation >3000 mm; Fig. 2c) with little or no dry season, therefore precipitation levels would have to reduce drastically to cause widespread forest die-back or biome turnover.
Southwestern Amazonia (SW)
The area of southwestern Amazonia contains the modern ecotonal boundary between the southern Amazonian HETF, the Chiquitano SDF, and the Cerrado savannah (Fig. 2a). Precipitation levels in this region are highly dependent on the strength of the SASM, especially with regards to the development of the Chaco Low and the SALLJ that help to divert precipitation from central Amazonia along the Andes and southwards into eastern Bolivia. As a result, this area has a modern precipitation regime that is much more seasonal than that of the central Amazon basin, with longer dry seasons and lower total annual precipitation of ~1500–1600 mm (Fig. 2c). Therefore, the HETF that grows here is much closer to its climatic limit and is more likely to be sensitive to even small changes in precipitation. During the mid-Holocene, paleoclimate records from the high Andes suggest this region was drier than present (Fig. 3c–e). Although these records come from the high Andes, they can be considered as representative of lowland southwest Amazonia, at least in regards to the direction of precipitation changes, as they too are dependent on the components of the SASM to divert moisture from central Amazonia. Lake levels at Lake Titicaca on the Bolivian altiplano were ~100 m lower than modern at 6 ka (Baker et al., Reference Baker, Seltzer, Fritz, Dunbar, Grove, Tapia, Cross, Rowe and Broda2001), and enriched δ18O values from the Huaguapo speleothem and Lake Junin suggest reduced convective activity and lower moisture levels (Seltzer et al., Reference Seltzer, Rodbell and Burns2000; Kanner et al., Reference Kanner, Burns, Cheng, Edwards and Vuille2013). These Andean records show that modern levels of precipitation were not reached until ca. 4–3 ka. A similar pattern of increasing precipitation through the mid- to late Holocene is found in the paleoclimate record from the lowland site of Laguna La Gaiba (LLG; Fig. 3f), although this record suggests that modern moisture levels perhaps were not reached here until ca. 2.5–2 ka. Overall, the signals from these sites are consistent with the explanation of a gradual increase in SASM strength in response to increased insolation through the mid- to late Holocene (Burbridge et al., Reference Burbridge, Mayle and Killeen2004; Kanner et al., Reference Kanner, Burns, Cheng, Edwards and Vuille2013; Baker and Fritz, Reference Baker and Fritz2015). The time delay between the Andean records and LLG reaching modern levels could suggest a lag between precipitation increasing in the Andean highlands and in the southwest Amazonian lowlands.
Two key lake sites, Laguna Bella Vista (LBV, id=6) and Laguna Chaplin (LCH, id=7), provide strong evidence of vegetation shifts through the mid- to late Holocene in response to the changes in precipitation (Mayle et al., Reference Mayle, Burbridge and Killeen2000; Burbridge et al., Reference Burbridge, Mayle and Killeen2004). These are very large lakes (>3 km diameter) and so their pollen assemblages are assumed to represent regional-scale vegetation signals. They currently lie in HETF, 130 km (LBV) and 30 km (LCH) north of the modern HETF/SDF/savannah ecotone. However, during much of the mid- to late Holocene (ca. 6 ka to 2 ka) a mosaic of SDF/savannah vegetation dominates the catchment of these lakes, providing evidence that the HETF/SDF/savannah ecotone was at least 130 km farther north than at present. This SDF/savannah mosaic is persistent in the area until ca. 2 ka, when HETF expanded southward into the catchment of LBV; it is not until ca. 1 ka when HETF reached the catchment of LCH.
Another large lake record (Laguna Oricore, id=5), located 200 km west of LBV, shows a consistent pattern of a SDF/SAV dominated landscape changing to HETF at ca. 2 ka (Carson et al., Reference Carson, Whitney, Mayle, Iriarte, Prümers, Soto and Watling2014). The two small sites near to Oricore record a later expansion of HETF at ca. 0.5 ka, but this delay has been attributed to pre-Columbian human land management by the authors (Carson et al., Reference Carson, Whitney, Mayle, Iriarte, Prümers, Soto and Watling2014, Reference Carson, Mayle, Whitney, Iriarte and Soto2016). To the east of these records on the eastern edge of the Chiquitano SDF, the regional pollen record from Laguna La Gaiba (id=8) suggests that there was no significant contraction of the SDF biome associated with mid-Holocene drought (Whitney et al., Reference Whitney, Mayle, Punyasena, Fitzpatrick, Burn, Guillen, Chavez, Mann, Pennington and Metcalfe2011). Around 600 km north of LBV lies a series of natural savannah “islands” located within the dense Amazon rainforest. Evidence that these savannah islands expanded by ~60 km at the expense of HETF during the mid-Holocene comes from δ13C data from a 200 km transect of soil pits between Porto Velho and Humaita (de Freitas et al., Reference de Freitas, Pessenda, Aravena, Gouveia, de Souza Ribeiro and Boulet2001; Pessenda et al., Reference Pessenda, Boulet, Aravena, Rosolen, Gouveia, Ribeiro and Lamotte2001), spanning the savannah islands. A contemporaneous drying out of a nearby bog (Cohen et al., Reference Cohen, Rossetti, de, Pessenda, Friaes and Oliveira2014), together with the 100 m lowstand in Lake Titicaca in the high Andes (Baker et al., Reference Baker, Seltzer, Fritz, Dunbar, Grove, Tapia, Cross, Rowe and Broda2001) suggests that a drier climate likely drove these savannah island expansions. The subsequent contraction of these savannah islands began between ca. 2.5 and 2 ka, with modern δ13C values reached by ca. 1.5 ka, concurrent with the forest expansion seen in northeastern Bolivia (Mayle et al., Reference Mayle, Burbridge and Killeen2000).
A weaker SASM in the mid-Holocene is likely to have increased the length and severity of the dry season, and decreased annual precipitation below the ~1500 mm climatic threshold between HETF and SDF/SAV, thus driving the northward ecotonal movement. The resilience of the SDF in the eastern Chiquitano region suggests that climate was not sufficiently dry to cause a drastic vegetation shift to dry savannah/scrubland or Caatinga-type vegetation such as that seen in the modern northeast region of Brazil. Severe drought events were likely more common, which would have favored the opportunistic expansion of the savannah vegetation into the vulnerable areas of HETF in the savannah island region, perhaps aided by more frequent fire events. The ca. 1000-year time lag between HETF expansion at LCH versus LBV could reflect the latitudinal time-transgressive nature of precipitation increase, and/or a degree of hysteresis in vegetation response (Burbridge et al., Reference Burbridge, Mayle and Killeen2004). It is important to note that sites from the western Bolivian/southeastern Peruvian Amazon show stability of HETF through the last 6000 years (Bush et al., Reference Bush, Silman and Urrego2004b, Reference Bush, Silman and Listopad2007b; Urrego et al., Reference Urrego, Bush, Silman, Niccum, La Rosa, McMichael, Hagen and Palace2013). This area receives more precipitation than eastern Bolivia, partly due to its location on the Andean flank and the associated orographic rainfall (Killeen et al., Reference Killeen, Douglas, Consiglio, Jørgensen and Mejia2007). Even if moist winds associated with the SASM and SALLJ were reduced in the mid-Holocene, the orographic processes are still likely to have maintained a moist windward Andean flank (Killeen et al., Reference Killeen, Douglas, Consiglio, Jørgensen and Mejia2007; Urrego et al., Reference Urrego, Bush, Silman, Niccum, La Rosa, McMichael, Hagen and Palace2013).
Southeastern Brazil (SB)
Southeastern Brazil marks the “exit region” of the SASM. During the mature phase of the SASM, moisture is transported from central Amazonia to this region via the SALLJ, helped by the Chaco Low and the channelling of the Andes and south Brazilian highlands (Fig. 1b). The speleothem records from Botuvera Cave (Wang et al., Reference Wang, Auler, Edwards, Cheng, Ito, Wang, Kong and Solheid2007; Bernal et al., Reference Bernal, Cruz, Stríkis, Wang, Deininger, Catunda, Ortega-Obregón, Cheng, Edwards and Auler2016) provide evidence that this region was drier during the mid-Holocene as less moisture was being received from the Amazon Basin (Fig. 3g), consistent with the paleoclimate records from the Andes (Baker et al., Reference Baker, Seltzer, Fritz, Dunbar, Grove, Tapia, Cross, Rowe and Broda2001) and the interpretation of a weaker SASM in response to lower austral summer insolation. The enhancement of moisture transport from the Amazon Basin into southeast Brazil is recorded from ca. 4 ka, around the same time that precipitation levels are shown to increase in the Andean speleothem records. Modern moisture levels were not reached until ca. 2 to 1.5 ka. Bernal et al. (Reference Bernal, Cruz, Stríkis, Wang, Deininger, Catunda, Ortega-Obregón, Cheng, Edwards and Auler2016) note that, even though the region receives moisture from extratropical sources, the changes in total rainfall for southeastern Brazil during the mid- to late Holocene were predominantly driven by insolation changes and associated SASM intensity.
The paleovegetation records from southeastern Brazil suggest that open vegetation was more widespread at 6 ka, with increases in arboreal vegetation types through to the present. However, given the diverse range of landscapes in this region, it is unsurprising to find that the timing, magnitude, and type of forest expansion is highly variable between different areas. The sites located in the SDF region in the SE Brazilian state of Minas Gerais suggest that this area of SDF remained largely intact through the mid- to late Holocene. This pattern is exemplified by the reconstructions from two large lakes in the core of this area of SDF, Lago Silvana (id=9, Rodrigues-Filho et al., Reference Rodrigues-Filho, Behling, Irion and Müller2002) and Dom Helvecio (id=10, Ybert et al., Reference Ybert, Turcq, Albuquerque and Cocquit2000; Turcq et al., Reference Turcq, Albuquerque, Cordeiro, Sifeddine, Simoes Filho, Souza, Abrão, Oliveira, Silva and Capitâneo2002), that show consistent SDF pollen signals, depleted δ13C, and low erosional rates throughout the last 6 ka. However, records from smaller sites do reveal more localized vegetation changes from increased SAV in the mid-Holocene (6 ka) to an increase in SDF cover between ca. 5–4 ka and again in the last ca. 1 ka. These timings are roughly consistent with the precipitation pattern interpreted from the Botuvera Cave speleothem. Development of dry forest occurred near the borders of the Misiones SDF region from ca. 2–1 ka (Pessenda, Reference Pessenda2004; Zech et al., Reference Zech, Zech, Morrás, Moretti, Glaser and Zech2009). This SDF expansion suggests that, while the mid-Holocene climate was not dry enough to cause biome turnover from SDF to savannah, there was sufficient drying due to an increase in dry-season length to cause an opening of more marginal areas of SDF. The limited records from within the central Brazilian Cerrado show the expansion of gallery forests from ca. 3.5–3 ka (Silva et al., Reference Silva, Sternberg and Haridasan2008), and in the southernmost Brazilian Cerrado at ca. 1.5 ka (Behling et al., Reference Behling, Pillar and Bauermann2005). However, the paucity of these sites means that it is uncertain whether this gallery forest expansion happened across the Cerrado biome.
Across the southern Brazilian highlands, there is clear evidence of extensive areas of SAV type vegetation (most likely campos grassland) from ca. 6–4 ka. An expansion of montane forests along the coastal mountains of São Paulo and Rio de Janerio states occurred from ca. 5–4 ka, and expansion of Araucaria forest on the southern Brazilian highlands occurred from ca. 4–3.5 ka. Further expansion of Araucaria forests occurred within the last ca. 1.5–1 ka. The Araucaria forests were likely to have been particularly sensitive to even small changes in the precipitation regime, as they currently grow where there is high annual precipitation and a short, or ill-defined, dry season. The drier mid-Holocene climate and associated expansion of campos grassland was probably linked with an increased dry season length of around 3 months (Behling, Reference Behling1997a, Reference Behling1998; Behling and Pillar, Reference Behling and Pillar2007). The initial phase of Araucaria expansion from ca. 4–3.5 ka was likely in the form of gallery forests where moisture levels could be maintained more easily (Behling, Reference Behling1997a; Behling et al., Reference Behling, Pillar, Orlóci and Bauermann2004). The second phase of expansion from ca. 1.5 ka marks a more regional expanse of Araucaria forest, suggesting that the precipitation regime was back to near-modern levels, with high annual precipitation and a short, or ill-defined, dry season (Behling and Pillar, Reference Behling and Pillar2007). Again, these timings seem to match well with the Botuvera Cave paleoclimate records, which record increased tropical moisture source from ca. 4 ka, and a return to modern moisture levels from ca. 2–1.5 ka. The timings of Araucaria expansion also coincide with increasing human activity in the region, raising the possibility that humans could have taken advantage of a wetter climate and influenced the expansion of this economically useful taxon (Bitencourt and Krauspenhar, Reference Bitencourt and Krauspenhar2006; Iriarte and Behling, Reference Iriarte and Behling2007; Iriarte et al., Reference Iriarte, DeBlasis, Souza and Corteletti2016).
Eastern Amazonia (EA)
A recently published speleothem record from Paraíso cave in eastern Amazonia suggests that this region may have been wetter than present at the mid-Holocene (Wang et al., Reference Wang, Edwards, Auler, Cheng, Kong, Wang, Cruz, Dorale and Chiang2017), in contrast to other areas of the Amazon basin that record a drier mid-Holocene. The explanation for this pattern is still unclear; early-mid-Holocene warming could have increased moisture supply, while weaker ENSO activity during the mid-Holocene may have reduced drought events in the eastern Amazon (Koutavas and Joanides, Reference Koutavas and Joanides2012; Wang et al., Reference Wang, Edwards, Auler, Cheng, Kong, Wang, Cruz, Dorale and Chiang2017), but these explanations do not necessarily account for the apparent wetter-than-present mid-Holocene. Clearly, the robustness of, and potential mechanisms for, such a pattern requires more investigation. Vegetation reconstructions from most sites near to this speleothem record (e.g., sites 1, 21–25) show stable HETF cover at the mid-Holocene (Behling and da Costa, Reference Behling and da Costa2001; Irion et al., Reference Irion, Bush, Nunes de Mello, Stüben, Neumann, Müller, Morais de and Junk2006; Bush et al., Reference Bush, Silman, De Toledo, Listopad, Gosling, Williams, De Oliveira and Krisel2007a), which is unsurprising if climate was wetter at this time.
This story is clearly a more complicated one if we consider the evidence of mid- to late Holocene vegetation changes near to the southeastern Amazonian ecotone, which appear to contradict Paraíso cave’s mid- to late Holocene precipitation history. A number of sites located on the Serra Sul dos Carajás plateau (ids=30–32) indicate dominance of savannah and dry-adapted SDF arboreal taxa during the mid-Holocene (6–5 ka), suggesting drier conditions, after which humid evergreen forest elements gradually increase up to ca. 4–3 ka, suggesting increasing moisture (Absy et al., Reference Absy, Cleef, Fournier, Martin, Servant, Sifeddine and Ferreira da Silva1991; Sifeddine et al., Reference Sifeddine, Martin, Turcq, Volkmer-Ribeiro, Soubiès, Cordeiro and Suguio2001; Hermanowski et al., Reference Hermanowski, da Costa and Behling2014). Even though human occupation has been recorded in this region for at least the last 10 ka (Kipnis et al., Reference Kipnis, Caldarelli and de Oliveira2005), the decrease in fire occurrences on the Carajás plateau that are recorded during the mid-Holocene at Lagoa de Cachoeira (id=31) would suggest that the more open vegetation at this time was not initiated by human land management. In fact, a more likely scenario is the abandonment of the plateau by humans at this time (so fewer anthropogenic fires) due to a reduction in both water sources and forest resources (Hermanowski et al., Reference Hermanowski, da Costa and Behling2014). Therefore, the apparent mismatch between these vegetation changes and the climate change at Paraíso Cave is unlikely to be due to human impacts. Around 175 km northeast of the Carajás plateau, the Lake Marabá record (id=29) indicates a switch to a HETF dominated signal at ca. 5 ka (Guimarães et al., Reference Guimarães, Cohen, França, Alves, Smith, Pessenda and Behling2013a).
Some important considerations must be noted with regards to these records that seem to contradict the regional paleoclimate history. There is clearly a paucity of paleoecological sites across this southeastern Amazonian ecotonal area, so it is difficult to infer any regional scale vegetation changes. Furthermore, the sites we do have are predominantly located on the Serra Sul dos Carajás plateau. It has long been debated as to how well the HETF surrounding the plateau is represented in the plateau based pollen records (Absy et al., Reference Absy, Cleef, Fournier, Martin, Servant, Sifeddine and Ferreira da Silva1991, Reference Absy, Cleef, D’Apolito and da Silva2014; Guimarães et al., Reference Guimarães, Souza-Filho, Alves, de Souza, da Costa, Reis and Sahoo2014). The consensus at this time is that the plateau vegetation, along with some input from the forests growing on the slopes, dominates the pollen assemblages of the lake and bog records from the plateau, suggesting that the mid- to late Holocene Carajás records only reflect local changes on the plateau itself (Hermanowski et al., Reference Hermanowski, da Costa and Behling2012a, Reference Hermanowski, da Costa, Carvalho and Behling2012b, Reference Hermanowski, da Costa and Behling2014). At the nearby Lake Marabá record, the vegetation changes could be due to successional vegetation changes after the formation of the lake (Guimarães et al., Reference Guimarães, Cohen, França, Alves, Smith, Pessenda and Behling2013a). Even given these caveats, there is still a mismatch between vegetation reconstructions, apparently indicating a drier mid-Holocene (at a local scale), and the Paraíso cave record, indicating a wetter regional climate. Clearly, more work needs to be done to reconcile these differences.
Northeastern Brazil (NE)
As the modern east–west precipitation dipole between northeastern Brazil (dry climate) and the central South American tropics (wet climate) is largely controlled by the strength of the SASM and associated features, it is not unexpected to find that the paleoprecipitation history of the Rio Grande do Norte speleothem shows a distinct “anti-phased” relationship to the rest of tropical South America (Cruz et al., Reference Cruz, Vuille, Burns, Wang, Cheng, Werner, Edwards, Karmann, Auler and Nguyen2009; Cheng et al., Reference Cheng, Sinha, Cruz, Wang, Edwards, d’Horta, Ribas, Vuille, Stott and Auler2013). During the mid-Holocene, when insolation levels were low and the south and west SASM region was drier, the northeast (nordeste) was wetter than at present (Fig. 3h). Mechanistically, this is most likely due to a weaker SASH and weaker convective activity in the core of the SASM region reducing the strength of the Nordeste Low and subsidence over the region (Cruz et al., Reference Cruz, Vuille, Burns, Wang, Cheng, Werner, Edwards, Karmann, Auler and Nguyen2009; Cheng et al., Reference Cheng, Sinha, Cruz, Wang, Edwards, d’Horta, Ribas, Vuille, Stott and Auler2013). Weaker ENSO activity during the mid-Holocene may also have reduced severe drought events in this region (Koutavas and Joanides, Reference Koutavas and Joanides2012; Wang et al., Reference Wang, Edwards, Auler, Cheng, Kong, Wang, Cruz, Dorale and Chiang2017). As insolation levels increase through the Holocene, the region becomes gradually drier, reaching approximately modern levels at ca. 4 ka. Reconstructing the paleovegetation history of this region in response to this sort of long-term precipitation change is of great interest, for example in terms of revealing important information about the potential connectivity between the Amazon and Atlantic rainforests (De Oliveira et al., Reference De Oliveira, Barreto and Suguio1999; Behling et al., Reference Behling, Arz, Pätzold and Wefer2000; Costa, Reference Costa2003; Batalha-Filho et al., Reference Batalha-Filho, Fjeldså, Fabre and Miyaki2013). However, a fundamental issue in this semi-arid region is the difficulty in finding permanent lake basins, bogs, or undisturbed locations for taking soil profiles that would provide suitable records for paleoecological study (De Oliveira et al., Reference De Oliveira, Barreto and Suguio1999; Pessenda et al., Reference Pessenda, Gouveia, Ribeiro, de, De Oliveira and Aravena2010).
The pollen record from the site Saquinho (id=34), taken in the Caatinga region in the Rio Icatu river valley, suggests that a more humid mid-Holocene may have promoted the expansion of palms and gallery forests at the expense of Caatinga/savannah vegetation. Between ca. 5 and 4.5 ka, the trend of increasing aridity in the region is marked by an increase in Caatinga and Cerrado taxa as well as a reactivation of dune activity shown by thermoluminescence data (De Oliveira et al., Reference De Oliveira, Barreto and Suguio1999). The Maranguape bog core taken from the Serra de Maranguape mountains on the north coast (id=28) records continuous forest cover through the mid- to late Holocene, though compositional changes in the pollen record suggest increased disturbance at ca. 4.5 ka, contemporaneous with the start of drier conditions in the northeast (Montade et al., Reference Montade, Ledru, Burte, Martins, Verola, da Costa and Silva2014).
However, other records in this region do not seem to reflect the more humid mid-Holocene in their paleovegetation reconstructions, though this is most likely due to the unique characteristics of their site locations. A transect of soil profiles on the Araripe Plateau in the central Caatinga region (ids=78–80) records gradual depletion of δ13C from the mid-Holocene to present, suggesting greater savannah extent before ca. 3.5–3 ka, after which forested areas increase. A transect of soil profiles on the east coast of Paraíba state (ids=76–77) also show some indications of more open vegetation in the mid-Holocene, with an increase in forest cover after ca. 3 ka. The modern rainforest enclaves on plateaus such as Araripe and on higher elevations near the coast are maintained by significant orographic rainfall derived from easterly winds that help mitigate against the arid conditions caused by the persistent subsidence (Andrade-Lima, Reference Andrade-Lima1982; Sampaio, Reference Sampaio1995). Even though this subsidence was likely reduced during the mid-Holocene, causing the region in general to become less arid, changes to low-level divergent circulation patterns and Walker cell dynamics may also have reduced the moist easterlies (Cruz et al., Reference Cruz, Vuille, Burns, Wang, Cheng, Werner, Edwards, Karmann, Auler and Nguyen2009) that helps maintain these plateau-based forests. Whilst these small plateaus and coastal areas can yield suitable sites, clearly they may not be representative of vegetation changes across the Caatinga on a regional scale. The site of Lagoa do Caçó (id=11) is located on the northernmost reach of the Cerrado savannah biome and records no major changes in the Cerrado vegetation through the mid- to late Holocene (Ledru et al., Reference Ledru, Ceccantini, Gouveia, López-Sáez, Pessenda and Ribeiro2006). The increase in gallery forests around the lake shown in the nearby soil pits may indicate increased moisture after ca. 4 ka, though it is difficult to say whether this is due to climate, natural vegetation succession, or sea level dynamics. The authors suggest that the location of this lake lies in a transitional area between the east-west climate zones and as such, precipitation changes may be fairly stable in contrast to the surrounding areas (Pessenda et al., Reference Pessenda, Ledru, Gouveia, Aravena, Ribeiro, Bendassolli and Boulet2005; Ledru et al., Reference Ledru, Ceccantini, Gouveia, López-Sáez, Pessenda and Ribeiro2006).
CONCLUSIONS
Our multi-proxy paleoecological data synthesis shows how the vegetation from different regions of tropical South America responded to orbitally forced long-term precipitation changes through the mid- to late Holocene (Cheng et al., Reference Cheng, Sinha, Cruz, Wang, Edwards, d’Horta, Ribas, Vuille, Stott and Auler2013; Baker and Fritz, Reference Baker and Fritz2015). The HETF biome of central and western Amazonia remained intact, even though paleoclimate records suggest that this region may have been slightly drier than present during the mid-Holocene. In eastern Amazonia, similar HETF stability is recorded, however the apparent mid-Holocene savannah expansion at the eastern Amazonian ecotone (from the Serra Sul dos Carajás plateau) is difficult to reconcile with new paleoclimate data from Paraíso cave that suggests this region was wetter than present at this time (Wang et al., Reference Wang, Edwards, Auler, Cheng, Kong, Wang, Cruz, Dorale and Chiang2017). The Paraíso cave record perhaps only reflects precipitation conditions from far northeast Amazonia, and is not representative of the location of Carajás in southeast Amazonia. Nearer to the southeastern Amazonian ecotone and the Carajás plateau, local lake level records appear to indicate lower lake productivity and water levels during the mid-Holocene, indicative of a drier climate (Cordeiro et al., Reference Cordeiro, Turcq, Suguio, Oliveira da Silva, Sifeddine and Volkmer-Ribeiro2008). Clearly, more investigation is needed in this area to reconcile local and regional paleoclimate and paleoecological records. The northeast of Brazil was wetter than present during the mid-Holocene, due to a suppression of the subsidence across the region resulting from a weaker SASM and SASH (Cruz et al., Reference Cruz, Vuille, Burns, Wang, Cheng, Werner, Edwards, Karmann, Auler and Nguyen2009). However, the lack of paleovegetation records means a regional interpretation of vegetation response is problematic.
Significant vegetation changes are recorded in southwest Amazonia and southeast Brazil. These regions are more reliant on SASM-derived precipitation and so vegetation here is likely to be especially susceptible to long-term changes in SASM strength. The vegetation reconstructions during a drier mid-Holocene show: a more northerly location of the HETF/SDF/SAV ecotone in northeastern Bolivia; greater expanse of campos grassland across the south Brazilian highlands; and decreased expanse of montane forests and HETF across the southern Atlantic forest region. As precipitation levels gradually rose through the mid- to late Holocene, vegetation responded as follows: progressive southward expansion of the HETF in northeast Bolivia from ca. 2 ka; expansion of Araucaria on the south Brazilian highlands from ca. 4 ka, with enhanced expansion from ca. 1.5–1 ka; expansion, or greater canopy density, of SDF in the Misiones and interior Atlantic forest regions; increase of gallery forests in the southeast Brazilian Cerrado. The difference in the timing of forest expansion between these two regions is probably due to the important extra-tropical source of precipitation that mitigates somewhat against a weaker SASM in southeast Brazil.
Whilst this synthesis includes more sites than previous studies, in part due to inclusion of non-pollen proxy reconstructions, it is clear that more sites are needed to help increase our understanding of long-term vegetation dynamics across the region. In southwest Amazonia, more sites could help to quantify the maximum extent of the HETF/SDF/savannah mid- to late Holocene ecotonal shift. We particularly highlight eastern Amazonia, northeast Brazil and the cerrado region of central Brazil as key areas that need more paleoecological data. We recognize that the paucity of suitable lake sites in these areas is a big hindrance to improving the regional coverage of pollen-based vegetation reconstructions. However, in such regions, where suitable lakes/bogs are scarce, soil-based proxies—such as δ13C isotopes and, in particular, phytoliths—which have hitherto been underutilized by the paleoecological community, show considerable potential for paleovegetation reconstruction (Dickau et al., Reference Dickau, Whitney, Iriarte, Mayle, Soto, Metcalfe, Street-Perrott, Loader, Ficken and Killeen2013; Watling et al., Reference Watling, Iriarte, Whitney, Consuelo, Mayle, Castro, Schaan and Feldpausch2016, Reference Watling, Iriarte, Mayle, Schaan, Pessenda, Loader, Street-Perrott, Dickau, Damasceno and Ranzi2017).
With regards to possible implications for future climate change, this study highlights that the ecosystems most vulnerable to long-term climate change are those that are already close to their climatic limits. However, given the resilience of the central Amazonian HETF biome to past climate change, future projections of widespread forest dieback across Amazonia (Cox et al., Reference Cox, Betts, Jones, Spall and Totterdell2000, Reference Cox, Betts, Collins, Harris, Huntingford and Jones2004) seem unlikely. It is important to point out that we have used the mid- to late Holocene as a period in which we can assess regional vulnerability to long-term climate changes, not as a direct analogue for a future drier climate. Factors such as temperature and CO2 levels will be significantly different between the future and the mid-Holocene, which will undoubtedly have an impact on vegetation responses (Rammig et al., Reference Rammig, Jupp, Thonicke, Tietjen, Heinke, Ostberg, Lucht, Cramer and Cox2010; Huntingford et al., Reference Huntingford, Zelazowski, Galbraith, Mercado, Sitch, Fisher and Lomas2013). In addition, huge anthropogenic pressures, such as widespread deforestation and uncontrolled burning, will only act to reduce the ability of vegetation to maintain local feedbacks and thus reduce overall ecosystem resilience (Laurance et al., Reference Laurance, Delamônica, Laurance, Vasconcelos and Lovejoy2000; Malhi et al., Reference Malhi, Roberts, Betts, Killeen, Li and Nobre2008; Levine et al., Reference Levine, Zhang, Longo, Baccini, Phillips, Lewis and Alvarez-Dávila2016).
ACKNOWLEDGMENTS
We thank Francisco Cruz and Bronwen Whitney, who provided paleoclimate data for Rio Grande do Norte and Laguna La Gaiba, respectively. Other speleothem data and insolation data were accessed online via the National Oceanic and Atmospheric Administration (NOAA) website: https://www.ncdc.noaa.gov/paleo. Tropical Rainfall Measuring Mission (TRMM) data (https://trmm.gsfc.nasa.gov) were processed by the TRMM Science Data and Information System (TSDIS) and the TRMM office and are archived and distributed by the Goddard Distributed Active Archive Center. RS was funded by a NERC ‘SCENARIO’ DTP PhD award. We thank Mark Bush for the invitation to submit a paper to this special issue of QR and are grateful for his comments, and those of two referees, which improved the manuscript.
SUPPLEMENTARY MATERIAL
To view supplementary materials referred to in this article, please visit https://doi.org/10.1017/qua.2017.89