


INTRODUCTION
The climate changes presently occurring result from the superposition of natural climatic processes and anthropogenic influences. Future hydrologic cycle changes and related extreme hydroclimatic events, including more frequent flooding and drought periods, are an urgent challenge (Hijioka et al., Reference Hijioka, Lin, Pereira, Corlett, Cui, Insarov, Lasco, Lindgren, Surjan, Barros, Field, Dokken, Mastrandrea, Mach, Bilir and Chatterjee2014). Based on limited instrumental records (e.g., precipitation and temperature) that cover the past 100 years at most, assessing the natural variability of the hydroclimate (in terms of frequency and magnitude) at decadal to centennial timescales is not possible, although such information is essential for predicting future hydroclimatic changes and their effects on human society. These past extreme hydroclimatic events have been recorded in fluvial sediments (Knox, Reference Knox1993, Reference Knox2006; Carson et al., Reference Carson, Knox and Mickelson2007; Huang et al., Reference Huang, Pang, Zha, Su, Jia and Zhu2007; Benito et al., Reference Benito, Thorndycraft, Rico, Sánchez-Moya and Sopeña2008; Lim et al., Reference Lim, Lee, Hong and Kim2013), suggesting that fluvial sediments can be useful archives in reconstructing past hydroclimate changes in various timescales.
In East Asia, flooding events are concentrated in the summer season and generally are related to heavy summer precipitation driven by rainfall front movement and typhoon-driven rainfall. In the past, monsoonal rainfall in various areas has been influenced by insolation-driven intertropical convergence zone (ITCZ) shifts (An, Reference An2000; Dykoski et al., Reference Dykoski, Edwards, Cheng, Yuan, Cai, Zhang, Lin, Qing, An and Revenaugh2005; Wanner et al., Reference Wanner, Beer, Bütikofer, Crowley, Cubasch, Flückiger and Goosse2008; Jo et al., Reference Jo, Woo, Lim, Cheng, Edwards, Wang and Jiang2011, Reference Jo, Woo, Yi, Yang, Lim, Wang, Cheng and Edwards2014; Sachs et al., Reference Sachs, Blois, McGee, Wolhowe, Haberle, Clark and Atahan2018; S. Park et al., Reference Park, Lim and Lim2019; Lee et al., Reference Lee, Yi, Lim, Kim, Jo and Kim2020). For example, the gradual decreasing trend in Asian and Indian summer monsoons during the Holocene has been attributed to decreasing insolation and the resulting southward shift in the ITCZ. As shown in Figure 1, ITCZ moved southward from 6 ka to the present over East Asia and the eastern equatorial area; Walker circulation strengthened and El Niño-Southern Oscillation (ENSO) activity increased over the same period (Wanner et al., Reference Wanner, Beer, Bütikofer, Crowley, Cubasch, Flückiger and Goosse2008). During El Niño years, more typhoons form in the southeastern part of the western Pacific and their tracks tend to recurve farther north, resulting in more frequent landfalls in Korea and Japan. In contrast, during La Niña years, typhoons form slightly to the west of those during El Niño years, including in the South China Sea, and follow a straight track toward South China and Southeast Asia (Elsner and Liu, Reference Elsner and Liu2003; Woodruff et al., Reference Woodruff, Donnelly and Okusu2009; Williams et al., Reference Williams, Choowong, Phantuwongraj, Surakietchai, Thongkhao, Kongsen and Simon2016).

Figure 1. Map of monthly precipitation anomalies during El Niño years between 1979 and 2006 CE (data source: http://research.jisao.washington.edu/data/gpcp/). During El Niño years, rainfall is greater in southern Korea, western and central Japan, and South China. a = Nakdong River (core DSR09), South Korea (this study); b = Dongge Cave, South China (Dykoski et al., Reference Dykoski, Edwards, Cheng, Yuan, Cai, Zhang, Lin, Qing, An and Revenaugh2005); c = sea surface temperature (SST) reconstructed from the western tropical Pacific (Stott et al., Reference Stott, Cannariato, Thunell, Huag, Koutavas and Lund2004); d = Lake Palcacocha (4,060 m), equatorial Andes (Moy et al., Reference Moy, Seltzer, Rodbell and Anderson2002); e = Cariaco Basin (Haug et al., Reference Haug, Hughen, Sigman, Peterson and Rohl2001); f = T-Lake, Palau (Sachs et al., Reference Sachs, Blois, McGee, Wolhowe, Haberle, Clark and Atahan2018); g = Mg/Ca-based SST in subpolar North Atlantic (Farmer et al., Reference Farmer, Chapman and Andrews2008).
Previous studies have revealed that changes in heavy rainfall are significantly positively correlated with ENSO activity at multi-centennial to millennial timescales (Liu et al., Reference Liu, Shen and Louie2001; Woodruff et al., Reference Woodruff, Donnelly and Okusu2009; Williams et al., Reference Williams, Choowong, Phantuwongraj, Surakietchai, Thongkhao, Kongsen and Simon2016; Lim et al., Reference Lim, Lee, Hong, Park, Lee and Yi2019; Lee et al., Reference Lee, Yi, Lim, Cho, Kim and Jo2021). To elucidate future hydroclimatic changes, understanding short-term variability (e.g., decadal to centennial cycles) is essential. To achieve this, more detailed investigations are needed to obtain high-resolution data.
Recently, to trace climatic variability, X-ray fluorescence (XRF) core scanning has been applied extensively to sedimentary cores from various environments, including ocean and land, to obtain high-resolution data. This method is characterized by its non-destructive, rapid, semi-quantitative measurement of the elements present in sediments, which supports high-resolution (<1 cm) observations. Previous studies have suggested that elemental ratios are useful proxies of past environmental and climatic processes that can overcome the influence of physical factors such as water content, grain size, and organic matter on XRF counts (e.g., Weltje and Tjallingii, Reference Weltje and Tjallingii2008; Löwemark et al., Reference Löwemark, Chen, Yang, Kylander, Yu, Hsu, Lee, Song and Jarvis2011; Constantinescu et al., Reference Constantinescu, Toucanne, Dennielou, Jorry, Mulder and Lericolais2015). For example, Ti/Al ratios have been used as proxies for continental weathering and erosion based on differences in their mobility levels (Tian et al., Reference Tian, Xie, Ma, Jin and Wang2011) and for changes in freshwater input in terms of heavy rainfall in East Asia (Lim et al., Reference Lim, Lee, Hong, Park, Lee and Yi2019). The Zr/Al ratio has been used as a proxy for ocean current strength in the Gulf of Cádiz, based on the possible influence of transport processes on sediment composition (Bahr et al., Reference Bahr, Jiménez-Espejo, Kolasinac, Grunert, Hernández-Molina, Röhl and Voelker2014). Such studies have successfully reconstructed high-resolution climatic fluctuations and their driving factors, confirming the applicability of the XRF core scanning method.
In this study, using fluvial sediments, we established a high-resolution hydroclimate index for East Asia, based on XRF core scanning of elemental ratios (e.g., Zr/Ti, Zr/Si, and Zr/Rb) in lithogenic components transported by rainfall events, to identify decadal to centennial periodicities, and evaluated their behaviors in terms of frequency changes and possible controlling factors, including past sea surface temperature (SST) and ENSO activity.
STUDY AREA AND METHODS
Study area and coring site (DSR09)
From a global perspective, the southern part of the Korean Peninsula has relatively high annual precipitation due to its location (the margin of the northwest Pacific Ocean), with a slight increase in annual precipitation occurring during El Niño years in the period 1979–2006 (Fig. 1). The Nakdong River is the second longest river (523 km) in Korea and flows from the Taebaek Mountains to the southwest coast, draining into the Namhae (Korea Strait) (Fig. 2). Its catchment area is ~23,000 km2. Extensive agricultural areas and industrial complexes are present throughout the drainage basin. The study area is within the middle reach of the Nakdong River; the coring site (core DSR09, 35°39′51.82″N, 128°22′38.42″E, 17.8 m in elevation) was selected based on a comparison between past and present maps of the river channel's location. The coring site, situated on a floodplain and back swamp, has been used for cultivation after reclamation. In 2013, 23-m long sediment cores were recovered using a drilling machine, with a recovery rate of ~90% (Korea Institute of Geoscience and Mineral Resources, 2013; Lim et al., Reference Lim, Lee, Hong, Kim, Yi and Nahm2017).

Figure 2. (A) Study area within the middle reach of the Nakdong River, which flows from the Taebaek Mountains to the southwest coast, draining into the Namhae (Korea Strait). (B) Coring site (DSR09) shown on a recent aerial image from Daum Maps (https://map.kakao.com/); star indicates location of Hyeonpung gauging station. (C) Passage of Typhoon Maemi (4–12 September, 2003) from the Typhoon Research Center. (D) Discharge and water-level changes at Hyeonpung gauging station (zero elevation: 8.414 m) during the Typhoon Maemi event (source: Korea Water Resources Corporation). (A–D) Modified from Lim et al., Reference Lim, Lee, Hong, Kim, Yi and Nahm2017.
At present, the climate in the study area is characterized by two seasonal wind patterns, known as the East Asian summer and winter monsoons. The East Asian monsoonal precipitation and typhoon-driven rainfall are responsible for summer rainfall (June to September), which accounts for 70% of annual precipitation (~1,100 mm). Frequently, typhoon-driven heavy rainfall causes severe flooding events in the Nakdong River and surrounding areas. For example, Typhoon Maemi in 2003 (Fig. 2) was the worst typhoon to hit South Korea in recent decades. As shown in Figure 2D, discharge on September 12 at the Hyeonpung gauging station (zero elevation: 8.414 m), which is located in the middle reach of the Nakdong River, was greater than 10,000 m3/s, resulting in major inundation and an increase in water level >12 m (Fig. 2). In the study area, the DSR09 coring site was submerged under at least 2–3 m of water during Typhoon Maemi in 2003.
XRF core scanning
In a previous study, we reported the results of radiocarbon dating (Fig. 3), analyses of grain size (e.g., median grain size and sand %), and stable carbon isotope (δ13C) values of HCl-treated subsamples at an interval of 10 cm (Lim et al., Reference Lim, Lee, Hong, Kim, Yi and Nahm2017). To compensate for the low resolution of this dataset, we performed high-resolution measurements (3-mm interval) of lithogenic elements in the sedimentary core (DSR09). To obtain semi-quantitative elemental information, XRF analysis of the cores (5–15 m depth interval) was performed using an ITRAX core scanner (Cox Analytical Systems, Sweden) at the Korea Institute of Geoscience and Mineral Resources. This device allows for non-destructive extraction of near-continuous records of variations in elemental concentrations from sediment cores (Croudace et al., Reference Croudace, Rindby and Rothwell2006; Löwemark et al., Reference Löwemark, Chen, Yang, Kylander, Yu, Hsu, Lee, Song and Jarvis2011). Measurements were performed at 35 kV and 35–40 mA using a Mo-tube with a scanning time of 10 s and resolution of 3 mm. The peak intensity of each element (e.g., Ti, Si, Sr, and Zr) was expressed as counts per second (cps). To test the correlation between the low-resolution dataset (sand %, silt %, and δ13CTOC values) and high-resolution elemental ratios (Zr/Ti, Si/Ti, and Sr/Si), a multi-correlation test was performed using the R language.

Figure 3. (A) Photograph of core DSR09 and the XRF core scanning interval (rectangle outlined by dashed line, 6–14 m depth) from the middle reach of the Nakdong River, Korea, along with radiocarbon dating results (yellow numbers = cal yr BP from Lim et al., Reference Lim, Lee, Hong, Kim, Yi and Nahm2017). (B) Comparison between changes in low-resolution sand content (%) measured at 10-cm intervals and high-resolution Zr/Ti ratios measured with XRF core scanner at 3-mm intervals.
Spectral analysis
Spectral analysis of elemental ratios (e.g., Zr/Ti) was conducted using REDFIT software (Schulz and Mudelsee, Reference Schulz and Mudelsee2002) to test for possible periodicity at decadal to millennial timescales. REDFIT based on the Lomb-Scargle Fourier transform allows direct processing of unevenly spaced time series and the usual prerequisite of data interpolation is not required. Furthermore, this process provides estimation of the red-noise spectrum to identify significant frequencies. Spectral analysis was performed with the following conditions: an oversampling factor of 4 for the Fourier transform, 2 segments with a 50% overlapping, and a Welch window-type. Red-noise spectrum of 80% was selected to highlight significant frequencies (Schulz and Mudelsee, Reference Schulz and Mudelsee2002). Furthermore, to trace possible changes in frequencies within a time series, wavelet analysis was performed using the R package ‘biwavelet’ (Gouhier et al., Reference Gouhier, Grinsted and Simko2021). For this analysis, the detrended Zr/Ti ratios were resampled at a 3-year interval using the ‘approx’ function in R package ‘stats’, and the morlet mother wavelet transform was applied (R Core Team, 2020).
RESULTS AND DISCUSSION
High-resolution flooding index
As shown in Figures 3 and 4, based on radiocarbon dating, the sedimentary core (DSR09) recovered from a distant floodplain and back swamp was deposited during the early to late Holocene. Visual comparison of the profiles of low-resolution sand percentage and high-resolution Zr/Ti ratio data shows a good correlation and clear decadal variability in the Zr/Ti ratios (Fig. 3B).
To evaluate the possible relationship between these elemental ratios and past flooding events (Figs. 4, 5), we calculated correlation coefficients among them. The ratio of two terrestrial elements (Zr and Ti; heavy minerals) shows a strong positive correlation with flooding-transported sand content (r = 0.89). The Zr/Ti ratio is also negatively correlated with δ13C values (r = −0.82). The δ13C values of total organic carbon in the sedimentary cores represent past vegetation changes, suggesting that more enriched values indicate increase in C4 plants (e.g., grasses) under dry climates (Lim et al., Reference Lim, Lee, Hong, Kim, Yi and Nahm2017). These correlations demonstrate that, among elemental ratios, Zr/Ti ratios are strongly controlled by flooding events (Fig. 5).

Figure 4. Comparison between lithological units and geochemical features. Radiocarbon dates (open circles with error ranges represent age-dating samples from the sedimentary layers of the cores; SR = sedimentation rate), sand fraction (sand %), and carbon isotope values (δ13C) for total organic carbon from fluvial sediments (core DSR09) collected in the middle reach of the Nakdong River, South Korea (from Lim et al., Reference Lim, Lee, Hong, Kim, Yi and Nahm2017). Depth profiles of elemental ratios (Sr/Si, Zr/Ti, and Si/Ti) measured at 3-mm intervals via XRF core scanning in this study are shown.

Figure 5. Results of correlation analysis among elemental ratios (Sr/Si, Zr/Ti, Si/Ti, and Sr/Si ratios) measured via the XRF core scanner, sand (%), and δ13CTOC values in sedimentary core DSR09 (6.2–14 m depth) from the middle reach of the Nakdong River, Korea.
These strong correlations are apparent in the time series of each elemental ratio (Fig. 6). In a previous study (Lim et al., Reference Lim, Lee, Hong, Kim, Yi and Nahm2017), we reconstructed past flooding variability at millennial timescales in the Nakdong River based on grain size and geochemical proxies. As shown in Figure 6, sand content (%) was negatively correlated with δ13C values of total organic carbon and showed significant fluctuations, suggesting several clusters of frequent flooding events (e.g., at 2900–3400 cal yr BP, 3600–3900 cal yr BP, 4600–5300 cal yr BP, and 5800–6400 cal yr BP). These fluctuations are reflected in the time series of Zr/Ti, Si/Ti, and Sr/Si ratios, which also show high-frequency fluctuations, indicating that these ratios are controlled by past flooding events and related climate changes. Based on the test of correlation analysis and visual comparison, it is clear that Zr/Ti ratios can be used as a high-resolution hydroclimate index for Nakdong River catchment areas, compensating for the low-resolution sand percentage and δ13C values.

Figure 6. Comparison among the time series of elemental ratios (this study), grain size, and δ13CTOC values (from Lim et al., Reference Lim, Lee, Hong, Kim, Yi and Nahm2017). Zr/Ti, Si/Ti, and Sr/Si ratios in sedimentary core DSR09 from the middle reach of the Nakdong River, Korea, were measured via the XRF core scanner at 3-mm intervals (this study).
Human activity as a generator of flooding, or at least as an enhancer of flood events, during the middle to late Holocene needs to be considered. Recent studies have tested the possible relationship between population and climate change during the early to late Holocene (Oh et al., Reference Oh, Conte, Kang, Kim and Hwang2017; Park et al., Reference Park, Park, Yi, Lim, Kim, Jin and Choi2021). Based on the comparison between pollen analyses from Miryang area in Korea and summed probability distributions of radiocarbon dates from archeological sites in Korea as a proxy for change in population levels, Park et al. (Reference Park, Park, Yi, Lim, Kim, Jin and Choi2021) suggested that dry periods correspond to lower population levels during the early to late Holocene and that human societies were vulnerable to climate changes. Despite this climatic influence on human activity, it seems difficult to separate the human role (e.g., through deforestation) as a trigger of flooding from natural climate changes in detail due to lack of case studies showing human activity and resultant flooding events during the early to late Holocene. This study provides natural hydroclimate variability along the upper and middle reaches of the Nakdong River. Human activity along the Nakdong River, which will be reconstructed in the near future, can be tested in terms of social response to past extreme hydroclimate variability (e.g., flooding and drought events) reconstructed in this study. In the following section, we focus on tracing natural hydroclimate variability and its possible causes.
Hydro-climatic Extreme event changes in the upper and middle reaches of the Nakdong River, during the middle to late Holocene
Past hydroclimatic changes reflected in the time series of Zr/Ti ratios show clear decadal to millennial fluctuations, with significant swings between Nakdong extreme flooding events (NEF events: 2000, 2300, 3200, 3800, 5000, 6000, and 7200 cal yr BP) and decreased flooding events in the upper and middle reaches of the Nakdong River (Fig. 7A, B). Similar hydroclimatic changes have been reported based on grain size and geochemical index values from the Gimpo wetland, central Korea (Lim et al., Reference Lim, Yang, Lee, Hong and Um2015). As shown in Figure 7C, marked increases in total organic carbon levels (%) occurred at 5000 and 6000 cal yr BP, in accordance with depleted δ13C values (Fig. 7D), suggesting wetter climatic conditions and resultant increased water levels in the wetland at those times. These wet periods correspond to the NEF events at 5000 and 6000 cal yr BP, respectively. Such synchronous events may be driven by common factors that are responsible for the apparent quasi-1000 year hydroclimatic variations in Korea. Furthermore the time series of Zr/Ti ratios during the period of 3000 to ca. 1700 cal yr BP resembles that of sand percentage in sedimentary cores collected from the floodplain of the Yugu River, one of the tributaries of the Keum River, central South Korea (Lim et al., Reference Lim, Lee, Hong and Kim2013), suggesting that the time series of Zr/Ti ratios may be used as an indicator for past flooding events over South Korea.
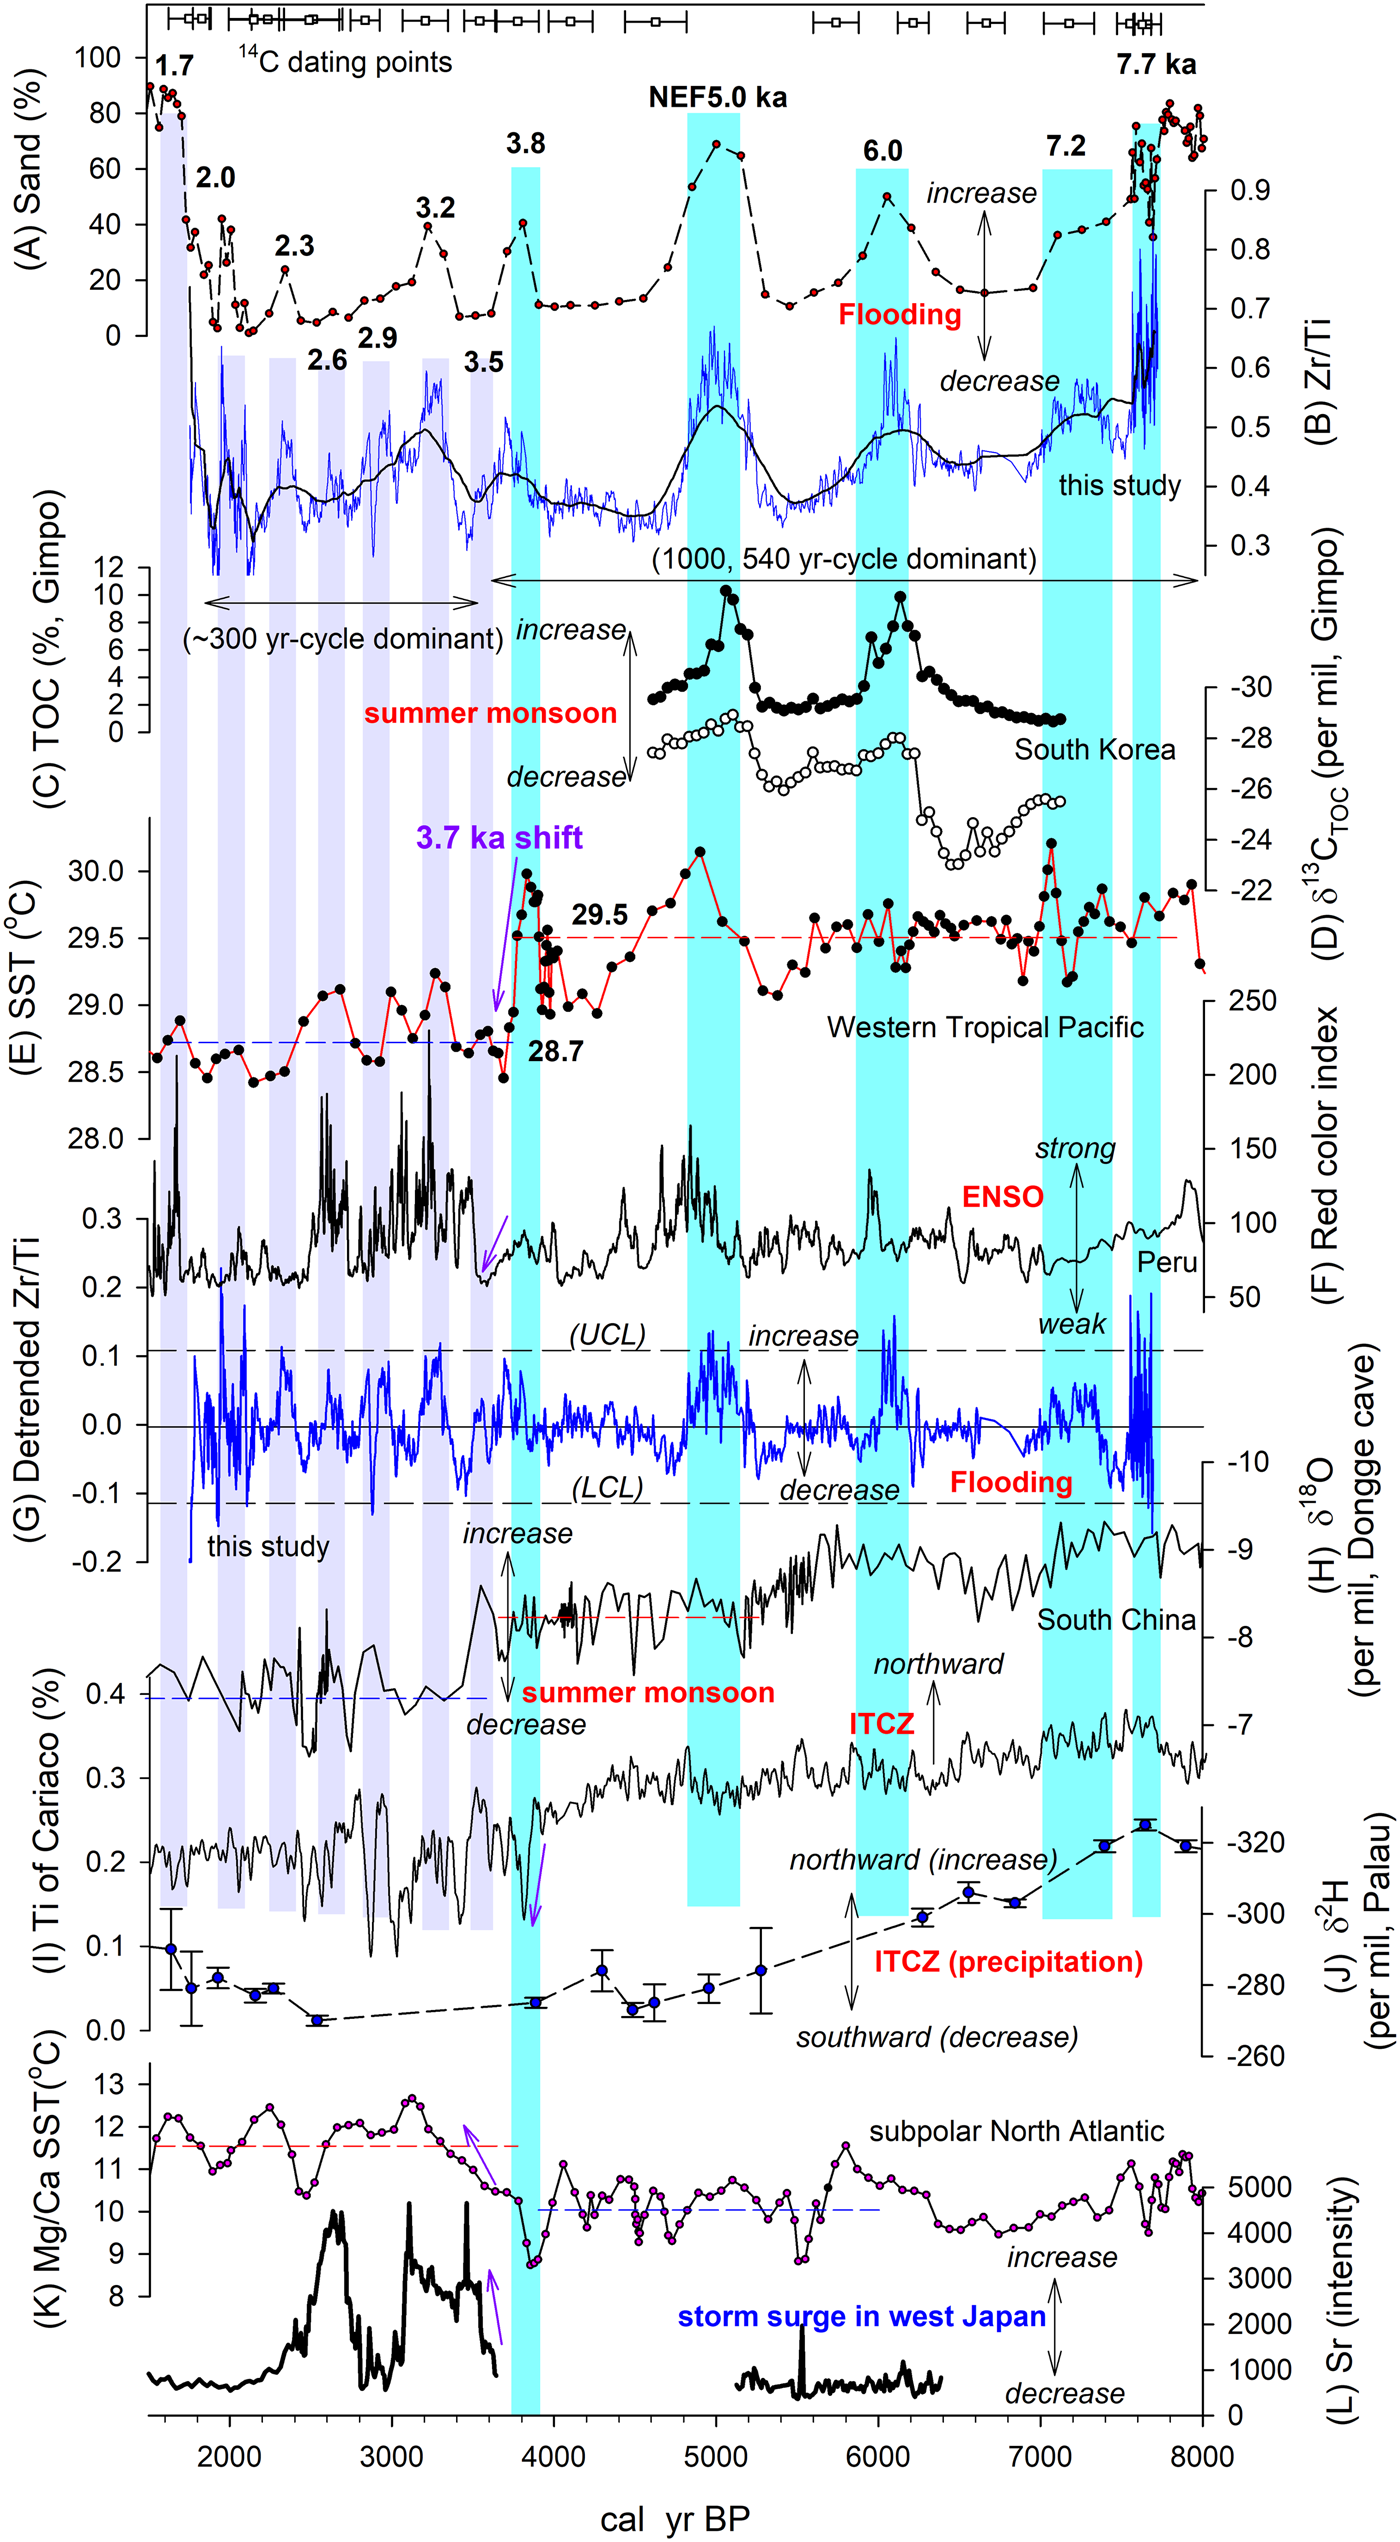
Figure 7. Comparison of high-resolution hydroclimatic changes recovered from core DSR09 in the middle reach of the Nakdong River, South Korea, with other reconstructed climate changes. The circles with error ranges at the top of the figure represent dating points in core DSR09 (Lim et al., Reference Lim, Lee, Hong, Kim, Yi and Nahm2017). The vertical shaded bars represent Nakdong extreme flooding (NEF) events. (A) Sand (%) from core DSR09 in the middle reach of the Nakdong River, South Korea (Lim et al., Reference Lim, Lee, Hong, Kim, Yi and Nahm2017). (B) Zr/Ti ratios measured via the XRF core scanner from core DSR09 (this study); solid-line superimposed on the Zr/Ti ratios represents the 99-point running average. (C, D) Total organic carbon (%) and δ13CTOC changes from Gimpo wetland, central Korea (Lim et al., Reference Lim, Yang, Lee, Hong and Um2015). (E) Sea surface temperature (SST) changes in the western Pacific Ocean during the Holocene (Stott et al., Reference Stott, Cannariato, Thunell, Huag, Koutavas and Lund2004). (F) Red color index, a proxy for past ENSO activity (Moy et al., Reference Moy, Seltzer, Rodbell and Anderson2002). (G) Detrended Zr/Ti ratios from core DSR09 (this study); UCL and LCL (long-dashed lines) represent upper control limit and lower control limit, respectively, showing two standard deviations from the center line (solid line). (H) Asian summer monsoon index based on oxygen isotope data from stalagmites in Dongge Cave, South China (Dykoski et al., Reference Dykoski, Edwards, Cheng, Yuan, Cai, Zhang, Lin, Qing, An and Revenaugh2005). (I) Intertropical convergence zone (ITCZ) index reconstructed from the Ti (%) of marine sediments in the Cariaco Basin (Haug et al., Reference Haug, Hughen, Sigman, Peterson and Rohl2001). (J) δ2H values of dinosterol in T-Lake sediment core PTLNPC1, Palau (Sachs et al., Reference Sachs, Blois, McGee, Wolhowe, Haberle, Clark and Atahan2018). (K) Mg/Ca-based SST in subpolar North Atlantic (Farmer et al., Reference Farmer, Chapman and Andrews2008). (L) Sr intensity (a proxy for storm surge-driven coastal inundation) changes determined by analysis of coastal lake sediments on the island of Kamikoshiki, west Japan (Woodruff et al., Reference Woodruff, Donnelly and Okusu2009).
To emphasize decadal to centennial variability, we removed the long-term trend by subtracting the 99-point running average from the Zr/Ti ratio values (Fig. 7B). As shown in Figure 7G, detrended Zr/Ti ratios show high variability and exhibit time-varying amplitude changes. This result indicates clear changes in frequency and amplitude. For example, during the period of 7700–3700 cal yr BP, the detrended Zr/Ti ratios fluctuated at a millennial scale, as shown by the strong peaks at 7300, 6000, 5000, and 3800 cal yr BP, whereas the subsequent period of 3700–1700 cal yr BP is characterized by shorter centennial-scale variability, with increased amplitudes represented by peaks at 3300, 2900, 2600, 2300, and 2000 cal yr BP.
Spectral analysis supports this visual observation. Spectral analysis over the period 7700–1700 cal yr BP provides a broad range of periodicity (1000, 570, 440, 300, 145, 125, 110, 75, 60, 40, and 35 years) (Fig. 8A). However, spectral analysis over different time periods showed different cycles. During the period 7700–3500 cal yr BP (Fig. 8B), the dominant periodicities were 950, 540, 400, 300, 65, 45, 30, and 24 years, whereas the temporal changes in detrended Zr/Ti ratios during the period 3700–1700 cal yr BP consisted of shorter centennial to decadal cycles (320, 110–120, and 60–75 years) (Fig. 8C). Interestingly, beginning in the late Holocene, longer cycles (e.g., 950, 540, 400 years) disappeared. This significant change in periodicities can be found in the result of the wavelet analysis, which helps to understand possible change in periodicity within a time series. As shown in Figure 9, the thick black lines showing the 95% confidence level clearly demonstrate that dominant periodicity of 1000 to ca. 500 yr shifted to shorter centennial-scale periodicity at ca. 3700 cal yr BP.

Figure 8. Results of spectral analysis of the time series of Zr/Ti ratios from sedimentary core DSR09 in the middle reach of the Nakdong River, South Korea, using REDFIT software (Schulz and Mudelsee, Reference Schulz and Mudelsee2002). (A) 1700–7700 cal yr BP, (B) 1700–3700 cal yr BP, (C) 3700–7700 cal yr BP.

Figure 9. Results of wavelet analysis of the time series of Zr/Ti ratios from sedimentary core DSR09 in the middle reach of the Nakdong River, South Korea, using the R package ‘biwavelet’ (Gouhier et al., Reference Gouhier, Grinsted and Simko2021). White arrow indicates that dominant periodicities of 1000 to ca. 500 yr shifted to shorter centennial-scale periodicities at ca. 3700 cal yr BP.
Late Holocene climatic shift based on changes in flooding patterns and its global links
Previous studies have reported that oceanic forcing, ITCZ shifts, and ENSO activity are the main modulators of hydroclimatic changes over East Asia (Dykoski et al., Reference Dykoski, Edwards, Cheng, Yuan, Cai, Zhang, Lin, Qing, An and Revenaugh2005; Jo et al., Reference Jo, Woo, Yi, Yang, Lim, Wang, Cheng and Edwards2014; Park et al., Reference Park, Shin and Byrne2016, Reference Park, Han, Jin, Bahk and Yi2017; Lim et al., Reference Lim, Lee, Hong, Park, Lee and Yi2019). As shown in Figure7, long-term variations in hydroclimate in the study area appear to be correlated with SST changes in the tropical western Pacific Ocean (Fig. 7E) (Stott et al., Reference Stott, Cannariato, Thunell, Huag, Koutavas and Lund2004). For example, the NEF events at 3200, 3800, 5000, 6000, and 7200 cal yr BP over Nakdong River middle catchment areas correspond to periods of high SST. During the period 5200–4900 cal yr BP, including the NEF event at 5000 cal yr BP, SST increased from 29°C to 30.2°C, and the hydroclimate of the study area shifted to a period of greatly intensified flooding that lasted for at least 300 years. Furthermore, this flooding period in the Nakdong River appears to have been coupled with intensified ENSO activity, represented by an increase in the red color index, an ENSO indicator based on red clastic sediments deposited during El Niño events at Laguna Pallcacocha, southern Ecuador (Moy et al., Reference Moy, Seltzer, Rodbell and Anderson2002) (Fig. 7F). Another NEF event at 3800 cal yr BP also was connected to strong ENSO activity.
Interestingly, a marked change in SST occurred at ca. 3700 cal yr BP. As shown in Figure 7E, the average SST was 29.5°C during 7700–3700 cal yr BP and decreased to 28.7°C in the subsequent period (3700–1700 cal yr BP) (Stott et al., Reference Stott, Cannariato, Thunell, Huag, Koutavas and Lund2004). Recently, similarly rapid SST falling by ~3°C from ca. 3850 years BP to ca. 3750 years BP has been reported from the South China Sea based on Sr/Ca ratios and δ18O records with the annual resolution extracted from four fossil corals (Xiao et al., Reference Xiao, Deng, Liu, Chen, Guo, Zhao, Zeng and Wei2021). This change appears to have been related to intensified ENSO activity, which caused changes in the frequency and amplitude of flooding events in the Nakdong River. The centennial-scale variability (320-year periodicity) in the residual Zr/Ti ratios align well with SST fluctuations during the late Holocene.
This study clearly demonstrates that a significant climatic shift occurred at ca. 3700 cal yr BP, which affected the hydroclimate over East Asia by altering the frequency and amplitude of hydrological events (Fig. 7G). Similar climatic shifts during the late Holocene can be observed in numerous areas. As shown in Figure 7H, the Asian summer monsoon index, reconstructed using oxygen isotope values of stalagmites in Dongge Cave, South China, shows a remarkable shift at ca. 3500 cal yr BP from relatively high precipitation to low rainfall periods with increased amplitudes at centennial timescales (Dykoski et al., Reference Dykoski, Edwards, Cheng, Yuan, Cai, Zhang, Lin, Qing, An and Revenaugh2005). A similar climatic change has been determined from Holocene precipitation changes in the lower reaches of the Yangtze River (Li et al., Reference Li, Li, Zheng, Yu, Tang, Li and Cui2018; Lu et al., Reference Lu, Dodson, Zhang and Yan2019). Compared to the early to middle Holocene, which had ~20–30% higher precipitation than the present, the climate in the lower reaches of the Yangtze River during the late Holocene (since 4200 cal yr BP) is cool, dry, and characterized by strong seasonality and strong fluctuations at the multi-centennial timescale.
Similar climatic responses can be observed in far remote areas. In subtropical eastern Australia, based on a quantitative precipitation record derived from lake sediments, the time series of reconstructed summer precipitation clearly demonstrated that the generally wet climate during the middle Holocene shifted toward drier and more variable conditions after 3200 cal yr BP, primarily driven by increasing frequency and strength of ENSO activity (Barr et al., Reference Barr, Tibby, Leng, Tyler, Henderson, Overpeck and Simpson2019). This series of responses also was reflected in precipitation changes in the Cariaco Basin at 3700 cal yr BP, which showed a stepwise decrease in rainfall and southward shift of the ITCZ (Fig. 7I) (Haug et al., Reference Haug, Hughen, Sigman, Peterson and Rohl2001). A similar southward shift in the ITCZ over the tropical Pacific during the middle to late Holocene was reported from change in hydrogen isotope ratios (δ2H values) of the algal lipid dinosterol from marine lake sediments in Palau (Sachs et al., Reference Sachs, Blois, McGee, Wolhowe, Haberle, Clark and Atahan2018) (Fig. 7J).
This climatic shift does not appear to be limited to low and middle latitudes. As shown in Figure 7K, SST changes in the subpolar North Atlantic were characterized by a significant shift ca. 3500 cal yr BP, with another stepwise increase following long-term warming during the Holocene. The subpolar area shows a clear temperature increase at ca. 3500 cal yr BP (Farmer et al., Reference Farmer, Chapman and Andrews2008). A similar shift in sea-surface conditions was found in diatom data from a marine sediment core, East Antarctica, suggesting that the early to mid-Holocene was warmer than the late Holocene, with a transition at ca. 4000 cal yr BP (Crosta et al., Reference Crosta, Debret, Denis, Courty and Ther2007).
Possible mechanism driving the shift in the Late Holocene climate regime at 3.7 cal yr BP
Significant climate changes clearly occurred ca. 4500–3500 cal yr BP, at the beginning of the late Holocene, despite regional differences (Cullen et al., Reference Cullen, Demenocal, Hemming, Hemming, Brown, Guilderson and Sirocko2000; Wu and Liu, Reference Wu and Liu2004; Shao et al., Reference Shao, Wang, Cheng, Kong, Wu and Edwards2006; Liu and Feng, Reference Liu and Feng2012; Luo et al., Reference Luo, Zhang, Yang, Yin and Shu2015; Li et al., Reference Li, Li, Zheng, Yu, Tang, Li and Cui2018; J. Park et al., Reference Park, Park, Yi, Kim, Lee and Choi2019; Jia et al., Reference Jia, Li, Lee, Liu, Lu, Hu, Sun and Zhao2021; Zhao et al., Reference Zhao, Tan, Yang, Perez-Mejias, Brahim, Lan and Wang2021). For example, in East Asia, this climatic shift is considered as an antecedent of the collapse of Neolithic cultures, such as the Liangzhu Culture (Wu and Liu, Reference Wu and Liu2004). Previous research clearly revealed a climatic anomaly superimposed on the middle Holocene transition. This hydrological regime shift caused spatially asynchronous responses, including frequent droughts in North China and frequent flooding in South China (Wu and Liu, Reference Wu and Liu2004). A similar social collapse that was reported in Mesopotamia was based on a sediment core from the Gulf of Oman. Cullen et al. (Reference Cullen, Demenocal, Hemming, Hemming, Brown, Guilderson and Sirocko2000) suggested that the collapse of the Akkadian Empire in ca. 4170 cal yr BP was caused by a sudden shift to more arid conditions, known as Mesopotamian aridification. Similarly, the late Holocene climate shift appears to have affected human activity sufficiently to cause declines in cultures.
Possible mechanisms underlying this late Holocene climate shift can be inferred based on changes in amplitude and periodicity of the hydroclimate reconstructed in this study. As shown in Figure 8E, the significant SST decreases, for example ~1.5°C within 100 years in the western tropical Pacific at 3700 cal yr BP (Stott et al., Reference Stott, Cannariato, Thunell, Huag, Koutavas and Lund2004) and ~3°C within 100 years in the South China Sea (Xiao et al., Reference Xiao, Deng, Liu, Chen, Guo, Zhao, Zeng and Wei2021), and marked increase in the subpolar North Atlantic at 3500 cal yr BP, were closely followed by hydroclimatic shifts in East Asia, leading to reduced precipitation in South China (Dykoski et al., Reference Dykoski, Edwards, Cheng, Yuan, Cai, Zhang, Lin, Qing, An and Revenaugh2005) and the central part of South Korea (this study). However, as demonstrated by the detrended Zr/Ti ratios, the frequency and amplitude of these changes apparently increased at that time. A similar pattern of decreased precipitation and increased amplitude can be found in the hydroclimatic changes of the Cariaco Basin at 3700 cal yr BP, which showed a stepwise decrease in rainfall and southward shift of the ITCZ (Haug et al., Reference Haug, Hughen, Sigman, Peterson and Rohl2001). The present study clearly demonstrates that this late Holocene climatic shift was influenced by the southward shift of the ITCZ, coupled with intensified ENSO activity driven by significant global atmospheric-oceanic circulation changes, supporting the findings of previous studies.
Furthermore, this hydroclimatic shift over Korea appears to have been influenced by changes in typhoon tracks over East Asia (Liu et al., Reference Liu, Shen and Louie2001; Elsner and Liu, Reference Elsner and Liu2003; Woodruff et al., Reference Woodruff, Donnelly and Okusu2009; Park et al., Reference Park, Shin and Byrne2016; Lim et al., Reference Lim, Lee, Hong, Kim, Yi and Nahm2017, Reference Lim, Lee, Hong, Park, Lee and Yi2019). Based on the time series of Sr intensity (a proxy for storm surge-driven coastal inundation), changes obtained from coastal lake sediments on the island of Kamikoshiki (Lake Namakoike and Lake Kaiike), Woodruff et al. (Reference Woodruff, Donnelly and Okusu2009) reconstructed possible spatial changes in past typhoon tracks over East Asia during the middle to late Holocene. They found that periods of past barrier breaching are concurrent with strong ENSO activity, and attributed the increase in frequency of recurving tracks that carry typhoons toward west Japan to strong ENSO activity. As shown in Figure 7L, changes in Sr intensity and ENSO activity show similar patterns, with relatively low levels during the middle Holocene. In particular, the increase of Sr intensity ca. 3700 cal yr BP appears to be coupled with increased ENSO activity, suggesting increased typhoon effects since that time. As shown in Figure 7, changes in the detrended Ti/Al ratios in Korea during the late Holocene were similar to Sr intensity changes in Kamikoshiki (Japan) and reflect ENSO activity. This similarity suggests that the increase in flooding events in the East Asia region might have been influenced by typhoon-driven heavy rains associated with increased El Niño activity. Notably, it is impossible to separate heavy rainfall driven by typhoons from heavy summer monsoonal rainfall. However, the similar patterns of change suggest that a link between typhoon and ENSO activity should be considered a driver of hydroclimatic changes, at least over parts of East Asia, including Korea and Japan.
The present study explored possible triggers of the global atmospheric-oceanic circulation changes responsible for the late Holocene climate shift. A marked change occurring with the late Holocene climatic shift was the disappearance of long-term periodicities, as shown by the results of spectral analysis. During the period 7700–3700 cal yr BP, the dominant periodicities were 950, 540, 400, 300, 65, 45, 30, and 24 years, whereas the temporal changes in residual Zr/Ti ratios during the subsequent period of 3700–1700 cal yr BP consisted of shorter centennial to decadal cycles (320, 110–120, and 60–75 years) (Figs. 8, 9). Notably, the period 3,700–1,700 cal yr BP, with high-amplitude fluctuations, corresponded to a period of relatively weak East Asian monsoon, as illustrated by increased δ18O values in Dongge Cave (Fig. 7H) (Dykoski et al., Reference Dykoski, Edwards, Cheng, Yuan, Cai, Zhang, Lin, Qing, An and Revenaugh2005). This period was characterized by a marked 320-year cycle (this study). A similar pattern was found in the latitudinal shift of the ITCZ (Fig. 7I, J) (Haug et al., Reference Haug, Hughen, Sigman, Peterson and Rohl2001; Sachs et al., Reference Sachs, Blois, McGee, Wolhowe, Haberle, Clark and Atahan2018). These findings suggest that the late Holocene climatic shift was related to low SST (Fig. 7E) (Stott et al., Reference Stott, Cannariato, Thunell, Huag, Koutavas and Lund2004) and intensified ENSO activity (Fig. 7F) (Moy et al., Reference Moy, Seltzer, Rodbell and Anderson2002).
Interestingly, our flooding-event dataset showed that the 950- and 540-year cycles disappeared at the beginning of the climatic shift (Figs. 7, 8). In past climate reconstructions, these 500- to 1000-year cycles have been considered evidence of effects of changes in upwelling intensity and thermohaline circulation (THC), which mediate the link between Δ14C reservoirs in the atmosphere and ocean (Stuiver and Braziunas, Reference Stuiver and Braziunas1993; Roth and Reijmer, Reference Roth and Reijmer2005). If such effects were present during the early to middle Holocene, 500- to 1000-year cycles may have played a major role in driving hydroclimatic changes in the western Pacific, with a significant influence of active THC. In contrast, during the late Holocene, which was characterized by intensified ENSO activity, the influence of THC at timescales of 500–1000 years was likely reduced, and the hydroclimate in East Asia appears to have been controlled by shorter-term climatic factors with cycles of 320, 110–120, and 60–75 years.
The linkage between the late Holocene climate shift in East Asia and possible THC changes suggested by this study appears to be supported by previous modeling results. Weakened THC leads to decreased northward cross-equatorial heat transport in the global ocean, resulting in a typical dipole SST anomaly characterized by cooling in the North Atlantic and warming around the equator and in the South Atlantic. This change also induces a southward shift of the ITCZ over the tropical Atlantic and El Niño-like climatic conditions (Zhang and Delworth, Reference Zhang and Delworth2005). Based on these modeling results, the late Holocene climatic shift in East Asia appears to have been influenced by increased El Niño-like climatic conditions coupled with weakened THC. More high-resolution data that will shed light on the possible influence of THC on East Asian climate change are scarce. This study emphasizes the urgent need to evaluate the possible influence of THC and resultant ITCZ shifts on global climate.
CONCLUSIONS
We investigated past hydroclimatic changes over East Asia based on strong correlations among lithogenic elemental ratios (e.g., Zr/Ti and Sr/Si) measured with a XRF core scanner, grain size and δ13C values of organic matter in the sediments. The results have implications for climatic phenomena including changes in the global atmospheric-oceanic circulation.
First, we reconstructed high-resolution flooding events in the middle reach of the Nakdong River, South Korea, as an analogue for past regional climate records in East Asia, and found strong links to high SST in the western Pacific Ocean and strong ENSO-like climatic conditions. Particularly frequent extreme flooding events occurred at 7700, 7200, 6000, 5000, 3700, 3200, 3000, 2600, 2000, and 1700 cal yr BP, mainly under intensified ENSO-like climate conditions.
Second, we found a significant climatic shift ca. 3700 cal yr BP. During the period 7700–3700 cal yr BP, the hydroclimate fluctuated with dominant periodicities of 950, 540, 400, 300, 65, 45, 30, and 24 years, while during the subsequent period (3700–1700 cal yr BP) shorter centennial to decadal cycles (320, 110–120, and 60–75 years) were observed.
Finally, the climatic shift at 3700 cal yr BP is consistent with a marked southward shift of the ITCZ, intensified ENSO activity, increased frequency of recurving typhoons over East Asia, and possible deep-ocean circulation changes in both the northern and southern hemispheres. These globally interconnected climatic shifts should be investigated in detail to improve future predictions of changes in hydroclimate and typhoon activity.
Acknowledgments
We are grateful to two anonymous reviewers and Yeong Bae Seong (Associate Editor) for their helpful comments and suggestions on the manuscript.
Financial Support
This research was supported by the Basic Research Project of the Korea Institute of Geoscience and Mineral Resources (KIGAM, GP2020-003(22-3111-3), GP2022-005(22-3807)).
Competing interests
The authors declare that they have no competing interests.


