


INTRODUCTION
The last ~6000 years of the Earth's climate history has not seen high-amplitude climate change events (stable boundary condition; Petit et al., Reference Petit, Jouzel, Raynaud, Barkov, Barnola, Basile and Bender1999; Warner et al., Reference Wanner, Beer, Bütikofer, Crowley, Cubasch, Flückiger, Goosse and Grosjean2008); however, the lower amplitude changes in the Indian summer monsoon (ISM) and the smaller and short-lived climatic events such as the one at 4.2 kyr BP have proven to have drastic effects on human civilizations such as the expansion and de-urbanization of the Indus Valley (Harappan) civilization, the rise and fall of the Vedic civilization, and the collapse of the Tibetan Guge Kingdom (Witzel, Reference Witzel1987, Reference Witzel, Bronkhorst and Deshpande1999; Ratnagar, Reference Ratnagar2002;Staubwasser et al., Reference Staubwasser, Sirocko, Grootes and Segl2003; Kulke and Rothermund, Reference Kulke and Rothermund2004; Yuan, Reference Yuan2009; Wright, Reference Wright2010; Giosan et al., Reference Giosan, Clift, Macklin, Fuller, Constantinescu, Durcan and Stevens2012; Dixit et al., Reference Dixit, Hodell and Petrie2014; Sarkar et al., Reference Sarkar, Prasad, Wilkes, Riedel, Stebich, Basavaiah and Sachse2015; Kathayat et al., Reference Kathayat, Cheng, Sinha, Yi, Li, Zhang, Li, Ning and Edwards2017; Petrie et al., Reference Petrie, Singh, Bates, Dixit, French, Hodell and Jones2017; Misra et al., Reference Misra, Tandon and Sinha2019). The Holocene period has experienced both long- and short-term climate events including the Holocene Climate Optimum, the 8.2 and 4.2 ka climate events, the Medieval Climate Anomaly (MCA; wetter) and the Little Ice Age (LIA; drier). However, the expressions of these events have not been reported in every study (Staubwasser et al., Reference Staubwasser, Sirocko, Grootes and Segl2003; Dixit et al., Reference Dixit, Hodell and Petrie2014, Reference Dixit, Hodell, Giesche, Tandon, Gázquez, Saini and Skinner2018; Dixit and Tandon, Reference Dixit and Tandon2016; Bird et al., Reference Bird, Lei, Perello, Polissar, Yao, Finney, Bain, Pompeani and Thompson2017; Misra et al., Reference Misra, Tandon and Sinha2019). This time frame is of great interest for understanding the forcing factors and responses of earth's climate with abundant paleoclimatic proxy records that can be validated through global climate model simulations and used for future climate predictions (Overpeck et al., Reference Overpeck, Anderson, Trumbore and Prell1996; Gupta et al., Reference Gupta, Anderson and Overpeck2003; Fleitmann et al., Reference Fleitmann, Burns, Mangini, Mudelsee, Kramers, Villa and Neff2007; Warner et al., Reference Wanner, Beer, Bütikofer, Crowley, Cubasch, Flückiger, Goosse and Grosjean2008). To reconstruct the climatic records, precise timing of the paleoclimatic archives and high-resolution proxy data are needed. However, such data from the Indian subcontinent, and more specifically from the Himalayan region, are scanty and often suffer from age uncertainties (Sinha et al., Reference Sinha, Cannariato, Stott, Cheng, Edwards, Yadava, Ramesh and Singh2007; Prasad, S. et al., Reference Prasad, Ambili, Riedel, Sarkar, Menzel, Basavaiah and Krishnan2014; Ghosh et al., Reference Ghosh, Bera, Sarkar, Paruya, Yao and Li2015; Mishra et al., Reference Mishra, Prasad, Ambili, Plessen, Jehangir, Gaye, Menzel, Weise and Yousuf2015; Ali et al., Reference Ali, Dubey, Ghosh, Quamar, Sharma, Morthekai, Dimri, Shekhar, Arif and Agrawal2018; Bhushan et al., Reference Bhushan, Sati, Rana, Shukla, Mazumdar and Juyal2018; Sharma and Phartiyal, Reference Sharma and Phartiyal2018; and references therein). It has been observed that the climate reconstructions from moderate- to high-precipitation areas (rainfall ~1000 mm/yr; central and eastern Himalaya) and extremely low-precipitation areas (e.g., Tso Moriri lake) do not respond to minor climatic events (shorter duration and smaller magnitude). This has been attributed to the insignificant/irresolvable responses of proxies in wet areas and to the buffering effect of snow melt and weaker late Holocene ISM in dry areas. Moreover, spatial differences in the climate change patterns in the ISM region also exist (Prasad and Enzel, Reference Prasad and Enzel2006; Sinha et al., Reference Sinha, Berkelhammer, Stott, Mudelsee, Cheng and Biswas2011; Mishra et al., Reference Mishra, Prasad, Ambili, Plessen, Jehangir, Gaye, Menzel, Weise and Yousuf2015; Ali et al., Reference Ali, Dubey, Ghosh, Quamar, Sharma, Morthekai, Dimri, Shekhar, Arif and Agrawal2018). Similarly from marine archives, the identification of climatic events younger than 5000 yr BP is difficult owing to their short duration and low amplitude (Gupta et al., Reference Gupta, Anderson and Overpeck2003). Hence the transitional climate zones lying between the dry Trans-Himalaya/Tibet area towards the north and the sub-humid Himalaya area towards the south, where the climate signals are amplified, needs to be targeted (Ali et al., Reference Ali, Dubey, Ghosh, Quamar, Sharma, Morthekai, Dimri, Shekhar, Arif and Agrawal2018).
The Himalayan range extends for ~2500 km in an east–west direction. However, its width is rather variable, rarely exceeding 250 km. This region is influenced by two major weather systems: the ISM (summer) and the mid-latitude westerlies in winter (Finkel et al., Reference Finkel, Owen, Barnard and Caffee2003; Yang et al., Reference Yang, Zhu, Wang, Li, Zhou, Chen, Yin and Lu2008). The influence of these two climate systems varies spatially, and most of the southern and eastern Himalayan ranges receive a moderate-to-heavy summer precipitation from the ISM, while the regions north of the Higher Himalaya and the northwestern (NW) Himalaya receive scanty monsoon precipitation (Ali and Juyal, Reference Ali and Juyal2013). Similarly, the influence of the mid-latitude westerlies shows a progressive decrease from the NW (Karakoram and Ladakh) to northeastern Himalaya (Benn and Owen, Reference Benn and Owen1998). As far as the paleoclimatic/paleoenvironmental proxy record of the Higher Himalaya is concerned, the data are rudimentary, especially in relation to the sheer size of this sector; more specifically, the paleoclimatic data from the NW Himalaya are scarce (Ali et al., Reference Ali, Dubey, Ghosh, Quamar, Sharma, Morthekai, Dimri, Shekhar, Arif and Agrawal2018; Bhushan et al., Reference Bhushan, Sati, Rana, Shukla, Mazumdar and Juyal2018; Banerji et al., Reference Banerji, Arulbalaji and Padmalal2020). In the case of the Higher Himalaya, focus must be given to the ISM, as it drives the majority of environmental and ecological changes in the region (Patnaik et al., Reference Patnaik, Gupta, Naidu, Yadav, Bhattacharyya and Kumar2012; Xu et al., Reference Xu, Sano, Dimri, Ramesh, Nakatsuka, Shi and Guo2018). Yet, despite the important role of the ISM in the NW Himalaya, in-depth characterizations of ISM variability prior to the instrumental period are rare, except for a few studies carried out in the far northeast of Ladakh, where the contribution of the ISM is minimal (Wünnemannet al., Reference Wünnemann, Demske, Tarasov, Kotlia, Reinhardt-Imjela, Bloemendal and Diekmann2010; Leipe, Demske, Tarasov, Reference Leipe, Demske and Tarasov2014; Leipe, Demske, Tarasov, Wünnemann, et al., Reference Leipe, Demske, Tarasov, Wünnemann and Riedel2014; Mishra et al., Reference Mishra, Prasad, Ambili, Plessen, Jehangir, Gaye, Menzel, Weise and Yousuf2015; Dutt et al., Reference Dutt, Gupta, Wünnemann and Yan2018). On the basis of these studies, a general trend of aridity is reported from the NW Himalaya for the latter half of the Holocene (Leipe, Demske, and Tarasov, Reference Leipe, Demske and Tarasov2014; Mishra et al., Reference Mishra, Prasad, Ambili, Plessen, Jehangir, Gaye, Menzel, Weise and Yousuf2015). Contrary to this, in the monsoon-dominated central Himalaya, the existing paleoclimatic data suggest fluctuating lake levels throughout the Holocene, and the majority of the records with reasonable chronologies advocate for a gradual intensification of the ISM (punctuated by dry spells) since the mid-Holocene (Rühland et al., Reference Rühland, Phadtare, Pant, Sangode and Smol2006; Kotlia and Joshi, Reference Kotlia and Joshi2013; Sanwal et al., Reference Sanwal, Kotlia, Rajendran, Ahmad, Rajendran and Sandiford2013; Rawat et al., Reference Rawat, Gupta, Sangode, Srivastava and Nainwal2015; Bali et al, Reference Bali, Chauhan, Mishra, Ali, Tomar, Khan, Singh and Srivastava2017; Bhushan et al., Reference Bhushan, Sati, Rana, Shukla, Mazumdar and Juyal2018; Srivastava et al., Reference Srivastava, Agnihotri, Sharma, Meena, Sundriyal, Saxena and Bhushan2018). Interestingly, the NW Himalaya (Zanskar, Ladakh) has been and continues to be influenced by both the ISM and the mid-latitude westerlies throughout the late Quaternary (Benn and Owen, Reference Benn and Owen1998; Owen and Dortch, Reference Owen and Dortch2014; Mishra et al., Reference Mishra, Prasad, Ambili, Plessen, Jehangir, Gaye, Menzel, Weise and Yousuf2015; Ganju et al., Reference Ganju, Nagar, Sharma, Sharma and Juyal2018; Sharma et al., Reference Sharma, Hussain, Mishra, Lone, Solanki and Khan2018), and recently a water isotope-based study by Sharma and colleagues (Reference Sharma, Kumar, Laskar, Singh and Mehta2017) reported a significant contribution of ISM precipitation in the upper Indus catchment. However, the hydroclimatic conditions and the geographical extent of the ISM influence in the NW Himalaya is still being debated (Owen and Dortch, Reference Owen and Dortch2014). It has also been suggested that the minor changes during the late Holocene have not affected this region because of the early southward migration of the Intertropical Convergence Zone (ITCZ) and/or the attenuating impact of the westerlies and continuing meltwater inflow (Mishra et al., Reference Mishra, Prasad, Ambili, Plessen, Jehangir, Gaye, Menzel, Weise and Yousuf2015). There is another important factor, the complexity of the Higher Himalayan mountain topography that produces significant variability in the precipitation and rainfall patterns over short distances (Beniston, Reference Beniston2006). Keeping these contradictions and the paucity of data in view, interpretations related to the Holocene climate are still tentative and remain elusive. Hence, multiproxy records must be generated that may reflect local to regional climatic conditions, and they need to be based on robust chronologies (Dearing, Reference Dearing2006; Dearing et al., Reference Dearing, Battarbee, Dikau, Larocque and Oldfield2006; Kathayat et al., Reference Kathayat, Cheng, Sinha, Yi, Li, Zhang, Li, Ning and Edwards2017). Therefore, multiproxy paleoclimatic records covering different sectors of the NW Himalaya are needed for both local as well as regional evaluations of the climate variability during the later parts of the Holocene.
STUDY AREA
The Zanskar Valley (Fig. 1) is located in the transitional zone between the ISM-dominated southern Himalaya and the mid-latitude westerly–dominated northern region. The moisture availability of this valley is regulated by a complex interplay of these two different weather and atmospheric circulation systems (Mayewski et al., Reference Mayewski, Lyons, Ahmad, Smith and Pourchet1984; Bothe et al., Reference Bothe, Fraedrich and Zhu2011; Lee et al., Reference Lee, Seong, Owen, Murari, Lim, Yoon and Yoo2014; Ali et al., Reference Ali, Dubey, Ghosh, Quamar, Sharma, Morthekai, Dimri, Shekhar, Arif and Agrawal2018; Sharma and Shukla, Reference Sharma and Shukla2018). A 17-yr ice-core data set from the Sentik glacier (Nun-Kun; Zanskar Valley), which is located towards the northwestern side of the study area and forms the northern fringe of the Higher Himalaya in the Suru Valley, indicates dominance of the ISM (Mayewski et al., Reference Mayewski, Lyons, Ahmad, Smith and Pourchet1984). Because of the dominance of ISM, the Zanskar range receives a relatively higher precipitation (400–600mm/year) than its northern counterparts (Lee et al., Reference Lee, Seong, Owen, Murari, Lim, Yoon and Yoo2014; Sharma et al., Reference Sharma, Hussain, Mishra, Lone, Solanki and Khan2018). Since the Zanskar Valley is located in a climatologically sensitive/critical area, it is expected to provide important insights for understanding temporal changes in the contributions from two climate systems (ISM and westerlies). With these facts in mind, the objectives of the study are (1) to look for low-amplitude climate changes during the late-Holocene, (2) to understand the temporal hydroclimatic variability in the transient climate zone, and (3) to identify the forcing factors responsible for small-scale climatic perturbations.
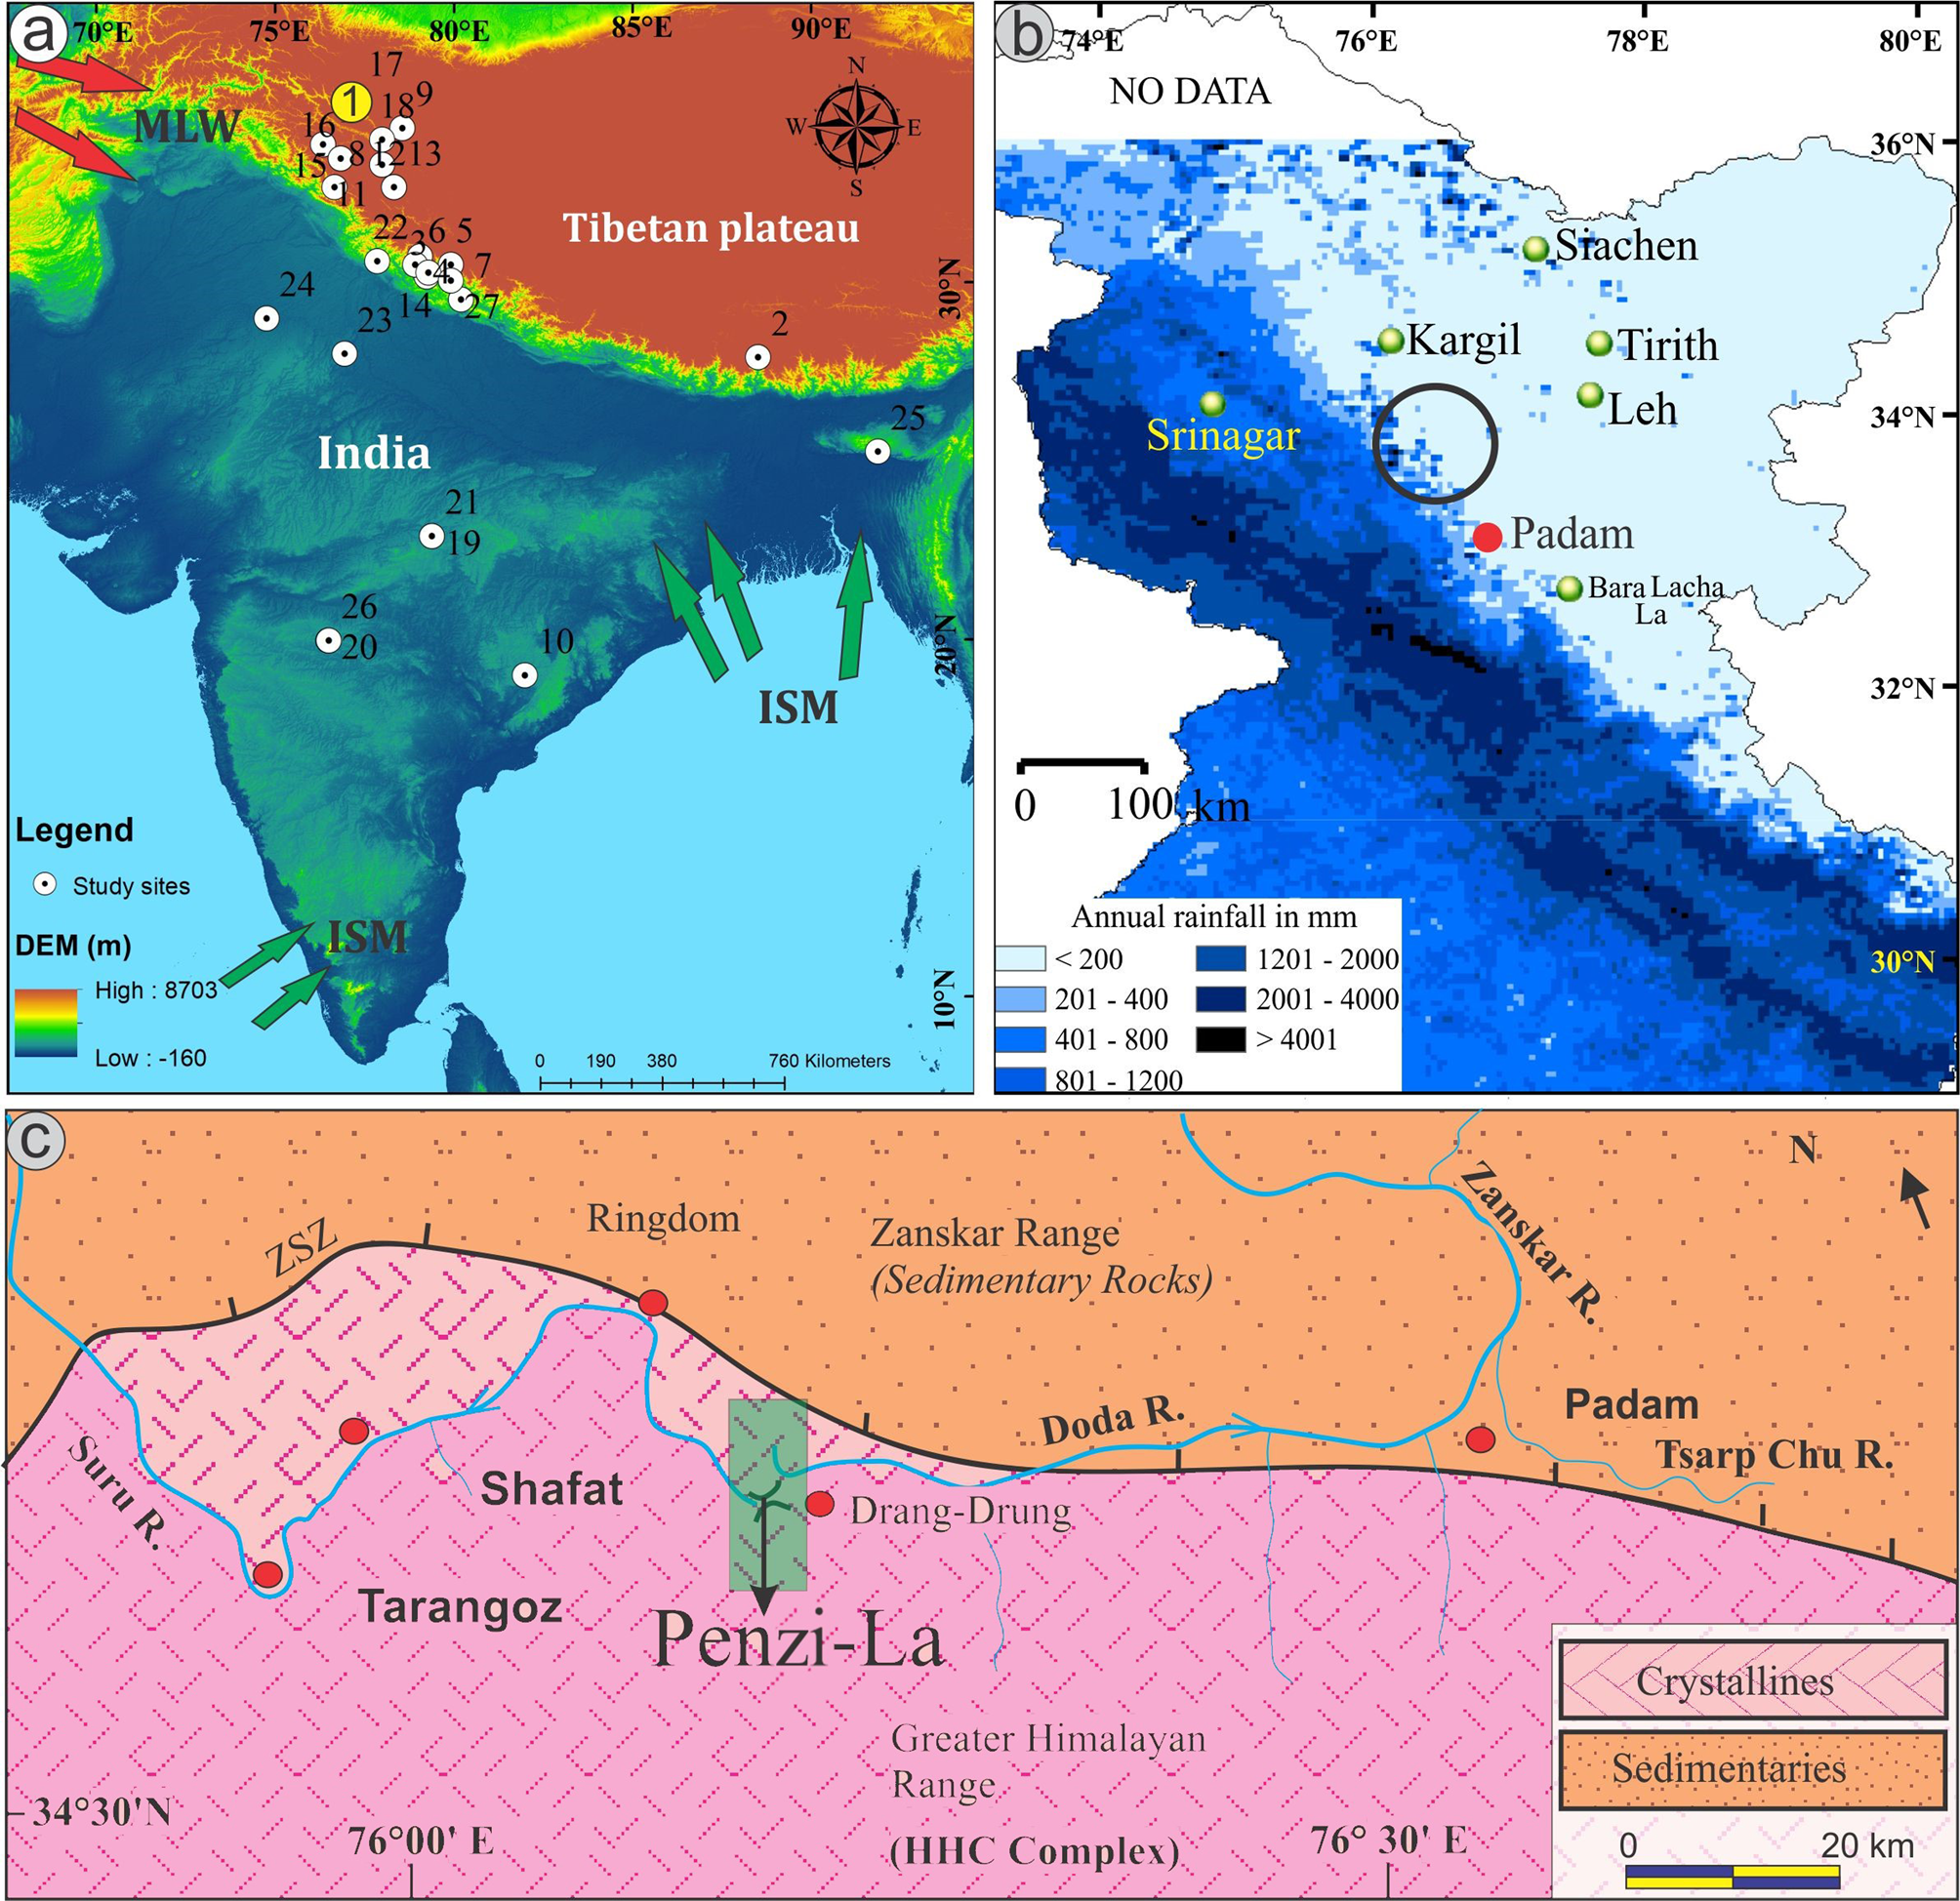
Figure 1. Map compilation. (a) The regional setup of the area along with the trajectories of weather systems—the summer monsoon and the mid-latitude westerlies. The white dots show important terrestrial palaeoclimatic sites that have been discussed in this paper including (1) the Penzi-la (yellow circle; present study), (2) Ali et al., Reference Ali, Dubey, Ghosh, Quamar, Sharma, Morthekai, Dimri, Shekhar, Arif and Agrawal2018, (3) Bhushan et al., Reference Bhushan, Sati, Rana, Shukla, Mazumdar and Juyal2018, (4) Srivastava et al., Reference Srivastava, Agnihotri, Sharma, Meena, Sundriyal, Saxena and Bhushan2018, (5) Rühland et al., Reference Rühland, Phadtare, Pant, Sangode and Smol2006, (6) Kotlia and Joshi, Reference Kotlia and Joshi2013, (7) Sanwal et al., Reference Sanwal, Kotlia, Rajendran, Ahmad, Rajendran and Sandiford2013, (8) Bali et al., Reference Bali, Chauhan, Mishra, Ali, Tomar, Khan, Singh and Srivastava2017, (9) Rawat et al., Reference Rawat, Gupta, Sangode, Srivastava and Nainwal2015, (10) Sinha et al., Reference Sinha, Cannariato, Stott, Cheng, Edwards, Yadava, Ramesh and Singh2007, (11) Wünnemann et al., Reference Wünnemann, Demske, Tarasov, Kotlia, Reinhardt-Imjela, Bloemendal and Diekmann2010, (12) Mishra et al., Reference Mishra, Prasad, Ambili, Plessen, Jehangir, Gaye, Menzel, Weise and Yousuf2015, (13) Leipe, Demske, and Tarasov, Reference Leipe, Demske and Tarasov2014, (14) Kotlia et al., Reference Kotlia, Singh, Joshi and Dhaila2015, (15) Sharma et al., Reference Sharma, Hussain, Mishra, Lone, Solanki and Khan2018, (16) Sharma and Shukla, Reference Sharma and Shukla2018, (17) Ganju et al., Reference Ganju, Nagar, Sharma, Sharma and Juyal2018, (18) Lee et al., Reference Lee, Seong, Owen, Murari, Lim, Yoon and Yoo2014, (19) Kumar et al., Reference Kumar, Agrawal, Sharma and Pandey2019, (20) Sarkar et al., Reference Sarkar, Prasad, Wilkes, Riedel, Stebich, Basavaiah and Sachse2015, (21) Kumar et al., Reference Kumar, Agrawal, Sharma and Pandey2019, (22) Kathayat et al., Reference Kathayat, Cheng, Sinha, Yi, Li, Zhang, Li, Ning and Edwards2017, (23) Dixit et al., Reference Dixit, Hodell and Petrie2014, (24) Dixit et al., Reference Dixit, Hodell, Giesche, Tandon, Gázquez, Saini and Skinner2018, (25) Dutt et al., Reference Dutt, Gupta, Clemens, Cheng, Singh, Kathayat and Edwards2015, (26) Prasad et al., Reference Prasad, Ambili, Riedel, Sarkar, Menzel, Basavaiah and Krishnan2014, and (27) Rühland et al., Reference Rühland, Phadtare, Pant, Sangode and Smol2006. (b) The cumulative annual rainfall (mm) map of the western Himalaya (after Juyal, Reference Juyal2014). The circle shows the location of the study site. (c) Geological map of the study area. The Penzi-la (green rectangle) is on the leeward side of the Higher Himalayan Crystallines (HHC) and makes the drainage divide between the Suru and Zanskar Valleys (For interpretation of the references to color in this figure legend, the reader is referred to the web version of this article.)
A sediment core approximately 1.3-m long was collected from a kettle hole lake deposit located at Penzi-la using a PVC pipe (3-inch diameter) that was manually inserted into the ground (33° 52″ 05′ N, 76° 21″ 14′ E; ~4450 m asl; Figs. 1, 2 and S1). The Penzi-la (a pass between the Suru and Zanskar Valleys) is the gateway to the Zanskar Valley and forms the hydrological divide between the Suru and Doda Rivers at an elevation of ~4500m asl (Figs. 1 and 2, Supplementary Fig. S1). Lithologically, the pass is situated on the rocks of the Higher Himalayan crystalline complex (Fuchs, Reference Fuchs1982; Searle and Fryer, Reference Searle and Fryer1986). Geomorphologically, the pass represents a typical glacio-fluvial system. Moraine ridges corresponding to different glacial stages are present along the valley floor and sides. The downstream parts also have distinctive river terraces. The most prominent features present on the Penzi-la are curvilinear, recessional latero-frontal moraines and kettle hole lakes (Sharma et al., Reference Sharma, Hussain, Mishra, Lone, Solanki and Khan2018). The kettle hole lakes are depressions formed after the melting of buried ice (in proglacial areas) and have been suggested as important ecological niches in otherwise relatively barren proglacial environments (Maizels, Reference Maizels1977; Robinson, Reference Robinson2010). These small lakes provide important information on the past geomorphological, sedimentological, and hydrological processes. Hence, the sediment core studied here was placed along the margin of one of the kettle hole lake located towards the north-northwest side of the Penzi-la. Field observations and geomorphology suggest that this small lake is being fed by the runoff (snow melt and rain) from the northeast slopes of the Zanskar Range (Fig. 2, Supplementary Fig. S1).

Figure 2. (a) Google Earth imagery showing the boundary of talus cones (yellow dotted line) and the drainages feeding the kettle-hole lake in Penzi-la. Field photographs showing (b) the talus cones (red arrows), (c, d) the lake and the moraine present on the lake boundary (blue dotted line), and (e) the location of the sediment core along the lake boundary as shown in the inset of Figure 2a. (For interpretation of the references to color in this figure legend, the reader is referred to the web version of this article.)
METHODOLOGY
Different climate proxies have different strengths, weaknesses, and responses in a spatio-temporal context including sensitivity to different forcing factors and time-lag effects; hence, multiproxy studies are desirable (Smol, Reference Smol2002; National Research Council, 2005; Birks and Birks, Reference Birks and Birks2006). Therefore, in order to reconstruct the hydroclimatic variability in the Zanskar Valley, a sediment core from a kettle hole lake deposit was collected for multiproxy studies. In all, 64 samples (each representing 2 cm of the sediment core) were collected from this core. The samples were analyzed for carbon isotope signature (δ13C) preserved in sediment organic matter (a proxy for past climate changes via paleovegetation and paleoclimate; Cerling, Reference Cerling1992; Ekart et al., Reference Ekart, Cerling, Montañez and Tabor1999), elemental analyses using the Rubidium/Strontium (Rb/Sr) ratio (a proxy for weathering and erosion; Chen et al., Reference Chen, Wang and Lu1996, Reference Chen, An and Head1999; Jin et al., Reference Jin, Cao, Wu and Wang2006), and sediment texture/grain size (a proxy for environment and energy conditions; Warrier et al., Reference Warrier, Pednekar, Mahesh, Mohan and Gazi2016).
For the analysis of stable carbon isotope ratios of sedimentary organic matter (δ13Corg), ~1 g of the sediment sample was taken after coning and quartering and used for decarbonation. Samples were decarbonised with HCl (5%) for 1 hour in a water bath at 50°C; this process was repeated three times. Subsequently, the samples were centrifuged, rinsed repeatedly with deionized water until neutral pH was achieved, and dried. The sample preparation procedures are discussed in detail in Agrawal et al. (Reference Agrawal, Sanyal, Sarkar, Jaiswal and Dutta2012), Dubey et al. (Reference Dubey, Ghosh, Agrawal, Quamar, Morthekai, Sharma, Sharma, Pandey, Srivastava and Ali2018), and Ali et al. (Reference Ali, Dubey, Ghosh, Quamar, Sharma, Morthekai, Dimri, Shekhar, Arif and Agrawal2018).The decarbonated samples were weighed and packed in tin capsules and introduced into an Elemental Analyzer (Flash EA 2000 HT) through an auto sampler. Through combustion, CO2 gas was produced and introduced into a Continuous Flow Isotope Ratio Mass Spectrometer (MAT 253) coupled with Con-Flow IV interface for isotopic analysis. Repeat measurements were done at different intervals to check the reproducibility of the results (Ali et al., Reference Ali, Dubey, Ghosh, Quamar, Sharma, Morthekai, Dimri, Shekhar, Arif and Agrawal2018).
Elemental analysis was conducted on 30 mg of powdered sediment from each sample. The digestion of each sample was carried out in a Teflon tube using a two-step process. In the first step, the sediment was allowed to digest using a 5ml mixture of hydrofluoric acid (HF) and nitric acid (HNO3) followed by 1 ml of perchloric acid (HClO4), covered with a Teflon cap, and heated to ~120oC using open digestion (Q-Block operating system). The heating continued until the acid fumes stopped evaporating from the tube and the sample became completely dry. The dried residue of the first step was processed for the second step by adding a 5ml mixture of HF + HNO3 (1:2 ratio) followed by 1 ml of HClO4; the sample was again capped and heated to ~150oC. The tubes were checked for complete digestion of sediments by adding 2 ml of 5% HNO3 and observing the clarity of the solution. If any part was still left, the process was repeated until it was completely digested. After that, a 2% HNO3 solution was used to rinse the tube, and the sample was transferred in a volumetric flask to make a final volume of 50 ml. A similar digestion procedure was followed for a standard reference material (U.S. Geological Survey SGR 1B) and blanks. The digested samples, standards, and blanks were analyzed using the Agilent Quadrupole 7700 ICP-MS instrument installed at the Birbal Sahni Institute of Palaeosciences, Lucknow for trace elemental concentrations of Rb and Sr. The error was <10%.
Loss on ignition (LOI) was employed to estimate the total organic content in the sediments. For this analysis, sequential heating of the powdered sediment samples was undertaken in a muffle furnace (Dean, Reference Dean1974; Bengtson and Enell, Reference Bengtsson, Enell and Berglund1986; Rawat et al., Reference Rawat, Gupta, Sangode, Srivastava and Nainwal2015; Dubey et al., Reference Dubey, Ghosh, Agrawal, Quamar, Morthekai, Sharma, Sharma, Pandey, Srivastava and Ali2018). In this process, ~5 g of finely powdered sample (after quartering and coning) was placed in a quartz crucible and kept in a preheated oven with a constant temperature of 110°C for 12 hours. Weighing of the oven-treated samples was done to estimate the percentage loss of moisture (Eq. 1). Two additional steps of heating were carried out in a muffle furnace. For the combustion of organic matter, the samples were kept in a pre-heated furnace (550°C) for 2 hours and then weighed. The last heat treatment at 950°C for 2 hours was used to estimate the carbonate fraction.

Where, n1 = weight of empty crucible; n2 = n1 + sample weight (before heating step), and n3 = n1 + sample weight (after heating step).
The grain size analysis was carried out on a laser particle size analyser (LS 13 320) from Beckman Coulter with a size range of 0.004–2000 μm. The samples were introduced after a pre-treatment with H2O2 to remove the organic matter, 1N HCl to remove any carbonate fraction, and Na-hexametaphosphate to keep the grains dispersed.
RESULTS
Radiocarbon (accelerator mass spectrometry 14C) ages and age-depth relationship
For establishing the chronology, four samples were dated using the accelerator mass spectrometry (AMS) radiocarbon technique at AMS radiocarbon dating laboratory, Direct-AMS, USA, and at the Physical Research Laboratory Ahmadabad, India (AMS14C; Fig. 3, Table 1). The age-depth model was built on these four dates. The calculated ages were calibrated using intcal13 (Reimer et al., Reference Reimer, Bard, Bayliss, Beck, Blackwell, Ramsey and Buck2013). The age-depth relationship was modelled assuming the modern sample is of 2 ± 1 age; this is shown in Figure 3. From this age-depth model, the ages were interpolated for every sample of the core. The calibration and the age-depth model were done in R software using the Bchron package (R Core Team, 2019; Haslett and Parnell, Reference Haslett and Parnell2008; Parnell, Reference Parnell2016).

Figure 3. Bayesian age and depth chronology for the sediment core using R platform (version 3.5.0).
Table 1. Ages obtained by accelerator mass spectrometry14C dating.

a Direct-AMS, USA
b Physical Research Laboratory, Ahmedabad, India
Temporal changes in environmental proxies
The organic composition and grain size show significant variations in the sediment core (Fig. 4). The grain size shows an overall sandy-silty composition, where average sand, silt, and clay content are ~60%, 38%, and 2%, respectively. Although the clay percentage in the core is low, relatively higher values interpreted as a manifestation of aridity and hence important in understanding the paleoclimatic conditions (Ju et al., Reference Ju, Zhu, Feng, Wang, Wang, Xie, Peng, Zhen and Lü2012). Total organic carbon (TOC) is low (~0.6%; ~6200 to 4500 cal yr BP) in the bottom of the core, a gradual increase is observed in the middle section (~4500 to 3400 cal yr BP), and an overall increasing trend is seen towards the top with some fluctuations at ~2700, 2250, and 1000 cal yr BP and at present. Similarly, organic carbon (Fig. 4) shows a gradually increasing trend and further complements the overall data set. The stable carbon isotope (δ13C) values in the Penzi-la sediment core vary from −19.9 to −25.6‰ with an average value of −22.4‰ and a range of 5.7‰ (Supplementary Table S1). The δ13C values show a distinct temporal variability. The lower/bottom part of the sediment core (depth; 128–94 cm), which has an age range of ~6200–4500 cal. yrs. B.P., shows higher δ13C values with an average of −20.4‰; maximum and minimum values are −19.9‰and −21.1‰, respectively. The subsequent section (between 92 and 74 cm; age ~4500–3400 cal yr BP) shows lower δ13C values of the soil organic matter (SOM), with an average of −22.1‰, a maximum value of −20.1‰, and a minimum value −23.1‰. This is followed by a gradual lowering of δ13C values (at depth; 72–34 cm) punctuated by three higher δ13C excursions during ~3400–1500 cal yr BP (Fig. 4). This section with an average δ13C value of −22.7‰ has yielded maximum and minimum values of −20.3‰ and −23.9‰, respectively. The top ~32 cm (~1500 cal yr BP to present) of the profile follow a similar trend with gradual lowering in the δ13C values towards the top though with slightly higher values at ~400 cal yr BP. The top 6 cm of the core have yielded almost consistent values of around −25.5‰ (Fig. 4). These values are consistent with the modern isotope values of the SOM and surrounding vegetation (Supplementary Table S2). The Rb/Sr ratio of elemental concentrations also complements other proxies and has a clear trend. The older (lower; ~6200–4500 cal yr BP) part of the core is characterized by an increasing trend in the Rb/Sr ratio. Subsequently (~4500–3400 cal yr BP) a stable trend with a relatively lower Rb/Sr ratio is observed; this is followed by a gradual (fluctuating) but increasing ratio during the period around 3400–1500 cal yr BP. A stable ratio is observed between ~1500 and 300 cal yr BP and is followed by a gradual lowering.

Figure 4. Temporal variability and correlation in measured δ13C value (‰; VPDB), total organic carbon (TOC; %), moisture content (%), organic and inorganic carbon (%), Rb/Sr ratio and grain size parameters (sand, silt, and clay %). (For interpretation of the references to color in this figure legend, the reader is referred to the web version of this article.)
Principal Component Analysis
Principal Component Analysis (PCA) was carried out to check the association of samples with the biotic characteristics (i.e., TOC, total organic content (OC), moisture, and δ13C values) using the R platform (R Core Team 2019) vegan package from the CRAN project (Oksanen et al., Reference Oksanen, Blanchet, Friendly, Kindt, Legendre, McGlinn and Minchin2019). Screeplots suggest that only one component among the four is sufficient to explain the variability among the samples (Fig. 5a). The biplot shows that, except for samples 5, 51, 55, and 56, all the samples have been spread across the PCA 1 axis that explains 54.4% of the variability among the data (Fig. 5b). Further, the TOC, OC, and moisture are on the negative axis of PCA 1 and δ13C is on the positive axis of PCA 1. The OrgC lies on the negative side of the PCA 2 axis, and moisture is on the negative side of the PCA 3 axis. We note that the first two PCA axes could explain 74% of the variability among samples. However, as per the screeplot shown in Fig. 5c, the first PCA axis accounts for a significant amount of variability (54.4%). Additionally, sample scores of the PCA 1 axis are well correlated to TOC (–0.94), OC (–0.90), and δ13C (0.84). All three parameters (TOC, OC, and δ13C) are linked to vegetation, which therefore makes them important proxies for reconstructing the past vegetation and climate. Organic matter degradation may have significant influence on TOC and OC, but it has an insignificant effect on carbon isotopic composition (Hodell and Schelske, Reference Hodell and Schelske1998; Meyers and Lallier-Vergés, Reference Meyers and Lallier-Vergés1999). For that reason, the carbon isotopic composition of organic matter in sediment thus preserves environmental signals from when the organic matter was formed (Yanhong et al., Reference Yanhong, Lücke, Zhangdong, Sumin, Schleser, Battarbee and Weilan2006) and hence has been used as the primary basis of interpretation in this study; it is complemented by other proxies like Rb/Sr, grain size, TOC, and LOI parameters.

Figure 5. Principal component analysis (PCA) to check the variability among the samples. Screeplot (a) suggests only one component is sufficient to explain the significant variability among the samples. The biplot (b) suggests that total organic carbon and OC lie on PCA 1 (-ve) axis and δ13C lies on the + ve axis, and these results are corroborated by the correlation plots (c).
Significance of δ13C and Rb/Sr data
δ13Corg records from terrestrial plant tissues and soil organic matter (SOM) derived from C3-dominated vegetation has been used to reconstruct past climatic and ecological conditions (e.g., Cerling Reference Cerling1984; Quade et al. Reference Quade, Cerling and Bowman1989, Reference Quade, Cater, Ojha, Adam and Harrison1995; Kohn Reference Kohn2010, Reference Kohn2016). The mean annual precipitation, latitude, and altitude are the most significant controlling factors of δ13Cvalues of terrestrial C3 plants (Diefendorf et al., Reference Diefendorf, Mueller, Wing, Koch and Freeman2010; Basu et al., Reference Basu, Agrawal, Sanyal, Mahato, Kumar and Sarkar2015, Reference Basu, Sanyal, Pillai and Ambili2019; Kohn Reference Kohn2016; Rao et al., Reference Rao, Guo, Cao, Shi, Jiang and Li2017). Hence, the δ13C value of SOM under C3-dominated vegetation has a negative correlation with precipitation (Kohn, Reference Kohn2010; Rao et al., Reference Rao, Xu, Xia, Xie and Chen2013, Reference Rao, Guo, Cao, Shi, Jiang and Li2017; Basu et al., Reference Basu, Agrawal, Sanyal, Mahato, Kumar and Sarkar2015, Reference Basu, Sanyal, Pillai and Ambili2019) and has been successfully used to reconstruct climate variability in the eastern Himalaya (Ali et al., Reference Ali, Dubey, Ghosh, Quamar, Sharma, Morthekai, Dimri, Shekhar, Arif and Agrawal2018). The δ13C-based investigations of modern plant and SOM samples in the Penzi-la show a C3-dominated vegetation (alpine meadow; average δ13C = −25.5‰). These values suggest a precipitation of around 450 mm and are in agreement with the modern-day precipitation data (Supplementary Fig. S2; Sharma et al., Reference Sharma, Hussain, Mishra, Lone, Solanki and Khan2018; Climate Research Unit (CRU)-TS 4.03 data). We are confident that the carbon isotopic composition of plants in the Penzi-la area will portray the variations in precipitation/hydrological conditions (Francey and Farquhar, Reference Francey and Farquhar1982; Sternberg et al., Reference Sternberg, Deniro and Ajie1984; Ali et al., Reference Ali, Dubey, Ghosh, Quamar, Sharma, Morthekai, Dimri, Shekhar, Arif and Agrawal2018).
The temporal variation in the Rb/Sr ratio of loess–paleosol and lacustrine sequences has successfully been used as a proxy for the degree of pedogenesis and weathering (Dasch, Reference Dasch1969; Chen et al., Reference Chen, An and Head1999; Jin et. al., Reference Jin, Cao, Wu and Wang2006; Chang et al., Reference Chang, An, Wu, Jin, Liu and Song2013). Sr is found in association with calcium-bearing minerals (Sr substitutes for calcium in the lattices of silicate/carbonate minerals) that are easy to break down during the weathering process (Jin et al., Reference Jin, Cao, Wu and Wang2006; Chang et al., Reference Chang, An, Wu, Jin, Liu and Song2013). Rb substitutes for potassium, displays inert behaviour, and is resistant to weathering; hence, it is sequestered in the residual phases (Jin et al., Reference Jin, Cao, Wu and Wang2006). The original Rb/Sr ratio is preserved in lacustrine sediments as they are deposited in a closed system (Jin et al., Reference Jin, Cao, Wu and Wang2006). Therefore, in closed-lake sediments, during favourable climate conditions (high run-off), the Rb/Sr ratio will be high as both Rb and Sr will come into the system. However, during periods of lower run-off, the easily weathered Sr will be more available, and hence the ratio will be lower (Jin et al., Reference Jin, Cao, Wu and Wang2006).
DISCUSSION
Evolution of the sedimentary sequence
The significance of the present study is in its location (transitional zone) and multiproxy approach wherein several proxies have been simultaneously used to address the hydroclimatic variability in one of the world's harshest climate regions (Ladakh—cold desert; see Fig. 1). The study site does not have any significant drainage systems, and the deposition of the locally available sediments relies upon snow melt and ISM-induced surface runoff and hence provides an opportunity to infer the local hydroclimatic conditions. Based on the variations in the multiproxy data (see Fig. 4), four prominent phases of climate variability have been identified in the Penzi-la sediment core, Zanskar Valley. The sediments of the core bottom (~6200–4500 cal yr BP) are dominated by sand (66%) and followed by silt (32%) with only a minor contribution from clay. The proportions of sand and silt throughout the profile are almost similar, suggesting a more or less analogous depositional environment. The moisture content and the organic carbon are low in this part. The higher δ13C values (avg. −20.4‰) in this zone suggest low water availability. Low TOC is also attributed to drier climatic conditions restricting the vegetation growth (Ali et al., Reference Ali, Dubey, Ghosh, Quamar, Sharma, Morthekai, Dimri, Shekhar, Arif and Agrawal2018; Srivastava et al., Reference Srivastava, Agnihotri, Sharma, Meena, Sundriyal, Saxena and Bhushan2018). These observations are further complemented by the relatively lower Rb/Sr ratio in this zone. The results suggest an overall lower availability of water during ~6200–4500 cal yr BP. Subsequently, a significant increase in TOC, organic carbon content, and moisture percentages is observed, implying improvement in climate conditions during ~4500–3400 cal yr BP (see Fig. 4). This phase is characterized by a prominent lowering of δ13C values (avg. −22.1‰), which further points towards the increased availability of moisture. The Rb/Sr ratio shows moderate values in this zone suggesting relatively higher runoff. During the interval between ~3400 and 1500 cal yr BP, a progressive lowering of δ13C values is observed, suggesting climate amelioration. This ameliorating trend is punctuated by three prominent dry phases (less negative δ13C values) at ~3200, 2500, and 1750 cal yr BP (see Fig.4). This zone is further characterized by an increasing trend in TOC, moisture content, and Rb/Sr ratio. The corresponding grain size also shows a response to these climatic changes, and the clay content is relatively higher for the phase with the less negative δ13C values. During the last ~1500 cal yr BP, a gradual improvement in climatic conditions is seen with a dry spell at ~400 cal yr BP. Higher sand content, TOC, moisture, and organic carbon (%) and low δ13C values towards the top (after ~400 cal yr BP) are attributed to enhanced hydroclimatic conditions. The very low content of sand at ~400 cal yr BP further suggests low-energy runoff conditions.
Climatic implications and comparison with other sites
The present study documents a quasi-continuous mid–late Holocene record of hydroclimatic variability from the Zanskar Valley, situated in a transitional climate zone towards the orographic limit of ISM precipitation in the NW Himalaya. Detailed paleoclimatic reconstructions from the NW Himalaya are scanty and restricted to the eastern sector of Ladakh (Tso Kar [Wünnemann et al., Reference Wünnemann, Demske, Tarasov, Kotlia, Reinhardt-Imjela, Bloemendal and Diekmann2010]; Tso Moriri [Leipe, Demske, and Tarasov, Reference Leipe, Demske and Tarasov2014; Leipe, Demske, Tarasov, Wünnemann, et al., Reference Leipe, Demske, Tarasov, Wünnemann and Riedel2014; Mishra et al., Reference Mishra, Prasad, Ambili, Plessen, Jehangir, Gaye, Menzel, Weise and Yousuf2015]). The eastern sector is characterized by extreme climatic conditions with an annual precipitation of less than 90 mm (Wünnemann et al., Reference Wünnemann, Demske, Tarasov, Kotlia, Reinhardt-Imjela, Bloemendal and Diekmann2010), and the effect of ISM is minimal (Mishra et al., Reference Mishra, Prasad, Ambili, Plessen, Jehangir, Gaye, Menzel, Weise and Yousuf2015). Contrary to this, our study area is located in the transitional zone of ISM influence and receives a moderate amount of precipitation (~450–600 mm) and hence is a better location for understanding the hydroclimatic variability. The present study shows fluctuating hydroclimatic conditions during last ~6200 cal yr BP and shows a good correlation with speleothem and paleo-lake records with other local (Higher Himalayan) and regional sites. Therefore, it is desirable to see whether the hydroclimatic conditions reconstructed using carbon isotope ratios of SOM from the Penzi-la are synchronous with other climatic records. We compared our δ13C-based climatic record with regional paleoclimatic reconstructions based on different proxies in order to delineate the forcing factors behind these events; these comparisons are outlined below (see Fig. 4).
Mid-Late Northgrippian (~6200–4500 cal yr BP)
On the basis of δ13C values, Rb/Sr ratio, low TOC, LOI, and sand (%), our study indicates a stable but relatively dry climate during the mid-late Northgrippian (~6200–4500 cal yr BP). This dry phase is in accordance with the youngest Southern Zanskar Glacial Stage (SZS-1; Sharma and Shukla, Reference Sharma and Shukla2018; Sharma et al., Reference Sharma, Hussain, Mishra, Lone, Solanki and Khan2018) that occurred after 6.3 ka and before 5.1 ka in the Zanskar Valley and has been attributed to an overall weakened ISM (Wünnemann et al., Reference Wünnemann, Demske, Tarasov, Kotlia, Reinhardt-Imjela, Bloemendal and Diekmann2010; Bhushan et al., Reference Bhushan, Sati, Rana, Shukla, Mazumdar and Juyal2018; Sharma and Shukla, Reference Sharma and Shukla2018). The SZS-1 glacial advance has been attributed to millennial-scale cooling events (Sharma and Shukla, Reference Sharma and Shukla2018). Based on the changes in the pollen spectra, reduced local pollen production, and increasing scores of desert and decreasing scores of tundra revealed in the biome reconstruction, a reduction in moisture availability after ~6200 cal yr BP is indicated from the Tso Moriri lake (Leipe, Demske, Tarasov, Reference Leipe, Demske and Tarasov2014; Leipe, Demske, Tarasov, Wünnemann, et al., Reference Leipe, Demske, Tarasov, Wünnemann and Riedel2014). Similarly, Wünnemann and colleagues (Reference Wünnemann, Demske, Tarasov, Kotlia, Reinhardt-Imjela, Bloemendal and Diekmann2010) observed that this period is marked by a decline in detrital input due to reduced melt water flux and that the Tso Kar (lake) shrank gradually after 7000 cal yr BP and attained its lowest stand at about 4200 cal yr BP. High-resolution paleoclimatic studies from the adjacent regions also show a similar trend of declining moisture availability during this time (Ranhotra et al., Reference Ranhotra, Bhattacharyya, Kar and Sekar2001; Kotlia and Joshi, Reference Kotlia and Joshi2013; Kotlia et al., Reference Kotlia, Singh, Joshi and Dhaila2015; Bali et al., Reference Bali, Chauhan, Mishra, Ali, Tomar, Khan, Singh and Srivastava2017; Bhushan et al., Reference Bhushan, Sati, Rana, Shukla, Mazumdar and Juyal2018; Srivastava et al., Reference Srivastava, Agnihotri, Sharma, Meena, Sundriyal, Saxena and Bhushan2018).
A multiproxy climatic reconstruction from the central Himalaya has also reported high-frequency climatic variability with an overall dryness during ~5400 to ~3800 cal yr BP (Srivastava et al., Reference Srivastava, Agnihotri, Sharma, Meena, Sundriyal, Saxena and Bhushan2018). A cold, dry climate during a weak phase of the ISM is also well recorded between ~5 and 4 ka from the Dongge Cave, China (Wang et al., Reference Wang, Cheng, Edwards, He, Kong, An, Wu, Kelly, Dykoski and Li2005) and also in the Guliya ice core record (Thompson et al., Reference Thompson, Yao, Davis, Henderson, Mosley-Thompson, Lin, Beer, Synal, Cole-Dai and Bolzan1997). This weakening of ISM is also reported from the core monsoon zone of India, specifically from Lonar Lake (Sarkar et al., Reference Sarkar, Prasad, Wilkes, Riedel, Stebich, Basavaiah and Sachse2015) and Noni Tal, Madhya Pradesh (Kumar et al., Reference Kumar, Agrawal, Sharma and Pandey2019). δ13Cwax data of Sarkar and colleagues (Reference Sarkar, Prasad, Wilkes, Riedel, Stebich, Basavaiah and Sachse2015) and phytolith index values along with higher δ13C (Prasad, V. et al., Reference Prasad, Farooqui, Sharma, Phartiyal, Chakraborty, Bhandari, Raj and Singh2014) further indicate drier climatic conditions during this period.
The decreasing trend in the rainfall pattern post ~6000 cal yr BP is attributed to the progressive decrease in insolation and a southward shift of the ITCZ after the mid Holocene (Fig. 6; Fleitmann et al., Reference Fleitmann, Burns, Mangini, Mudelsee, Kramers, Villa and Neff2007; Sarkar et al., Reference Sarkar, Prasad, Wilkes, Riedel, Stebich, Basavaiah and Sachse2015; Ali et al., Reference Ali, Dubey, Ghosh, Quamar, Sharma, Morthekai, Dimri, Shekhar, Arif and Agrawal2018). The continuous retreat of the ITCZ towards the south and its effect on the ISM intensity (weakening) has been attributed to a gradual response to decreasing orbitally induced solar insolation from both terrestrial and marine archives (Wang et al., Reference Wang, Wu and Lau2001; Gupta et al., Reference Gupta, Anderson and Overpeck2003; Fleitmann et al., Reference Fleitmann, Burns, Mangini, Mudelsee, Kramers, Villa and Neff2007; Dutt et al., Reference Dutt, Gupta, Clemens, Cheng, Singh, Kathayat and Edwards2015; Dixit et al., Reference Dixit, Hodell and Petrie2014, Reference Dixit, Hodell, Giesche, Tandon, Gázquez, Saini and Skinner2018). Furthermore, the increased ice rafting and corresponding reduction in sea surface salinity resulted in a distinctly cooler phase between 6.5 and 3.7 ka yr BP (Moros et al., Reference Moros, Emeis, Risebrobakken, Snowball, Kuijpers, McManus and Jansen2004; Wiersma and Renssen, Reference Wiersma and Renssen2006). Comparison and correlation between the present data and the above-discussed studies from different ecological systems and diverse geographical settings are in agreement and support a global cooling phase (dry) during the mid-Late Northgrippian.

Figure 6. Indian Summer Monsoon/ hydroclimatic variability through regional comparison of different data sets and the Penzi-la data. The light grey bands represent moisture deficiency, while the darker bands show better hydroclimatic conditions.
Late Northgrippian to Early Meghalayan (~4500–3400 cal yr BP)
Following a cool and dry mid-Holocene (Mid-Late Northgrippian), an amelioration in climatic conditions is observed between ~4500 and 3400 cal yr BP. Lower δ13C values and stable Rb/Sr ratios along with relatively higher TOC and organic carbon content in the Penzi-la sediment core are observed, and more positive hydroclimatic conditions are indicated. Our results are in accordance with the inferences drawn from detrital geochemical proxies of weathering and erosion from monsoon-dominated central Himalaya (Bhushan et al., Reference Bhushan, Sati, Rana, Shukla, Mazumdar and Juyal2018), suggesting a weak to moderate ISM during ~3500–2040 cal yr BP. Similarly, on the basis of low δ13C values recorded at ~4000 cal yr BP and from ~3500 to 3170 cal yr BP, Rawat and colleagues (Reference Rawat, Gupta, Sangode, Srivastava and Nainwal2015) suggested centennial-scale high precipitation conditions in the Chandra Valley. In monsoon-dominated Kedarnath Valley, an enhanced insolation-driven ISM has been reported (Srivastava et al., Reference Srivastava, Agnihotri, Sharma, Meena, Sundriyal, Saxena and Bhushan2018). The improved hydroclimatic conditions are in accordance with an increase in total solar irradiance (Steinhilber et al., Reference Steinhilber, Beer and Fröhlich2009) and Globigerina bulloides percentage (Gupta et al., Reference Gupta, Anderson and Overpeck2003), as well as a slight increase in mean effective moisture over central Asia (Fig. 6; Herzschuh, Reference Herzschuh2006). We propose that enhanced solar irradiance may have resulted in enhanced snow and glacial melt as well as strengthening of the ISM, thereby creating favourable conditions for vegetation growth as evidenced by lowering of δ13C values and enhancement in TOC content.
Middle Meghalayan (~3400–1500 cal yr BP)
During this phase an overall improvement in the hydrological conditions is observed; however, this trend is interrupted by three centennial-scale dry events. These dry events exhibited progressively lower amplitudes at ~3200, 2500, and 1750 cal yr BP respectively (see Fig. 4).The incidence of such abrupt drying events during the Middle Meghalayan (late Holocene), in addition to the 4.2 ka and LIA events, also deserves careful attention, but has rarely been explored (Park et al., Reference Park, Park, Yi, Kim, Lee and Choi2019 and references therein). The ~3200 and ~2400 cal yr BP dry/cooling events are reported from other Northern Hemisphere climate records and are suggested to have arisen from a solar-induced shift in atmospheric circulation (Svendsen and Mangerud, Reference Svendsen and Mangerud1997; Martin-Puertas et al., Reference Martin-Puertas, Matthes, Brauer, Muscheler, Hansen, Petrick, Aldahan, Possnert and Van Geel2012; Kaniewski and Van Campo, Reference Kaniewski, Van Campo and Weiss2017; Harning et al., Reference Harning, Geirsdóttir and Miller2018; Park et al., Reference Park, Park, Yi, Kim, Lee and Choi2019).The third cooling event, at ~1700 cal yr BP, is broadly comparable with the Dark Ages cooling period also termed the Late Antique LIA (Ljungqvist, Reference Ljungqvist2010; Büntgen et al., Reference Büntgen, Myglan, Ljungqvist, McCormick, Di Cosmo, Sigl and Jungclaus2016). A volcanic eruption–driven abrupt summer cooling that was probably sustained by positive feedback loops of ocean-heat content and sea-ice extension has been implicated for this event (Miller et al., Reference Miller, Geirsdóttir, Zhong, Larsen, Otto-Bliesner, Holland and Bailey2012; McGregor et al., Reference McGregor, Evans, Goosse, Leduc, Martrat, Addison and Mortyn2015; Büntgen et al., Reference Büntgen, Myglan, Ljungqvist, McCormick, Di Cosmo, Sigl and Jungclaus2016). In the case of the Himalayan glacier advances, this phase corresponds to the MOHITS1C glacial advance (regional age ~1500 ± 200 yr) that has been reported from the southern and eastern portions of the Himalaya and suggested to have been driven by Northern Hemisphere climatic events (Murari et al., Reference Murari, Owen, Dortch, Caffee, Dietsch, Fuchs, Haneberg, Sharma and Townsend-Small2014). However, the exact reasons for this dry event that does not bear any significant correlations with either the ice core or speleothem data is unclear and needs further investigation.
Apart from these cool/dry events, an overall gradual ameliorating trend in the hydroclimatic conditions is observed during this period (~3400–1500 cal yr BP) and correlates well with a progressive increase in total solar irradiance and the δ18O values of Guliya ice core. Correlations with the δ18O record of the Guliya ice core have been used as a proxy for monsoon strength. A comparable moist climate during ~3500–1800 cal yr BP using geochemical proxies from Badanital (central Himalaya; Kotlia and Joshi, Reference Kotlia and Joshi2013) and a warm and less humid climate during ~3200–2200 cal yr BP from Triloknath using palynological data (western Himalaya [Bali et al., Reference Bali, Chauhan, Mishra, Ali, Tomar, Khan, Singh and Srivastava2017]) have been reported. High-resolution speleothem data from Sainji Cave (central Himalaya [Kotlia et al., Reference Kotlia, Singh, Joshi and Dhaila2015]) also recorded an amelioration in climate during ~3000–2000 cal yr BP. In Chandra Valley, the period between ~3340 and 2030 cal yr BP records growth of a diverse vegetation cover with continuous expansion of wetland taxa resulting ultimately in the development of a mixed coniferous and broad-leaved forest (Rawat et al., Reference Rawat, Gupta, Sangode, Srivastava and Nainwal2015). Further, the study has also reported similar lowering of δ13C values and an increase in LOI percentage from ~2900 to 2030 cal yr BP, which indicates dominance of C3 vegetation under a warm and wet climatic condition. The increased moisture availability has been attributed to both snow and glacial melt, as well as from ISM moisture. Although the climatic inferences from the Tso Moriri lake (Leipe, Demske, Tarasov, Reference Leipe, Demske and Tarasov2014; Mishra et al., Reference Mishra, Prasad, Ambili, Plessen, Jehangir, Gaye, Menzel, Weise and Yousuf2015) are not in agreement with these data sets, the climate records from most of the ISM-influenced regions indicate the strengthening of ISM during this phase (Yadava and Ramesh, Reference Yadava and Ramesh2001; Chauhan et al., Reference Chauhan, Dayal, Basavaiah and Kader2010; Prasad, S. et al., Reference Prasad, Ambili, Riedel, Sarkar, Menzel, Basavaiah and Krishnan2014; Rawat et al., Reference Rawat, Gupta, Sangode, Srivastava and Nainwal2015). The disagreement between the previous studies (Tso Kar and Tso Moriri lakes) and our results may be attributed to the contribution of ISM and/or the attenuating impact of the westerlies (Wünnemann et al., Reference Wünnemann, Demske, Tarasov, Kotlia, Reinhardt-Imjela, Bloemendal and Diekmann2010; Leipe, Demske, Tarasov, Reference Leipe, Demske and Tarasov2014; Leipe, Demske, Tarasov, Wünnemann, et al., Reference Leipe, Demske, Tarasov, Wünnemann and Riedel2014; Mishra et al., Reference Mishra, Prasad, Ambili, Plessen, Jehangir, Gaye, Menzel, Weise and Yousuf2015) to these records. Our interpretations receive enhanced confidence from the suggestions that high monsoonal runoff has been recorded from the Indus River during the period from ~3500 to 2200 cal yr BP, based on varve thickness/counts verified by conventional and AMS 14C dating (von Rad et al., Reference Von Rad, Schaaf, Michels, Schulz, Berger and Sirocko1999). This phase of monsoon revival and warmer conditions in strengthening ISM conditions corresponds to the increased sea surface temperature in the northeastern Arabian Sea from ~3300 to 1500 yr BP (Doose-Rolinski et al., Reference Doose-Rolinski, Rogalla, Scheeder, Lückge and von Rad2001).
Late Meghalayan (~1500 cal yr BP to present)
Progressive increase in the moisture availability during this phase is punctuated by a prominent dry spell at ~400 cal yr BP (LIA). The observed climatic amelioration during the ~1500–400 cal yr BP coincides with the moderate expansion of broad-leaved, non-arboreal pollen and ferns recorded between ~1160 and 650 cal yr BP from the Chandra Valley (western Himalaya) under a climate amelioration (Rawat et al., Reference Rawat, Gupta, Sangode, Srivastava and Nainwal2015). This ameliorating trend is analogous to a strengthening ISM and has been reported from other Himalayan basins using different proxies (Bhattacharyya and Chauhan, Reference Bhattacharyya and Chauhan1997; Chauhan and Sharma, Reference Chauhan and Sharma2000; Kar et al., Reference Kar, Ranhotra, Bhattacharyya and Sekar2002; Kotlia and Joshi, Reference Kotlia and Joshi2013; Sanwal et al., Reference Sanwal, Kotlia, Rajendran, Ahmad, Rajendran and Sandiford2013; Sinha et al., Reference Sinha, Kathayat, Cheng, Breitenbach, Berkelhammer, Mudelsee, Biswas and Edwards2015; Bali et al, Reference Bali, Chauhan, Mishra, Ali, Tomar, Khan, Singh and Srivastava2017; Bird et al., Reference Bird, Lei, Perello, Polissar, Yao, Finney, Bain, Pompeani and Thompson2017; Srivastava et al., Reference Srivastava, Agnihotri, Sharma, Meena, Sundriyal, Saxena and Bhushan2018). A prominent increase in the δ13C values with lower TOC and LOI parameters suggests a dry climate at ~400cal yr BP (LIA cooling event). Relatively higher clay and silt content (low sand) during this time may be attributed to long-distance wind transport implying an arid cold climate (Ju et al., Reference Ju, Zhu, Feng, Wang, Wang, Xie, Peng, Zhen and Lü2012). A similar phase (~650–350 cal yr BP) has recorded a decline in most broad-leaved taxa and meadow vegetation in the Chandra Valley and has been attributed to a LIA cold-dry climate (Rawat et al., Reference Rawat, Gupta, Sangode, Srivastava and Nainwal2015). The LIA climate response has been recorded from different proxies ranging from glacier advance (Owen et al., Reference Owen, Derbyshire, Richardson, Benn, Evans and Mitchell1996) to lake records from different sectors of Himalaya with some chronological mismatch (Bhattacharyya, Reference Bhattacharyya1988; Mazari et al., Reference Mazari, Bagati, Chauhan, Rajagopalan, Mikami, Matsumoto, Ohta and Sweda1996; Bhattacharyya and Chauhan, Reference Bhattacharyya and Chauhan1997; Chauhan et al., Reference Chauhan, Mazari and Rajagopalan2000; Sharma and Chauhan, Reference Sharma and Chauhan2001; Kar et al., Reference Kar, Ranhotra, Bhattacharyya and Sekar2002; Chauhan, Reference Chauhan2006; Rawat et al., Reference Rawat, Gupta, Sangode, Srivastava and Nainwal2015; Bali et al., Reference Bali, Chauhan, Mishra, Ali, Tomar, Khan, Singh and Srivastava2017; Srivastava et al., Reference Srivastava, Agnihotri, Sharma, Meena, Sundriyal, Saxena and Bhushan2018). Despite the chronological disparity, the LIA cooling seems to have been present across the region. Although the Northern Hemisphere LIA glacial advances took place during 1400–1900 AD, the Himalayan LIA glacial advance occurred between 1300 and 1600 AD, slightly earlier than the coldest period in the Northern Hemisphere (Rowan, Reference Rowan2017). This earlier cooling in the Himalaya has been attributed to a southward shift in the Asian monsoon, increased westerly winter precipitation, and wetter conditions (Rowan, Reference Rowan2017).
Subsequently, after the LIA cooling, there is a decrease in δ13C and Rb/Sr values and an increase in TOC and LOI parameters, suggesting a wetter hydroclimate. A decrease in clay and an increase in the sand content imply that the climate was getting wetter under increasing moisture availability. Kumar and colleagues (Reference Kumar, Kumar and Pant1994) derived winter warming trends in an all-India temperature series and 0.08°C/10 yr for the NW region for 1901–1987. A similar and significant increasing trend in the winter temperature has been reported from the western Himalaya that exceeds the global averages (Bhutiyani et al. Reference Bhutiyani, Kale and Pawar2010).It is also reported that Uttarakhand is experiencing a significant warming and the temperature in hilly areas is rising more prominently than on the plains (Mishra Reference Mishra2017). Similarly, Shrestha and colleagues (Reference Shrestha, Wake, Mayewski and Dibb1999) found increases in winter maxima of for all Nepal, Himalayan, and Trans-Himalayan stations. Cook and colleagues (Reference Cook, Krusic and Jones2003) found indications of warming since 1960 at Kathmandu only in the period from October to January. Regional (high Asia) climate proxy records also show twentieth-century warming in the context of the last millennium (D'Arrigo et al., Reference D'Arrigo, Jacoby, Frank, Pederson, Cook, Buckley, Nachin, Mijiddorj and Dugarjav2001; Zhu et al., Reference Zhu, Zheng, Shao, Liu, Xu and Liang2008; Yadav et al., Reference Yadav, Braeuning and Singh2011; Shekhar et al., Reference Shekhar, Bhardwaj, Singh, Ranhotra, Bhattacharyya, Pal, Roy, Martín-Torres and Zorzano2017). This implies that an increase in temperature enhanced the snow and glacial melt and the moisture holding capacity of the atmosphere that directly affect the precipitation patterns and intensity (Trenberth et al., Reference Trenberth, Dai, Rasmussen and Parsons2003).
Our results suggest a gradual enhancement of hydroclimatic conditions in the Zanskar Valley since ~6200 cal yr BP and is in accordance with other studies (Chauhan et al., Reference Chauhan, Mazari and Rajagopalan2000; Kale et al., Reference Kale, Singhvi, Mishra and Banerjee2000, Reference Kale, Mishra and Baker2003; Phadtare, Reference Phadtare2000; Thomas et al., Reference Thomas, Wolff, Mulvaney, Steffensen, Johnsen, Arrowsmith, White, Vaughn and Popp2007; Sanwal et al., Reference Sanwal, Kotlia, Rajendran, Ahmad, Rajendran and Sandiford2013; Bhattacharya et al., Reference Bhattacharya, Rastogi, Thakkar, Patel and Juyal2014; Kotlia et al., Reference Kotlia, Singh, Joshi and Dhaila2015; Bali et al., Reference Bali, Chauhan, Mishra, Ali, Tomar, Khan, Singh and Srivastava2017). However, this trend is punctuated by abrupt reversals/dry periodsin the Zanskar Valley. Similar local events have been reported from the Dewar Tal (central Himalaya) where a cool and dry climate has been inferred at ~2500–2300, 2000–1400, and 400 cal yr BP (Chauhan and Sharma, Reference Chauhan and Sharma2000) that broadly corresponds to a cold, dry climate in the Kunzum pass area at around 2300–1500 cal yr BP (Chauhan et al., Reference Chauhan, Mazari and Rajagopalan2000).The mid-late Holocene has been a time of enhanced insolation (Crowley and North, Reference Crowley and North1991; Rupper et al., Reference Rupper, Roe and Gillespie2009) and a relatively stronger ISM. We attribute the gradual enhancement of hydrological conditions to total solar irradiance. The last ~1000 years are very important in the Holocene because two major climate events, including the MCA, which created wet conditions between 1050 and 600cal yr BP, and the LIA, a cold/dry period from 450 to 150BP,occurred during this time (Lamb, Reference Lamb1965; Crowley, Reference Crowley2000; Mann et al., Reference Mann, Zhang, Rutherford, Bradley, Hughes, Shindell, Ammann, Faluvegi and Ni2009; Polanski et al., Reference Polanski, Fallah, Befort, Prasad and Cubasch2014; Dixit and Tandon, Reference Dixit and Tandon2016). Both regional and global proxy reconstructions show spatial and temporal heterogeneity in these two climate events which have been ascribed to a complex array of forcings, feedbacks, and internal variability operating in the climate system (Agnihotri et al., Reference Agnihotri, Dutta, Bhushan and Somayajulu2002; Kaufman et al. Reference Kaufman, Schneider, McKay, Ammann, Bradley, Briffa and Miller2009; Yadav et al., Reference Yadav, Braeuning and Singh2011; Fernández-Donado et al. Reference Fernández-Donado, González Rouco, Raible, Ammann, Barriopedro, Garcia-Bustamante and Jungclaus2013; Lehner et al. Reference Lehner, Born, Raible and Stocker2013; Polanski et al., Reference Polanski, Fallah, Befort, Prasad and Cubasch2014; Dixit and Tandon, Reference Dixit and Tandon2016). However, solar output variations have been suggested as the main driver of both ISM (Neff et al., Reference Neff, Burns, Mangini, Mudelsee, Fleitmann and Matter2001; Gupta et al., Reference Gupta, Anderson and Overpeck2003) and the North Atlantic cycles (Bond et al., Reference Bond, Kromer, Beer, Muscheler, Evans, Showers, Hoffmann, Lotti-Bond, Hajdas and Bonani2001) and as the primary climate modulator.
CONCLUSIONS
Our multiproxy paleoclimatic record from the Penzi-la pass shows four climatic phases with an overall gradual improvement in the hydroclimatic conditions since ~6200 cal yr BP. Abrupt dry spells occurred at ~3300, 2600, 1700, and 400 cal yr BP and deserve careful attention in future investigations. Contrary to the earlier studies in the NW Himalaya, our results show increasingly positive hydroclimatic conditions in this transition zone between the Higher Himalaya and Trans-Himalaya (Zanskar Valley).Notable swings of climate like the MCA and LIA and their local and regional correlations indicate a common insolation forcing. This study indicates that the abrupt changes in the hydroclimate of the Zanskar Valley were also coupled with the northern latitude climatic events, although changes in solar radiation have been the primary driver.
ACKNOWLEDGMENTS
The authors are thankful to the Director, Birbal Sahni Institute of Palaeosciences, Lucknow, India, for his support and for providing infrastructural facilities (the Sophisticated Analytical Instruments Facilities at the Birbal Sahni Institute of Palaeosciences, publication no. 45/2019-20). Special thanks go to the Governments of Jammu and Kashmir for their help and for providing necessary permissions during the fieldwork. Thanks are also due to the field staff (Mr. Shenge Takpa) who worked tirelessly in the harsh conditions during fieldwork. Authors are grateful to the editor and anonymous reviewers for their valuable suggestions and constructive comments, which helped us improve the manuscript.
SUPPLEMENTARY MATERIAL
The supplementary material for this article can be found at https://doi.org/10.1017/qua.2020.22.


