


INTRODUCTION
Over recent decades, numerous studies have begun to provide an understanding of past variability in boreal forest ecosystems and the impacts of changing climate. Studies are increasingly using records of past forest change to understand modern forest environments and predict possible future changes (e.g., Bonan et al., Reference Bonan, Pollard and Thompson1992; Foley et al., Reference Foley, Kutzbach, Coe and Levis1994; Oltchev et al., Reference Oltchev, Cermak, Gurtz, Kiely, Nadezhdina, Tishenko and Zappa2002a, Reference Oltchev, Cermak, Nadezhdina, Tatarinov, Tishenko, Ibrom and Gravenhorst2002b; Soja et al., Reference Soja, Tchebakova, French, Flannigan, Shugart, Stocks, Sukhinin, Parfenova, Chapin and Stackhouse2007; Bonan, Reference Bonan2008; Novenko et al., Reference Novenko, Olchev, Desherevskaya and Zuganova2009a; Shugart and Woodward, Reference Shugart and Woodward2011). Boreal forest is the second largest biome globally and is both sensitive to climate change and plays an important role in climate regulation through carbon sequestration and storage and by influencing water and radiation budgets (Malhi et al., Reference Malhi, Baldocchi and Jarvis1999; Grace et al., Reference Grace, Meir and Malhi2001; Luyssaert et al., Reference Luyssaert, Schulze, Börner, Knohl, Hessenmöller, Law, Ciais and Grace2008). Current climate changes, including increasing air temperature, changing precipitation patterns, and increasing frequency of extreme weather events (e.g., heat waves and droughts), combined with rising CO2 concentrations may significantly change the productivity and distribution of boreal forests (IPCC, 2013). For instance, longer growing seasons and CO2 fertilization are likely to increase gross primary production (Bonan et al., Reference Bonan, Pollard and Thompson1992). However, the gradual increase in annual precipitation and surface moisture observed in many boreal forest regions may intensify paludification of soils and thus reduce forest productivity (Olchev et al., Reference Olchev, Deshcherevskaya, Kurbatova, Molchanov, Novenko, Pridacha and Sazonova2013; Pluchon et al. Reference Pluchon, Hugelius, Kuusinen and Kuhry2014). It is also likely that climate change will increase the frequency and intensity of forest disturbances such as fires, fungal diseases, and insect outbreaks (Ruckstuhl et al., Reference Ruckstuhl, Johnson and Miyanishi2008; Kilpeläinen et al., Reference Kilpeläinen, Kellomäki, Strandman and Venäläinenen2010). The possible responses of boreal forests to projected climate changes remain poorly quantified and will depend on the interaction of multiple forcing factors. Reconstructions of past environmental and ecological changes are essential to understand the potential mechanisms. Analysis of forest and wetland ecosystem dynamics during the mid- and late Holocene, characterized by periods of cooling and warming (Wanner et al., Reference Wanner, Beer, Bütikofer, Crowley, Cubasch, Flückiger and Goosse2008), may be particularly valuable.
In the European boreal zone, the available paleoecological data indicate that coniferous forests expanded between 5700 and 2500 cal yr BP (Kremenetski et al., Reference Krementski, Borisova and Zelikson2000; Kalis et al., Reference Kalis, Merkt and Wunderlich2003; Seppä and Poska, Reference Seppä and Poska2004; Giesecke and Bennett, Reference Giesecke and Bennett2004; Giesecke, Reference Giesecke2005; Zernitskaya and Mikhailov, Reference Zernitskaya and Mikhailov2009; Novenko et al., Reference Novenko, Volkova, Nosova and Zuganova2009b; Marquer et al., Reference Marquer, Gaillard, Sugita, Trondman, Mazier, Nielsen and Fyfe2014). Conifers replaced broadleaved deciduous species, which had been abundant during the Holocene thermal maximum (8000–5500 cal yr BP), apparently due to climatic cooling and increased land surface wetness (e.g., Seppä and Birks, Reference Seppä and Birks2001; Novenko et al., Reference Novenko, Volkova, Nosova and Zuganova2009b; Olchev and Novenko, Reference Olchev and Novenko2011), in combination with increasing anthropogenic disturbance (Clear et al., Reference Clear, Seppä, Kuosmanen and Bradshaw2015; Novenko et al., Reference Novenko, Tsyganov, Volkova, Babeshko, Lavrentiev, Payne and Mazei2015). During recent decades, a large number of studies have explored the paleoecology of eastern Europe and European Russia, including studies focused on vegetation history, wetland development, and carbon accumulation by peatlands (Arslanov et al., Reference Arslanov, Saveljeva, Gey, Klimanov, Chernov, Chernova, Kusmin, Tertychnaya, Subetto and Denisenkov1999; Stančikaite et al., Reference Stančikaite, Baltrŭnas, Šinkŭnas, Kisielienė and Ostrauskas2006; Niinemets and Saarse, Reference Niinemets and Saarse2009; Heikkilä and Seppä, Reference Heikkilä and Seppä2010; Mauquoy et al., Reference Mauquoy, Engelkes, Groot, Markesteijn, Oudejans, van der Plicht and van Geel2002; Mauquoy and Yeloff, Reference Mauquoy and Yeloff2008; Mitsch et al., Reference Mitsch, Bernal, Nahlik, Mander, Zhang, Anderson, Jørgensen and Brix2013; Tuittila et al., Reference Tuittila, Juutinen, Frolking, Väliranta, Laine, Miettinen, Seväkivi, Quillet and Merilä2014; van der Linden et al., Reference van der Linden, Heijmans and van Geel2014). Substantial knowledge gaps remain, however. Extensive areas of global boreal forest are paludified, with important implications for their ecosystem functioning, but the history of this paludification is not well understood, despite its importance in terms of vegetation change and wetland development. This is particularly true in the extensive southern taiga region of the East European Plain, where paludified forests are widespread (Hytteborn et al., Reference Hytteborn, Maslov, Nazimova and Rysin2005).
This study focuses on exploring these issues in a poorly investigated region of the East European Plain: the southern Valdai Hills. This is an area in which Sphagnum-Spruce (Picea abies) forest is widespread due to the combination of flat relief and elevated groundwater levels due to poorly drained soils. The study focuses on the Central Forest State Natural Biosphere Reserve (CFSNBR), an area under conservation management that is relatively distant from regions of industry and intensive agriculture and has few roads, allowing the possibility to study forest response to environmental change in a relatively natural setting. Recent studies in the CFSNBR have emphasized the importance of climatic factors and hydrological regime in vegetation history and peatland development (Minayeva et al., Reference Minayeva, Trofimov, Dorofeyeva, Chichagova, Sirin, Glushkov, Mikhailov and Kromer2008; Novenko et al., Reference Novenko, Olchev, Desherevskaya and Zuganova2009a, Reference Novenko, Volkova, Nosova and Zuganova2009b; Glushkov et al., Reference Glushkov, Sirin and Minayeva2016; Payne et al., Reference Payne, Malysheva, Tsyganov, Pampura, Novenko, Volkova, Babeshko and Mazei2016). Previous reconstructions of environmental change have demonstrated considerable climate variability and complex vegetation dynamics during the Holocene, characterized by alternating phases with domination of spruce and mixed coniferous broadleaved forests (Novenko et al., Reference Novenko, Volkova, Nosova and Zuganova2009b; Payne et al., Reference Payne, Malysheva, Tsyganov, Pampura, Novenko, Volkova, Babeshko and Mazei2016). Previous studies in the CFSNBR have focused particularly on one large raised bog (“Staroselsky Moch”) and are therefore well-suited for understanding large-scale environmental change, but poorly suited for understanding fine-scale changes occurring within the forest itself, such as the history of paludification.
The main aim of this study is to reconstruct the vegetation and paludification dynamics of a local depression located directly within the Sphagnum-Spruce (Picea abies) forest. The study site is situated in the core area of the CFSNBR, 6 km away from the Staroselsky Moch site. In this study we reconstruct environmental changes for the last 7000 yr using pollen, plant macrofossils, and testate amoeba analysis from radiocarbon-dated peat sequences. To provide a paleoclimatic context for interpreting the ecological changes at a local scale, the results are compared with paleoclimatic reconstructions from Staroselsky Moch (Novenko et al., Reference Novenko, Olchev, Desherevskaya and Zuganova2009a) and other paleoecological data from the region (Minayeva et al., Reference Minayeva, Trofimov, Dorofeyeva, Chichagova, Sirin, Glushkov, Mikhailov and Kromer2008; Payne et al., Reference Payne, Malysheva, Tsyganov, Pampura, Novenko, Volkova, Babeshko and Mazei2016).
STUDY AREA
The CFSNBR is situated in the southern Valdai Hills, in the Tver region of European Russia (56°35’N, 32°55’E; Fig. 1), located at the southern margins of the former Weichselian ice sheet. The total area of the nature reserve is about 705 km2. The study area is a slightly hilly plain with elevations of 220–250 m asl, reaching a maximum of 280 m asl on a moraine ridge that forms the watershed between the Caspian and the Baltic Sea drainage basins. The climate is temperate and moderately continental, with relatively cold winters (mean January temperature=--10°C), warm summers (mean July temperature=17.1°C), and a mean annual temperature of 4.1°C (meteorological observations of the CFSNBR, since 1963). Mean annual precipitation is ~700 mm (Desherevskaya et al., Reference Desherevskaya, Kurbatova and Olchev2010), with more than a half of this falling as rain during summer and autumn.

Figure 1 Location of the study area and the core site locations. (a) Location of the study area. (b) Digital Elevation Model of the Central Forest State Nature Biosphere Reserve showing location of the sampling sites (1, the Lesnoye peatland; 2, the Staroselsky Moch peatland). (c) Peat depth within the Sphagnum spruce forest and the location of peat monoliths.
Vegetation cover is primarily (47%) coniferous forest of Picea abies (L.) Karst. Betula pubescens Ehrh., B. verrucosa Ehrh; Populus tremula L. woodlands are common in areas affected by wind damage or forest fires (about 40%); Alnus glutinosa (L.) Gaertn. is abundant in wetter river valleys (1–2%). Much of the forest area has a dense ground-cover of Sphagnum and brown mosses, with peatlands covering about 16% of the total study area.
The study site is a Sphagnum-Spruce forest with peat deposits from 20 to 120 cm deep across a 600m-wide area between moraine ridges (Fig. 1). As there is no formal name for this site, we use the name ”Lesnoye” peatland. The site can be classified as Piceeta fruticoso-sphagnosa with an admixture of birch species (Betula pubescens Ehrh. and Betula verrucosa Ehrh.) amongst Picea abies (L.) Karst., a shrub layer of Vaccinium myrtillus L. and V. vitis-idaea L., and significant cover of Carex globularis L. and Linnaea borealis L. The dense moss layer includes Sphagnum magellanicum, S. angustifolium, and S. balticum.
MATERIALS AND METHODS
Detailed topographic mapping of the study area and peat depth measurements were undertaken in summer 2013 (Fig. 1). In August 2014, four peat monoliths were extracted from the peat deposits (Fig. 1). Monolith 1 (total depth of 85 cm) was sub-sampled for pollen, microscopic charcoal, testate amoebae, peat humification, and loss on ignition analyses at 1 cm intervals. Samples for plant macrofossil and peat decomposition analyses were extracted at 2–4 cm intervals. Monoliths 2 and 3 (38 and 25 cm depth, respectively) were sub-sampled for plant macrofossil analysis and peat decomposition at 5 cm intervals. Monolith 4 (total depth of 40 cm) was used to collect an additional basal sample of the peat for radiocarbon dating.
Chronologies for the monoliths were established by radiocarbon dating bulk peat samples (1 cm thick). In total, nine peat samples were collected (Table 1) with dating horizons positioned approximately every 20cm in most monoliths. Radiocarbon dating was conducted at the radiocarbon laboratory of the Institute of Geography of the Russian Academy of Science. The 14C dates were calibrated and age-depth models produced using the “clam 2.2” package (Blaauw, Reference Blaauw2010) in R (R Core Team, 2014). Pre-bomb radiocarbon dates were calibrated using the IntCal13 (Reimer et al., Reference Reimer, Bard, Bayliss, Beck, Blackwell, Bronk Ramsey and Buck2013) calibration curve, and post-bomb dates using the “postbomb_NH1” curve (Hua et al., Reference Hua, Barbetti and Rakowski2013). All calculations were undertaken at 2-sigma level.
Table 1 Details of radiocarbon dates used in this study.

Samples for macrofossil analysis (5–10 cm3) were disaggregated in water and washed through a 0.25 mm mesh sieve. The plant remains were picked out under a binocular microscope and identified following Katz et al. (Reference Katz, Katz and Skobeva1977) and Dombrovskaya et al. (Reference Dombrovskaya, Koreneva and Turemnov1959). The plant macrofossil content was presented by taxon as percentages of the total sum of identified remains. The degree of peat decomposition (R) was quantified as the percentage of amorphous mass and tissues without cell structure relative to the total microscopic field of view (Lishtvan and Korol, Reference Lishtvan and Korol1975). Loss on ignition (LOI) was determined following the protocol of Dean (Reference Dean1974). Weighed, dried, 50 g samples were combusted at 550°C, cooled in a desiccator, and re-weighed. Peat humification was determined using the standard alkali-extraction and colorimetry method (Chambers et al., Reference Chambers, Beilman and Yu2010, 2011) based on heating 0.2 g of dried, ground peat in 100 mL of 8% NaOH at 95°C for 1 h. The extract was diluted to 200 mL with distilled water and filtered (Whatman No. 1). The light absorbance of the extract was measured with a spectrophotometer (KFK-3-01-“ZOMZ”, Russia) at a 540 nm wavelength. Readings were corrected for loss on ignition using the formula A1 = A0 / LOI, where A1 is the corrected absorbance values, A0 is the raw absorbance value, and LOI is loss on ignition expressed as a proportion.
Samples for pollen analysis were prepared following Moore et al. (Reference Moore, Webb and Collinson1991). The treatment included heating with 10% KOH for 10 min to remove the humic material, followed by acetolysis in a water bath for 5 min to dissolve the cellulose. Calculation of relative pollen frequency was based on the total terrestrial pollen sum (arboreal pollen (AP) and non-arboreal pollen (NAP), spores were not included). A minimum total of 500 pollen grains (AP + NAP) per sample were counted. Pollen identification followed Reille (Reference Reille1992) and Beug (Reference Beug2004). In order to determine pollen and charcoal concentrations, Lycopodium tablets were added to each sample (Stockmarr, Reference Stockmarr1971). Pollen diagrams were constructed using Tilia and TGView programs (Grimm, Reference Grimm1990). Microscopic charcoal concentrations were assessed by direct microscopy (400× magnification) following the point-count methodology (Clark, Reference Clark1982; Finsinger et al., Reference Finsinger, Tinner and Hu2008). At least 200 particles (the sum of charcoal particles and Lycopodium spores) were counted. Results are presented as micro-charcoal accumulation rate (particles cm−2 yr−1). Stratigraphic zones based on plant macrofossils and pollen assemblages were defined by constrained incremental sum of squares (CONISS) cluster analysis (Grimm, Reference Grimm1987).
Samples for testate amoeba analysis were prepared for microscopy using a modified version of the water-based preparation method proposed by Hendon and Charman (Reference Hendon and Charman1997). Samples were soaked in distilled water for 24 h, agitated on a flask shaker for 5 min, sieved through a 500 μm mesh to remove coarse material, and left to settle for an additional 24 h. The supernatant was decanted off and the samples were mixed with neutralized formaldehyde and stored in glass vials (Mazei et al., Reference Mazei, Chernyshov, Tsyganov and Payne2015). Two millilitres of the concentrated sample were placed in a Petri dish and inspected at 160× magnification under a dissecting microscope. All testate amoebae were identified and counted in 200 microscopic fields. Testate amoeba data were analysed and plotted using the package “Analogue” (Simpson, Reference Simpson2007) in R (R Core Team, 2014).
A Modern Analogue Technique (MAT) reconstruction of total woodland coverage in a 20 km area surrounding the study site was undertaken based on the fossil pollen data. The approach is based on analogue matching of fossil pollen assemblages to modern pollen data sets and was originally developed by Overpeck et al. (Reference Overpeck, Webb and Prentic1985) and extended by Nakagawa et al. (Reference Nakagawa, Tarasov, Kotoba, Gotanda and Yasuda2002); full details are presented in Novenko et al. (Reference Novenko, Eremeeva and Chepurnaya2014, Reference Novenko, Tsyganov, Volkova, Babeshko, Lavrentiev, Payne and Mazei2015). The modern calibration dataset consisted of 720 surface pollen samples from a wide variety of landscapes in Europe and West Siberia (30–55°N, 45–65°E) from the European Pollen Database (Davis et al., Reference Davis, Zanon, Collins, Mauri, Bakker, Barboni and Barthelmes2013) and the Russian Pollen Database (Chepurnaya and Novenko, Reference Chepurnaya and Novenko2015). We estimated the proportion of forest cover within a radius of 20 km using MODIS satellite images and Vegetation Continuous Fields estimates of modern tree cover (Hansen et al., Reference Hansen, Townshend, DeFries and Carroll2005) for each location. As a measure of dissimilarity between fossil and modern pollen assemblages, squared-chord distances (SCD) were calculated. The assemblages were considered to be analogous if SCD values were less than 0.2. For each fossil assemblage, the eight best modern analogues were identified; the corresponding data for their woodland coverage were averaged and accepted as a reconstructed value. MAT calculations were performed with Polygon 2.2.4 (http://polsystems.rits-palaeo.com). Leave-one-out cross-validation showed a relatively strong correlation (R2 = 0.57, RMSEP = 10.8%) of pollen-based modern forest cover reconstructions with original MODIS measurements (Novenko et al., Reference Novenko, Eremeeva and Chepurnaya2014).
RESULTS
Age-depth model, peat initiation and accumulation
The topographic survey and peat depth measurements showed that the underlying topography of the site is complex and characterised by multiple depressions (Fig. 1). These depressions may have served as wet nucleation points, promoting the paludification of the wider area. Based on the age-depth model of Monolith 1 (Fig. 2), peat accumulation rates were 0.10 mm yr−1 during the period from 6600 to 3960 cal yr BP; increased to 0.14 mm yr−1 between 3960 and 2900 cal yr BP; declined to 0.08 mm yr−1 for 2900–500 cal yr BP; and were highest (0.44 mm yr−1) over the last 500 years. Accounting for the errors of the dates and limitations of the linear interpolation age-depth model construction, peat accumulation can be considered broadly consistent for most of the Holocene, increasing in the recent past due to the transition to relatively undecomposed surface peat.

Figure 2 (color online) Age-depth model for Monolith 1 based on radiocarbon dates listed in Table 1.
Radiocarbon dating of the basal sample from Monolith 4 showed that peat initiation in this location, most likely representing lateral expansion of the wetland from the nearby depressions, took place around 1600 cal yr BP. The basal peat layers included wood and charcoal fragments, suggesting a possible role for burning in peat initiation. Lateral expansion of the wetland affected more elevated sites later, with basal dates from Monoliths 2 and 3 around 900 cal yr BP (Table 1).
Plant macrofossil, peat decomposition, humification and organic matter content
Plant macrofossil analysis of Monolith 1 indicated that the peat deposits could be divided into four macrofossil assemblage zones (MAZ; Fig. 3A). MAZ 1 (86–59 cm, 6600–4000 cal yr BP) is characterized by well-decomposed (R >70%) peat dominated by graminoid remains. Particularly high abundance of Phragmites and Menyanthes was observed at 80–72 cm and implies considerable nutrient input 6100–5300 cal yr BP. Some tree macrofossils were identified (5–7% Picea abies, Pinus sylvestris, Betula sp., and Salix sp.) and mosses were rare. In MAZ 2 (59–26 cm, 4000–500 cal yr BP), the proportion of tree macrofossils increased (Picea abies, 50–60%; Pinus sylvestris, 10–20%) and wood fragments of broadleaved trees were noted while graminoids declined (<20%). The peat composition in MAZ 3 (26–9 cm, 500–5 cal yr BP) was similar to the previous zone, although the degree of decomposition decreased to 20%. Remains of Picea abies and graminoids were still abundant, with Sphagnum mosses as significant component of the assemblage for the first time (up to 10%). MAZ 4 (9–0 cm, 5 cal yr BP– present) was characterized by poorly decomposed (10–15%) Sphagnum peat formed by Sphagnum fallax, S. angustifolium, S. centrale, and S. teres, with a small proportion of other Sphagnum mosses, wood, and other vascular plants.

Figure 3 Plant macrofossil diagram also showing degree of peat decomposition (R), for (a) Monolith 1, (b) Monolith 2, and (c) Monolith 3. Loss on ignition (LOI) and humification results as absorbance values (solid line, raw readings; dotted line, corrected for LOI) are also shown for Monolith 1.
Results of peat humification analysis from Monolith 1 correspond well with the microscopic peat decomposition analysis (Fig. 3A). Overall, peat humification increased with depth except for the bottom layers (88–86 cm, 7000–6400 cal yr BP), where it was exceptionally low because of the low proportion of organic matter. The next zone (83–59 cm, 6400–4000 cal yr BP) began with a peak in absorbance, which could be related to charcoal accumulation (see below). This zone was generally characterized by well-humified peat. At depths of 59–26 cm (4000–500 cal yr BP), absorbance gradually decreased, which could be related to a greater proportion of wood remains. In the zone from 26–9 cm (500–5 cal yr BP), absorbance remained low, most likely due to increased surface moisture associated with the appearance of Sphagnum mosses at the site. The upper layer (9–0 cm, 5 cal yr BP– present) was characterized by gradually decreasing peat humification due to the presence of poorly humified plant remains.
Analysis of LOI in Monolith 1 showed that the organic content was high throughout the entire peat profile with the exception of the base of the sequence (88–85cm), where it varied from 70 to 75%. Above 85cm, the organic content increased sharply to 92% (85–68 cm, 6600–5000 cal yr BP) and then gradually rose to 96–97% at 68–25 cm (5000–500 cal yr BP). In the upper layers, LOI declined to 92–94%; this suggests an influx of mineral material, although there was very little mineral content in the uppermost 4 cm of fresh vegetation.
Plant macrofossil analysis of Monoliths 2 and 3 showed that both profiles consisted of two distinct layers, separated at the depth of 15 cm in Monolith 2 and 11 cm in Monolith 3 (Fig. 3B and C). The lower layers were formed of well-decomposed wood and graminoid peat, with the decomposition degree gradually decreasing from 70 to 40% up the profile. Picea was the most significant macrofossil component overall but decreased in abundance towards the top of both profiles. The upper layers were less decomposed (5–15%) and mainly consisted of Sphagnum fallax, S. angustifolium, and S. girgensohnii.
Testate amoebae
Testate amoebae were uncommon in the peat deposits and were not observed below 38 cm (Fig. 4). Amoebae initially became abundant with the appearance and development of Sphagnum mosses at a depth of 24 cm (430 cal yr BP). Overall, 33 taxa of testate amoebae were identified, with the most abundant being Nebela militaris (49% of the total count), Trigonopyxis arcula (6%), Nebela collaris (5%), Arcella catinus (5%), and Physochilla griseola (4%). Changes in testate amoeba assemblages indicated a shift from dry to moderately wet surface moisture conditions at a depth of 13 cm (110 cal yr BP).
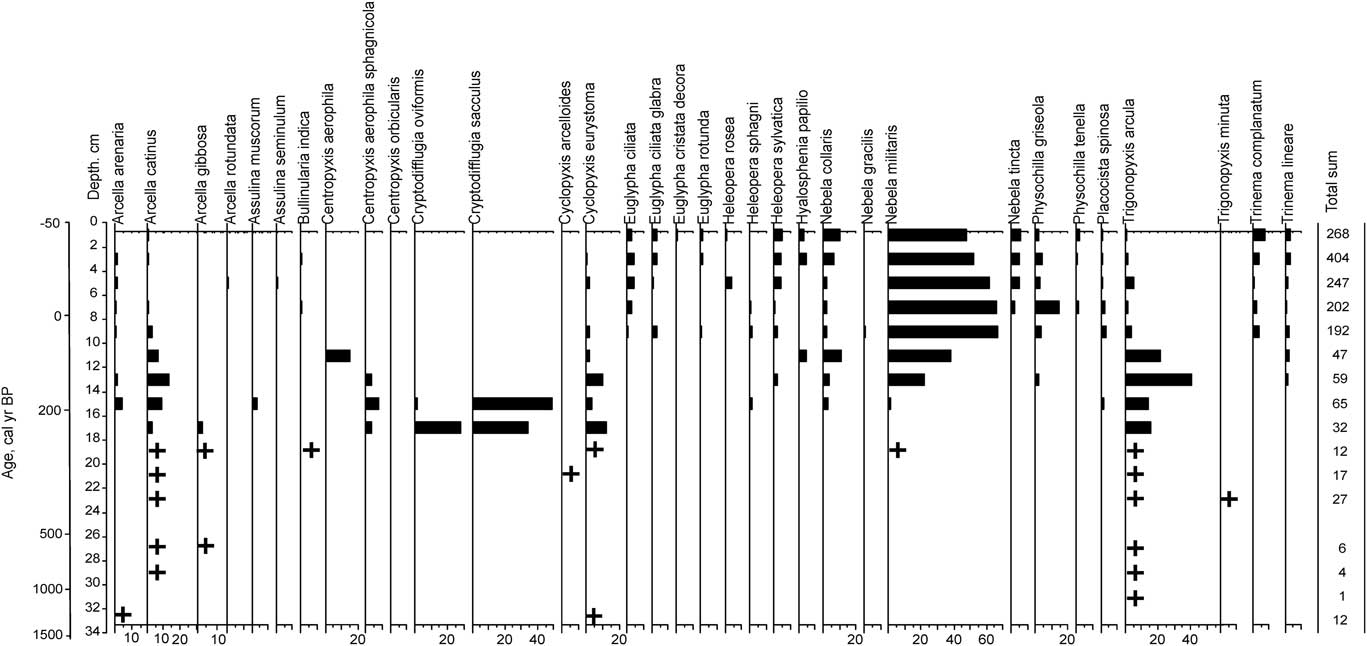
Figure 4 Testate amoeba diagram for Monolith 1.
Pollen analysis and microscopic charcoal
The pollen diagram could be divided into seven local pollen assemblage zones (PAZ), corresponding to the main phases of vegetation development (Fig. 5).

Figure 5 Pollen diagram and microscopic charcoal concentrations for Monolith 1. Pollen sum: arboreal pollen + non-arboreal pollen (AP + NAP); additional curves represent 10× exaggeration of base curves.
PAZ 1 (88–82 cm, 7000–6520 cal yr BP) was dominated by arboreal pollen (up to 80%), with Betula, Alnus, and Pinus most abundant. Pollen of Picea, Corylus, and broadleaved trees (Quercus, Ulmus, and Tilia) were present in lesser quantities; only a few grains of Salix and Euonymus were found. The NAP group was dominated by Poaceae and Artemisia, with Ranunculaceae, Polygonaceae, and Asteraceae less abundant. Spores of Polypodiaceae were notably very abundant (from 200 to 400% of AP + NAP), while spores of Pteridium and Sphagnum occurred occasionally.
Pollen assemblages of zone PAZ 2 (82–70 cm, 6520–5350 cal yr BP) were characterized by a noticeable peak in Betula (up to 80%), whereas all other taxa, except for Picea (10–20%), were reduced. After their substantial abundance in PAZ 1, Polypodiaceae spores decreased abruptly to 1–2%.
In PAZ 3 (70–42 cm, 5320–2580 cal yr BP), the proportion of AP increased to 98%, associated with greater abundances of Pinus, Tilia, Quercus, and Ulmus but reduced Betula. The proportion of Picea pollen gradually increased (30 to 50%), while some grains of Carpinus and Thelycrania cf. sanguinea were noted. Among the NAP group, Asteraceae, Chenopodiaceae, Ranunculaceae, and Ericaceae were common, whereas Artemisia and Poaceae were present but rare (0.5–1%). The proportion of spores (Sphagnum, Polypodiaceae, Equisetum, and Pteridium) was less than 10%.
PAZ 4 (42–30 cm, 2580–1200 cal yr BP) was characterized by a considerable increase in Picea and Alnus to 55% and 20%, respectively. The composition of herbaceous pollen and spores was similar to the previous zone.
A noticeable decrease in the proportions of Picea, Quercus, and Tilia was detected in PAZ 5 (30–20 cm, 1200–350 cal yr BP). At the same time, the proportion of Betula pollen rose to 60%. The lower boundary of the zone was marked by small peak of Corylus pollen (20%). The proportions of NAP (mainly Ericales, Artemisia, Apiaceae, Caryophillaceae, and Humulus lupulus) were generally low.
AP proportions in PAZ 6 (20–9 cm, 350–5 cal yr BP) remained relatively high (90–95%) and were maximal for Picea (60%) and Alnus (up to 20%). Tilia and Quercus disappeared completely; Ulmus and Corylus declined considerably, while Betula continued to be abundant (50%). The abundance of the NAP group slightly increased and was mainly composed of Artemisia, Chenopodiaceae, Asteraceae, and Polygonaceae. The pollen of ruderal plants (Centaurea cyanus, Plantago, Cichoriaceae, and Rubiaceae) was noted.
The uppermost layer of the monolith (PAZ 7, 9–0 cm, the last 60 years), was marked by increased proportions of Betula (above 80%) and Pinus (15–20%), with a simultaneous decrease in the proportions of Picea and Alnus. The proportion of Picea pollen varied between 10 and 20%, whereas the proportion of Alnus was less than 7%. Among the NAP group, Artemisia, Poaceae, and Chenopodiaceae were common. Pollen of Urtica was also present.
The micro-charcoal accumulation rate (CHAR) was about 4000–6000 particles cm–2 yr−1 during 7000–6520 cal yr BP. Throughout the majority of the sequence (6520 to 540 cal yr BP) CHAR varied in the range of 100–700 particles cm–2 yr−1, with peaks up to 2500–3000 particles cm–2 yr−1 at 4090, 3200, 2820, 1860, and 1200 cal yr BP. A distinct peak of CHAR (54400 particles cm–2 yr−1) was detected at 450–400 cal yr BP. During the last 400 years CHAR varied from 3000 to 20000 particles cm–2 yr-1.
Woodland coverage
Reconstructed woodland coverage (Fig. 5) in the study area was about 60–70% during 7000–6520 cal yr BP, decreasing to 40–50% from 6200–5000 cal yr BP. Woodland coverage remained relatively high (60–70%) until the last 50 years when a considerable reduction was reconstructed at 7–5 cm (in the middle of the twentieth century), corresponding to an abrupt reduction in Picea and an increase in Betula.
DISCUSSION
The time period 7000–5500 cal yr BP
Analyses of pollen, plant macrofossils, peat humification, testate amoebae, and micro-charcoal from this small forest peatland allowed us to reconstruct vegetation dynamics and peatland development over the last 7000 years. The initial stages of peatland development were characterized by a predominance of eutrophic herbaceous plants and relatively high peat accumulation rates, as is typical for fens in this type of landscape (e.g., Kalnina et al., Reference Kalnina, Stivrins, Kuske, Ozola, Pujate, Zeimule, Grudzinska and Ratniece2015). The pollen and plant macrofossil data suggests that the study area was occupied by a broadleaved forest of Tilia, Quercus, Ulmus, Alnus, Betula, and some Picea during the period 7000–6600 cal yr BP. The well-developed shrub understory included Viburnum opulus, Corylus avellana, Frangula alnus, and Salix sp. The high micro-charcoal accumulation rate detected between 7000 and 6300 cal yr BP indicates relatively intensive burning in adjacent areas. Total woodland coverage declined from 6200–5000 cal yr BP (Fig. 6), most likely due to fire, with Betula and Pinus partly replacing other species in secondary forest (Gromtsev, Reference Gromtsev2002). The same features were observed in a number of pollen diagrams from boreal forests in Finland (Clear et al., Reference Clear, Seppä, Kuosmanen and Bradshaw2015), Russian Karelia (Kuosmanen et al., Reference Kuosmanen, Seppä, Reitalu, Alenius, Bradshaw, Clear, Filimonova and Kuznetsov2016), and central European Russia (Novenko et al., Reference Novenko, Tsyganov, Volkova, Kupriyanov, Mironenko, Babeshko, Utkina, Popov and Mazei2016), where pollen values of pioneer trees (Pinus, Betula, Alnus, and Populus) increased significantly following charcoal peaks. It is important to note, however, that the abundance of wind-pollinated plants with high pollen productivity, such as Betula, Alnus, and Pinus, is always overestimated (Lisitsyna et al., Reference Lisitsyna, Giesecke and Hicks2011; Marquer et al., Reference Marquer, Gaillard, Sugita, Trondman, Mazier, Nielsen and Fyfe2014; Novenko et al., Reference Novenko, Mazei and Zernitskaya2017).
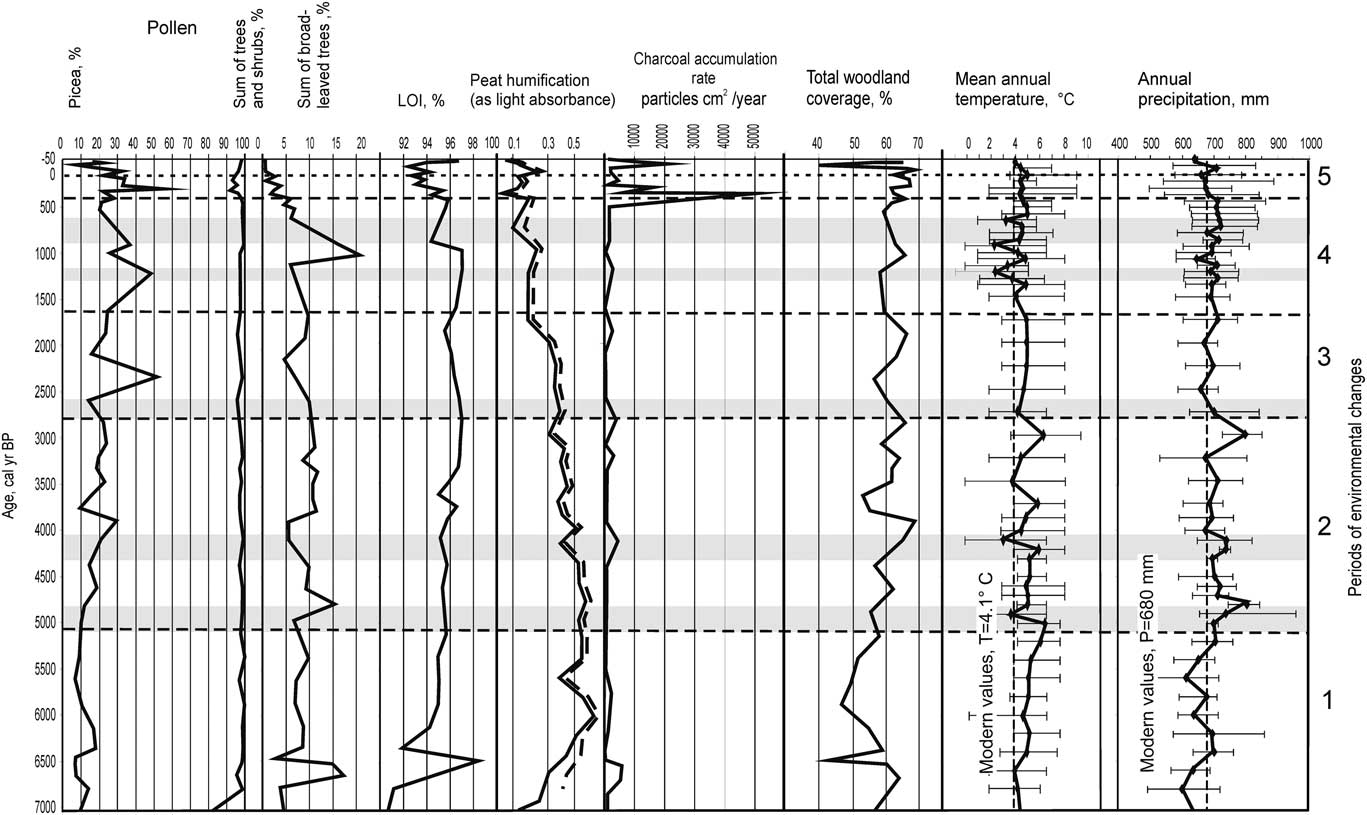
Figure 6 Holocene climate reconstructions from Staroselsky Moch peatland (modified from Novenko et al., Reference Novenko, Olchev, Desherevskaya and Zuganova2009a) and summary of results of multiproxy analysis of Monolith 1 in this study including: peat humification, LOI, characteristic pollen taxa, and micro-charcoal accumulation rate. Gray bands indicate intervals of cool climate.
Pollen data from a number of other sites in the East European Plain, including locations in Estonia (Seppä and Poska, Reference Seppä and Poska2004; Niinemets and Saarse, Reference Niinemets and Saarse2009), Latvia (Heikkilä and Seppä, Reference Heikkilä and Seppä2010), Lithuania (Stančikaite et al., Reference Stančikaite, Baltrŭnas, Šinkŭnas, Kisielienė and Ostrauskas2006), Belarus (Zernitskaya and Mikhailov, Reference Zernitskaya and Mikhailov2009), and European Russia (Arslanov et. al., Reference Arslanov, Saveljeva, Gey, Klimanov, Chernov, Chernova, Kusmin, Tertychnaya, Subetto and Denisenkov1999; Kremenetski et al., Reference Krementski, Borisova and Zelikson2000; Velichko et al., Reference Velichko, Kremenetski, Negendank, Mingram, Borisova, Gribchenko and Zelikson2001; Novenko et al., 2009b, Reference Novenko, Tsyganov, Volkova, Babeshko, Lavrentiev, Payne and Mazei2015), demonstrated a wide distribution of broadleaved forests with Quercus and Ulmus as dominant species during 7000–5500 cal yr BP. Pollen grains of Picea are commonly found in pollen assemblages, but their low abundances indicate scattered presence within forest dominated by broadleaved species. In contrast, in eastern and northeastern regions of European Russia the proportion of spruce pollen was greater (up to 5–10%) (Velichko et al., Reference Velichko, Kremenetski, Negendank, Mingram, Borisova, Gribchenko and Zelikson2001) indicating more mixed coniferous-broadleaved forests (Gieseke and Bennet, Reference Giesecke and Bennett2004). Spruce was still more abundant in this time period in Karelia (northwestern Russia) with Picea pollen around 20–30% of the assemblages at about 7000 cal yr BP (Kuosmanen et al., Reference Kuosmanen, Seppä, Reitalu, Alenius, Bradshaw, Clear, Filimonova and Kuznetsov2016).
A previously published climate reconstruction based on the pollen data from Staroselsky Moch peatland (Novenko et al., Reference Novenko, Olchev, Desherevskaya and Zuganova2009a) suggested that the mean annual temperature in the study area was about 5–7°С between 7000 and 5500 cal yr BP, which exceeds modern values by 1–3°С (Fig. 6) and accords with reconstructions in the Baltic region and Fennoscandia (Seppä and Birks, Reference Seppä and Birks2001; Heikillä and Seppä, Reference Heikkilä and Seppä2010). Annual precipitation was about 550 mm yr−1 during 7000–6600 cal yr BP and slightly higher (600–700 mm) during 6600–5500 cal yr BP, similar to modern values. The climatic conditions between 7000 and 5500 cal yr BP were drier than present, probably due to low summer precipitation and high evapotranspiration, as indicated by a high degree of peat decomposition (above 70%, see Fig. 3A) and high fire activity. Charcoal data from a number of peatlands in Northern Karelia, Finland (Pitkänen et al., Reference Pitkänen, Tolonen and Jungner2001; Kasin et al., Reference Kasin, Blanck, Storaunet, Rolstad and Ohlson2013) and the Meshchera Lowlands (Novenko et al., Reference Novenko, Tsyganov, Volkova, Kupriyanov, Mironenko, Babeshko, Utkina, Popov and Mazei2016), suggest that the mid-Holocene, and especially the period 8000–6000 cal yr BP, was characterized by intensive forest fires.
The time period 5500–2600 cal yr BP
Palaeoclimatic reconstructions based on various natural archives in Europe have demonstrated that the Holocene thermal maximum was followed by gradual climatic cooling at 5700–5500 cal yr BP (Davis et al., Reference Davis, Brewer, Stevenson and Guiot2003; Wanner et al., Reference Wanner, Beer, Bütikofer, Crowley, Cubasch, Flückiger and Goosse2008; Mauri et al., Reference Mauri, Davis, Collins and Kaplan2015), possibly influenced by a decrease in summer insolation (Berger, Reference Berger1978; Wright et al., Reference Wright, Kutzbach, Webb, Ruddiman, Street-Perrot and Bartlein1993). The temperature decline triggered vegetation changes throughout the East European Plain, with an increasing abundance of Picea and Pinus in forest communities and a reduced abundance of broadleaved trees. However, the proportion of broadleaved trees in forests remained relatively high in central European Russia, Belarus, and the Baltic States during the period 5700–4000 cal yr BP (Kremenetski et al., Reference Krementski, Borisova and Zelikson2000; Heikillä and Seppä, Reference Heikkilä and Seppä2010; Zernitskaya et al., Reference Zernitskaya, Stančikaitė, Vlasov, Šeirienė, Kisielienė, Gryguc and Skipitytė2015). The increasing proportion of Picea in pollen assemblages from the northern and northeastern parts of European Russia suggests an active expansion of spruce following 5700 cal yr BP. Pollen data from the Polovetsko-Kupanskoye peatland (Khotinski and Klimanov, Reference Khotinski and Klimanov1997) and Galich Lake (Velichko et al, Reference Velichko, Kremenetski, Negendank, Mingram, Borisova, Gribchenko and Zelikson2001) in the Upper Volga region show that the proportion of Picea in the assemblages rose to 70–80% at 5500 cal yr BP. The proportion of Picea in the pollen spectra of Staroselsky Moch peat bog also increased to 40%, compared to 20% in the Lesnoye peat monolith. In modern pollen assemblages from spruce forests within the southern taiga zone Picea pollen values vary from 12 to 40 % (Nosova et al., Reference Nosova, Severova, Volkova and Kosenko2015), strongly suggesting the existence of spruce forest in the study area during this interval. However, the proportion of Picea macrofossils in the peat monolith remained low until 4000 cal yr BP, suggesting that, while spruce was present in the landscape it was not growing in the immediate vicinity of the sampling point. Local vegetation of the peatland was dominated by Calamagrostis sp. and other herbs, implying rich fen conditions that were not conducive to tree establishment.
Considerable changes in both the local peatland ecosystem and the surrounding area occurred after 4000 cal yr BP. In the peat monolith, this boundary was marked by a transition from eutrophic herb peat to highly decomposed wood peat with high organic matter content.
A sharp increase in the abundance of Picea macrofossil remains (to 55–60%; Fig. 3A) and pollen occurred after 4000 cal yr BP. This is consistent with the observation that, after 4000 cal yr BP, Picea reached its maximum abundance during the Holocene in most sites in Belarus (Zernitskaya and Mikhailov, Reference Zernitskaya and Mikhailov2009) and the Baltic States (Saarse et al. Reference Saarse, Poska, Kaup and Heinsalu1998; Niinemets and Saarse, Reference Niinemets and Saarse2009). In a pollen record from Estonia, Picea was dominant during 4000–2500 cal yr BP, reaching 55–75% (Seppä and Poska, Reference Seppä and Poska2004). Nevertheless, broadleaved trees and Corylus persisted in the central part of the East European Plain, as indicated by their relatively high pollen values (Velichko et al., Reference Velichko, Kremenetski, Negendank, Mingram, Borisova, Gribchenko and Zelikson2001; Kremenetski et al., Reference Krementski, Borisova and Zelikson2000; Novenko et al., Reference Novenko, Olchev, Desherevskaya and Zuganova2009a), and by the findings of wood remains in Monolith 1. Pollen of the shrub Thelycrania sanguinea, which is characteristic for broadleaved forests and absent in modern flora of the study region, was also found in pollen assemblages from Monolith 1.
Climate reconstructions for the study area based on pollen data from the Staroselsky Moch peatland show the first notable cooling at 5000 cal yr BP (Fig. 6), when the mean annual temperature was close to modern values (4.1°C). About 4000 cal yr BP, the mean annual temperature declined to 3ºС and precipitation increased to 750–800 mm year−1. It appears that low evaporation and relatively high precipitation promoted an increasing proportion of Picea in the forest stands. According to the reconstruction of Olchev and Novenko (Reference Olchev and Novenko2011) based on a process-based evapotranspiration model (Oltchev et al., Reference Oltchev, Cermak, Gurtz, Kiely, Nadezhdina, Tishenko and Zappa2002a), the ratio between actual evaporation and precipitation decreased from 0.60–0.65 during 7000–5700 cal yr BP to 0.55–0.60 for 5700–4500 cal yr BP. After 5000 cal yr BP, the aridity index (the ratio of annual precipitation to potential evapotranspiration [Budyko, Reference Budyko1974]) varied between 1.2 and 1.6. This agrees with the finding of moist surface conditions in the study area.
The time period 2600 – 1600 cal yr BP
During the late Holocene, the proportion of spruce continued to increase. The layer of well-humified eutrophic peat formed between 2900 and 1600 cal yr BP in Monolith 1 included extensive remains of Picea and reconstructed woodland coverage around the site reached 60–70%. This corresponds well to the modern forest cover (60%) estimated with MODIS data for relatively undisturbed areas in the forest zone of European Russia (Ershov, Reference Ershov2007). At about 2600 cal yr BP, spruce forest became the main vegetation type in the Eastern Europe Plain, particularly in areas where human impact had not yet led to significant changes of vegetation (Kremenetski et al., Reference Krementski, Borisova and Zelikson2000; Seppä and Poska, Reference Seppä and Poska2004; Novenko et al., 2009b; Heikillä and Seppä, Reference Heikkilä and Seppä2010; Zernitskaya et al., Reference Zernitskaya, Stančikaitė, Vlasov, Šeirienė, Kisielienė, Gryguc and Skipitytė2015). After 2600 cal yr BP, these coniferous forests spread from the Valdai Upland and the northeastern part of European Russia to the central regions. An abundance of Picea in the central part of European Russia is demonstrated by pollen assemblages from Dolgoe Lake (situated on the Smolensk-Moscow Upland in the Moscow region), where a pronounced maximum of Picea (up to 55%) and a sharp decrease in Quercus, Ulmus, Tilia, and Corylus pollen values occurred during 2600–1800 cal yr BP (Kremenetski et al., Reference Krementski, Borisova and Zelikson2000).
Climate reconstructions for the period from 2600 cal yr BP to present based on pollen data from Staroselsky Moch peat bog showed large variations in temperature and precipitation. At the beginning of this period, mean annual temperature and precipitation were close to modern values (Fig. 6). Then, during the period of 2500–1600 cal yr BP, the temperature slightly increased to 4.5–5°C, whereas precipitation remained around 700 mm yr–1.
The time period 1600 – 400 cal yr BP
After 1600 cal yr BP, vertical peat growth in the study area increased to 0.25 mm yr−1 and the area of wetlands expanded beyond the local depressions, as indicated by the radiocarbon date from Monolith 4. The remains of wood and charcoal fragments found at the bottom of the deposits suggest that paludification of the spruce forest began after burning and disturbance of the tree canopy. This finding parallels that of studies in other locations across Europe where charcoal has been found associated with peat initiation, potentially due to reduced evapotranspiration triggering paludification (Caseldine and Hatton, Reference Caseldine and Hatton1993; Moore Reference Moore1993). In the Lesnoye peatland, the increased micro-charcoal accumulation rate and high fluctuations in pollen values of Picea, Betula, and Pinus apparently indicate a high fire activity during 1500–1300 cal yr BP.
The pollen-based climatic reconstruction for the peat deposits of Staroselsky Moch revealed several cooling and warming phases between 1600 and 400 cal yr BP. Based on available data for northern Europe and the Baltic States, the gradual cooling during the second half of the Holocene was interrupted by several warming and cooling phases (Arslanov et al., Reference Arslanov, Saveljeva, Gey, Klimanov, Chernov, Chernova, Kusmin, Tertychnaya, Subetto and Denisenkov1999; Wanner et al., Reference Wanner, Beer, Bütikofer, Crowley, Cubasch, Flückiger and Goosse2008; Davis et al., Reference Davis, Brewer, Stevenson and Guiot2003; Heikkilä and Seppä, Reference Heikkilä and Seppä2010; Novenko et al., Reference Novenko, Tsyganov, Volkova, Babeshko, Lavrentiev, Payne and Mazei2015). The area of wetlands at Lesnoye peatland expanded after 900 cal yr BP, as evidenced by the ages of the basal peat in Monoliths 2 and 3, located in the shallow “bridges” between the depressions in topography (Fig. 1). Paludification may have been promoted by a shift to cooler and wetter conditions at this time (Seppä and Poska, Reference Seppä and Poska2004; Mann et al., Reference Mann, Zhang, Rutherford, Bradley, Hughes, Shindell, Ammann, Faluvegi and Ni2009). Changes in forest composition also occurred as wetlands expanded. Reduced abundance of broadleaved taxa and increasing Picea pollen percentages (Fig. 6) indicate that spruce forests replaced mixed broadleaved-spruce communities. The lower peat layers in Monoliths 1–2 feature the remains of Picea, Cyperaceae, Poaceae, and a small proportion of Sphagnum, consistent with an expansion of waterlogged spruce forest.
The time period 400 cal yr BP – present
Considerable changes at the local and regional scale occurred during the last 400–350 years. The appearance and development of Sphagnum mosses at the Lesnoye site, increased peat accumulation rates, reduced humification, and abundant assemblages of testate amoebae indicate wet, acidic conditions favouring further forest paludification. Based on radiocarbon dating of peat depositions in a number of sites in the CFSNBR (Minayeva et al., Reference Minayeva, Trofimov, Dorofeyeva, Chichagova, Sirin, Glushkov, Mikhailov and Kromer2008; Novenko et al., Reference Novenko, Volkova, Nosova and Zuganova2009b), paludification of spruce forests began after 400–300 cal yr BP. During the last 100 yr, soil moisture of the CFSNBR spruce forest became considerably higher, promoting the growth of Sphagnum mosses and resulting in the transformation of formerly dry forests to Sphagnum-spruce forest. The increase in the local moisture can be explained by the changes in hydrological regime as a result of deforestation: reduced forest cover appears to have led to greater surface run off.
Pollen records from lakes and peatlands throughout Europe show signs of human impacts on vegetation beginning in the mid-Holocene (Behre, Reference Behre1981; Kalis et al., Reference Kalis, Merkt and Wunderlich2003; Ralska-Jasiewiczowa et al., Reference Ralska-Jasiewiczowa, Nalepka and Goslar2003; Kaplan et al., Reference Kaplan, Kristen M. Krumhardt and Zimmermann2009; Niinemets and Saarse, Reference Niinemets and Saarse2009; Marquer et al., Reference Marquer, Gaillard, Sugita, Trondman, Mazier, Nielsen and Fyfe2014; Kunes et al., Reference Kunes, Svobodova-Svitavska, Kolar, Hajnalova, Abraham, Macek, Tkac and Szabo2015). However, the CFSNBR is distant from major rivers and trade routes, and therefore it remained untouched by human activity until recently (Novenko et al., Reference Novenko, Volkova, Nosova and Zuganova2009b). The sharp increase in micro-charcoal accumulation rate in Monolith 1 at 450–400 cal yr BP and the reduced proportion of Picea and broadleaved trees in the forests stands coincided with the expansion of Betula. At the same time, the organic matter content of the peat dropped sharply, indicating a rise in mineral influx from the surrounding area that could be related to vegetation disturbance resulting from forest clearance for agriculture. Plant communities in the areas adjacent to the study site feature various taxa indicative of anthropogenic disturbance, erosion, and grasslands (Behre, Reference Behre1981; Ralska-Jasiewiczowa et al., Reference Ralska-Jasiewiczowa, Nalepka and Goslar2003), including Centaurea cyanus, Plantago, Artemisia, Chenopodiaceae, Asteraceae, Cichorioideae, Rubiaceae, and Poaceae. The pollen record from Staroselsky Moch peatland suggests that woodland coverage around the now abandoned village of Staroselie dropped to 30–40% (Novenko et al. Reference Novenko, Eremeeva and Chepurnaya2014). The tree cover reconstructed from Monolith 1 remained around 50–60%, presumably because the study site is located away from lands suitable for agriculture. At 250 cal yr BP, the vegetation cover of the CFSNBR was characterized by a mosaic pattern, including not only mature spruce forests, but also secondary birch woodlands, meadows, and agricultural lands.
CONCLUSIONS
Our multiproxy reconstruction based on pollen, plant macrofossils, micro-charcoal, peat humification, and testate amoeba analyses from Lesnoye peatland has provided new insights into the forest history, paludification dynamics, and environmental change in the central part of the East European Plain during the mid- and late Holocene. The results suggest that vegetation change and soil paludification have been driven by variations in climate and fire. Anthropogenic disturbances over the last few hundred years have also been important in shaping the contemporary vegetation.
Projected future climate changes for the study region suggest increases in mean annual temperature and precipitation with the potential to generate major changes in vegetation patterns and paludification processes. For example, the “moderate” RCP2.6 scenario (CMIP5 Climate Model Intercomparison Project5; IPCC, 2013) features a 2–3°C increase in mean annual temperature. Rising temperatures may lead to increased evapotranspiration, and drier conditions may, in turn, limit or even reverse the paludification that has been prevalent over recent centuries. More extreme climate change scenarios, such as RCP8.5, suggest even larger increases in temperature; such changes would have even more severe impacts on surface moisture and thereby on paludification.
It is clear from this study that the environmental factors controlling wetland development are complex, influenced by climate changes, disturbance events such as fires, and anthropogenic activities. By employing a variety of different paleoecological techniques we have been able to untangle some of these linkages, stressing the importance of a multiproxy approach in forest palaeoecology. Understanding and predicting future change in these landscapes similarly requires a multi-disciplinary approach combining paleoecology, modern ecological and climatological studies, and social science research.
ACKNOWLEDGMENTS
This study was supported by a grant from the Russian Science Foundation (Grant 16-17-10045). UK-Russia cooperation was supported by the Royal Society (grant IE150173).


