


INTRODUCTION
Linkages between peatland water tables and climate variability have been studied in a wide range of northern peatlands (e.g., van Geel and Renssen, Reference van Geel and Renssen1998; Booth and Jackson, Reference Booth and Jackson2003; Sillasoo et al., Reference Sillasoo, Mauquoy, Blundell, Charman, Blaauw, Daniell, Toms, Newberry, Chambers and Karofeld2007; Väliranta et al., Reference Väliranta, Korhola, Seppa, Tuittila, Sarmaja-Korjonen, Laine and Alm2007; Swindles et al., Reference Swindles, Blundell, Roe and Hall2010; van Bellen et al., Reference van Bellen, Garneau and Booth2011; Magnan and Garneau, Reference Magnan and Garneau2014; Arlen-Pouliot and Payette, Reference Arlen-Pouliot and Payette2015; Marcisz et al., Reference Marcisz, Tinner, Colombaroli, Kołaczek, Słowiński, Fiałkiewicz-Kozieł, Łokas and Lamentowicz2015). Past studies have identified the climate variables that explain the variability in reconstructed water-table level at decadal timescales in various climatic settings (Schoning et al., Reference Schoning, Charman and Wastegård2005; Charman et al., Reference Charman, Barber, Blaauw, Langdon, Mauquoy, Daley, Hughes and Karofeld2009; Booth, Reference Booth2010). For instance, in western Europe, these variations in water-table position are best explained by summer water deficit (precipitation minus evapotranspiration), which was driven mostly by variations in precipitation (Charman et al., Reference Charman, Barber, Blaauw, Langdon, Mauquoy, Daley, Hughes and Karofeld2009), whereas in continental North America, they are best correlated to precipitation-driven drought intensity (Booth, Reference Booth2010). Information on peatland water-table dynamics at decadal to millennial timescales can be obtained using peat cores (e.g., Mauquoy et al., Reference Mauquoy, Yeloff, van Geel, Charman and Blundell2008; Lamentowicz et al., Reference Lamentowicz, Gałka, Lamentowicz, Obremska, Kühl, Lücke and Jassey2015). Quantified at such timescales, water-table levels are generally expressed with the peatland surface as the reference height. Using the peatland surface as a reference height implies a high interdependence between water-table dynamics and peat accumulation, and a strong feedback effect has been established between these processes in contemporary process-based studies (Belyea and Clymo, Reference Belyea and Clymo2001; Bridgham et al., Reference Bridgham, Pastor, Dewey, Weltzin and Updegraff2008). Interactions between peat accumulation and reconstructed water tables suggest the existence of various pathways towards changes that may hinder the interpretation of proxy records in terms of climate change (Swindles et al., Reference Swindles, Morris, Baird, Blaauw and Plunkett2012; Morris et al., Reference Morris, Baird, Young and Swindles2015b). Experimental studies (e.g., Bridgham et al., Reference Bridgham, Pastor, Dewey, Weltzin and Updegraff2008) and peatland development models, such as DigiBog (Baird et al., Reference Baird, Morris and Belyea2012; Morris et al., Reference Morris, Baird and Belyea2012) and the Holocene Peat Model (Frolking et al., Reference Frolking, Roulet, Tuittila, Bubier, Quillet, Talbot and Richard2010), show the importance of both autogenic and external factors (e.g., climate) as controls on peat accumulation.
The subarctic patterned fens of the Laforge region in northern Quebec, Canada, are characterized by a structure of alternating strings and pools, with pools occupying up to half of the surface (Cliche Trudeau et al., Reference Cliche Trudeau, Garneau and Pelletier2012; Arlen-Pouliot and Payette, Reference Arlen-Pouliot and Payette2015; White and Payette, Reference White and Payette2016). Similar surface patterning has been found to be dominant in peatlands within a ~200,000 km2 region in eastern Canada, from the southern limit of the permafrost boundary towards northern and eastern Labrador (Foster et al., Reference Foster, Wright, Thelaus and King1988a). At a global scale, patterned fens are characteristic of the northernmost section of the boreal region corresponding to a distinct bioclimatic zonation over the northern hemisphere (Payette and Rochefort, Reference Payette and Rochefort2001) and similar ecosystems have been documented in Sweden (Sjors, Reference Sjors1983; Foster and Fritz, Reference Foster and Fritz1987) and Finland (Ruuhijärvi, Reference Ruuhijärvi1983). The general abundance of pools and the short growing season contribute to emissions of methane, and in some years, net emissions of carbon, as carbon dioxide, to the atmosphere (Rinne et al., Reference Rinne, Riutta, Pihlatie, Aurela, Haapanala, Tuovinen, Tuittila and Vesala2007; Cliche Trudeau et al., Reference Cliche Trudeau, Garneau and Pelletier2012, Reference Cliche Trudeau, Garneau and Pelletier2014). Stratigraphic analyses of multiple peat cores collected in three subarctic patterned fens in northern Quebec showed that peat accumulation was initiated under relatively dry and ombrotrophic conditions from ~6500 cal yr BP (Garneau et al., Reference Garneau, Tremblay and Magnan2017) and converged to near-surface water tables between 4000 and 2000 cal yr BP in an initial shift (Fig. 1; van Bellen et al., Reference van Bellen, Garneau, Ali, Lamarre, Robert, Magnan, Asnong and Pratte2013). A second wet shift was registered during the Little Ice Age (van Bellen et al., Reference van Bellen, Garneau, Ali, Lamarre, Robert, Magnan, Asnong and Pratte2013). The widespread, regional water-table rise, causing tree mortality, pool expansion, and physical degradation of strings, has been referred to as “aqualysis” (Dissanska et al., Reference Dissanska, Bernier and Payette2009; Tardif et al., Reference Tardif, Hilaire, Roy, Bernier and Payette2009; White and Payette, Reference White and Payette2016). Aqualysis may be driven by an increase in precipitation that exceeds any loss via evapotranspiration or liquid flow, until a new, relatively stable state is reached. In an attempt to identify the driving factors that influenced this increased surface wetness, we considered possible pathways towards aqualysis, as found in the Abeille peatland (van Bellen et al., Reference van Bellen, Garneau, Ali, Lamarre, Robert, Magnan, Asnong and Pratte2013), in the Laforge region of Quebec, using a conceptual modelling approach.
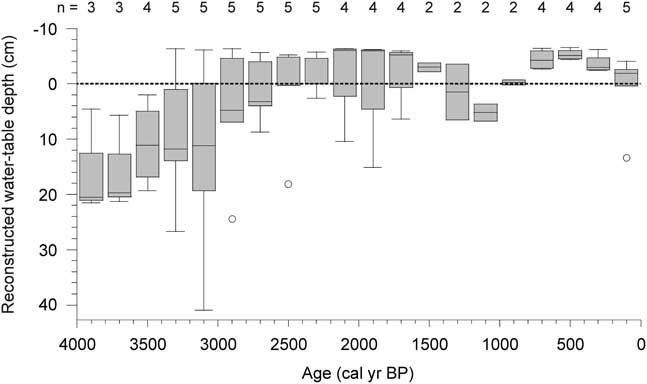
Figure 1 Laforge peatland reconstructed water tables since 4000 cal yr BP, pooled in 200-yr bins. Boxes represent medians, upper, and lower quartiles and outliers.
A range of factors may explain pool formation in peatlands. Studies on basin geomorphology attributed an important effect of mineral substrate on pool distribution (Comas et al., Reference Comas, Slater and Reeve2011). Belyea and Lancaster (Reference Belyea and Lancaster2002) showed the influence of peatland slope and patterns of water flow on pool formation and distribution, suggesting that pool size was related to pool age. Additional, autogenic mechanisms have been proposed to explain pool development: hollows may degrade and form pools due to differential peat accumulation between hummocks and hollows, which exacerbates initial small microtopographical gradients (Foster et al., Reference Foster, King and Santelmann1988b; Ohlson and Økland, Reference Ohlson and Økland1998). Patterns of pool distribution and relationships with geomorphological variables have been explored specifically in the Laforge region (White and Payette, Reference White and Payette2016) where pool presence and formation appeared to be positively related to peatland surface slope, size of the watershed, and peat deposit thickness. White and Payette (Reference White and Payette2016) suggested that, in addition to geomorphological and topographical factors, climate change may affect the water supply to these peatlands and contribute to ponding and pool expansion. Besides an initial large-scale surface wetting in the Laforge region that was initiated around 4200 cal yr BP (van Bellen et al., Reference van Bellen, Garneau, Ali, Lamarre, Robert, Magnan, Asnong and Pratte2013; Garneau et al., Reference Garneau, Tremblay and Magnan2017), pool expansion was reported during the Little Ice Age as evidenced by tree-ring dating of tree mortality (Arlen-Pouliot and Payette, Reference Arlen-Pouliot and Payette2015).
Although the presence and development of peatland pools may be explained by a range of geomorphological, hydrological and biological forcings, and feedbacks among these, the timing of the regional water-table rise after 4200 cal yr BP in the Laforge region (Fig. 1; van Bellen et al., Reference van Bellen, Garneau, Ali, Lamarre, Robert, Magnan, Asnong and Pratte2013; Garneau et al., Reference Garneau, Tremblay and Magnan2017) suggests a common, external forcing. The late-Holocene cooling, or Neoglacial, characterized by gradually declining summer insolation (Berger and Loutre, Reference Berger and Loutre1991) and colder conditions (Viau et al., Reference Viau, Gajewski, Sawada and Fines2006; Viau and Gajewski, Reference Viau and Gajewski2009), has been identified as the main climatic period influencing peatland dynamics in eastern Canada and this forcing was, therefore, considered as an explanation for aqualysis.
In this paper, we aim to explore the possible pathways towards peatland aqualysis under changing climate conditions. To do so, we combined existing reconstructions from Abeille peatland, located in the Laforge region (van Bellen et al., Reference van Bellen, Garneau, Ali, Lamarre, Robert, Magnan, Asnong and Pratte2013), new paleodata from these sites, and conceptual modelling. We developed six conceptual ecohydrological models, or scenarios, to investigate the factors that might explain sustained pool expansion, and used numerical experiments with a peatland development model to indicate, in broad terms, the explanatory power of these scenarios. Finally, we used the detailed reconstructions and information on the regional climate and environmental history as established by earlier studies to help identify the most plausible explanation for aqualysis.
STUDY REGION
Located in the Laforge region of subarctic Quebec, the Abeille peatland (54.11°N, 72.50°W) is an oligotrophic fen that covers an area of 3.5 ha. The region belongs to the Picea mariana-dominated lichen woodland zone, near the boreal-tundra ecotone (Fig. 2). Extensive anthropic activity in this region did not start until the second half of the twentieth century, with the development of the infrastructure associated with hydroelectricity facilities. Peatlands in this region generally do not exceed a few hectares, as they are confined to topographic depressions in the Precambrian shield, which restrict lateral expansion. During the 1971–2012 period, the regional mean annual temperature was –3.6°C and the mean annual precipitation was 748 mm, of which 468 mm fell during the growing season, defined as the period with daily average temperatures >0°C (Natural Resources Canada’s interpolated gridded datasets; Hutchinson et al., Reference Hutchinson, McKenney, Lawrence, Pedlar, Hopkinson, Milewska and Papadopol2009; Hopkinson et al., Reference Hopkinson, McKenney, Milewska, Hutchinson, Papadopol and Vincent2011; McKenney et al., Reference McKenney, Hutchinson, Papadopol, Lawrence, Pedlar, Campbell, Milewska, Hopkinson, Price and Owen2011). The Laforge region experiences relatively wet and cold conditions, which define the current northern bioclimatic limit of ombrotrophic peatlands (Fig. 2). Despite mean annual temperatures well below 0°C, no clear signs of permafrost have yet been found in this region. Currently, average snowfall attains 280 mm as water equivalent, which represents ~120 cm of snow cover. This relatively high amount of snowfall insulates the surface from frost penetration (Zoltai, Reference Zoltai1995), which probably explains the current absence of permafrost.
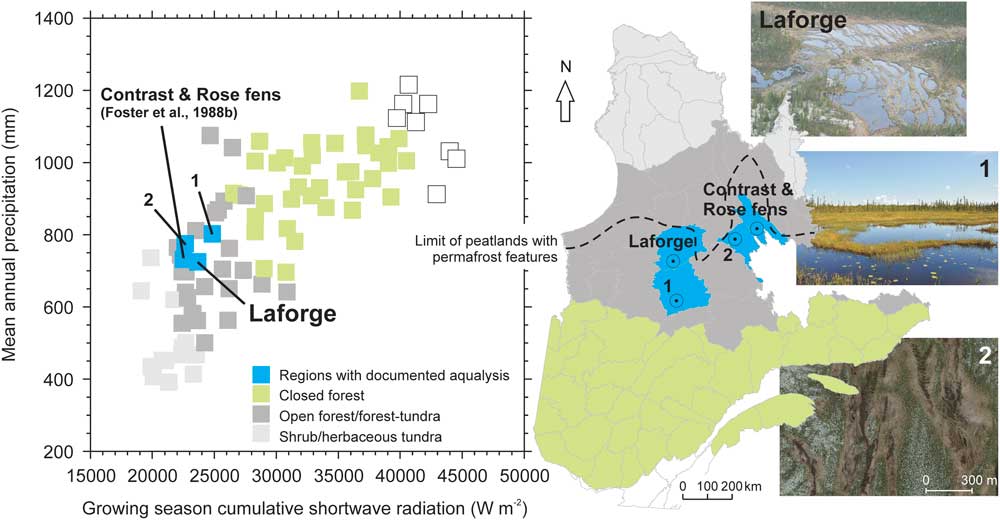
Figure 2 (color online) Bioclimatic positioning of patterned fens and documented aqualyzed peatland regions. Left: position of the Laforge region, Monts Otish region (1), Plateau du lac du Sable region (2) and the Foster et al. (Reference Foster, King and Santelmann1988b) patterned fen region within the Quebec “climate space”, as defined by annual precipitation and growing season cumulative shortwave radiation values. Each point represents a spatial unit for which climate data were available, with points marked according to the vegetation distribution from Payette and Rochefort (Reference Payette and Rochefort2001). Right: location of the patterned fen regions in Quebec. The approximate southern limit of peatland permafrost features (palsas) is based on Payette and Rochefort (Reference Payette and Rochefort2001).
METHODS
Conceptual models may be defined as simplified theoretical representations of a system and of the links and feedbacks between the system’s main components (Robinson, Reference Robinson2008). They are often seen as a first stage in describing the system of interest and the main factors that may affect the system, and usually provide the basis for more formal, quantitative, i.e., mathematical or numerical, models. We developed six conceptual models (hereafter referred to as “scenarios”) describing potential conditions for aqualysis in an attempt to identify the conditions necessary for this change. Currently, there are insufficient data to apply numerical models to the site, but we used the DigiBog model (e.g., Morris et al., Reference Morris, Baird, Young and Swindles2015b) as an exploratory tool to help identify and assess our scenarios; therefore, we used a novel combination of the conceptual and numerical modelling approaches. The six scenarios were identified from multiple runs of the DigiBog model in which we looked at how changes in net rainfall (precipitation-evapotranspiration), temperature, and exchange of water between the peatland and the surrounding catchment affect peatland function. Changes in both net rainfall and temperature have likely been implicated in aqualysis (van Bellen et al., Reference van Bellen, Garneau, Ali, Lamarre, Robert, Magnan, Asnong and Pratte2013). More detail on our model runs, including the rationale for looking at changes in climatic wetness and temperature, is provided below (see Developing conceptual models to explain aqualysis using DigiBog as an exploratory tool). Before that, we provide more information on DigiBog and explain what is known about the site from the paleorecord.
DigiBog
DigiBog is an ecohydrological model based on mathematical representations of feedbacks between ecological processes, such as plant organic matter production, and hydrological processes, such as water flow through the peat. The model is useful in indicating how a peatland might respond over decadal to millennial timescales to changes in, for instance, climate, and, because of its mathematical basis, allows a more formal (quantitative) assessment of such responses than is possible in conceptual models. We used DigiBog to create a hypothetical peatland with general properties similar to those of Abeille peatland. The hypothetical peatland was simulated first under constant climate conditions. We then considered whether changes in (1) climatic wetness, (2) temperature, and (3) inputs of water from surrounding hillslopes could plausibly explain aqualysis in the hypothetical peatland.
DigiBog simulates peatland development over timescales of decades to millennia. It takes account of organic matter production by peatland plants, peat decay, and the hydrological dynamics of the system. As well as modelling the change in peat thickness, it simulates peatland water-table dynamics and the changing properties, i.e., the degree of decomposition and permeability, of the peat. The recent versions of DigiBog are fully transient; the water table may constantly vary, as may rates of organic matter production and decay (Morris et al., Reference Morris, Baird, Young and Swindles2015b; Young et al., Reference Young, Baird, Morris and Holden2017). In these recent editions, both productivity and decay vary with temperature as well as with peat wetness. We used the latest 1-D version reported in Morris et al. (Reference Morris, Baird, Young and Swindles2015b) for the exploratory modelling of a hypothetical peatland. Although the model cannot currently simulate pool development, it can simulate shifts in water tables relative to the surface and can help identify the conditions needed to cause long-lasting wet shifts consistent with aqualysis.
In DigiBog, rates of organic matter production increase with temperature and peak for water-table depths of 20–40 cm (Belyea and Clymo, Reference Belyea and Clymo2001). For water tables closer to the peatland surface (depths of 0–20 cm) and for deeper water tables (depths >45 cm), plant productivity is lower. Organic matter production parameters can be set to give plausible thicknesses of peat for a study site. Peat decay in the model is simulated using an exponential decay model, which removes a given proportion of peat from each annual cohort per unit of time. Decay rates are modified by temperature, using a Q 10 function, and vary according to the position of the water table; i.e., the presence of oxic or anoxic conditions. In addition, a recalcitrance effect on rates of decay is included (Morris et al., Reference Morris, Baird, Young and Swindles2015b). The resulting peat profile is composed of annual cohorts of peat. Lateral water flow from the column of peat representing the center of the peatland (in the 1-dimensional version of the model) depends on the permeability of the peat and on the difference in the height of the water table between the center of the peatland and its margin. Peat permeability is dynamic and varies in each peat cohort according to the degree of decomposition; the permeability declines as the peat becomes more decomposed. In the model, the relationship between permeability and decomposition is one of the feedbacks between ecological processes, such as decay, and physical processes, such as water flow. Permeability affects water-table position, which determines the relative proportion of oxic and anoxic decay and also the rate of organic matter production.
Reconstructions from peat cores
Aqualysis is a widespread, regional phenomenon, the timing of which was established using five peat cores sampled in lawns of three peatlands in the Laforge region (van Bellen et al., Reference van Bellen, Garneau, Ali, Lamarre, Robert, Magnan, Asnong and Pratte2013). Based on the premise that changes in water-table levels in hollows coincide with those in adjacent lawns, we assumed the reconstructions from peat cores extracted from lawns reliably reflect the water-table dynamics in hollows. To help interpret the scenarios (conceptual models) describing potential conditions for aqualysis, we combined the initial reconstruction of Abeille peatland development from van Bellen et al. (Reference van Bellen, Garneau, Ali, Lamarre, Robert, Magnan, Asnong and Pratte2013) with new core data on peat bulk density, humification, plant productivity and charcoal abundance, as well as reconstructions of carbon (C) accumulation rates. The new, detailed record from the Abeille-5 core was considered a benchmark for the Laforge region and was therefore used to interpret the possible pathways towards aqualysis.
The chronology for the Abeille-5 core was based on accelerator mass spectrometry 14C dating, which included six samples, and 210Pb dating using α-spectrometry. The previously published chronology of the core (van Bellen et al., Reference van Bellen, Garneau, Ali, Lamarre, Robert, Magnan, Asnong and Pratte2013) was updated using Bacon in R (Blaauw and Christen, Reference Blaauw and Christen2011; R Core Team, 2016), applied to the original dates (all details of sample composition and raw data are in van Bellen et al., Reference van Bellen, Garneau, Ali, Lamarre, Robert, Magnan, Asnong and Pratte2013). The ecohydrological reconstructions were based on plant macrofossil and testate amoeba records. Past water-table positions were inferred from testate amoeba assemblages using the transfer function of Lamarre et al. (Reference Lamarre, Magnan, Garneau and Boucher2013) and expressed as a depth below the surface of the peatland, with positive values representing water-table levels below the peat surface. Peat bulk density and loss-on-ignition were quantified using 1-cm3 subsamples (Dean, Reference Dean1974), which allowed, when combined with the chronologies, for the calculation of C accumulation rates. Charcoal fragments larger than 1 mm were counted using 3-cm3 subsamples and expressed as an influx (number of pieces yr–1). Because of the size of the charcoal fragments, resulting records were assumed to represent local (peat) fire incidence, yet a minor contribution from the watershed could not be excluded. Peat humification, interpreted as an approximation of the amount of organic matter lost through decay, was quantified using the protocol of Blackford and Chambers (Reference Blackford and Chambers1993). Raw transmissivity values were detrended for the catotelm section only, because the acrotelm is still subjected to oxic decay rates, the limit of which was identified using the age-depth model. The humification residuals were interpreted as a measure of the state of decay. An index for plant productivity was calculated by subtracting the humification values from the C accumulation rate values after rescaling both records to z-scores.
Late-Holocene development of Abeille-5
The age-depth model of Abeille-5 showed that vertical accumulation rates were generally low and declined gradually during the late Holocene (Fig. 3). No major hiatus associated with peat erosion or major or recurrent burning could be identified. Due to the high-resolution dating using 210Pb, age control was highest for the near-surface section. C accumulation rates were highest at the base of the sequence, with values between 15 and 20 g m–2 yr–1, declining to 8–15 g m–2 yr–1 between 80 cm depth and the top of the catotelm (Fig. 3).

Figure 3 (color online) Age-depth model, C density, and C accumulation rate reconstruction for Abeille-5. The apparent increase in vertical accumulation near the surface represents the acrotelm, characterized by ongoing oxic decay.
The lower section of the record contained woody peat with occasional Sphagnum fuscum and a high charcoal influx suggesting repeated fires (98–78 cm depth; 3690–2940 cal yr BP). Testate amoeba and plant macrofossil records indicated an initial sharp increase in water-table levels between 3200 and 2800 cal yr BP (period A; Fig. 4). During this period, ligneous vegetation was gradually replaced by S. fuscum and fires likely became less prevalent, while C accumulation rates declined. As humification values, and therefore decay loss, were relatively stable, the decrease in C accumulation rates may be the result of declining organic matter production. The reconstructed wetter conditions only lasted a few centuries, as surface wetness decreased again around 2700 cal yr BP. A second period of increasing water-table levels occurred around 2400 cal yr BP, reaching the surface around 2100 cal yr BP (period B; Fig. 4) and remaining close to or above the surface until the second half of the twentieth century. This period was characterized initially by low peat humification and by the presence of Sphagnum majus, which is a species characteristic of hollows and pools (Laine et al., Reference Laine, Harju, Timonen, Laine, Tuittila, Minkkinen and Vasander2009). In contrast with period A, water tables remained close to the surface for the following centuries. After 1500 cal yr BP, S. majus was replaced by herbaceous species. The disappearance of Sphagnum coincided with increasing peat humification and decreasing productivity as suggested by the productivity index (Fig. 4). Lowest C accumulation rates of 9 g m–2 yr–1 and low productivity indices occurred after 900 cal yr BP, when local vegetation remained dominated by herbaceous species and water tables persisted near the peatland surface. Between 2000 and 600 cal yr BP, local mineral influx rose gradually as indicated by the ash influx reconstruction (Fig. 4), attaining 2 g m–2 yr–1. This trend, together with the abundance of Sphagnum subsecundum, minerotrophic mosses, and herbaceous plants, suggests that the last 2000 yr have been characterized by a degree of minerotrophy (van Bellen et al., Reference van Bellen, Garneau, Ali, Lamarre, Robert, Magnan, Asnong and Pratte2013). A sharp increase in mineral influx up to 29 g m–2 yr–1 was recorded during the second half of the twentieth century, associated with the start of anthropic activity in the region. Hence, the paleoecological record shows two specific episodes of increasing water-table levels which may be evaluated in terms of climate change and through use of conceptual models based on exploratory DigiBog simulations.

Figure 4 Variations in testate amoeba assemblages, inferred water-table depths, main plant macrofossils, and peat physical characteristics along the Abeille-5 core. Period A represents an initial, non-persisting increase in water-table levels, while period B shows a persisting water-table rise (aqualysis) with testate amoeba assemblages and plant macrofossils suggesting surface inundation.
The detailed record from Abeille-5 confirms the previously reconstructed trend found in the minerotrophic peatlands of the Laforge region. Some of these ecosystems initially developed under ombrotrophic conditions, with water tables 10–20 cm below the surface, followed by a prolonged period of high water-table levels near the surface of the peat (Fig. 1; van Bellen et al., Reference van Bellen, Garneau, Ali, Lamarre, Robert, Magnan, Asnong and Pratte2013), which clearly exceeded the ecological resilience of the ecosystem (sensu Holling, Reference Holling1996). Located at the northern biogeographic limit of ombrotrophic peatlands (Payette and Rochefort, Reference Payette and Rochefort2001), the Laforge region peatlands have accumulated ≤150 cm of peat in more than 6500 yr (van Bellen et al., Reference van Bellen, Garneau, Ali, Lamarre, Robert, Magnan, Asnong and Pratte2013; Garneau et al., Reference Garneau, Tremblay and Magnan2017), which implies that rates of organic matter production only marginally exceeded those of decay. Unlike temperate peatlands, which are sensitive to droughts, the ecohydrology of these subarctic peatlands in a relatively humid climate may be influenced primarily by temperature (Charman, Reference Charman2007; Morris et al., Reference Morris, Baird, Young and Swindles2015b) and the relatively short growing season likely limits plant productivity and, thus, peat accumulation (cf. Bartsch and Moore, Reference Bartsch and Moore1985; Loisel et al., Reference Loisel, Gallego-Sala and Yu2012).
Developing conceptual models to explain aqualysis using DigiBog as an exploratory tool
As noted above, we used DigiBog as an exploratory tool to help identify possible routes to aqualysis. It is important to stress that DigiBog was not applied directly to the study site; there is not enough known about the site for such an application. The use of DigiBog here should not be seen as a site-specific application of the model for which model-data (from cores) comparisons could be made. We used DigiBog instead to “grow” a plausible ombrotrophic peatland under a constant climate, i.e., with a similar central peat thickness to the site prior to the onset of aqualysis. We then considered what factors might cause aqualysis: changes in peatland organic matter production and rates of peat decay, brought about by climatic cooling; an increase in climatic wetness; and changes in lateral water exchanges between the peatland and surrounding hillslopes.
An increase in climatic wetness might be expected to increase surface wetness. As suggested by Swindles et al. (Reference Swindles, Morris, Baird, Blaauw and Plunkett2012) and Morris et al. (Reference Morris, Baird, Young and Swindles2015b), however, such changes may be relatively short-lived, perhaps no more than several centuries in duration, because of negative feedbacks within the ecosystem: increased organic matter production may allow the peatland surface to rise so that the original depth of the water table, relative to the peatland surface, is restored. Morris et al. (Reference Morris, Baird, Young and Swindles2015b) showed that changes in temperature in combination with changes in climatic wetness can cause much longer-lived changes in the state of a peatland. For instance, if the increase in climatic wetness is accompanied by climatic cooling, such as that associated with the Neoglacial period, lower growing season temperatures may suppress organic matter production. In this case, the peatland surface does not increase in height and, instead, stays close to the water table. Cooling will also suppress decay rates; therefore, for overall rates of peatland growth to be curbed, organic matter production rates must be lowered more than peat decay rates. Given the geomorphological setting of the Laforge peatlands, characterized by landscape depressions surrounded by hillslopes, we also considered the possibility that a general raising of hillslope water tables caused either (1) water levels at the peatland margin to increase, limiting lateral water loss from the peatland center, or (2) minerotrophic water to enter the base of the peatland via groundwater seepage or inflow from slopes. Wetter hillslopes may also have caused occasional flow of minerotrophic surface water into the peatland, perhaps during periods of sustained high precipitation. Including this aspect in the scenarios was also motivated by the slightly minerotrophic conditions reconstructed for the last 2000 yr (van Bellen et al., Reference van Bellen, Garneau, Ali, Lamarre, Robert, Magnan, Asnong and Pratte2013), which suggest that nutrients were able to enter the ecosystem.
In addition to a baseline setting (scenario 1), which represented a stable climate throughout peatland development, five scenarios were explored using DigiBog (Fig. 5). Scenarios 2 to 6 all included a step-like, but persistent 20% increase in net precipitation, starting 2500 yr after peatland initiation. Scenarios 3 and 5 were also characterized by a step-like, persisting drop in temperature (of 0.6°C) that caused a reduction in productivity of ~17% and a reduction in decay of ~4%, whereas a stronger temperature drop (of 1°C), causing a reduction in productivity of ~28% and a reduction in decay of ~9%, was included in scenario 6. Scenario 4 presumed a stable temperature, but included groundwater seepage or increased hillslope runoff from the catchment to the peatland edge. This simulation was performed by reducing the rate of subsurface water flow from the peatland center to the margin by 30% after 2500 yr. Finally, scenario 5 also included this effect of reduced lateral flow or increased catchment contribution; the difference between scenarios 4 and 5 being the drop in temperature that caused a reduction in productivity of ~17% and a reduction in decay of ~4%. This cooling effect was included in scenario 5, but not in scenario 4 (Fig. 5).
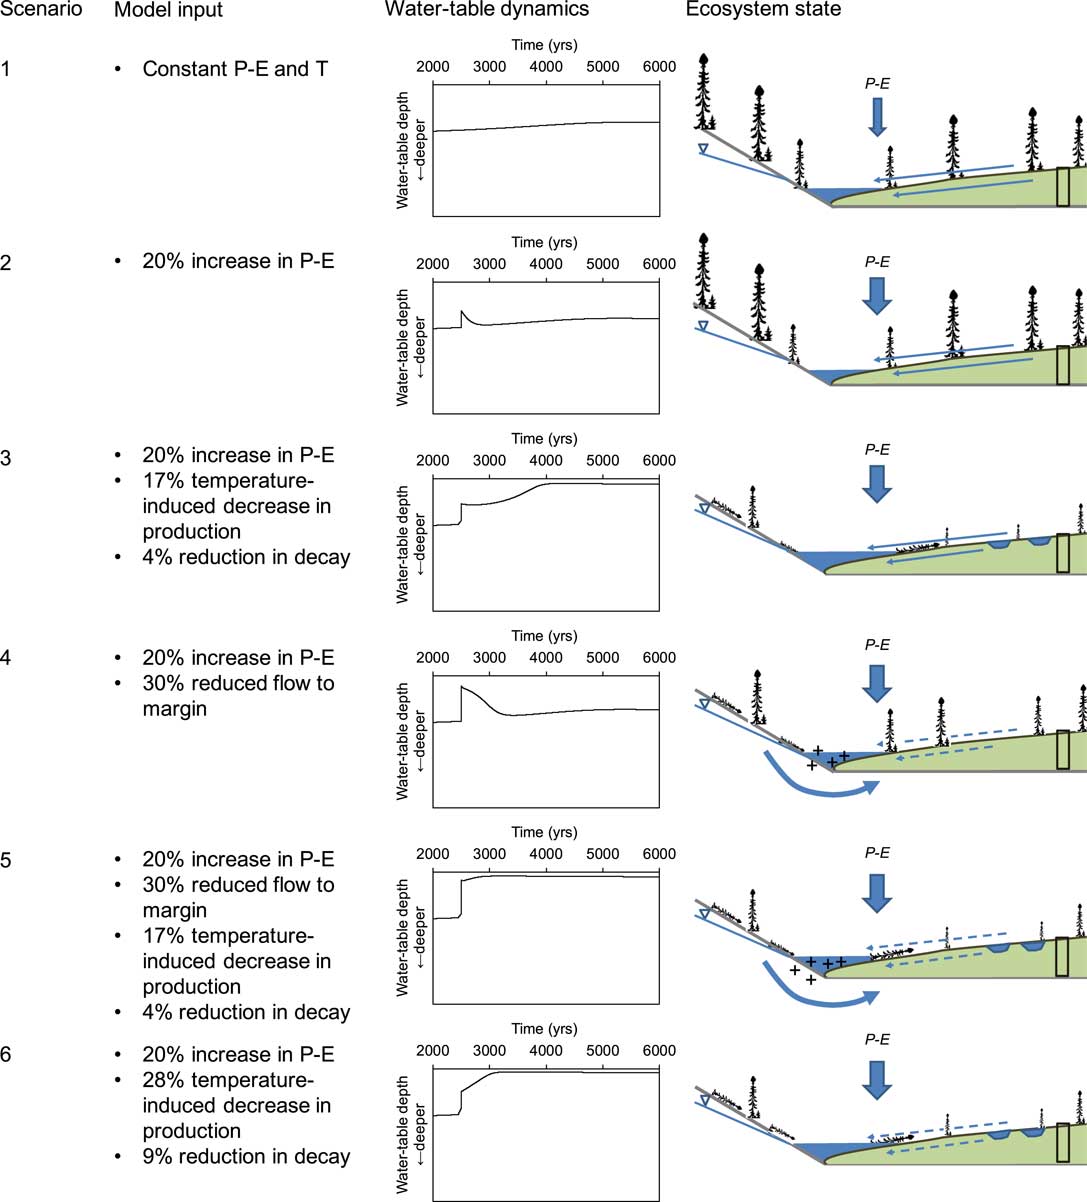
Figure 5 (color online) Conceptual model scenarios, DigiBog output and visual representation of ecosystem processes. The ecosystem dynamics resulting from model output, shown at the right, were not specifically modelled but represent interpretations of the trends. For instance, “+” indicates increased minerotrophy from enhanced catchment water inflow in scenarios 4 and 5. This inflow was not explicitly modelled but was represented by a reduced lateral loss of water from the peatland.
RESULTS
In the DigiBog simulations of the hypothetical peatland, the different scenarios had distinct effects on peatland water tables (Fig. 5). Under scenario 1, the water-table level relative to the peatland surface remained more or less stable for the entire 5500-yr period considered. Scenario 2, which contained an increase in net precipitation of 20%, triggered a short-lived increase in water-table height, but not enough to create surface inundation. When a drop in temperature was added under scenario 3, causing a reduction in productivity of ~17% and a reduction in decay of ~4%, surface wetting was achieved and persisted ~1500 yr after the initial climatic shift until the present-day. The importance of such a cold shift for persisting aqualysis was underlined by scenario 4: the combination of restricted lateral water flow and an increase in precipitation alone did not lead to aqualysis as the simulated peatland showed a homeostatic response to these hydrological shifts. Indeed, when the cold shift was added (scenario 5), aqualysis was relatively rapid and persisted for millennia. Finally, scenario 6 also led to aqualysis, but the shift took ~600 yr to be completed.
These scenarios suggest that a net reduction in rates of peat accumulation, caused by a reduction in temperature depressing organic matter production more than decay, was needed for aqualysis. In this situation, peat permeability declines as the slowly accumulating peat decays, so that the water table catches up, or keeps pace with the rising peat surface and aqualysis occurs. Under scenario 3, however, the transition from a dry to a wet state was very slow, with the shift from relatively deep water tables to water tables at the peatland surface taking more than 1000 yr. When the temperature effect on net peat accumulation was accompanied by an increase in net rainfall and increased flow from neighbouring hillslopes, rapid and persistent wetting of the peatland occurred. In this scenario, the additional increase in wetness caused by the contribution from the watershed produced a greater decline in organic matter production, i.e., an even greater decline in net peat accumulation, so that the water tables rose even more rapidly relative to the peatland surface.
DISCUSSION
Laforge peatland ecohydrology and Neoglacial climate reconstructions
Comparing the scenarios with the paleorecord from Abeille peatland, it appears that period A (Fig. 6) corresponds broadly with scenario 4, which was defined by an increase in precipitation of 20% and a reduced lateral water flow. The reconstructed homeostatic response that follows the increase in water-table level may be more likely to occur when shifts in precipitation are of relatively minor intensity, as the peatland’s internal dynamics, including changes in decomposition, production and hydraulic properties, show resilience through a negative feedback mechanism (Morris et al., Reference Morris, Baird, Young and Swindles2015b).
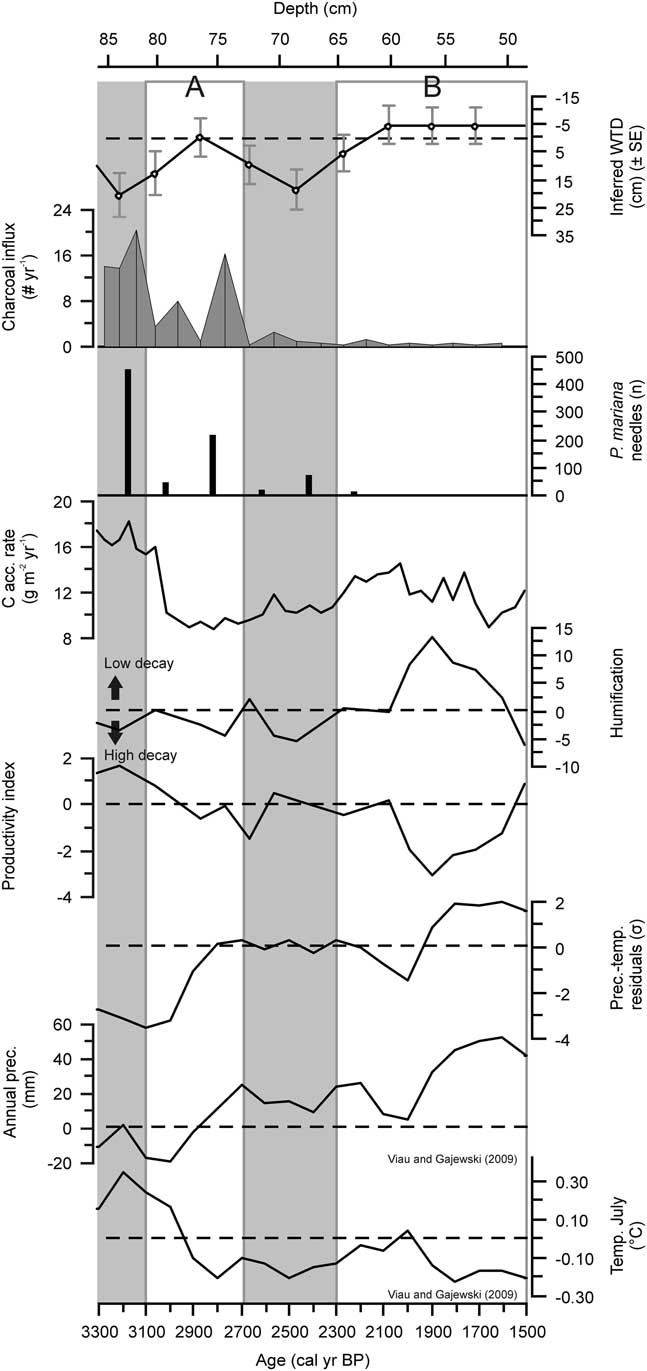
Figure 6 Ecohydrological, C accumulation rate, charcoal influx, P. mariana needle abundance, and humification records from Abeille peatland combined with climate reconstructions from northern Quebec (Viau and Gajewski, Reference Viau and Gajewski2009). Temperature and precipitation records are expressed as anomalies. Climate reconstructions were obtained from Viau and Gajewski (Reference Viau and Gajewski2009) and the precipitation–temperature residuals of z-scores were recalculated from their published records.
The conceptual model based on scenario 5 suggests the shift registered around 2100 cal yr BP (period B; Fig. 6) was forced by an increase in precipitation, a reduction of temperature, a reduced water flow towards the margin, and some flow of mineral water from the hillslopes into the peatland. Scenario 5 suggests all these changes were required for aqualysis. Aqualysis also occurred in scenario 6, yet cooling and a wet shift alone fail to explain the transition to partial minerotrophic conditions. Scenario 5 is therefore the more plausible of the two as an explanation of aqualysis and the establishment of poor fen conditions at Abeille.
Although we note above the temperature drops associated with the declines in organic matter production and decay rates, these should not be over-interpreted. Based on multi-annual measurements of Sphagnum growth in a wide range of peatlands, Moore (Reference Moore1989) reported an average decrease in net primary productivity (NPP) of 17.2 g m–2 yr–1 for a 1°C decrease in mean annual temperature (R 2 =0.31), with lawns and hollows slightly more sensitive than hummocks. The dataset used by Moore (Reference Moore1989) included subarctic fens near Schefferville, ~350 km east of the Laforge region, and the hydrologic setting of the measured microforms was found to be important in explaining intra-site differences in annual NPP. Annual NPP for lawns and hummocks in these poor fens was in the order of 70–80 g m–2 yr–1 for Sphagnum, 30 g m–2 yr–1 for sedges, and 40 g m–2 yr–1 for shrubs (Bartsch and Moore, Reference Bartsch and Moore1985; Moore, Reference Moore1989). Combining the NPP sensitivity values (Moore, Reference Moore1989) with these annual NPP values suggests our assumption of a 1°C decrease in temperature causing a productivity reduction of 28% may not be unrealistic. No data is available on decay sensitivity to annual-scale temperature variations for these sites. It appears reasonable to expect productivity and decay to be affected to some degree by temperature; hence, their consideration in scenarios 3, 5, and 6. For a similar reason to the interpretation of temperature changes used in the model, we do not report on absolute water levels relative to the surface in the Results. The DigiBog output simply shows whether the water table was relatively deep or close to the peat surface. As noted earlier, DigiBog is used here to help gauge what factors or combination of factors may be required to cause persistent shifts in the surface wetness of the peatland such as that at Abeille.
Paleoecological evidence in support of scenario 5 as the explanation of aqualysis
The output of the various scenarios suggests specific changes that were likely necessary for aqualysis to occur. Now we consider how the suggested cooling, wetting, and decreased runoff may be translated into peatland processes, taking account of the bioclimatic position of the Abeille peatland and the regional geomorphology.
Reconstructed annual precipitation and average July temperatures for northern Quebec, using pollen data (Viau and Gajewski, Reference Viau and Gajewski2009), show no clear shift at the onset of aqualysis, which occurred at Abeille around 2400–2100 cal yr BP, but they do indicate an increase in precipitation and a decrease in temperature around 2000 cal yr BP, which falls within the 95% confidence interval of the Abeille-5 age-depth model (Fig. 3 and 6). Garneau et al. (Reference Garneau, Tremblay and Magnan2017) reconstructed pool formation in the Laforge region between 4200 and 2500 cal yr BP by dating peat horizons underneath the pools, but suggested the obtained ages may have been somewhat overestimated due to ongoing decomposition as pools deepen (Karofeld and Tõnisson, Reference Karofeld and Tõnisson2014). Other studies from northern Quebec suggest permafrost aggradation and a slowdown in C accumulation started in subarctic peatlands around 2000 cal yr BP (Allard and Seguin, Reference Allard and Seguin1987; Bhiry and Robert, Reference Bhiry and Robert2006; Lamarre et al., Reference Lamarre, Garneau and Asnong2012), which corroborates our scenario of cooling and the minimal age for aqualysis to occur.
The humification record of Abeille-5 shows a decrease in peat humification between 2090 and 1910 cal yr BP, with minimal values at 1910 cal yr BP (Fig. 6). The timing of the events that generated this humification record may be delayed, however, due to secondary decomposition of peat in the zone where the water table fluctuates (Morris et al., Reference Morris, Baird, Young and Swindles2015b). In this case of a decrease in humification, the apparent timing of the wet shift from the humification data is later than the actual timing of the event. A lagged limited humification, possibly driven by a wet shift around 2000 cal yr BP, coincides with the appearance of S. majus, which may be more resistant to decay than the herbaceous vegetation that it replaced (Scheffer et al., Reference Scheffer, Van Logtestijn and Verhoeven2001). The rates of C accumulation during this period remained relatively stable; the combination of decreasing humification and these stable C accumulation rates suggests that productivity likely declined. This trend is in agreement with the cold shift and its effect on organic matter production that the exploratory modelling suggests is necessary for aqualysis to occur. In the remainder of the late Holocene, C accumulation rates were stable, but relatively low: the cold climate and wet conditions likely limited decay, but probably more importantly, productivity.
In the conceptual models, rapid, persistent aqualysis was only achieved when a reduced flow towards the margins was included. This effect may also be interpreted as representing a flow into the peatland of water from the bounding slopes. Although DigiBog cannot currently simulate water quality effects on peatland processes, we estimate such an input would likely have had a positive effect on decay rates, countering to some extent the effects of reduced temperature. Such an increase in nutrient availability and increased decay would have caused a lower permeability of the peat that resulted from this decay. The lower permeability would have further impeded water flow from the center of the peatland towards the margins (Hoag and Price, Reference Hoag and Price1995) and possibly accentuated a water-table rise both in the center and at the margins of the peatland (Morris et al., Reference Morris, Baird and Belyea2015a).
An enhanced minerotrophic input, which was suggested by paleoecological methods, may have been the result of an increase in precipitation, combined with a decrease in evapotranspiration both in the peatland and in the surrounding forest, together contributing to increasing recharge in the catchment (Fig. 5). Catchment recharge can also be highly sensitive to the composition and density of the vegetation cover. Neoglacial forest opening was reconstructed in subarctic Quebec, likely driven by an intensification of fire regimes and slow, cold-limited post-fire regeneration (Payette and Gagnon, Reference Payette and Gagnon1985; Asselin and Payette, Reference Asselin and Payette2005). If this phenomenon were extended to the Laforge region, a resulting sparse vegetation on hillslopes and cooler conditions may have allowed for enhanced water storage in the watershed as evapotranspiration was reduced. As a result, inflow towards the peatland may have further increased. Our charcoal influx record showed high values between 3700 and 3100 cal yr BP, when the peatland was ombrotrophic and dominated by stands of Picea and S. fuscum (Fig. 4 and 6), but an absence after 2400 cal yr BP. Both the trend in the record and the size of the charcoal fragments quantified (>1 mm) suggest peatland burning was more important before 3100 cal yr BP, yet this may be mostly a local (peatland) effect, driven by a peatland vegetation cover initially dominated by a presence of Picea; inferences on the fire frequency at the scale of the catchment or beyond are therefore uncertain. The gradually increasing mineral influx during the last 2000 yr, attaining ~2 g m–2 yr–1 at 200 cal yr BP (Fig. 4), likely reflects enhanced mineral input at the watershed scale or reduced peat accumulation, because an estimate of dust influx in an ombrotrophic complex ~350 km west of this region showed no clear late-Holocene trend (Pratte et al., Reference Pratte, Garneau and De Vleeschouwer2017).
Our conceptual modelling suggests that, besides shifts in temperature and precipitation, aqualysis may have been caused by an increase in surface and groundwater inflow, driven by an increase in precipitation but combined with the opening of the forest cover. The latter trend was possibly influenced by an intensified fire regime, which reduced regeneration (Fig. 7). The importance of processes at the scale of the catchment for aqualysis is supported by the positive relationship between degree of aqualysis and catchment area, explained by a higher potential water supply (White and Payette, Reference White and Payette2016). The current influence of catchment drainage was also indicated by a measured sustained positive hydraulic gradient between upland forest and the Abeille peatland (Carrer et al., Reference Carrer, Rousseau, St-Hilaire and Jutras2015). The relatively permeable fluvioglacial sediments underlying and surrounding the peatland may also have facilitated aquifer flow towards the ecosystem (Reeve et al., Reference Reeve, Siegel and Glaser2000), contributing to the rise in water tables.
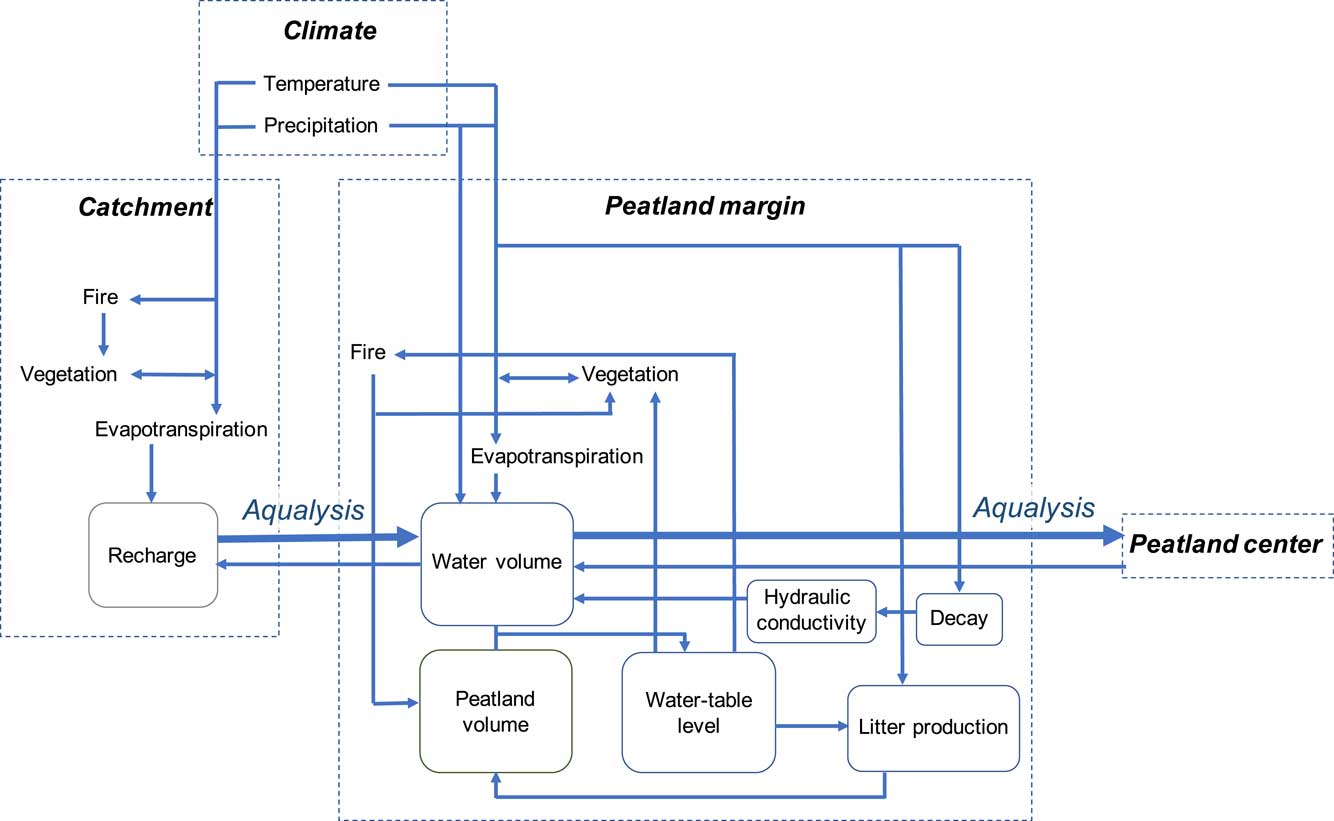
Figure 7 (color online) Processes contributing to aqualysis. Inflow from the catchment to the peatland margin, also impeding drainage from the center to the margin of the peatland, may have contributed to the increase in minerotrophy and aqualysis.
Implications and recommendations
Our results suggest that subarctic poor fens are sensitive to climatic variability and may therefore be useful archives of climate change, but also that hydrological processes at the scale of the watershed may need to be considered while interpreting paleorecords. They also underline the importance of modelling for evaluating ecosystem sensitivity to environmental change. We showed that, for ecosystems located at the bioclimatic limit of ombrotrophic peatlands, the specific sensitivity to climatic cooling and wetting, increased water flow and mineral input may determine whether the ecosystem is vulnerable to aqualysis. We suggest future studies in these types of ecosystems consider climate effects on hydrology beyond the peatland ecosystem itself, i.e., at the scale of the catchment.
CONCLUSION
The conceptual models, applied to a subarctic fen and in part evaluated using DigiBog, suggest that the ecosystem shift from a treed, ombrotrophic Picea-Sphagnum bog to a poor minerotrophic state with abundant pools likely occurred under cooler and wetter climatic conditions, combined with an enhanced water flow from the catchment towards the peatland. The various scenarios included in this study allowed us to identify the cold shift as being essential for a relatively rapid and persisting aqualysis to occur. This cooling likely caused a reduction in organic matter production that exceeded the negative effect on decay rates, which therefore resulted in a decrease in vertical accumulation rates. Enhanced input of minerotrophic water would have been necessary to explain the increase in minerotrophy during the late Holocene. The conceptual models suggest that climatic forcing was essential for aqualysis to occur, but the catchment topography of the Laforge region likely contributed to the potential for aqualysis.
ACKNOWLEDGMENTS
Funding was provided by an Engage NSERC project to Michelle Garneau (EGP492141-15) in collaboration with the industrial partner Stornoway Diamond Corporation. Thanks to our industrial partner, and specifically Benjamin Jacob, for support in the field. We are grateful to Dr. André Viau (University of Ottawa) for providing data on climate reconstructions. We highly appreciate the comments of Peter Langdon (Associate Editor) and two anonymous reviewers which improved the initial manuscript.


