INTRODUCTION
The last 2000 yr is a crucial period for the study of past global changes (PAGES, 2009; Yan et al., Reference Yan, Soon and Wang2015). High-resolution paleoclimatic records for the last 2000 yr are particularly needed to evaluate the increasing impact of human activity and to help us predict the possible evolution of future climate. Accordingly, numerous studies based on stalagmites (Zhang et al., Reference Zhang, Cheng, Edwards, Chen, Wang, Yang and Liu2008; Tan et al., Reference Tan, Cai, An, Edwards, Cheng, Shen and Zhang2010), lake sediments (Liu, X., et al., Reference Liu, Herzschuh, Wang, Kuhn and Yu2014a; Li et al., Reference Li, Liu, Wang, Herzschuh, Ni, Liao and Xiao2017), ice cores (Thompson et al., Reference Thompson, Yao, Mosley-Thompson, Davis, Henderson and Lin2000), tree rings (Shao et al., Reference Shao, Huang, Liu, Liang, Fang and Wang2005; Grießinger et al., Reference Grießinger, Bräuning, Helle, Hochreuther and Schleser2017), and historical documents (Tan et al., Reference Tan, Cai, Yi, An and Ai2008) have been performed to shed light on the paleoclimatic changes in China over the last 2000 yr.
The Qinghai-Tibetan Plateau (QTP) is thought to play a key role in the evolution of Asian atmospheric circulation (An et al., Reference An, Kutzbach, Prell and Porter2001). The paleoclimatic records of the QTP have been well-studied based on lacustrine sediments in different regions (Gasse et al., Reference Gasse, Arnold, Fontes, Fort, Gibert, Huc, Li, Li, Liu and Mélières1991; Shen et al., Reference Shen, Liu, Wang and Matsumoto2005; Herzschuh, Reference Herzschuh2006; Zhu et al., Reference Zhu, Wu, Wang, Xiao, Ju, Xie, Li, Mäusbacher, Schwalb and Daut2008; Herzschuh et al., Reference Herzschuh, Borkowski, Schewe, Mischke and Tian2014). These records, however, are mostly concentrated on millennial to orbital timescales, and little is currently known about the paleoclimatic changes of the northern QTP at the decadal to centennial timescales.
Records from Lake Kusai show that paleoclimatic changes at decadal to centennial timescales are mainly influenced by the Asian monsoon and have a close relationship with solar activity (Liu, X., et al., Reference Liu, Dong, Yang, Herzschuh, Zhang, Stuut and Wang2009). The chronology obtained from bulk organic carbon, however, is relatively low resolution and is affected by a 3400-yr reservoir effect. To better understand decadal- to centennial-scale paleoclimatic changes and their forcing mechanisms in the northern QTP over the last 2000 yr, we present high-resolution X-ray fluorescence (XRF) scanning records retrieved from a varved sediment core from Lake Kusai.
STUDY REGION
Lake Kusai (approximately 35°37′–35°50′N and 92°35′–93°05′E, 4475 m above sea level [asl]), a saline inland lake with a present-day salinity of 28.54 g/L, is situated in the Hoh Xil region of the northern QTP, northwest China (Fig. 1A). The area of the lake is 254.4 km2, with a catchment of approximately 3700 km2. The lake is fed mainly by the Kusai River, which originates to the west of the lake on the Daxue Mountain (5863 m asl). The Kusai River flows into the southwestern part of the lake, which is rather shallow and has a mean water depth of approximately 10 m. The lake is much deeper in the northwest, however, where the depth is approximately 50 m (Li, Reference Li1996; Wang and Dou, Reference Wang and Dou1998), and the sedimentary environment is stable and experiences less disturbances than that in the southwest. Modern meteorological records indicate a mean annual temperature of the lake area of approximately -5.4°C, a mean annual precipitation of approximately 275 mm, and a potential annual evaporation of approximately 1300 mm, resulting in a strongly arid climate.
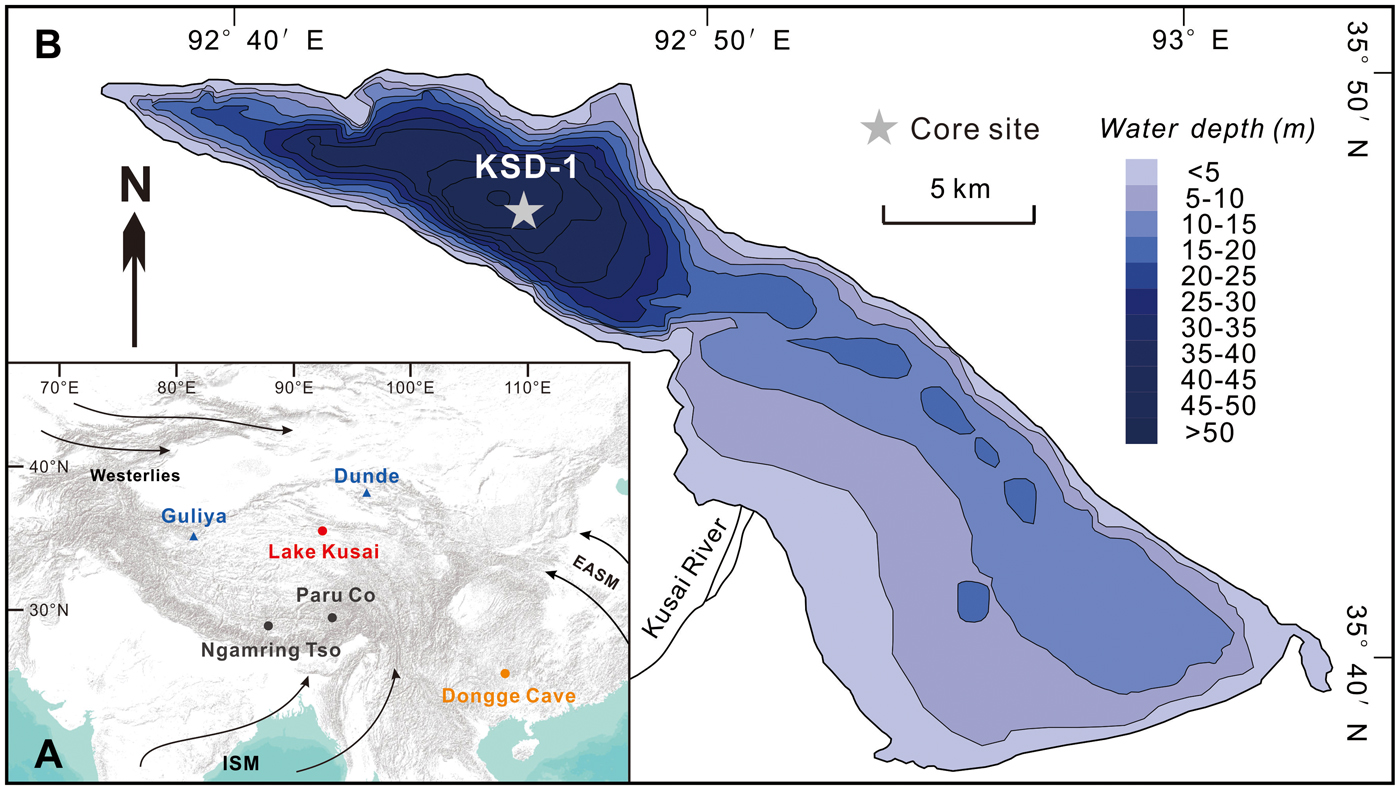
Figure 1. (color online) (A) Map showing the climatic system of China including the Indian Summer Monsoon (ISM), the East Asian Summer Monsoon (EASM), and the Westerlies. The locations of Lake Kusai and other paleoclimate sites mentioned in this paper, including the Guliya ice core (Yao et al., Reference Yao, Thompson, Qing, Tian, Jiao, Yang and Xie1996), Dunde ice core (Thompson et al., Reference Thompson, Mosleythompson, Brecher, Davis, León, Les, Lin, Mashiotta and Mountain2006), Ngamring Tso (Conroy et al., Reference Conroy, Hudson, Overpeck, Liu, Wang and Cole2017), Paru Co (Bird et al., Reference Bird, Polisar, Lei, Thompson, Yao, Finney, Bain, Pompeani and Steinman2014), and Dongge Cave (Wang et al., Reference Wang, Cheng, Edwards, He, Kong, An, Wu, Kelly, Dykoski and Li2005), are indicated. (B) The coring site of Lake Kusai. Bathymetry was measured in 2002.
The climate of the northern QTP is affected by both Asian monsoonal systems and the mid-latitude westerly circulation (An et al., Reference An, Colman, Zhou, Li, Brown, Jull and Cai2012; Yao et al., Reference Yao, Masson-Delmotte, Gao, Yu, Yang, Risi and Sturm2013). In the summertime, the lake basin is more humid with atmospheric precipitation and glacial meltwater, both of which can increase the runoff of the Kusai River and enhance the erosional degree of the catchment. In contrast, the region is characterized by a dry and cold continental climate in the winter. The Hoh Xil region experiences the highest frequency of dust storms in the Qinghai Province between February and April (Fang et al., Reference Fang, Zhu, Jiang and Qian1997).
MATERIALS AND METHODS
We drilled a 1.52-m-long sediment core (KSD-1) in the northwest of Lake Kusai at a water depth of 49.8 m using the UWITEC platform of Austria (Fig. 1B; http://www.uwitec.at). A short core (17 cm) was also collected parallel to the long core using a gravity corer. All sediment cores were stored in PVC tubes in the field. The short core was sampled at 0.5-cm intervals, and its slices were radiometrically dated by measuring the activity of 210Pb and 137Cs as a function of depth. The sedimentation rates and chronologies were calculated using the 210Pb data and the constant initial concentration (CIC) and the constant rate of supply (CRS) models (Appleby and Oldfieldz, Reference Appleby and Oldfieldz1983; Oldfield and Appleby, Reference Oldfield, Appleby, Haworth and Lund1984; Appleby, Reference Appleby, Last and Smol2001).
Due to the low pollen concentrations and the absence of terrestrial plant macrofossils in the cores, the 14C dating of total organic carbon samples was performed using accelerator mass spectrometry (AMS). Ten samples from the long sediment core were processed and dated at the National Isotope Centre, Institute of Geological and Nuclear Sciences, New Zealand (Table 1).
Table 1. AMS 14C ages and reservoir-corrected 14C ages obtained for core KSD-1.

The sediment cores of Lake Kusai are rhythmically laminated. The long core was split along the central axis. Undisturbed sediment slabs (7 × 1.5 × 1 cm) were collected continuously down core with 2 cm of overlap between two consecutive slabs to ensure that all couplets of laminations were represented. All sediment slabs were placed in aluminium boxes and frozen quickly by liquid nitrogen in approximately 15 minutes. The slabs were subsequently freeze-dried for 48 hours to remove the residual moisture and then embedded in low-viscosity epoxy resin under low vacuum. Following the procedures above, sediment slabs were cut lengthwise and ground to a thickness of approximately 50 µm. Optical microscope analyses were performed to count the laminations. We counted at least three times to ensure data quality and consistency. We estimated an approximate 1% error in ages based on the replicated counts.
Nondestructive XRF measurements on split long core surfaces at 0.5-cm resolution were performed with an Itrax XRF core scanner (Croudace et al., Reference Croudace, Rindby, Rothwell and Rothwell2006) at the Institute of Geology and Geophysics, Chinese Academy of Sciences. All elements were measured at an X-ray voltage of 30 kV and a current of 55 mA. The data are semiquantitative and provide relative fluctuations in the chemical element compositions as counts per second (cps; Croudace et al., Reference Croudace, Rindby, Rothwell and Rothwell2006; Rothwell and Rack, Reference Rothwell, Rack and Rothwell2006; Löwemark et al., Reference Löwemark, Chen, Yang, Kylander, Yu, Hsu, Lee, Song and Jarvis2011).
RESULTS AND DISCUSSION
Varve structure
The seasonal rhythms of climate induce recurrent yearly changes in sedimentary input and varve formation (Haltia-Hovi et al., Reference Haltia-Hovi, Saarinen and Kukkonen2007; Zolitschka et al., Reference Zolitschka, Francus, Ojala and Schimmelmann2015). The basic couplet structure in Lake Kusai was found to be composed of dark- and light-colored lamina. The thin dark layers composed of coarse sand and silt, mainly quartz, feldspar, and mica, were formed by aeolian processes during winter. The light layers were relatively thick and consisted of authigenic carbonates and fine-grained clay minerals. These laminae were explained as representing summer season accumulations during which carbonates were deposited (Liu, X., et al., Reference Liu, Yu, Dong and Chen2014b; Chen et al., Reference Chen, Liu, He, Ye, Chen and Li2016).
Chronology
An apparent rise in 137Cs activity occurred at approximately 3.5 cm in the short core and can probably be explained by the onset of major fallout in AD 1954 in the Northern Hemisphere. The peak of 137Cs at approximately 3 cm corresponds to AD 1963, which is the peak of world nuclear weapon testing (Fig. 2A; Pennington, Reference Pennington1973). The 137Cs-based chronology is generally in good agreement with the varve-based chronology but does not agree well with either 210Pb model (CIC and CRS), an aspect which needs to be studied in the future.
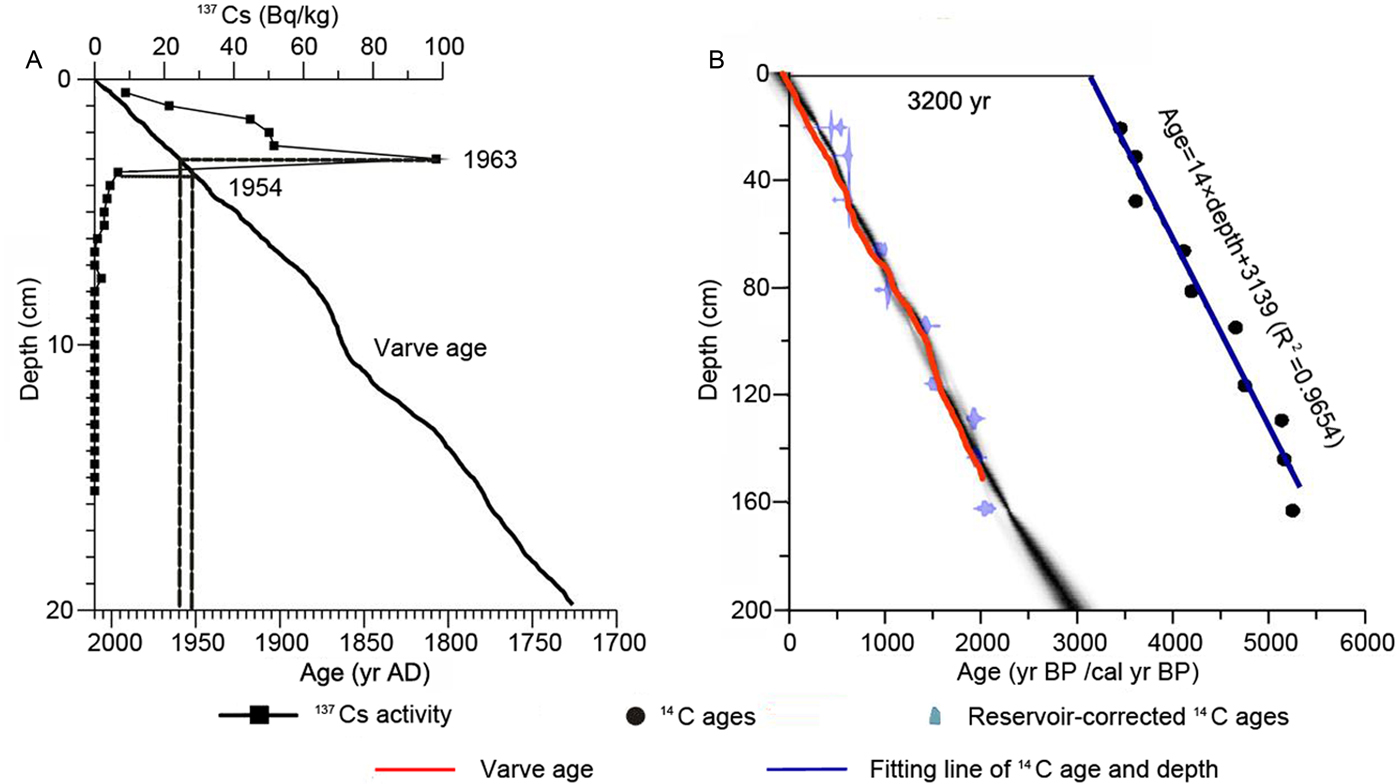
Figure 2. (color online) (A) Dating results of the varve and 137Cs ages from the short core. (B) Varve and AMS 14C ages (after 14C ages were reservoir corrected by 3200 yr) from the KSD-1 long core.
The age (14C)/depth correlation for the Lake Kusai records is shown in Figure 2B. A comparison of the 137Cs-based ages at a depth of 4 cm (AD 1950 or 0 yr BP) with the linearly fitted 14C age at the same level, which was determined by interpolation among the ten AMS 14C ages, suggests that the radiocarbon age is in excess of the 137Cs age by 3200 yr. This phenomenon can be ascribed to the reservoir effect, which is widespread in the radiocarbon dating of lacustrine sediments in western China, particularly in saline lakes on the QTP (Herzschuh, Reference Herzschuh2006; Morrill et al., Reference Morrill, Overpeck, Cole, Liu, Shen and Tang2006; Liu, X., et al., Reference Liu, Dong, Rech, Matsumoto, Bo and Wang2008a; Hou et al., Reference Hou, D'Andrea and Liu2012). Ten AMS 14C ages from the long core have a high linear correlation (R 2 = 0.9654), which demonstrates that the hydrochemical conditions were stable, and the magnitude of the reservoir effect had no obvious changes. Thus, we assumed an invariable 14C reservoir effect over the time scale of the long core and subtracted a value of 3200 from all 14C ages prior to calibration. The age-depth model was constructed by the Bayesian method (Blaauw and Christen, Reference Blaauw and Christen2011) and calibrated using the IntCal09 dataset (Reimer et al., Reference Reimer, Bard, Bayliss, Beck, Blackwell, Ramsey and Buck2013). The varve age agrees well with the calibrated 14C age, which proves that the laminations of the long core are varves and that the varve-based chronology is suitable for analyzing the decadal- to centennial-scale paleoclimatic changes of Lake Kusai. Our chronology in this study is based on the varve age. The chronology spans from approximately AD 31 to AD 2010, when the core was collected.
Temperature variations in Lake Kusai and their relationship with solar activity
Previous studies have indicated that the carbonates deposited in the sediments of Lake Kusai are predominately authigenic in origin, as a result of chemical and biochemical processes, and are mainly composed of aragonite (Yao et al., Reference Yao, Liu, Wang and Yang2011). The deposition of authigenic carbonate is complex and influenced by many factors, such as temperature, salinity, and the primary productivity of lakes (Kelts and Hsü, Reference Kelts, Hsü and Lerman1978), but temperature is the most important influencing factor (Liu, X., et al., Reference Liu, Herzschuh, Shen, Jiang and Xiao2008b; Li and Liu, Reference Li and Liu2018). Increases in temperature can result in increased carbonate precipitation based on the following mechanisms: (1) decreases in the solubility of CaCO3 (Conroy et al., Reference Conroy, Thompson, Collins, Overpeck, Bush and Cole2014); (2) the evaporation of the lake region is enhanced, leading to the enrichment and supersaturation of Ca2+ and CO32− in lake waters and thus facilitating the preferential precipitation of carbonates (Xiao et al., Reference Xiao, Wu, Si, Liang, Nakamura, Liu and Inouchi2006; Mishra et al., Reference Mishra, Anoop, Schettler, Prasad, Jehangir, Menzel, Naumann, Yousuf, Basavaiah and Deenadayalan2015); (3) algae photosynthesis assimilates a high amount of CO2 (aq) (Opitz et al., Reference Opitz, Wünnemann, Aichner, Dietze, Hartmann, Herzschuh and Ijmker2012), which can lead to the supersaturation of CO32− and promote the deposition of carbonates; and (4) increases in the abundance of cyanobacteria, which serve as nuclei for carbonate precipitation (Hodell et al., Reference Hodell, Schelske, Fahnenstiel and Robbins1998). Ca is mainly associated with the mineral CaCO3 (Cohen, Reference Cohen2003), which is the main component of authigenic carbonates in lake sediments. Therefore, we consider temperature to be closely related to fluctuations in Ca.
To verify this link, we compared the Ca record of Lake Kusai with the δ18O record from the Dunde ice core (Thompson et al., Reference Thompson, Mosleythompson, Brecher, Davis, León, Les, Lin, Mashiotta and Mountain2006) and the temperature reconstruction of the QTP based on multiple proxy records (Fig. 3; Yang et al., Reference Yang, Braeuning and Shi2003). The fluctuations in the three curves are similar at the centennial time scale, and the small discrepancies among the three records possibly reflect errors in chronology. The Pearson correlations for the Ca record with the ice core record (R = 0.63, P < 0.01, n = 256) and the temperature reconstruction of the QTP (R = 0.22, P < 0.01, n = 363) are significant at the centennial time scale. During the last 2000 yr, three distinct high-temperature episodes that occurred in AD 31–175, 475–1400, and 1900–present correlate well with the Roman Warm Period, Medieval Warm Period , and Current Warm Period, respectively. Between these three warm episodes are two low-temperature periods in AD 175–475 and 1400–1900, which might correspond to the Dark Age Cold Period and Little Ice Age, respectively. These warm and cold periods were also reported by other temperature records in China (Yang et al., Reference Yang, Braeuning, Johnson and Shi2002; Ge et al., Reference Ge, Zheng, Hao and Liu2013), which further demonstrates that the temperature fluctuations in the northern QTP were consistent with those of other areas over the last 2000 yr.

Figure 3. Comparison of the Ca record from Lake Kusai with different paleoclimatic signals over the last 2000 yr. (A) The grey and black lines represent the decadal and centennial variations in the δ18O record from the Dunde ice core, respectively (Thompson et al., Reference Thompson, Mosleythompson, Brecher, Davis, León, Les, Lin, Mashiotta and Mountain2006). (B) Ca record from Lake Kusai. The superimposed smoothed curve emphasizes the centennial long-term variations. (C) Temperature changes in the QTP reconstructed by various paleoclimatic proxy records (Yang et al., Reference Yang, Braeuning and Shi2003).
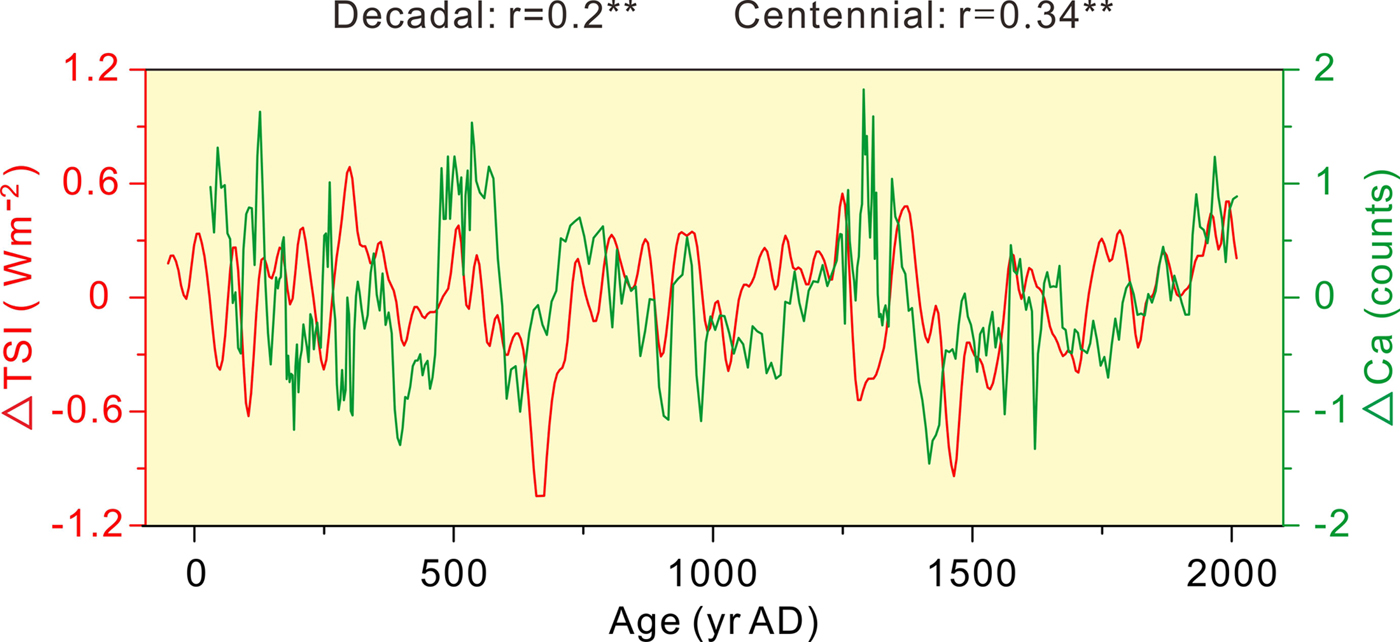
The role of solar activity on the Earth's climate system and its influence at a variety of temporal and spatial scales have been widely discussed (Beer et al., Reference Beer, Mende and Stellmacher2000; Bard and Frank, Reference Bard and Frank2006; Saarni et al., Reference Saarni, Muschitiello, Weege, Brauer and Saarinen2016). Previous studies have demonstrated that the cosmogenic radionuclide 10Be can be used to reconstruct solar activity beyond the limits of instrumental records (Berggren et al., Reference Berggren, Beer, Possnert, Aldahan, Kubik, Christl, Johnsen, Abreu and Vinther2009; Adolphi et al., Reference Adolphi, Muscheler, Svensson, Aldahan, Possnert, Beer, Sjolte, Björck, Matthes and Thiéblemont2014). In general, variations in temperature are positively correlated with solar activity at decadal to millennial timescales (Wiles et al., Reference Wiles, D'Arrigo, Villalba, Calkin and Barclay2004; Usoskin et al., Reference Usoskin, Schüssler, Solanki and Mursula2005; Liu, Y., et al., Reference Liu, An, Linderholm, Chen, Song, Cai, Sun and Hua2009). Thus, we compared the detrended Ca record (ΔCa) from Lake Kusai to the detrended total solar irradiance record (ΔTSI) reconstructed by 10Be (Fig. 4; Steinhilber et al., Reference Steinhilber, Beer and Fröhlich2009). The fluctuations in Ca are generally in good agreement with the variations in TSI at decadal (R = 0.2, P < 0.01, n = 392) and centennial (R = 0.34, P < 0.01, n = 374) timescales over the last 2000 yr. The results reveal a positive correlation between solar activity and temperature variations at decadal to centennial timescales.

Figure 4. Comparison between the detrended TSI record (ΔTSI) reconstructed from the cosmogenic radionuclide 10Be data (red line; Steinhilber et al., Reference Steinhilber, Beer and Fröhlich2009) and the detrended Ca record (ΔCa) from Lake Kusai (green line) over the last 2000 yr. Correlations between two records are shown above the figure. The double asterisk denotes a significant correlation at the 99% confidence level. (For interpretation of the references to color in this figure legend, the reader is referred to the web version of this article.)
Furthermore, this result is also supported by cross-wavelet transform (XWT), a method for examining common periodicities and relative phases in time-frequency space between two records (Fig. 5; Grinsted et al., Reference Grinsted, Moore and Jevrejeva2004). We noticed that the Ca and TSI records exhibit a broad band of common frequencies extending from ~210 yr to 40 yr that are significant at a 95% confidence level relative to the red noise spectrum. More importantly, both records show a clear positive correlation with the highest power at periodicities of approximately 210 yr, which is similar to the de Vries/Suess solar activity cycle (~210 yr; Suess, Reference Suess1980; Wagner et al., Reference Wagner, Beer, Masarik, Muscheler, Kubik, Mende, Laj, Raisbeck and Yiou2001; Huang and Tian, Reference Huang and Tian2018). Our results show that the temperature fluctuations reflected by the Ca record reveal a high multi-decadal to centennial-scale spectral coherency with solar activity. In conclusion, solar output was the likely primary forcing factor of decadal- to centennial-scale temperature changes in the northern QTP over the last 2000 yr.
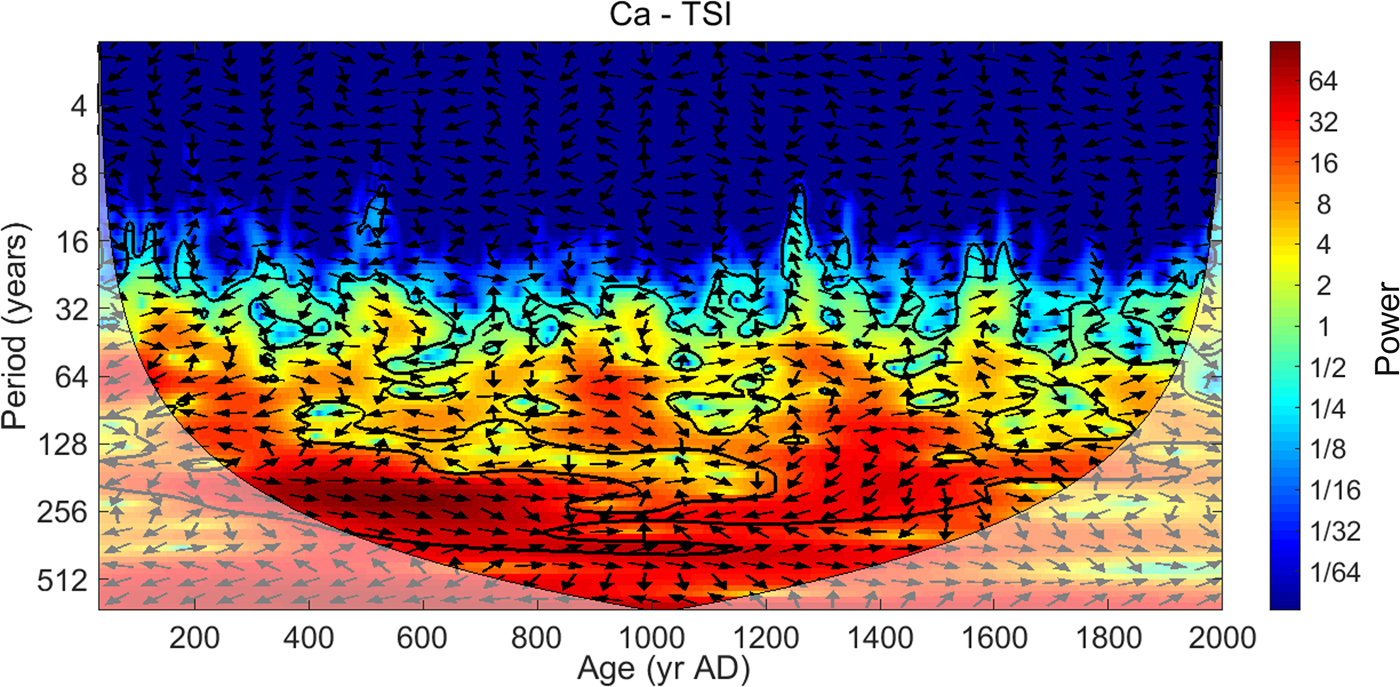
Figure 5. Cross-wavelet transform for the Ca and TSI (Steinhilber et al., Reference Steinhilber, Beer and Fröhlich2009) records over the last 2000 yr. Common spectral strengths are shown by colours ranging from deep blue (weak) to deep red (strong). The region without lighter shading delineates a range in which the identified frequencies can be interpreted. The irregular black curves delineate a 95% confidence level against the red noise signal. The small arrows illustrate the phase differences between the two data sets: the arrow pointing right is in-phase, the arrow pointing left is out-of-phase, and other angles are shown in proportion to phase differences. (For interpretation of the references to color in this figure legend, the reader is referred to the web version of this article.)
Fluctuations in effective moisture over the last 2000 yr
Rb, being chemically similar to K, is often enriched in fine-grained clay mineral assemblages (Koinig et al., Reference Koinig, Shotyk, Lotter, Ohlendorf and Sturm2003; Liu, X., et al., Reference Liu, Herzschuh, Wang, Kuhn and Yu2014a). Sr is generally a substitute for Ca in authigenic carbonates and coprecipitates within lake sediments (Cohen, Reference Cohen2003; Croudace and Rothwell, Reference Croudace and Rothwell2015). Sr can be dispersed in minerals containing Ca (e.g., aragonite and anorthose) with an isomorphism relationship due to their similar ionic radii. Our Sr record shows a strong positive correlation with the Ca record (R = 0.77, P < 0.01, n = 335), which demonstrates that Sr was mostly coprecipitated with Ca rather than derived from allochthonous detrital input. In general, increases in regional effective moisture lead to increases in river runoff, which can enhance the degree of catchment erosion and carry high levels of Rb into lakes with fine-grained detrital input. Thus, we used the Rb/Sr ratio to indicate the variations in effective moisture (Heymann et al., Reference Heymann, Nelle, Dörfler, Zagana, Nowaczyk, Xue and Unkel2013) in Lake Kusai over the last 2000 yr. To avoid the closed-sum effect and show the relative fluctuations of the curve (Weltje and Tjallingii, Reference Weltje and Tjallingii2008), we used the log-ratios of Rb/Sr as the index to delineate effective moisture fluctuations in this study.
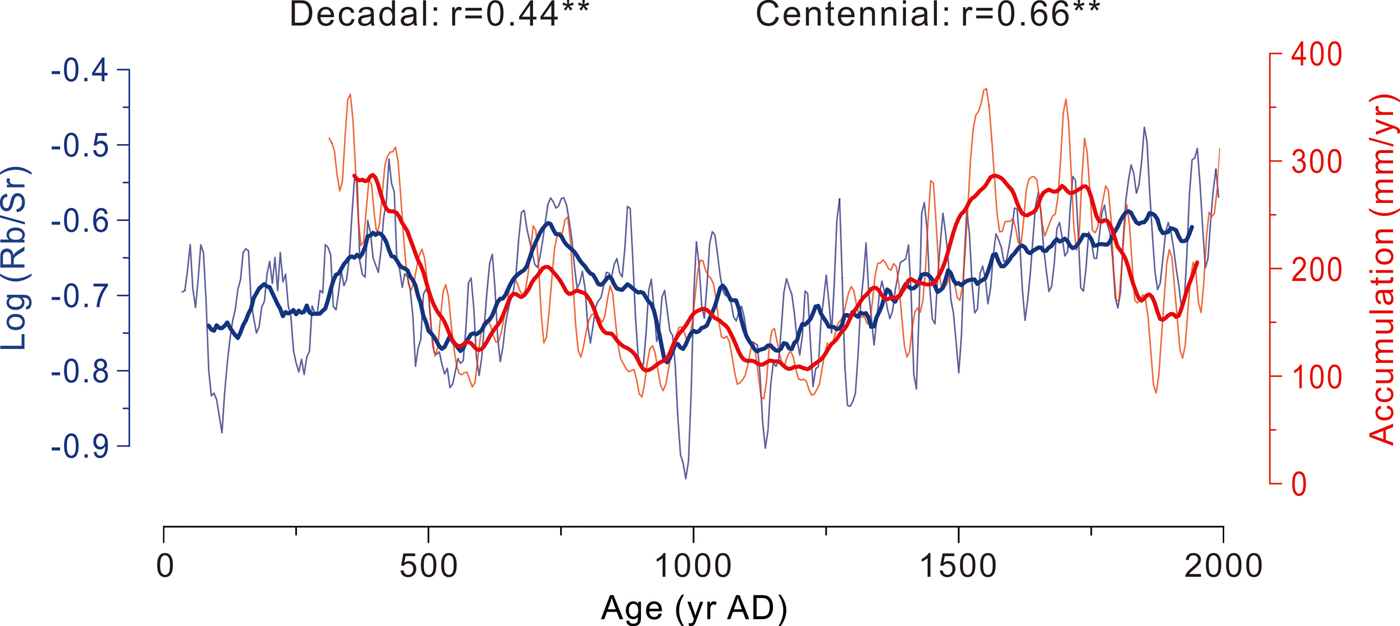
To verify the reliability of our effective moisture index, we compared the log (Rb/Sr) data from Lake Kusai to the glacial accumulation record from the Guliya ice core (Yao et al., Reference Yao, Thompson, Qing, Tian, Jiao, Yang and Xie1996) over the last 1700 yr (Fig. 6). Over this time interval, the Pearson correlation coefficients of the two records reach high values at decadal (R = 0.44, P < 0.01, n = 337) and centennial (R = 0.66, P < 0.01, n = 319) timescales.

Figure 6. Comparison of the log (Rb/Sr) data from Lake Kusai (blue line) and the glacial accumulation record from the Guliya ice core (red line; Yao et al., Reference Yao, Thompson, Qing, Tian, Jiao, Yang and Xie1996) over the last 1700 yr. The thin and thick lines indicate the fluctuations at decadal and centennial timescales, respectively. Correlations between the two records are shown above the figure. The double asterisk denotes a significant correlation at the 99% confidence level. (For interpretation of the references to color in this figure legend, the reader is referred to the web version of this article.)
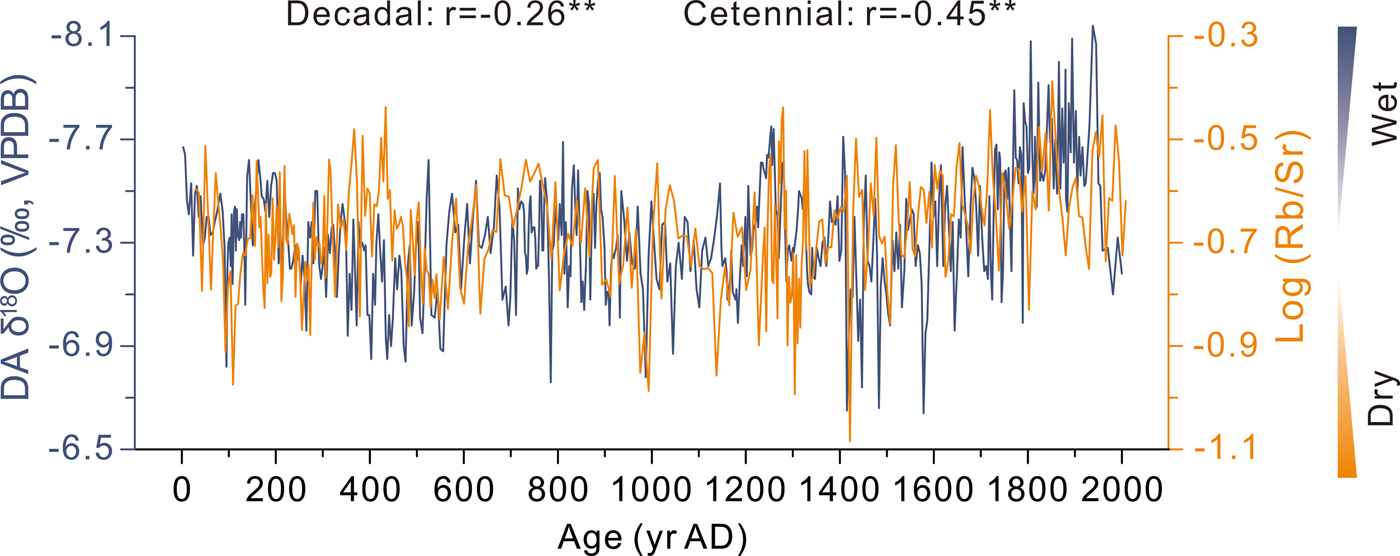
The stalagmite record of Dongge Cave has been widely interpreted as a proxy for the intensity and precipitation of the Indian summer monsoon (ISM) throughout the Holocene (Dykoski et al., Reference Dykoski, Edwards, Cheng, Yuan, Cai, Zhang, Lin, Qing, An and Revenaugh2005; Wang et al., Reference Wang, Cheng, Edwards, He, Kong, An, Wu, Kelly, Dykoski and Li2005). To further investigate the forcing mechanism of effective moisture variations in the northern QTP, we compared the log (Rb/Sr) data of Lake Kusai with the radiometrically dated δ18O record from stalagmites in Dongge Cave at the decadal to centennial timescales (Fig. 7). The results show that the effective moisture variability of Lake Kusai reflected by the log-ratios of Rb/Sr is well-related to ISM strengthening, as indicated by the δ18O record from Dongge Cave, at decadal (R = −0.26, P < 0.01, n = 392) and centennial (R = −0.45, P < 0.01, n = 374) timescales. These results imply a positive correlation between the effective moisture variations and the intensity of the ISM over the last 2000 yr, which might demonstrate that the ISM can affect not only low-latitude regions but also mid-latitude regions (the northern QTP; Liu, X., et al., Reference Liu, Dong, Yang, Herzschuh, Zhang, Stuut and Wang2009; Ramisch et al., Reference Ramisch, Lockot, Haberzettl, Hartmann, Kuhn, Lehmkuhl and Schimpf2016). Thus, our results indicate that the decadal- to centennial-scale effective moisture variations in Lake Kusai over the last 2000 yr can be mainly ascribed to the response to the ISM.

Figure 7. Comparison between the log-ratios of Rb/Sr from Lake Kusai (tawny line) and the δ18O record from Dongge Cave (dark blue line; Wang et al., Reference Wang, Cheng, Edwards, He, Kong, An, Wu, Kelly, Dykoski and Li2005) over the last 2000 yr. Correlations between the two records are shown above the figure. The double asterisk denotes a significant correlation at the 99% confidence level. (For interpretation of the references to color in this figure legend, the reader is referred to the web version of this article.)
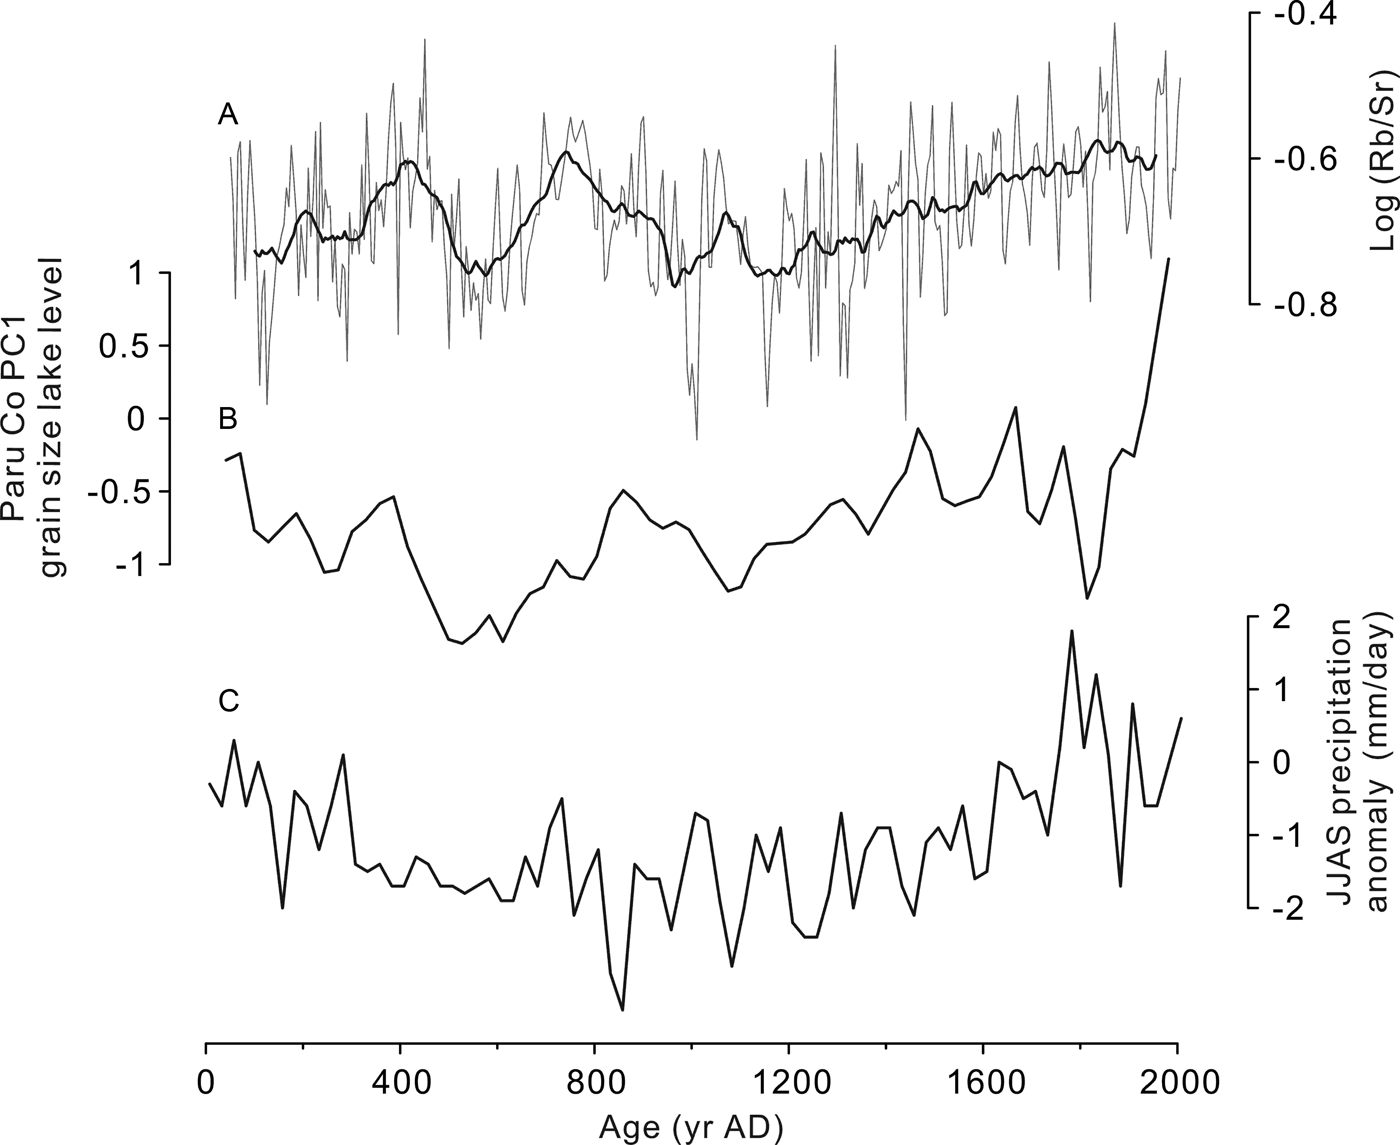
Furthermore, our result has also been evidenced by hydroclimatic records from other monsoon-influenced lakes in the southern QTP. We compared the log (Rb/Sr) data of Lake Kusai with the Paru Co lake-level curve (Bird et al., Reference Bird, Polisar, Lei, Thompson, Yao, Finney, Bain, Pompeani and Steinman2014) and the Ngamring Tso reconstructed summer (JJAS) precipitation (Fig. 8; Conroy et al., Reference Conroy, Hudson, Overpeck, Liu, Wang and Cole2017). The fluctuations in the three curves are similar, which indicate that the moisture variability of both northern and southern parts of QTP have been driven by the ISM during the last 2000 yr. Paleoclimatic records in the northern QTP, however, remain scarce. Hence, this conclusion needs to be further proven by more high-resolution records in the future.

Figure 8. Time series of log (Rb/Sr) from Lake Kusai compared with other hydroclimatic records from the southern QTP. (A) Log (Rb/Sr) record from Lake Kusai. The superimposed smoothed curve emphasizes the centennial long-term variations. (B) Paru Co PC1 grain size (Bird et al., Reference Bird, Polisar, Lei, Thompson, Yao, Finney, Bain, Pompeani and Steinman2014). (C) Ngamring Tso reconstructed summer (JJAS) precipitation (Conroy et al., Reference Conroy, Hudson, Overpeck, Liu, Wang and Cole2017).
As an important component of the global monsoon system (Wang et al., Reference Wang, Wang, Cheng, Fasullo, Guo, Kiefer and Liu2017), the ISM has a profound influence on the moisture variations of East Asia. Asian monsoonal system intensity at millennial or orbital timescales is predominantly affected by changes in solar activity and insolation (Wang et al., Reference Wang, Cheng, Edwards, He, Kong, An, Wu, Kelly, Dykoski and Li2005; Liu, J., et al., Reference Liu, Wang, Ding, Kuang, Willie and Eduardo2009; Cheng et al., Reference Cheng, Edwards, Sinha, Spötl, Yi, Chen and Kelly2016). The reliability of this assertion, however, is still under debate for short timescales. For example, as an indicator of ISM intensity, the δ18O record from Dongge Cave does not agree well with the residual atmospheric 14C record (Stuiver, Reference Stuiver1998) at the decadal time scale in the Holocene (Wang et al., Reference Wang, Cheng, Edwards, He, Kong, An, Wu, Kelly, Dykoski and Li2005) and in the last 2000 yr. Thus, we performed cross-wavelet analyses of the TSI record (Steinhilber et al., Reference Steinhilber, Beer and Fröhlich2009) with the log (Rb/Sr) record from Lake Kusai and with the δ18O record from Dongge Cave (Wang et al., Reference Wang, Cheng, Edwards, He, Kong, An, Wu, Kelly, Dykoski and Li2005) over the last 2000 yr (Fig. 9). Neither record revealed the evident common periodicities with solar activity at decadal to centennial timescales, even though they shared some frequencies. This result might demonstrate that the decadal- to centennial-scale effective moisture variations in the northern QTP were not directly controlled by solar activity over the last 2000 yr. This phenomenon has also been reported by other paleoclimatic studies (Yao et al., Reference Yao, Thompson, Qing, Tian, Jiao, Yang and Xie1996; Ekdahl et al., Reference Ekdahl, Fritz, Baker, Rigsby and Coley2008; Zhao et al., Reference Zhao, Zhou and Liu2011; Yang et al., Reference Yang, Qin, Wang, He, Melvin, Osborn and Briffa2014; Conroy et al., Reference Conroy, Hudson, Overpeck, Liu, Wang and Cole2017), and its underlying mechanisms remain ambiguous. At short timescales, many internal factors of climate systems, such as atmospheric circulations, large-scale ocean-atmosphere processes, and human activities, can also influence regional hydroclimatic conditions (PAGES, 2009; Bird et al., Reference Bird, Lei, Perello, Polissar, Yao, Finney, Bain, Pompeani and Thompson2016; Conroy et al., Reference Conroy, Hudson, Overpeck, Liu, Wang and Cole2017; PAGES Hydro2k Consortium, 2017), and this topic still needs to be studied in the future.
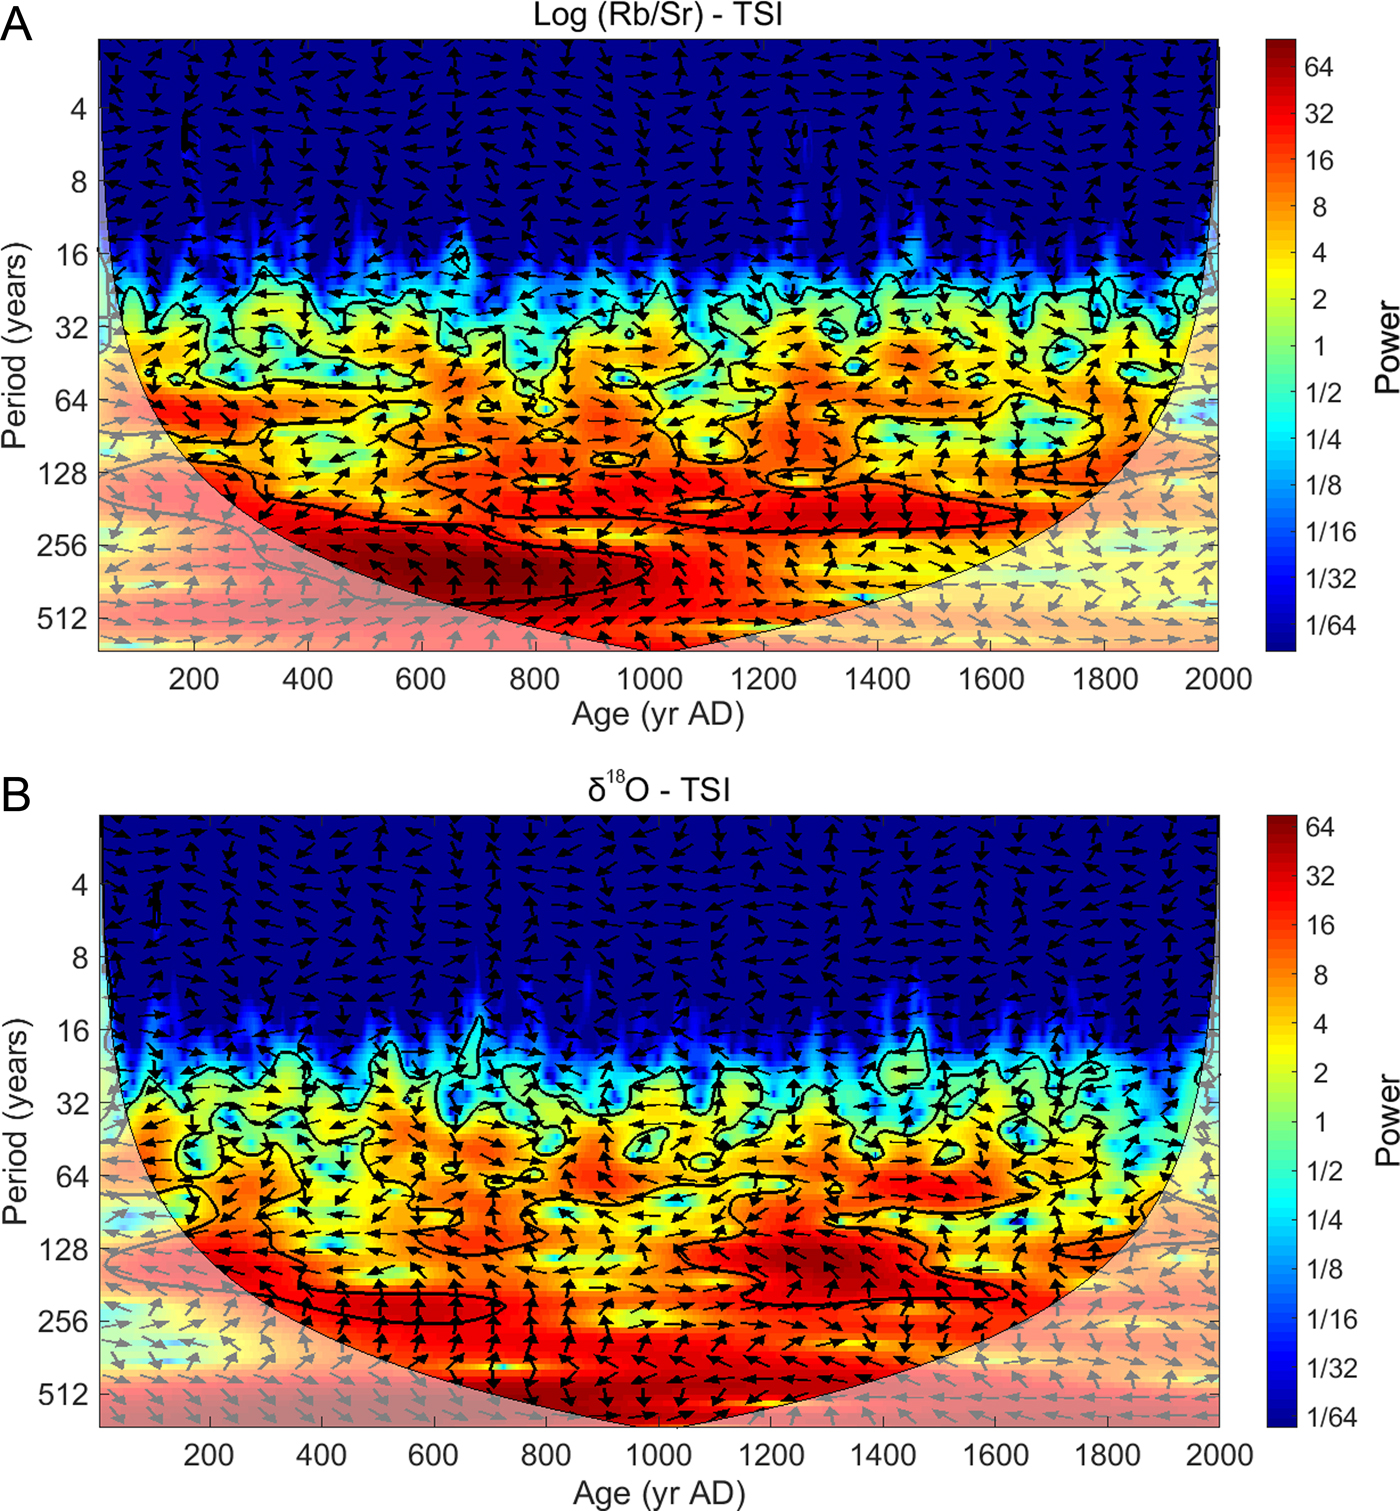
Figure 9. Cross-wavelet analyses of the TSI record (Steinhilber et al., Reference Steinhilber, Beer and Fröhlich2009) with (A) the log (Rb/Sr) record and (B) the δ18O record from stalagmites over the last 2000 yr (Wang et al., Reference Wang, Cheng, Edwards, He, Kong, An, Wu, Kelly, Dykoski and Li2005). Common spectral strengths are shown by colours ranging from deep blue (weak) to deep red (strong). The region without lighter shading delineates a range in which the identified frequencies can be interpreted. The irregular black curves delineate a 95% confidence level against the red noise signal. The small arrows illustrate the phase differences between the two data sets: the arrow pointing right is in-phase, the arrow pointing left is out-of-phase, and other angles are shown in proportion to phase differences. (For interpretation of the references to color in this figure legend, the reader is referred to the web version of this article.)
CONCLUSIONS
Based on the high-resolution XRF scanning records from 1.52-m-long succession of varved sediments from Lake Kusai, we draw the following major conclusions:
(1) At decadal to centennial timescales, the Ca record is a proxy for temperature changes, which correlates well with the variations and periodicities of solar activity. These results indicate that solar output was the likely primary forcing mechanism of decadal- to centennial-scale temperature fluctuations over the last 2000 yr.
(2) The decadal- to centennial-scale variability of the effective moisture of Lake Kusai, which is reflected by the log-ratios of Rb/Sr, was mainly influenced by the ISM over the last 2000 yr. However, we have not found obvious periodicities of solar activity in our effective moisture record. This finding indicates that the evolution of decadal- to centennial-scale effective moisture in the northern QTP might not have been directly controlled by solar activity over the last 2000 yr.
ACKNOWLEDGMENTS
We would like to express our gratitude to senior editor Lewis Owen, associate editor Peter Langdon, Professor Jonathan Holmes, and an anonymous reviewer for their constructive comments which improved the quality of this manuscript. We thank Kai Li (Zhejiang Normal University), Junfeng Li (Capital Normal University), and Zhenyu Ni (Nanjing Institute of Geography and Limnology, Chinese Academy of Sciences) for their help with the fieldwork. We also acknowledge American Journal Experts for the English-language editing. This study was supported by the National Natural Science Foundation of China (NSFC) and the German Research Foundation (DFG; Grant No. 41861134030), and the NSFC (Grant No. 41572338).