INTRODUCTION
Developing robust predictions of the interrelationship between human behavior and ecological variability—and its archaeological signatures—is fundamental to understanding human adaptive plasticity and survival (Roberts and Stewart, Reference Roberts and Stewart2018). Toward the end of the Pleistocene, increasingly variable global climates transformed a long-standing, cyclical glacial-interglacial pattern into the relatively stable interglacial Holocene. As documented by numerous studies (Kirch, Reference Kirch2005; Anderson et al., Reference Anderson, Maasch, Sandweiss, Mayewski, Anderson, Maasch and Sandweiss2007; Faith, Reference Faith2014; Roberts et al., Reference Roberts, Henshilwood, van Niekerk, Keene, Gledhill, Reynard, Badenhorst and Lee-Thorp2016), climatic changes during this time had major impacts on regional paleoenvironments worldwide which, in turn, influenced localized plant and animal communities. For hunter-gatherers, the impact of these habitat changes would have permeated all aspects of their lives, influencing their resource base for food, wood-fuel, medicines, utilitarian items, and all other daily necessities. These changes would have also impacted their gathering strategies as they adapted to changing distributions and types of resources on the landscapes. These changes included what resources were collected; where, when, and how resources were collected; and the duration and locations of encampments to strategically access resources and duration of stays.
One of the most extreme habitat changes at the end of the Pleistocene occurred during the period of maximum global ice volume, known as the last glacial maximum (LGM: 26.5–19 ka; [Clark et al., Reference Clark, Dyke, Shakun, Carlson, Clark, Wohlfarth, Mitrovica, Hostetler and McCabe2009]). The expansion of sea ice dropped eustatic sea levels by up to 125 m below modern levels (Yokoyama et al., Reference Yokoyama, Esat, Thompson, Thomas, Webster, Miyairi and Sawada2018), and these lowered sea levels exposed large tracts of land on continental margins (Fig. 1). In South Africa, geospatial models have demonstrated that upwards of 80,000 km2 of seafloor was exposed across the broad and flat Agulhas Bank and Atlantic shelf—an area approximately the size of the island of Ireland today (Fisher et al., Reference Fisher, Bar-Matthews, Jerardino and Marean2010). This expansive new landmass is believed to have supported populations of large grazing fauna and possibly a now-extinct migratory ecosystem (Klein, Reference Klein1972, Reference Klein1976; Thompson, Reference Thompson2010; Thompson and Henshilwood, Reference Thompson and Henshilwood2011; Faith, Reference Faith2013; Copeland et al., Reference Copeland, Cawthra, Fisher, Lee-Thorp, Cowling, le Roux, Hodgkins and Marean2016; Sealy et al., Reference Sealy, Lee-Thorp, Loftus, Faith and Marean2016; Chase et al., Reference Chase, Faith, Mackay, Chevalier, Carr, Boom, Lim and Reimer2018). Unfortunately, archaeological records of hunter-gatherer occupation on the continental shelf were largely destroyed by sea-level rise at the onset of Termination-I (~14 ka), leading into the Holocene (Steig et al., Reference Steig, Brook, White, Sucher, Bender, Lehman, Morse, Waddington and Clow1998; Heroy and Anderson, Reference Heroy and Anderson2007; Price et al., Reference Price, Conway and Waddington2007). In southern Africa, this has resulted in a near complete absence of records documenting coastal occupation and resource use dating to glacial periods. Evidence of hunter-gatherers from more inland locations shows that contemporary groups had adapted to the widespread and largely open landscapes, innovating maintainable and lightweight lithic toolkits that emphasized miniaturized freehand and bipolar core bladelet technologies (Mitchell, Reference Mitchell1988; Pargeter et al., Reference Pargeter, Loftus and Mitchell2017). The presence of marine shell at some of these inland sites strongly suggests that some inland groups maintained connections to coastlines during this timeframe (Deacon, Reference Deacon1984; Wadley, Reference Wadley1993; Mitchell, Reference Mitchell1996). What remains to be understood though is the nature of the link between shoreline and the interior, and of the communities that used these places. For instance, was there regular movement of goods and/or people between the coast and hinterland? Did some groups reside permanently at the coast? How were coastal occupations and links between coastal and interior groups influenced by climatic and environmental changes across glacial and interglacial periods?
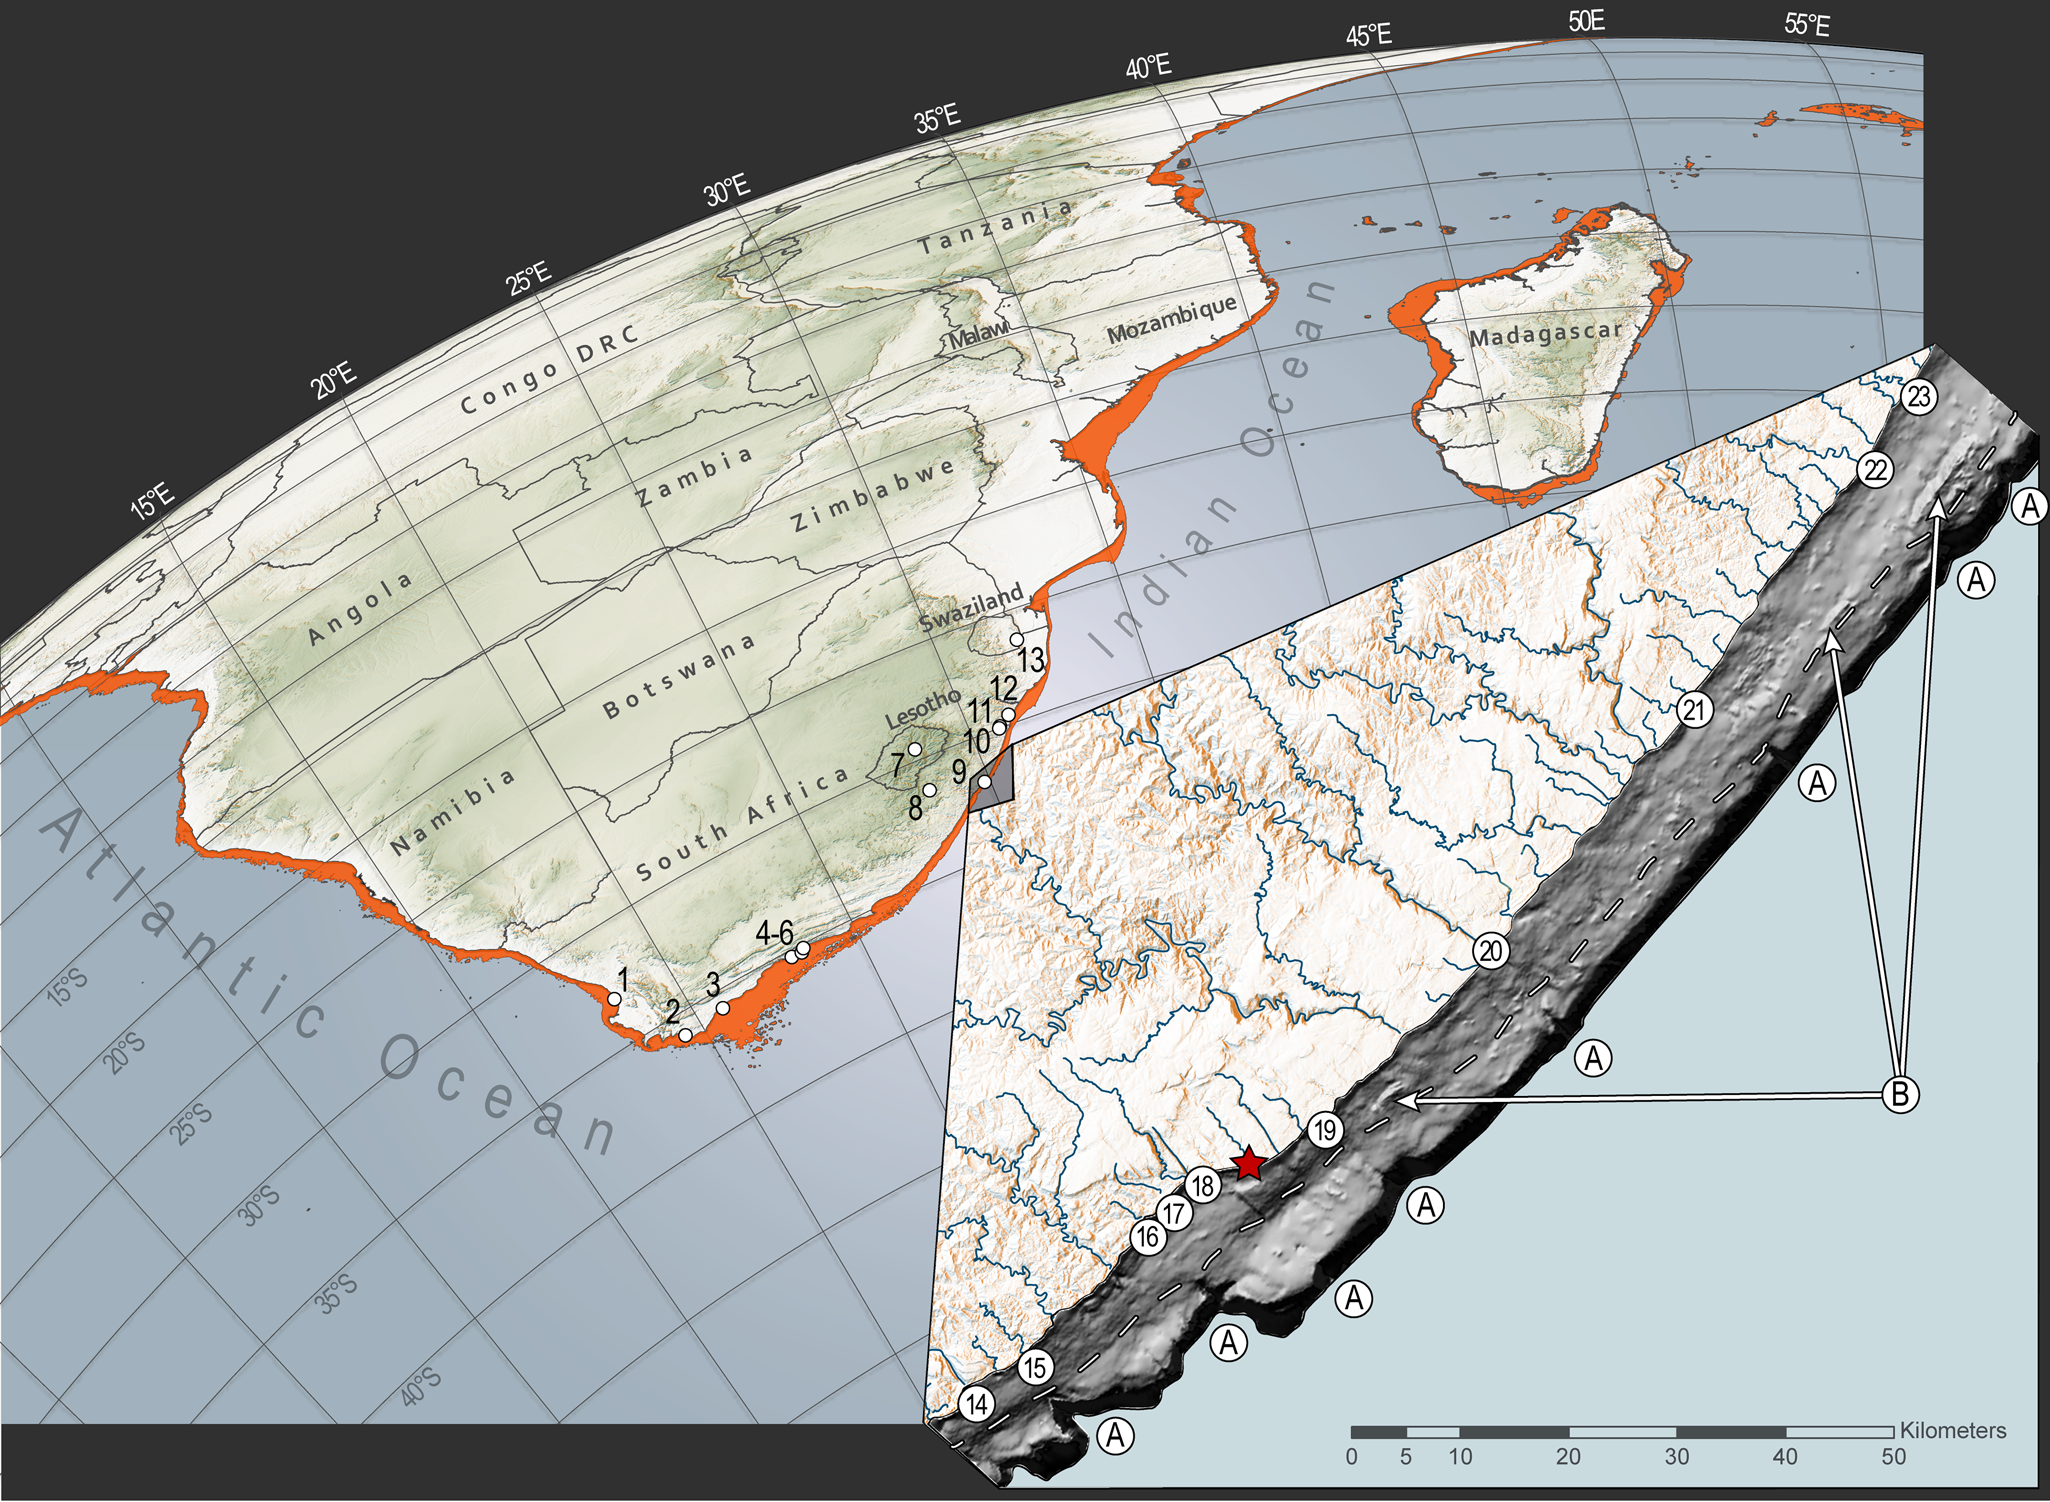
Figure 1. Archaeological sites mentioned in the text with inset showing the bathymetry of the continental shelf adjacent to Waterfall Bluff and the maximum extent of continental shelf exposure during the last glacial maximum. The main image shows archaeological sites referenced in the text and the maximum exposure of the continental shelf during the last glacial maximum. The sites are: (1) Elands Bay Cave, (2) Byneskranskop Cave, (3) Klipdrift rock shelter, (4) Knysna Eastern Heads 1, (5) Nelson Bay Cave, (6) Matjies River rock shelter, (7) Sehonghong, (8) Strathlahan B, (9) Waterfall Bluff, (10) Shongweni, (11) Umhlatuzana, (12) Sibudu Cave, and (13) Border Cave. The inset shows the bathymetric model of the seafloor around Waterfall Bluff (red star) and seafloor features in the submerged environment. The dashed line represents a prominent paleoshoreline terrace between the mid and outer shelves at −60 meters. Submarine canyons from paleoriver channels (unnamed) are labeled “A.” The modern river systems that are associated with these canyon heads that impinge on the continental shelf are: (14) Mzimvubu; (15) Nkodusweni; (16) Mzimpunzi; (17) Mbotyi; (18) Mkozi Rivers; (19) Mkweni and Tezana Rivers; (20) Mtentu; (21) Kuboboyi; (22) Vunga and (23) Zotsha. Remnant paleocoastlines are labeled “B.” (For interpretation of the references to color in this figure legend, the reader is referred to the web version of this article.)
The large changes in southern African coastlines have made it practically impossible to conduct detailed studies about how hunter-gatherers utilized coastal zones during glacial periods or across glacial-interglacial boundaries, and how these people coped with ecological variability at these times. The bulk of coastal hunter-gatherer research focuses either on interglacial periods of the Pleistocene and the Holocene (e.g., Hendey and Volman, Reference Hendey and Volman1986; van Andel, Reference van Andel1989; Parkington, Reference Parkington2001, Reference Parkington2003, Reference Parkington2006, Reference Parkington2012; Jerardino, Reference Jerardino2016a) or short-term sea-level transgressions during glacial phases (Marean et al., Reference Marean, Bar-Matthews, Bernatchez, Fisher, Goldberg, Herries and Jacobs2007). However, Fisher and colleagues (Reference Fisher, Albert, Botha, Cawthra, Esteban, Harris and Jacobs2013) hypothesized that areas with coastal caves situated adjacent to narrow continental shelves may preserve long-term and continuous records of coastal foraging, including from glacial periods. This is because narrow continental shelves would limit coastline movements so that archaeological sites found on the contemporary coastline would have been within daily or monthly coastal foraging ranges throughout glacial maxima (Fisher et al., Reference Fisher, Bar-Matthews, Jerardino and Marean2010). One place of particular interest is the Pondoland region (Eastern Cape Province) on South Africa's eastern seaboard where the continental shelf is ~8 km wide. In this region, there are coastal caves incised into bedrock, numerous freshwater sources, and endemic and ancient vegetation, which make the Pondoland coastline an ideal candidate for intensive research on hunter-gatherer coastal occupation and foraging.
Here, we report on recent excavations at the site of Waterfall Bluff (formerly, A2SE-1) in eastern Pondoland where direct evidence of recurrent coastal foraging and fishing has been discovered in deposits dating to late Marine Isotope Stage (MIS) 3 (ca. 39 ka–29 ka), MIS 2 (ca. 29–14 ka), the Early Holocene (11.7–8 ka), and the Middle Holocene (ca. 8 to 5 ka). The dating of this archaeological sequence derives from 5 single-grain optically stimulated luminescence (OSL) ages and 51 accelerator mass spectrometry (AMS) 14C ages, situating Waterfall Bluff among the best-dated sites of this time period in southern Africa. The MIS 2 deposits notably span the LGM (ca. 26.5–19 ka) and the last glacial/interglacial transition (LGIT: ca. 17 ka–11.7 ka) with no evident occupational or sedimentological hiatus. It is the first time that clear evidence of coastal occupation during a glacial maximum has been found in southern Africa. A companion study is providing further insights about local paleoclimatic and paleoenvironmental changes that would have directly influenced hunter-gatherer resource availability (Esteban et al. Reference Esteban, Bamford, Miller, Neumann, Schefuß, Zabel, Pargeter, Cawthra and Fisher2019). These records show varying but sustained moisture and presence of all major vegetation types found in the region today (e.g., forests, grasslands, etc.), suggesting habitable conditions and abundant resources to sustain hunter-gatherers from the end of the Pleistocene through to the Holocene. The records preserved at Waterfall Bluff, therefore, provide an unprecedented opportunity to study the role of coastal resources in hunter-gatherer diets and behavioral variability in a persistent coastal context across a glacial/interglacial cycle.
This paper describes the excavations, stratigraphic sequences, and chronology of Waterfall Bluff. It also provides a brief overview of key aspects of the marine foraging and fishing evidence, including our preliminary results from archaeomalacological, archaeoichthyofaunal, and lithic studies. These descriptions are a first step toward our long-term goal of understanding hunter-gatherer behavioral adaptations in coastal contexts across a glacial-interglacial boundary and how coastal foraging fit within the broader sphere of hunter-gatherer lifeways in southern Africa.
EASTERN PONDOLAND
Geology and geomorphology
The fragmentation of the supercontinent Gondwana commenced in the Early Cretaceous (ca. 136 Ma) as South America was sheared westward along the Falkland Agulhas Fracture Zone (Martin and Hartnady, Reference Martin and Hartnady1986; Eagles, Reference Eagles2007), creating the steep and deep shelf break on South Africa's eastern seaboard that is now only ~8 km wide. The unique morphology of the continental shelf plays an important role in Pondoland's climate and ecology, primarily by preventing the warm-water Agulhas Current from drifting too far from the coastline during the Pleistocene and Holocene (Winter and Martin, Reference Winter and Martin1990; Peeters et al., Reference Peeters, Acheson, Brummer, de Ruijter, Schneider, Ganssen, Ufkes and Kroon2004). The effect of the warm Agulhas Current today drives the convection of moist coastal air cells for coastal precipitation, delivering a source of fresh water to the region (Jury et al., Reference Jury, Valentine and Lutjeharms1993; Schumann et al., Reference Schumann, Cohen and Jury1995). It also influences marine habitats by stabilizing inshore water temperature, which supports intertidal shellfish and littoral fish communities. Paleoceanographic records show that the Agulhas Current may have been up to 4°C cooler during the LGM (Simon et al., Reference Simon, Arthur, Hall, Peeters, Loveday, Barker, Ziegler and Zahn2013; Simon et al., Reference Simon, Gong, Hall, Ziegler, Barker, Knorr, van der Meer, Kasper and Schouten2015a; Simon et al., Reference Simon, Ziegler, Bosmans, Barker, Reason and Hall2015b), but with little variability in the location or strength of the current (Purcell, Reference Purcell2014). These relatively cooler, but sustained, waters offshore Pondoland during the LGM would have continued to maintain suitable habitats for local shellfish communities, particularly those species that were harvested most frequently.
On land, the Pondoland coastline is dominated by various formations of sandstones, shales, and dolerites to the south with granites and gneisses to the north (Fig. 2). Most significant on this coast is a trapezoidal exposure of Late Devonian (385–359 Ma) Msikaba Formation sandstones (Kingsley and Marshall, Reference Kingsley and Marshall2009) that is ~70 km long × ~20 km wide. Inland lithologies beyond the coastal plain are made up of deposits of the Carboniferous to Triassic Karoo Supergroup, including bands of glacial tillites and diamictites of the Dwyka Group, Ecca Group shales, and mudstone and sandstones of the Beaufort Group. Drakensberg Group flood basalts cap the Great Escarpment, which lies ~150 km inland from the Pondoland Coast. Dolerite dykes and sills had penetrated the clastic deposits of the Karoo Supergroup at the time of extrusion of the Drakensberg Group lavas (Duncan et al., Reference Duncan, Hooper, Rehacek, Marsh and Duncan1997).

Figure 2. (color online) Low-altitude panorama of Waterfall Bluff looking westward. Taken with a DJI Mavic Pro, this image shows Waterfall Bluff, the rock shelter, and the surrounding cliffs and landscape. From left to right, the image pans from south to north, respectively.
The Msikaba sandstones are an important feature of this area because these rocks have supported the formation of coastal and riverine rock shelters, which were occupied by hunter-gatherers, and now protect fragile archaeological records, including shellfish and fish remains, that would be more susceptible to deterioration in open-air contexts. This, and the narrowness of the shelf, means that any archaeological site found on or near the modern coastline at Waterfall Bluff would have remained within daily or monthly coastal foraging ranges (5–10 km) throughout glacial maxima (Fisher et al., Reference Fisher, Bar-Matthews, Jerardino and Marean2010). Pondoland, therefore, is one of the few known places across the entire South African seaboard where one can justifiably expect to find continuous records of coastal foraging and fishing that have not, or only to a lesser degree, been influenced by coastline changes.
Pondoland climate and vegetation
Pondoland is part of the Indian Ocean Coastal Belt (IOCB) biome, a well-known center of biodiversity and plant endemism (Van Wyk, Reference Van Wyk, van der Maesen and van Medenbach1996; Mucina et al., Reference Mucina, Scott-Shaw, Rutherford, Camp, Matthews, Powrie, Hoare, Mucina and Rutherford2006). Contemporary rainfall in the region is predominantly during austral summer with precipitation reaching 1,120 mm/yr (Mucina et al., Reference Mucina, Scott-Shaw, Rutherford, Camp, Matthews, Powrie, Hoare, Mucina and Rutherford2006). Under summer rainfall conditions, the amount and character of rainfall in the IOCB is topographically dependent. The northern regions close to the coast have year-round rainfall, while rainfall seasonality increases inland. Today, our study area has one of the highest proportions of winter-rainfall among the coastal areas of the IOCB with up to 36.6% winter rainfall (Cawe, Reference Cawe1994; Mucina et al., Reference Mucina, Scott-Shaw, Rutherford, Camp, Matthews, Powrie, Hoare, Mucina and Rutherford2006).
The Pondoland landscape is characterized by elevated plateaus and deep gorges. The coarse-grained Msikaba Formation sandstones have shallow, leached, acidic sandy soils (Mucina et al., Reference Mucina, Scott-Shaw, Rutherford, Camp, Matthews, Powrie, Hoare, Mucina and Rutherford2006) that are dominated by sourveld grasslands (Pondoland-Ugu Sandstone Coastal Sourveld). Thicket vegetation (i.e., Eastern Valley Bushveld) is common in fire-resistant areas like riverine floodplains. Forests are found throughout the area and include tall, species-rich, and structurally diverse subtropical Scarp Forests at the coast, along cliffs, and in gorges; Southern Coastal Forests along the coastline that are dominated by Celtis africana and Sideroxylon inerme (milkwood tree); and Southern Mistbelt Forests further inland at altitudes between 850 and 1100 m above sea level (Mucina and Geldenhuys, Reference Mucina, Geldenhuys, Mucina and Rutherford2006) (see Fig. 2). The resilience of Scarp Forests and Afrotemperate Forests in the Eastern Cape Province and KwaZulu-Natal has made these habitats important ecosystems during glacial phases and, particularly, during the LGM (Lawes et al., Reference Lawes, Eeley, Findlay and Forbes2007; Esteban et al., Reference Esteban, Bamford, Miller, Neumann, Schefuß, Zabel, Pargeter, Cawthra and Fisher2019).
Prior archaeological research in eastern Pondoland
The ~100 km stretch of Eastern Cape coast between Port St. Johns in the South and the Mtamvuna River in the north preserves a rich archaeological record that dates back ca. 300 ka (Fisher et al., Reference Fisher, Albert, Botha, Cawthra, Esteban, Harris and Jacobs2013; Fisher, Reference Fisher2016). Yet almost nothing was known about Pondoland's pre–Iron Age archaeological record before the inception of our research project. Chubb and colleagues (Reference Chubb, King and Mogg1934) documented excavations at a local rock shelter in 1932, and Davies reported on undated surface lithic scatters from the broader Natal region, which he attributed to the Earlier Stone Age's “Sangoan” Industry (Davies, Reference Davies1976, Reference Davies1982). Kuman and colleagues briefly report on extensive surface exposures of handaxes and other large bifacial tools along northern Pondoland's Red Sands area at Xolobeni (Kuman and Clarke, Reference Kuman and Clarke2005). But apart from these preliminary reports, and the research by Feely and colleagues (Feely, Reference Feely1980, Reference Feely1985, Reference Feely1986; Granger et al., Reference Granger, Hall, McKenzie and Feely1985; Feely and Bell-Cross, Reference Feely and Bell-Cross2011) that focused on Iron Age occupations, there are no other published accounts about the pre–Iron Age prehistory from the area. What little is known comes from sites in the surrounding region—Sibudu Cave, Border Cave, Sehonghong, Strathlahan, and Umhlatuzana—yet each of these sites is at least 350 km away from eastern Pondoland and none are coastal (see Fig. 1).
Importantly, Pondoland and the broader Eastern Cape provides observations of some of southern Africa's only historically documented mountain and coastal hunter-gatherer groups. Historical reference to hunter-gatherer groups in the Eastern Cape mention ephemeral open-air hunting camps (Vinnicombe, Reference Vinnicombe1976:30). Historical records also suggest that some recent hunter-gatherer groups partook in short-term seasonal logistical forays from the nearby Maloti-Drakensberg Mountains into lowland areas of KwaZulu-Natal and the coastal lowlands of the Eastern Cape to hunt, acquire raw materials not available in the highlands, and engage in trade and stock theft from neighboring farmers (Wright, Reference Wright1971). For example, the widely used plant poisons derived from Acokanthera oblongifolia and Acokanthera oppositifolia, which were common to highland hunter-gatherer groups, are species not known to occur in the Lesotho highlands but are prevalent in the vegetation of the Eastern Cape and KwaZulu-Natal Provinces (Cable, Reference Cable1984). Acokanthera poisons are also made more toxic during the drier winter seasons, suggesting possible seasonal mobility between interior highland and coastal lowland regions (Schapera, Reference Schapera1923).
In Africa, ethnographic examples of logistical mobility—the movement of resources to consumers, sensu Binford (Reference Binford1980)—are rare, and Marean (Reference Marean2016) has argued that the African archaeological record is likely to comprise a “modern human hunter–gatherer adaptive system typified by high residential mobility.” However, logistical mobility may have been more widespread than can be inferred from existing ethnographic evidence, which has been derived mainly from resource-poor environments like the Kalahari that are poorly suited to the use of logistical mobility strategies. In the cross-section between the Lesotho escarpment and the Eastern Cape coastal forelands, the available ethnographic records of recent hunter-gatherers hints at complex seasonal mobility patterns, which may themselves reflect a pattern that existed earlier in the Holocene and even the late Pleistocene. The presence of a single marine shell bead (Nassarius kraussianus) derived from early LGM (23,800–24,400 cal yr BP) layer BAS at Sehonghong rock shelter in Lesotho, for example, as well as numerous marine shell beads from Indian Ocean contexts in Holocene deposits certainly support this inference (Mitchell, Reference Mitchell1996). These patterns are associated with seasonal food scarcities and the cyclical availability of resources. Few of Africa's other ethnographic archives describe hunter-gatherers living in such conditions. A more detailed examination of Pondoland's archaeological traces provides insight on a matter currently under-described in the ethnographic record.
The P5 Project
The Pondoland Paleoclimate, Paleoenvironment, Paleoecology, and Paleoanthropology Project (P5) is an interdisciplinary and international collaboration of researchers focused on understanding human adaptations to coastal environments. Early work in Pondoland by P5 focused on identifying and describing coastal archaeological records in rock shelters and open-air contexts. In 2011, P5 surveyed the Mkambati Game Reserve and the Msikaba and Lambasi areas of eastern Pondoland, documenting 20 rock shelters and 5 open-air sites, most having abundant marine mollusk shells, stone tools, and terrestrial faunal remains. These surveys provided the first modern archaeological inventory of coastal occupations in Pondoland, spanning the Early Stone Age to historic European shipwrecks. Full details of the survey and sites are provided in Fisher and colleagues (Reference Fisher, Albert, Botha, Cawthra, Esteban, Harris and Jacobs2013).
In 2015, P5 conducted test excavations at four previously documented open-air and rock-shelter sites within the study area (Fisher, Reference Fisher2016). One of these sites is a large, dry coastal rock shelter (~80 m × 20 m) located ~25 meters above mean sea level (amsl). Originally designated using its grid coordinates as Site A2SE-1 (i.e., the first site recorded within the SE sub-quadrant of survey grid square A2), the site is now generally referred to as “Waterfall Bluff,” and that name is used here (see Fisher et al., Reference Fisher, Albert, Botha, Cawthra, Esteban, Harris and Jacobs2013 for details about the survey grid). The test excavations at Waterfall Bluff revealed well-stratified archaeological deposits with abundant stone artifacts, shell, well-preserved bone, and macrobotanical remains. In 2016, P5 expanded the excavation at Waterfall Bluff to 4 m × 1 m (Fig. 3). These excavations revealed a well-preserved stratigraphic sequence that exhibits a north-south gradient of stratigraphic preservation from the dripline (poorer preservation) to more protected spaces of the shelter (better preservation) (Fig. 4). Continued excavations at Waterfall Bluff since 2018 have exposed a larger sample of lower deposits at the site confirming better preservation of stratigraphy further inside the rock shelter.

Figure 3. (color online) Planimetric map of Waterfall Bluff. This image shows a map of the site and excavation areas as well as key geomorphic features like the dripline and overhead cliff face. An inset showing the main excavation area is also provided, as is a cross section of the cliff face and rock shelter at A–A’. UTM 35S northing and easting coordinates in meters are provided along the north (vertical) and east (horizontal) axes.

Figure 4. The stratigraphic sequence from the main excavation area at Waterfall Bluff. This image shows the E321.5 profile (left), the N850.5 profile (center) and the E321 profile (right), which are adjacent and wrap around three-quarters of the main excavation area at Waterfall Bluff. At top is the color-corrected, high-resolution, georectified photomosaic of the sections that was created from >300 individual photographs. SubAggregate boundaries have been superimposed on this image, and the lower image shows the SubAggregates more clearly. A color key reference of the SubAggregates is provided below. The vertical axis represents orthometric height in meters, and the horizontal axis represents truncated UTM35S northing and easting coordinates. (For interpretation of the references to color in this figure legend, the reader is referred to the web version of this article.)
WATERFALL BLUFF
At Waterfall Bluff, the Mlambomkulu River terminates in a waterfall ~60 m high debouching into the Indian Ocean (see Fig. 2). The rock shelter is adjacent to the waterfall, faces SE, and its floor is currently ~24 m amsl. Wave-cut ledges near sea level are comparable to geomorphic features along the cliff face, and we hypothesize that incision by previous high sea levels was responsible for the formation of the rock shelter during past high-sea stands. The rock-shelter incision has followed less-resistant layers of trough cross-bedded primary structures composed of moderately sorted quartz sand within the Msikaba Formation sandstones. More resistant beds of tabular quartz arenites appear to have contained the upper and lower boundaries of the incision, which is a pattern seen at other rock shelters across the region (Fisher et al., Reference Fisher, Albert, Botha, Cawthra, Esteban, Harris and Jacobs2013).
Today, sedimentation within the rock shelter is low near the waterfall, and the bulk of archaeological deposits appear to be preserved within the main cavity of the shelter, >30 meters away. The modern surface of the rock shelter slopes ~10° toward the mouth where there is erosion along the modern dripline. Just beyond the dripline, the surface plunges into a steep and jagged vegetated talus slope to the rocky coastline below. Supplementary File 1 provides a 360° interactive panorama of the site and the surrounding location with annotations describing the dripline and deposits.
The rock shelter is adjacent to a narrow continental shelf that limits the range of coastline changes. A composite gridded map of the regional bathymetry has been compiled from multiple existing datasets, providing a detailed look at the seafloor surface around Waterfall Bluff (see Fig. 1). Data from the South African Navy hydrographic chart SAN 130 (Port St. Johns to Port Shepstone) were scanned, rectified, and digitized. Satellite altimetry data from the ETOPO1 1 arc-minute global relief model were also integrated into the model (Amante and Eakins, Reference Amante and Eakins2009). Single-beam echo-sounding data from the bathymetric map for southern Africa by Dingle and colleagues (Reference Dingle, Birch, Bremner, De Decker, Du Plessis, Engelbrecht and Fincham1987) were also compiled, as were archival data stored on the South African Council for Geoscience Marine Geoscience server. In total, 41,277 data points were digitized covering a depth range from 0 to 500 m below msl. Interpolation of the error-corrected XYZ points (latitude, longitude, and depth) into the digital elevation model using a kriging technique was done using Golden Software Surfer 8.
The bathymetric data presented here from the adjacent seafloor cover a depth range of −500 m to the shoreline. The data reveal a continuation of the sub-aerially exposed Pondoland coastal plain. Most broadly, outcropping of the Msikaba Formation sandstone on the inner- to mid-shelf has resulted in a lithologically influenced terrace that drops to the outer-shelf at an average depth of ~75 m. Outcrops of the Msikaba Formation terminate in the south against the Egosa fault on the coastal plain (Johnson and Karpeta, Reference Johnson and Karpeta1979) and in the marine environment; this corresponds to the northern boundary of an embayment in Mbotyi that reflects this distinct lithological change. Bathymetric texture in this embayment on the seafloor is indicative of sedimentary accumulation, which stands in contrast to the dominantly sediment-starved, current-swept shelf to the north and adjacent to Waterfall Bluff. This sedimentary accumulation in the south has been described by Flemming (Reference Flemming1981), who suggested deposition by a topographically controlled, northward-flowing, current gyre.
Mirroring the topography of the coastal plain, steep and deep paleoriver channels in the form of submarine canyons incise the continental shelf. These erosional canyons are oriented perpendicular to the present coastline and generally follow the offshore trajectories of modern rivers (see Fig. 1). Additionally, remnant deposits from Pleistocene sea-level changes are prevalent across the East Coast shoreline and continental shelf (Martin and Flemming, Reference Martin and Flemming1987; Cawthra et al., Reference Cawthra, Uken and Ovechkina2012; Bosman, Reference Bosman2013; Pretorius et al., Reference Pretorius, Green, Cooper, Hahn and Zabel2019), and these rocks consist of aeolianite and cemented beach deposits. Scattered remnants of submerged paleocoastlines that lie parallel to the modern shoreline and are limited in lateral extent are preserved in the area under consideration at depths between 30 and 50 m below msl.
Excavation methodology
The P5 excavation methodology is adapted from protocols developed by the South African Coast Paleoclimate, Paleoenvironment, Paleoecology, and Paleoanthropology (SACP4) project for 3D mapping and record keeping (Bernatchez and Marean, Reference Bernatchez and Marean2011; Oestmo and Marean, Reference Oestmo, Marean and Smith2014). In preparation for excavations, we established geodetic control at the site using a Topcon Hyper XT RTK Global Navigation Satellite System (GNSS) system to survey permanent control points in front of the rock shelter within the Universal Transverse Mercator (UTM) coordinate system (Zone 35S, World Geodetic System [WGS] 1984). GNSS static station measurements were recorded in 1-second intervals over 3 hours to account for ~100 km baseline lengths to the nearest TrigNet stations at Kokstad and Mthatha. Static station vectors were calculated to each TrigNet station using Carlson Survey GNSS 2016 software, and a least-squares adjustment was used to correct the rover data. Fixed L1 solutions with 100% ambiguity fixing was achieved for each point. The maximum 3D position of the mean dilution of precision (PDOP) was 2.2 with a mean PDOP of 1.8. Ellipsoidal WGS84 elevations were then converted to orthometric heights using SAGEOID10 (Chandler and Merry, Reference Chandler and Merry2010). We used these control points and a Topcon ES-105 reflectorless total station to traverse into the rock shelter and survey additional control points on the shelter walls. The control points inside the rock shelter now enable our total stations to be set up anywhere within the rock shelter and surrounding landscape and be tied into the global UTM system for precise and accurate digital measurements.
Using the UTM system, we have gridded Waterfall Bluff into 1-m squares where each square is named using the last three digits of the UTM Easting and Northing coordinate of the southwest (SW) corner of the square. Furthermore, excavations are conducted within 50 cm × 50 cm quadrants within each square, designated as SW, northwest (NW), northeast (NE), or SE. Therefore, N854E321SE refers to the SE quadrant within grid square N854E321, itself having SW corner coordinates Northing 6518854.0 and Easting 768321.0.
All excavations follow natural stratigraphy, and our tiered classification of the stratigraphy follows the methodology of Karkanas and colleagues (Reference Karkanas, Brown, Fisher, Jacobs and Marean2015). Accordingly, stratigraphic layers (i.e., “StratUnits”) represent anthropogenic and geogenic changes in sediments that are visible during excavations. StratUnits are grouped into larger “SubAggregates” (i.e., “SubAggs”), which represent identifiable and discrete anthropogenic, biogenic, or geologic events. A cluster of shell-rich deposits with interdigitated fine sterile layers, for example, may be classified as a SubAgg if it can be shown that these layers were deposited contemporaneously and under similar processes. SubAggs are then consolidated into “Stratigraphic Aggregates” (i.e., “StratAggs”), that are laterally continuous sediments across large areas. These sediment groups represent periods of specific formation processes throughout a site's life history. StratUnits are identified using an alphanumeric system. StratUnit WB16AC, for example, refers to the 29th StratUnit assigned at Waterfall Bluff during the 2016 field season (i.e., 26 StratUnits from A to Z, then cycling to AA, AB, AC, etc. for StratUnits 27 and so on). SubAggs are assigned proper names associated with the project. StratAggs are identified using an acronym indicating the broad characteristic of the sedimentological group, like SRCS, which means “Shell-Rich Clayey Sands.” Throughout this paper, we refer to all deposits and archaeological materials with reference to StratAggs and SubAggs, descriptions of which are provided in Table 1 and Figure 4.
Table 1: Table summarizing the SubAggregate stratigraphy at Waterfall Bluff. This table provides details about the stratigraphy at Waterfall Bluff in chrono-stratigraphic order whenever possible. Black bars are used to represent non-contiguous contacts for spatially isolated layers within the overall chrono-stratigraphic sequence. The 68.2% modeled radiocarbon boundary ages (see Table 2) and 1-sigma optically stimulated luminescence (OSL) results (Table 3) for SubAggs are provided as a reference when available.

Additionally, each StratUnit is assigned a unique “Lot Number,” which is a bulk tracking number. It is assigned to all artifacts, fauna, or features that are mapped and/or collected within a single quadrant of a single StratUnit. All 3D-plotted archaeological materials and fauna are further assigned unique Catalog Numbers (CN). References to specific artifacts or samples always include the Lot and CNs (e.g., CN123456, Lot 123), which identify the unique ID of every object but also constitute a direct link to full contextual information about the object's provenience in our Microsoft Access tabular records and in our 2D and 3D Geographic Information System databases.
All sediments removed during excavations are wet-sieved through nested 5-mm, 3-mm, and 1.5-mm screens before the remainder is dried and bagged individually using the Lot Number, StratUnit, and mesh size to identify the bag's provenience and contents. In the P5 laboratory at the East London Museum, these screened materials are sorted into different categories (e.g., shell, stone, fauna, etc.), and all identified screened materials are assigned their own CNs and placed into individual plastic bags.
Except for during our earliest test excavations, we plot all archaeological remains (including, but not limited to artifacts, charcoal, ochre, macro-plants, terrestrial and marine fauna, and shellfish) and samples for specialized analyses (e.g., geochronology, geochemistry, palynology, phytoliths, plant wax isotopes, and magnetic susceptibility) in 3D with a total station. We also collect sediment samples from each StratUnit—known as a “Bulk Sample”—for any additional analyses that might be found useful in the future. Every rock >5 cm found during excavations is also mapped, as is every StratUnit surface. At the end of excavations, we use a Nikon D300s and 35 mm f1.8 lens to create high resolution (~1 mm pixel resolution), color-corrected photomosaics of all stratigraphic profiles that are georectified in 3D. These methods are described in Fisher and colleagues (Reference Fisher, Akkaynak, Harris, Herries, Jacobs, Karkanas, Marean and McGrath2015), except that Imatest 5.1 is now used to color correct the imagery.
The site and surrounding cliffs have been mapped using a combination of total stations (Topcon ES-Series and Northwest NTS02S), RTK GNSS (Topcon Hyper XT and Carlson BrX5), and forward-facing georectified parallactic photography via a DJI Mavic 2 Pro and a Phantom 2 mounted with a GoPro Hero 3 + . These data, and the excavated point-plot data, have all been integrated into a high-resolution and photorealistic 3D Geographic Information Systems model using ArcGIS Pro 2.1.3, and to a lesser extent ESRI ArcGIS 10.6. The models allow our team to make detailed observations about the rock shelter, excavated archaeological deposits, cliffs, and surrounding coastal shelf to understand site formation processes and, ultimately, the context of the archaeological deposits.
Excavation history
Excavations began at Waterfall Bluff in 2015 with the excavation of two 50-×-50-cm test pits. One test pit (N844E335SW) was located in the southeastern part of the rock shelter whereas the other (N854E321NW) was located near the central/NW part of the rock shelter. Both excavations were located within the dripline and on the gently sloping surface that backs up against the rear of the site.
Quad N844E335SW reached a maximum depth of ~60 cm. Excavations here ended prematurely on account of time, but they revealed a well-stratified archaeological sequence. Observations of the east- and west-facing profiles within quad N844E335SW suggest that the contemporary 10° slope of the rock shelter surface may be due to erosion of deposits underlying modern overburden sediments (Fig. 5).
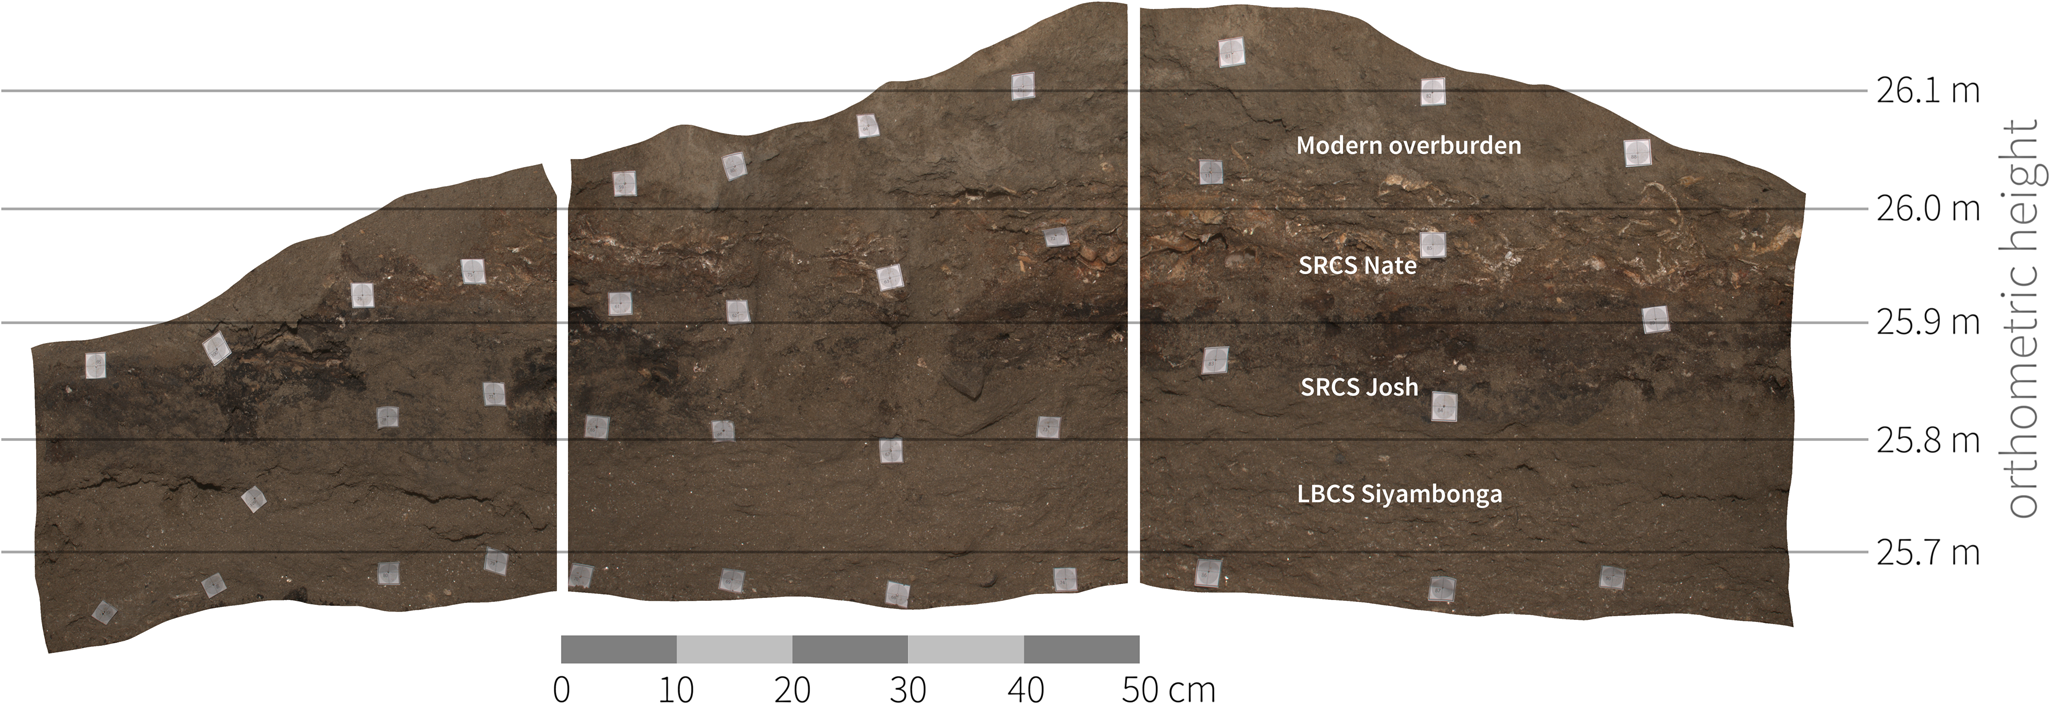
Figure 5. (color online) Stratigraphic profiles from quad N844E335SW. Quad N844E335SW is located in the southeast section of the rock shelter at Waterfall Bluff. The sequence shows a coarse sandy layer (Light Brown Coarse Sands [LBCS] Siyambonga) that is similar to other LBCS sediments elsewhere on site. Above this, the sedimentology is more clayey and reminiscent of the Shell-Rich Clayey Sands (SRCS). Two SRCS SubAggregates have been identified, charcoal-rich SRCS Josh and shell-rich SRCS Nate.
Quad N854E321NW, in the center of the shelter, reached a maximum depth of ~45 cm before reaching a large, flat stone surface that we now know to be a fallen block from the roof. In 2016, we expanded the excavations around quad N854E321NW and were able to excavate around the roof block and remove it, revealing more archaeological deposits underneath. The excavation area was also expanded laterally to 4.5 meters long × 0.5 meters wide on a north–south axis (see Fig. 4). The location of the 4.5-m-long trench was designed to intersect the dripline at the south end of the excavations (i.e., along the N850.5 line) and provide information on sedimentological and archaeological preservation in the shelter.
The deepest current excavation areas at Waterfall Bluff are located at the dripline in quad N850E321NW (see Fig. 4). Here, we excavated to ~80 cm below the modern shelter surface. These excavations revealed stratified archaeological layers and a major change in sediments representing two distinct StratAggs, which are described below. Bedrock has not yet been reached.
During the course of excavations, we uncovered a recent trash pit, ~80 cm wide × ~50 cm deep, that had been dug into archaeological deposits between N853 and N854 and that was partially burned in situ (see Fig. 3). Using a Cadbury Smash instant mashed potato wrapper found within the deposit, we were able to relatively date the trash pit to the mid–late 1970s. We opted to excavate the trash pit en masse, which exposed an ~1-m-wide pit that we continued to excavate to expose underlying in situ archaeological deposits.
In 2019, significant efforts were made to deepen the main excavation trench to collect a larger sample of archaeological materials from SRCS and Light Brown Coarse Sands (LBCS) contexts and to provide more information about the stratigraphy. These excavations have revealed a complex stratigraphic sequence, which shows evidence for not only vertical accretion of deposits, but also lateral accretion from the rear of the rock shelter toward the mouth. Stratigraphic preservation does, therefore, appear to increase within the confines of the shelter, and many SubAggs can now be traced across most of the excavated trench (see Fig. 4).
Stratigraphic sequence
We have subdivided the current excavated deposits into two StratAggs, named the LBCS and the SRCS. Currently, the deepest StratAgg is the LBCS. Figure 4 shows the primary stratigraphic profiles at the site as well as the locations of each SubAgg documented to date. Additionally, Table 1 summarizes the sedimentology and archaeology of each SubAgg and provides comments regarding how these layers are currently interpreted. A detailed micromorphological investigation is under way.
In general, the LBCS is characterized by loosely compacted moist coarse sands. Interspersed within these sands are darker deposits having relatively greater archaeological remains, ash, and charcoal. None of the deposits completely lack archaeological remains. This suggests that the site was never abandoned for prolonged periods of time during the LGM like sites in the surrounding highland and inland areas (Stewart and Mitchell, Reference Stewart and Mitchell2018). Instead, the changes in archaeological content across the LBCS may signal fluctuations in occupation intensity or differential use of the site over time, though aspects of duration or periodicity are currently unknown.
Multi-proxy evidence of marine shellfish and marine fish remains have now been recovered from multiple LBCS layers attesting to the proximity of the coastline during this time. At the dripline, this evidence ranges from microscopic to macroscopic. For example, scanning electron microscopy (SEM) and X-ray diffraction (XRD) have been used to identify microscopic traces of dissolved shellfish in LBCS Kuka representing mytilid mussel (probably the locally dominant Perna. perna) based on the microstructure of the shell (Fig. 6). Subsequent investigations have also revealed marine shell fragments and marine fish bone, which are relatively better preserved from LBCS layers found inside the rock shelter, though most of these materials remain under investigation and are not reported here.

Figure 6. Scanning electron microscopy (SEM) of shellfish. SEM nacre tablets present in sediment sample 315 Kuka (a–d). Images (c) and (d) show the nacre tablets formed as sheets, which match with the modern mussel (P. perna) samples (e, f) that highlight the interior aragonitic sheet nacreous microstructural layer. SEM images were taken with various settings due to a high occurrence of beam charging—seen in images (c) and (d)—despite sputter coatings of carbon and gold. (a) and (b) 10Kv backscatter electron detector. (c) and (d) 10kv secondary electron detector (SED). (e) 15Kv SED. (f) 20Kv SED.
Stratified above the LBCS, the SRCS is sedimentologically distinct, having a dark, clay-rich composition nearly lacking in roof spall. The SRCS stratigraphy is complex, and there are several instances where SRCS deposits have been truncated and modified by prehistoric site inhabitants contemporaneously with their formation. One of the clearest examples of this kind of site modification is found in SRCS Bonile, which was truncated between N853.5 and N854 soon after deposition to make room for the deposition of the SRCS Lwando midden (see Fig. 4). SRCS Lwando itself is composed of predominantly burnt shells, yet there is little evidence of in situ combustion features, which suggests the Lwando shells are in a secondary context and were dumped in the hole created from the removal of SRCS Bonile after they had been burned.
The same sequence of StratAggs is also seen in N844E335SW (see Fig. 5). The test excavation is ~15 meters SW of the main trench. The current lowest deposit is an undated roofspall-rich coarse-grain sand called LBCS Siyambonga. This deposit is overlain by loosely consolidated dark and organic-rich sands, which have been subdivided into two SubAggs, SRCS Josh (lower) and SRCS Nate (upper).
CHRONOLOGY
In this study, we have used a combined AMS radiocarbon (14C) and single-grain OSL dating approach. AMS radiocarbon dating was used to establish a chronology of anthropogenic materials found in the archaeological excavations, and OSL dating was used to establish a chronology for the sedimentary sequence exposed through excavation. The methods are complementary and provide unique insights into the depositional history (OSL) and archaeological occupations (AMS radiocarbon) at the site. The results can also be used to independently test the chronologies to identify factors that may be influencing results.
Chronology Methods
AMS 14C Dating Methods
Fifty-one AMS 14C samples have been dated from our catalog of piece-plotted wood charcoal. The proveniences of all samples are listed in Supplementary File 2. Charcoal wood identification of the samples is currently under way. Most of the charcoal was piece-plotted in situ and put into individual sterile plastic containers immediately upon discovery to limit contamination.
The initial radiocarbon analysis was conducted by Beta Analytic, Inc, and these samples are reported in Supplementary File 3. Using an acid-alkali-acid pretreatment procedure, these samples were first floated and agitated in deionized H2O to disperse the sediment. They were then progressively sieved through 250- and 180-μm-diameter sieves to remove any plant macrofossils or rootlet material prior to pretreatment. The <180 μm fraction was then subjected to a series of hot (near boiling) 0.5N HCl leaches to remove any carbonates before being immersed in an alkali wash (NaOH), which removed secondary organic acids. The samples were then rinsed with deionized H2O until neutral and dried in a 70°C oven overnight. The pretreated sample material was then homogenized and examined under a 45× microscope to inspect for any rootlet hairs or fragments. A portion of each sample was tested with 0.5N HCl again to ensure that all carbonate had been removed. The sample was then combusted to CO2 and graphitized for AMS counting.
P5 has subsequently partnered with iThemba Laboratory for Accelerator Based Sciences (iThemba LABS) to promote their AMS dating facility, which is currently the only one operating in Africa. Charcoal sub-samples measured at iThemba LABS were pre-treated with a standard acid-base-acid treatment: 1% HCl, 1% NaOH, and 1%HCl, respectively. Each treatment step was carried out for 45 minutes at 70°C. Sub-aliquots of the pre-treated sample were analyzed for δ13C at the stable isotope facility of the University of Pretoria.
For 14C analysis, the pre-treated charcoal samples were graphitized at the iThemba LABS graphitization line and then pressed as sputter target for AMS analysis. The AMS system at iThemba LABS is based on a 6MV EN tandem multi-sample Cs-sputter ion source (similar to the models used by Lawrence Livermore National Laboratory and PrimeLAB), a multi-beam switching system capable of fast cycling between isotopes (run at 5 cycles per second), and a modern AMS analysis beam-line supplied by NEC (Mbele et al., Reference Mbele, Mullins, Winkler and Woodborne2017). At the accelerator we use 13C for normalization, and δ13C correction is based on the conventional mass spectrometry measurements. Samples were normalized and blank corrected against graphitized samples of the OXII standard and our fossil coal blank material (the latter pre-treated with the same protocol as the charcoal), respectively. In a measurement run, up to 43 unknown samples are analyzed together with a set of at least 5 OXII standard samples for normalization. In addition, 6 blanks are routinely measured in every such run; however, a long-term averaged blank value and the corresponding long-term standard deviation is used for the correction. The samples in the ion source cycled through several times to check against possible long-term drifts. Together with fast-cycling and the use of “bad-cycle” rejection, we can thus eliminate both short-term and long-term conditions not conducive to high reproducibility. AMS data analysis follows the concepts put down by Puchegger and colleagues (Reference Puchegger, Rom and Steier2000).
Additionally, a previous set of charcoal samples that were measured by Beta Analytic, Inc. and that still had material available was subsequently measured at iThemba LABS. The results between the laboratories for these samples agree within error. A set of samples have also been run in duplicate at iThemba LABS to affirm overall sample pre-treatment and AMS inter-run reproducibility. The individual AMS radiocarbon results for iThemba LABS measurements and combined values for the charcoal samples are available in Supplementary File 3.
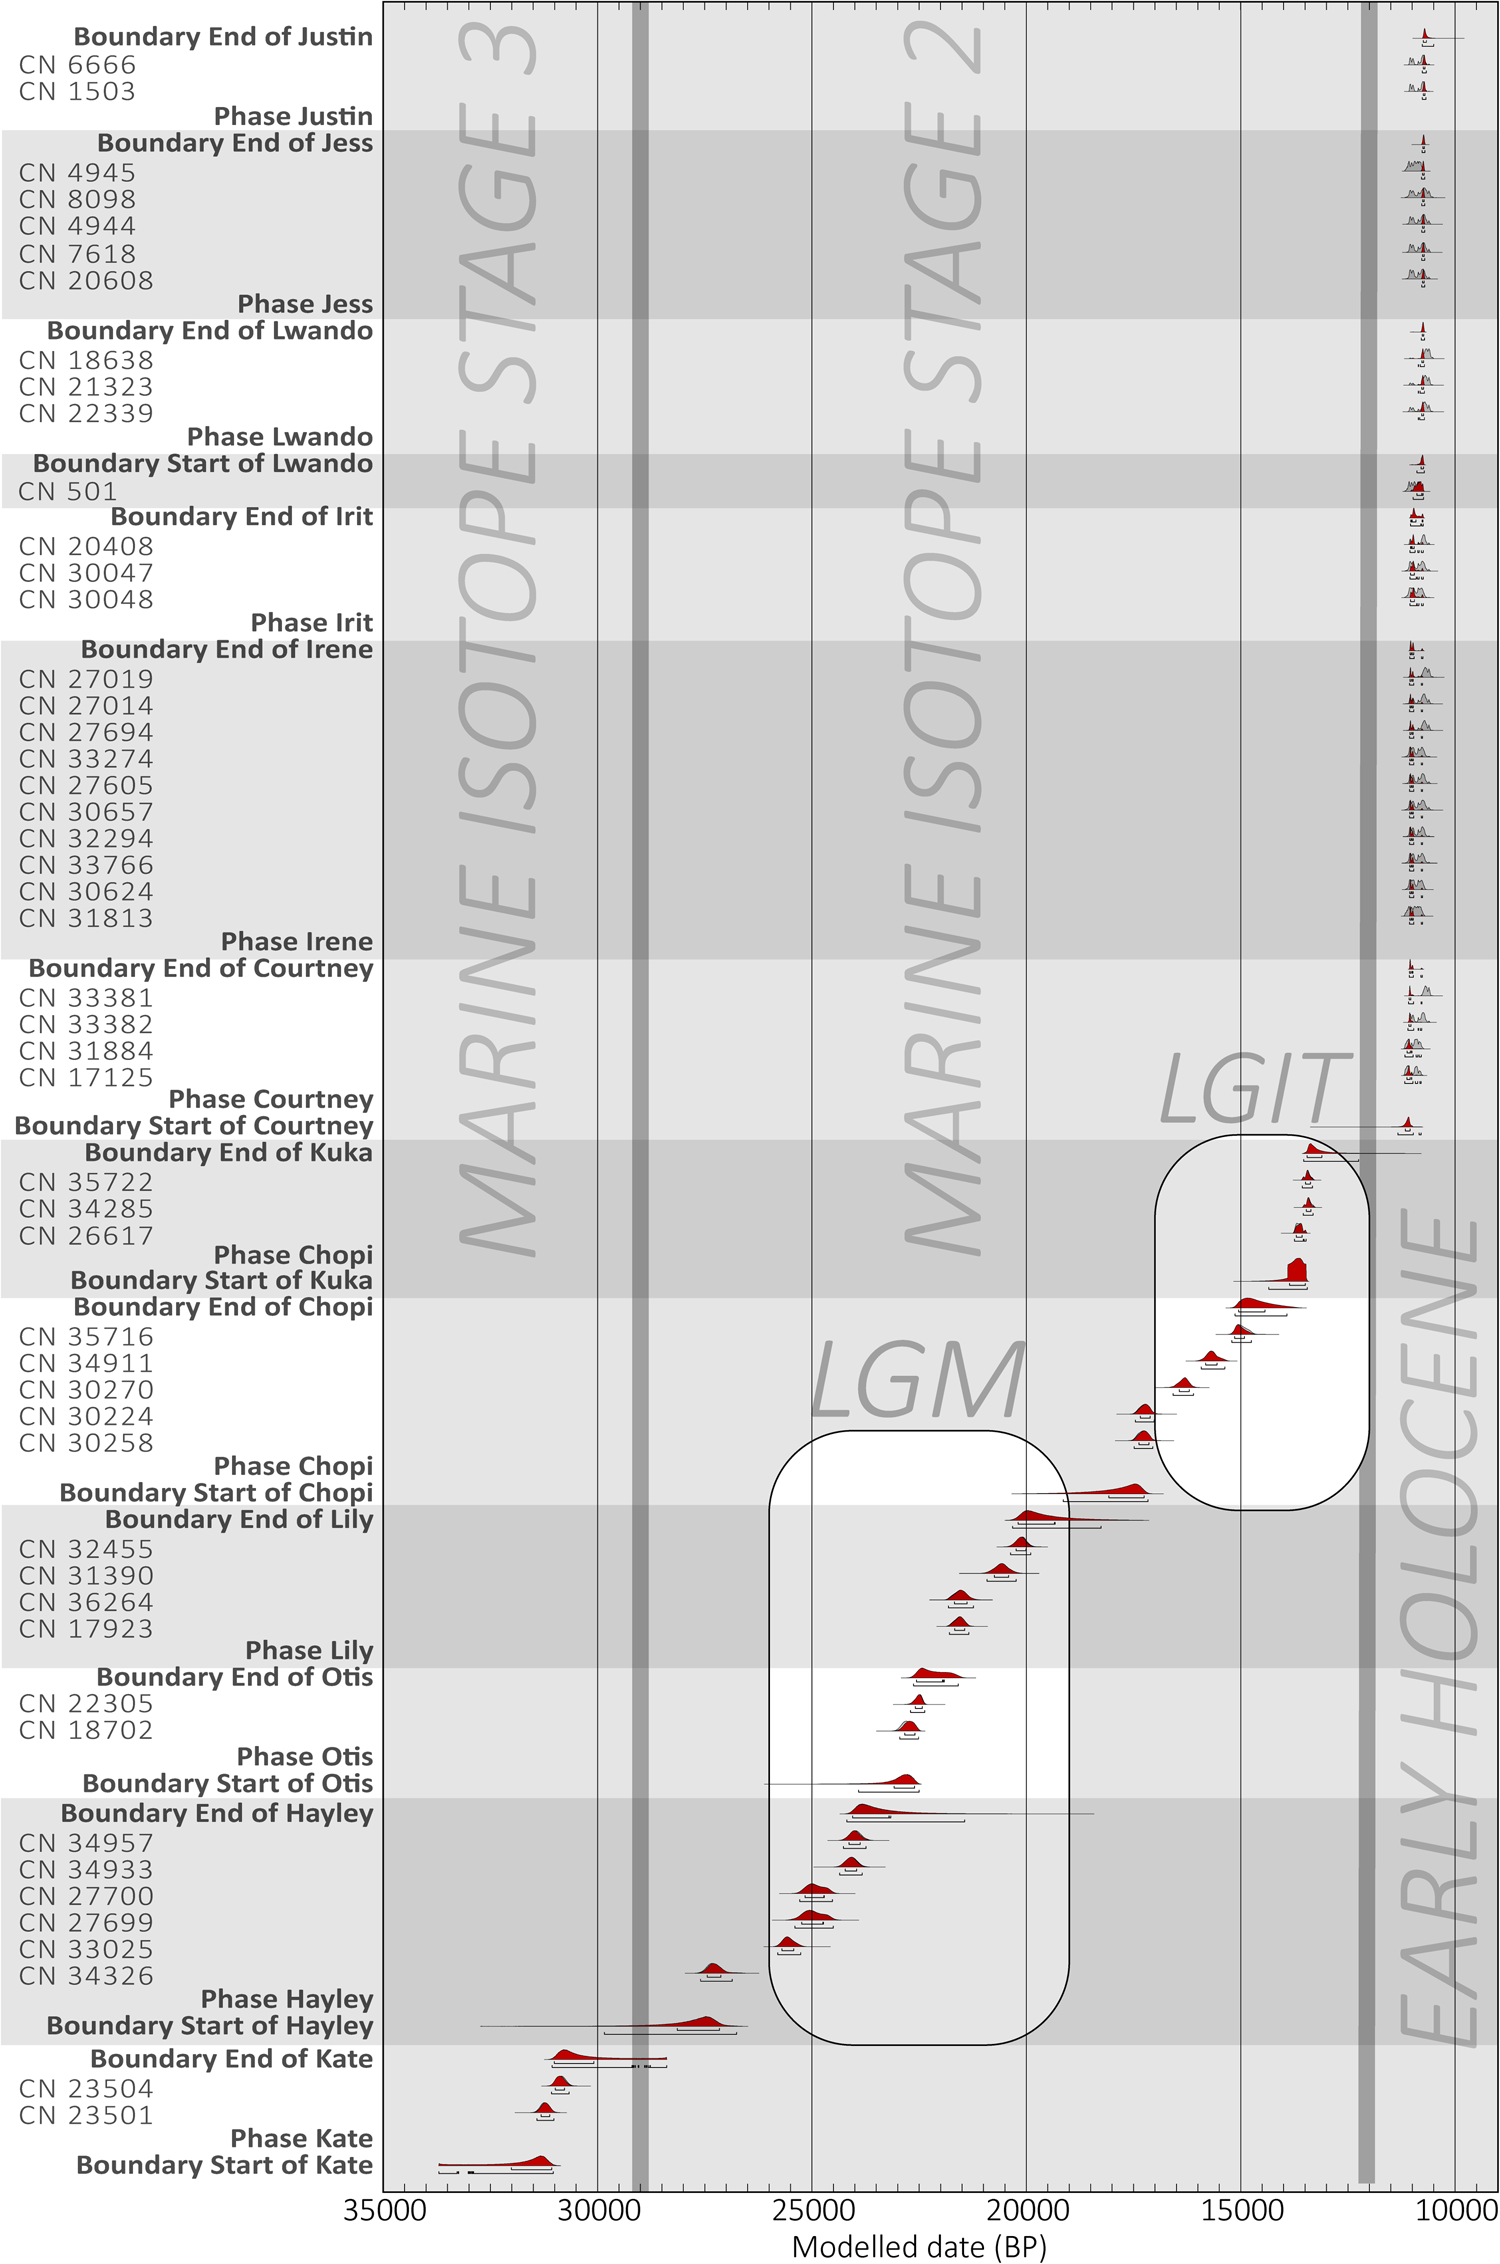
The Bayesian radiocarbon age model presented herein is based on 51 radiocarbon dates of charcoal samples for 13 SubAggs, using OxCal v4.3 (Ramsey, Reference Ramsey2009a). SHCal13 (Hogg et al., Reference Hogg, Hua, Blackwell, Niu, Buck, Guilderson and Heaton2016) was used for calibration. The model parameters are provided in Supplementary File 4. The raw data from the model are provided in Table 2. The ages that are used here to describe each SubAgg, including in Table 1, are based on data at the 68.2% confidence interval rounded to nearest decade between 10,000 and 25,000 BP; ages greater than 25,000 BP are rounded to the nearest half-century. This rounding prevents over-reporting of significant digits while ensuring that any shift thereby introduced stays below a sixth of the 68.2% range so as to be irrelevant. Lastly, Figure 7 provides a graphic illustration of the posterior density function and range and the unmodeled probability density function and range for each sample and SubAgg boundary at the 68.2% range.

Figure 7. Bayesian model results. This figure shows the results of a Markov Chain Monte Carlo analysis of the radiocarbon data from Waterfall Bluff at both 68.2% and 95.4% ranges. The samples are ordered in chrono-stratigraphic order. For all samples, the posterior density function and range are represented in red, and the unmodeled probability density function and range are represented in gray. The ranges of Marine Isotope Stage (MIS) 3, MIS 2, and the Early Holocene are demarcated with vertical gray bars, as are the last glacial maximum (LGM) and last glacial/interglacial transition (LGIT), showing which samples date to these time periods. Overall, the chronological sequence shows persistent occupation of the rock shelter from Late MIS 3 to the Early Holocene, including during the LGM and LGIT. (For interpretation of the references to color in this figure legend, the reader is referred to the web version of this article.)
Table 2. AMS 14C Bayesian Analysis Results. This table provides the unmodeled and modeled results of a Markov Chain Monte Carlo analysis of the radiocarbon data from Waterfall Bluff at both 68.2% and 95.4% ranges. The SHCAL13 calibration curve (Hogg et al., Reference Hogg, Hua, Blackwell, Niu, Buck, Guilderson and Heaton2016) was used. Results >25,000 BP were rounded to the nearest 50 years, and results between 10,000 and 25,000 years were rounded to the nearest 10 years to prevent over-reporting of significant digits.

Based on the species analysis for the charcoal (ongoing and not presented here) we anticipate no significant old-wood effect. The SubAggs LBCS Kate and LBCS Hayley are modeled as potentially overlapping, and currently we do not have a radiocarbon date for LBCS Colton. The current excavated limits of LBCS Hayley do not overlap with LBCS Otis; therefore, it cannot provide a constraint on LBCS Otis or vice versa (see Fig. 4).
We have a sequence of deposition from LBCS Otis to SRCS Justin. The choice of contiguous boundary conditions from SRCS Courtney through to SRCS Justin is partly informed by the fact that any attempt to make them sequential (potentially allowing for a gap of deposition) does not yield any clearly evident gaps in deposition—all of them are consistent with 0 on both the 95.4% and 68.2% confidence intervals and are certainly below the resolution of radiocarbon measurements themselves. The sequential or contiguous boundary conditions elsewhere are informed by the evidence from the interfaces between the SubAggs. Specifically, we assume sequential boundary conditions between SRCS Courtney–LBCS Kuka, LBCS Kuka–LBCS Chopi, and LBCS Chopi–LBCS Lily, but contiguous boundary conditions between LBCS Lily and LBCS Otis. Of all the potential gaps in this specific sequence, only the one between LBCS Chopi and LBCS Lily could be considered substantially evident, but there is evidence to suggest this may be due to sampling strategy.
Modelling of the SubAggs within SRCS also proved problematic as the calibration curve intersects 3 times over a 500-year period for all SRCS results. Potentially small deviations, therefore, could have significant consequences around that time period and tip the whole set of SubAggs to the older or younger side of the wiggle. Four samples from this period show low agreement for the model; however, removing them did not have a significant impact on the modelling result, and they are therefore included. Furthermore, OxCal runs using a simple outlier model (Ramsey, Reference Ramsey2009b) also did not conclusively suggest elimination. Thus, there is good indication that SRCS Courtney is on the older side while SRCS Lwando, Jess, and Justin are highly likely to be on the younger side, but the exact transition from SRCS Lwando to SRCS Courtney is highly uncertain and made difficult by SRCS Bonile having only one radiocarbon result.
OSL Dating Methods
OSL dating provides an estimate of the amount of time elapsed since mineral grains were last exposed to sufficient sunlight (Huntley et al., Reference Huntley, Godfrey-Smith and Thewalt1985; Aitken, Reference Aitken1998; Duller, Reference Duller2004; Wintle, Reference Wintle, Holland and Turekian2014; Roberts et al., Reference Roberts, Jacobs, Li, Jankowski, Cunningham and Rosenfeld2015). This method can be used to determine the depositional age of sediments and, by association, the age of material remains at archaeological sites. Four sediment samples were collected from the LBCS deposits, and one was collected from the transition between LBCS and SRCS. Sand-sized quartz grains were extracted using standard sample preparation procedures (Wintle, Reference Wintle1997; Aitken, Reference Aitken1998). Equivalent dose (De) values were estimated for single grains using the single aliquot regenerative-dose procedure (Galbraith et al., Reference Galbraith, Roberts, Laslett, Yoshida and Olley1999; Murray and Wintle, Reference Murray and Wintle2000). Details about sample preparation, equipment, measurement, and data analysis procedures are provided in Supplementary File 5. Grains with aberrant OSL properties were rejected from final De determination (Jacobs et al., Reference Jacobs, Wintle, Roberts and Duller2008), following the rejection criteria outlined in Supplementary Table S5-2. Environmental dose rates were calculated as the sum of the external beta, gamma, and cosmic-ray dose rates and a small alpha dose-rate contribution from inside the mineral grains.
The accepted De values for individual grains from each sample are displayed on radial plots in Supplemental Figure S5-3. If the individual values are consistent with statistical expectations, then 95% of the points should scatter within a band ± 2 units wide, projecting from the “standardized estimate” axis on the left to any chosen De value on the radial axis to the right (Galbraith et al., Reference Galbraith, Roberts, Laslett, Yoshida and Olley1999). It is apparent from the plots for each sample that the De estimates are spread widely and do not fall within a single band of ± 2 units. This spread is also indicated in the De overdispersion (OD) values (Table 3), which range from 37 ± 3% (CN311) to 50 ± 6% (CN312), and are much greater than the 14 ± 4% OD value obtained for sample CN308 under controlled laboratory conditions in a dose recovery test (Supplemental Fig. S5-2). Two types of De distributions were observed for the Waterfall Bluff samples. The first type (sample CN311) shows a broad distribution that is scattered around a central value (Supplemental Fig. S5-3a). For this sample, we used the central age model (CAM) (Galbraith et al., Reference Galbraith, Roberts, Laslett, Yoshida and Olley1999) to obtain a best-estimate final De value for age determination. The CAM takes into account the OD; the greater the OD, the larger the associated uncertainty on De. The second type (samples CN308, CN309, and CN312) also shows a broad distribution, but with a number of additional characteristics.
Table 3. Final environmental dose rate results, De values, and optically stimulated luminescence (OSL) ages for Waterfall Bluff samples. De and OSL age results using the 3-parameter minimum age model (MAM) (Galbraith et al., Reference Galbraith, Roberts, Laslett, Yoshida and Olley1999) are given in addition to the central age model (CAM) (Galbraith et al., Reference Galbraith, Roberts, Laslett, Yoshida and Olley1999) for samples CN308, CN309, CN310, and CN312. MAM OSL age determinations for these samples are currently assumed to be most representative of sample burial age but require further investigation.
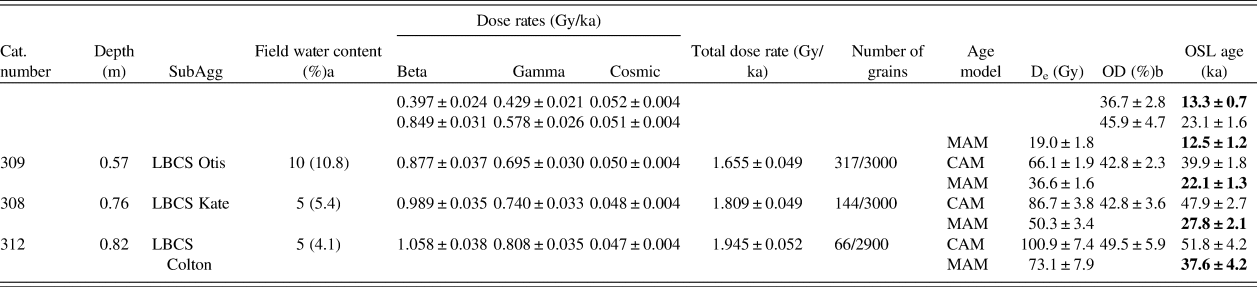
a Estimated water content over period of burial of sample. Current measured field water content value given in brackets.
b Overdispersion (OD) values calculated using the CAM.
First, some grains have much higher than expected De values (up to ~225 Gy). These high De values form part of a distribution of De values that is truncated at the upper end of the distribution (Supplemental Fig. S5-3c–e), excluding grains saturated with respect to dose (criteria 7 and 8 in Supplementary Table S5-2) from which no De value could be calculated. This means that the calculated OD values are minimum values only, and that the true spread in De values is greater than that observed in the radial plots.
Second, these samples also show no evidence for the presence of discrete De components. Instead, these samples have continuous De distributions that can be interpreted as evidence for either substantial bioturbation of sediments or partial bleaching of sediment, including the liberation of grains from roof spall. Sample CN310 has “transitional” De characteristics between these two types of distributions. For samples CN313, CN310, CN309, and CN308, further work on understanding site formation and sediment context at the microscopic level is required to make an informative interpretation of the De distributions and to help choose an appropriate age model for final De determination. In the absence of this information, we calculated both the CAM De value and a minimum De value, using the 3-parameter minimum age model (MAM) of Galbraith and colleagues (Reference Galbraith, Roberts, Laslett, Yoshida and Olley1999) for each of these samples (Table 3).
We calculated the beta and gamma dose rates for each of the samples using two different approaches. In one approach, we converted concentrations of U, Th, and K obtained from inductively coupled plasma mass spectrometry (ICP-MS) or optical emission spectroscopy (ICP-OES) to beta and gamma dose rates. In the other approach, we directly measured the beta dose rates using GM-25-5 beta counting (GMBC; Bøtter-Jensen and Mejdahl, Reference Bøtter-Jensen and Mejdahl1988) and calculated the gamma dose rate from U and Th obtained through thick source alpha counting (TSAC) and K from a combination of GMBC and TSAC. Both approaches gave statistically consistent beta and gamma dose rates (average beta dose rate ratio = 0.97 ± 0.05 and average gamma dose rate ratio = 1.02 ± 0.04; Supplementary Tables S5-5, S5-6). For final age determination, we used the dose rate values derived from ICP-MS/ICP-OES (Table 3). There is a significant difference between the dose rates obtained for the samples from the shell- and clay-rich StratAgg SRCS (SubAgg Courtney) and the underlying LBCS sediments.
The final De values, environmental dose rates, and OSL ages for all five samples are listed in Table 3. To obtain an age for each sample, the model-derived De value was divided by the total environmental dose rate. For samples CN308, CN309, CN310, and CN312, the CAM De values result in significant overestimation of age when compared to AMS 14C ages. For these samples, the MAM De values instead gave ages that are in better agreement with those obtained by AMS 14C dating, suggesting that the sediment may have been partially bleached prior to deposition and burial. We caution that we need further information about the sedimentary context and site formation to be confident in the OSL ages for these sediments. Uncertainties on reported ages are given at the 1-sigma level.
Chronology results
OSL dating (Table 3) and Bayesian 14C (see Table 2) modeled results are summarized below. The minimum age of sediment deposition for the currently deepest excavated deposits at Waterfall Bluff (LBCS Colton) have been OSL dated to 37.6 ± 4.2 ka (CN312). Bayesian 14C model results for the start of overlying LBCS Kate range from 32,000 and 31,050 cal yr BP and end between 31,000 and 30,100 cal yr BP. These boundary age estimates are consistent with the minimum age of sediment deposition for LBCS Kate, OSL dated to 27.8 ± 2.1 ka (CN308). Currently, no samples have been dated from LBCS Ollie, which directly overlays LBCS Kate. However, the next most recent deposit chronologically is LBCS Hayley, which has a lower Bayesian 14C model boundary result from 28,150 to 27,150 cal yr BP and an upper boundary from 24,050 to 23,160 cal yr BP.
Stratigraphically above LBCS Ollie is LBCS Otis. Bayesian 14C model results of the start of LBCS Otis range from 23,080 to 22,610 cal yr BP and end between 22,560 and 21,910 cal yr BP. These results are within the error range of the minimum age of sediment deposition for LBCS Otis, OSL dated to 22.1 ± 1.3 ka (CN309).
Bayesian 14C model results for LBCS Lily, which overlays LBCS Otis, range from 22,560 to 21,910 cal yr BP and end between 20,190 and 19,330 cal yr BP. LBCS Chopi deposits are not laterally extensive but do overlay LBCS Lily. Bayesian 14C model results for LBCS Chopi range from 18,080 to 17,250 cal BP and end between 15,050 and 14,440 cal yr BP.
LBCS Kuka shares a lower boundary with LBCS Lily, LBCS Chopi, and LBCS Hayley deposits, underscoring the complex and spatially discrete distribution of the stratigraphy across the site. LBCS Kuka is also the uppermost SubAgg of the LBCS, and its upper boundary marks the transition to SRCS where it shares a boundary primarily with LBCS Courtney, but also SRCS Irene. Bayesian 14C model results for LBCS Kuka interpret the lower boundary to date from 14,070 to 13,570 cal yr BP and the upper boundary from 13,520 to 12,830 cal yr BP. This is consistent with the minimum age of sediment deposition given by CN310, OSL dated to 12.5 ± 1.2 ka.
SubAgg Courtney is the stratigraphically deepest layer of the SRCS. Bayesian 14C model results date the lower SRCS Courtney boundary from 11,160 to 11,050 cal yr BP and the upper boundary between 11,060 and 10,990 cal yr BP. The OSL age of sample CN311 is slightly older than these results at 13.3 ± 0.7 ka, a minor discrepancy that can be attributed to an increased potential for underestimation in beta dose rate calculations (and thus OSL age overestimation), caused by the shell-rich deposit (Cunningham, Reference Cunningham2016).
Bayesian 14C model results for overlying SRCS layers have been calculated (in chronostratigraphic order) for SRCS Irene, Irit, Bonile, Lwando, Jess, and Justin. From SRCS Courtney to SRCS Justin, the Bayesian 14C model results calculate that these deposits formed in less than 450 years.
A later SRCS sequence dating to the Middle Holocene has been discovered in N844E335SW. AMS 14C dates from SRCS Josh and SRCS Nate have been dated to 8,395–8,203 cal yr BP and 8,288–8,025 cal yr BP, respectively. Since the relationship between these deposits and those in the main excavation area remain unknown, they were not used in the Bayesian model.
ARCHAEOLOGICAL MATERIAL
To date, more than 25,000 individual artifacts, bone, ochre, and other archaeological remains have been plotted in 3D using total stations. These data provide detailed information on the spatio-temporal distribution of anthropogenic behaviors at the site. Here, we provide short summaries of the stone artifacts, anthropogenically modified bone and shell, marine shell, marine vertebrates, and fish remains with the intention of publishing more detailed descriptions about these assemblages, and the terrestrial fauna, once the analyses are completed.
Lithics
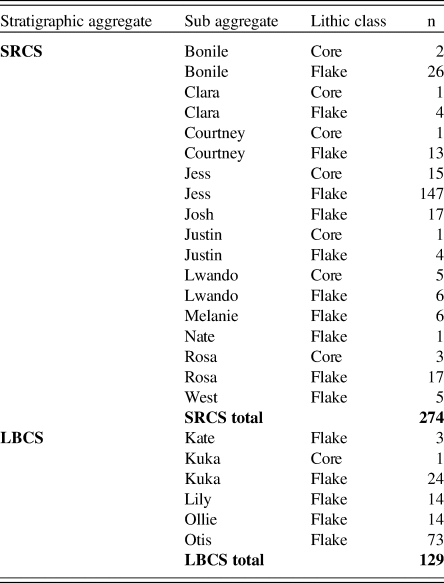
In total, 403 lithics have been analyzed from the LBCS and SRCS to date. These data draw primarily on plotted cores and flakes, omitting plotted flakes <5 mm in size and all sieved materials. The results provided here, therefore, should be considered preliminary given this limited sample and the absence of fine-mesh-sieved materials in the current analysis. We used a standardized attribute-based framework focused on variables to clarify strategies in raw material selection, reduction strategies, and techniques. The variables also help clarify two important aspects of lithic technology—the organization of technology and the size and shape of flakes. The LBCS sample comes predominantly from SubAggs Kuka, Lily, and Otis, while the SRCS sample draws largely from Bonile, Courtney, Jess, and Rosa. Table 4 summarizes the lithic data by class and raw material within both the LBCS and SRCS. Table 5 summarizes the proportions of cores versus flakes within the analyzed SubAggs. We have yet to analyze lithics from the deepest excavated deposits in LBCS Colton.
Table 4. Summary of Shell-Rich Clayey Sands (SRCS) and Light Brown Coarse Sands (LBCS) lithics. Counts and percentages of different lithic types and their raw materials within the two stratigraphic aggregates at Waterfall Bluff.

Table 5. Cores and Flakes in SRCS and LBCS. Distribution of cores and flakes with SubAggregates in the SRCS and LBCS.
Hornfels is the dominant raw material used for lithic production in both LBCS (93.7%) and SRCS (85.7%) contexts, with chert, quartz, dolerite, and sandstone of minor importance. The relatively high frequency of retouched implements in both the LBCS (13.2%) and SRCS (12.4%) are made on hornfels. Cortex on the LBCS flakes is more angular (66.7%, n = 34) than rounded (33.3%, n = 17) compared to the SRCS where rounded cortex predominates (70.4%, n = 133) over angular cortex (29.6%, n = 56). Cortex retention is also greater on SRCS cores and flakes. Cores themselves comprise only a minor component of each assemblage; the LBCS member contains a single quartz bipolar core (Fig. 8a). Most of the SRCS cores (78%) are platform cores made on flat water-worn hornfels cobbles, flakes, and small (< 50 mm in maximum dimension) water-worn pebbles (Fig. 9a–d). The remaining 21% of SRCS cores was reduced using a bidirectional bipolar (hammer and anvil) strategy. Notably, one SRCS core was broken along the lateral edge and then flaked longitudinally along the broken edge to create elongated flakes and to refresh the edge for tasks that left the tool's edge marginally modified (see Fig. 8d). Additionally, the single LBCS core shows signs of platform-on-anvil technique (i.e., a freehand platform area opposed by a crushed distal core margin) specifically to produce elongated flakes (see Fig. 8a).
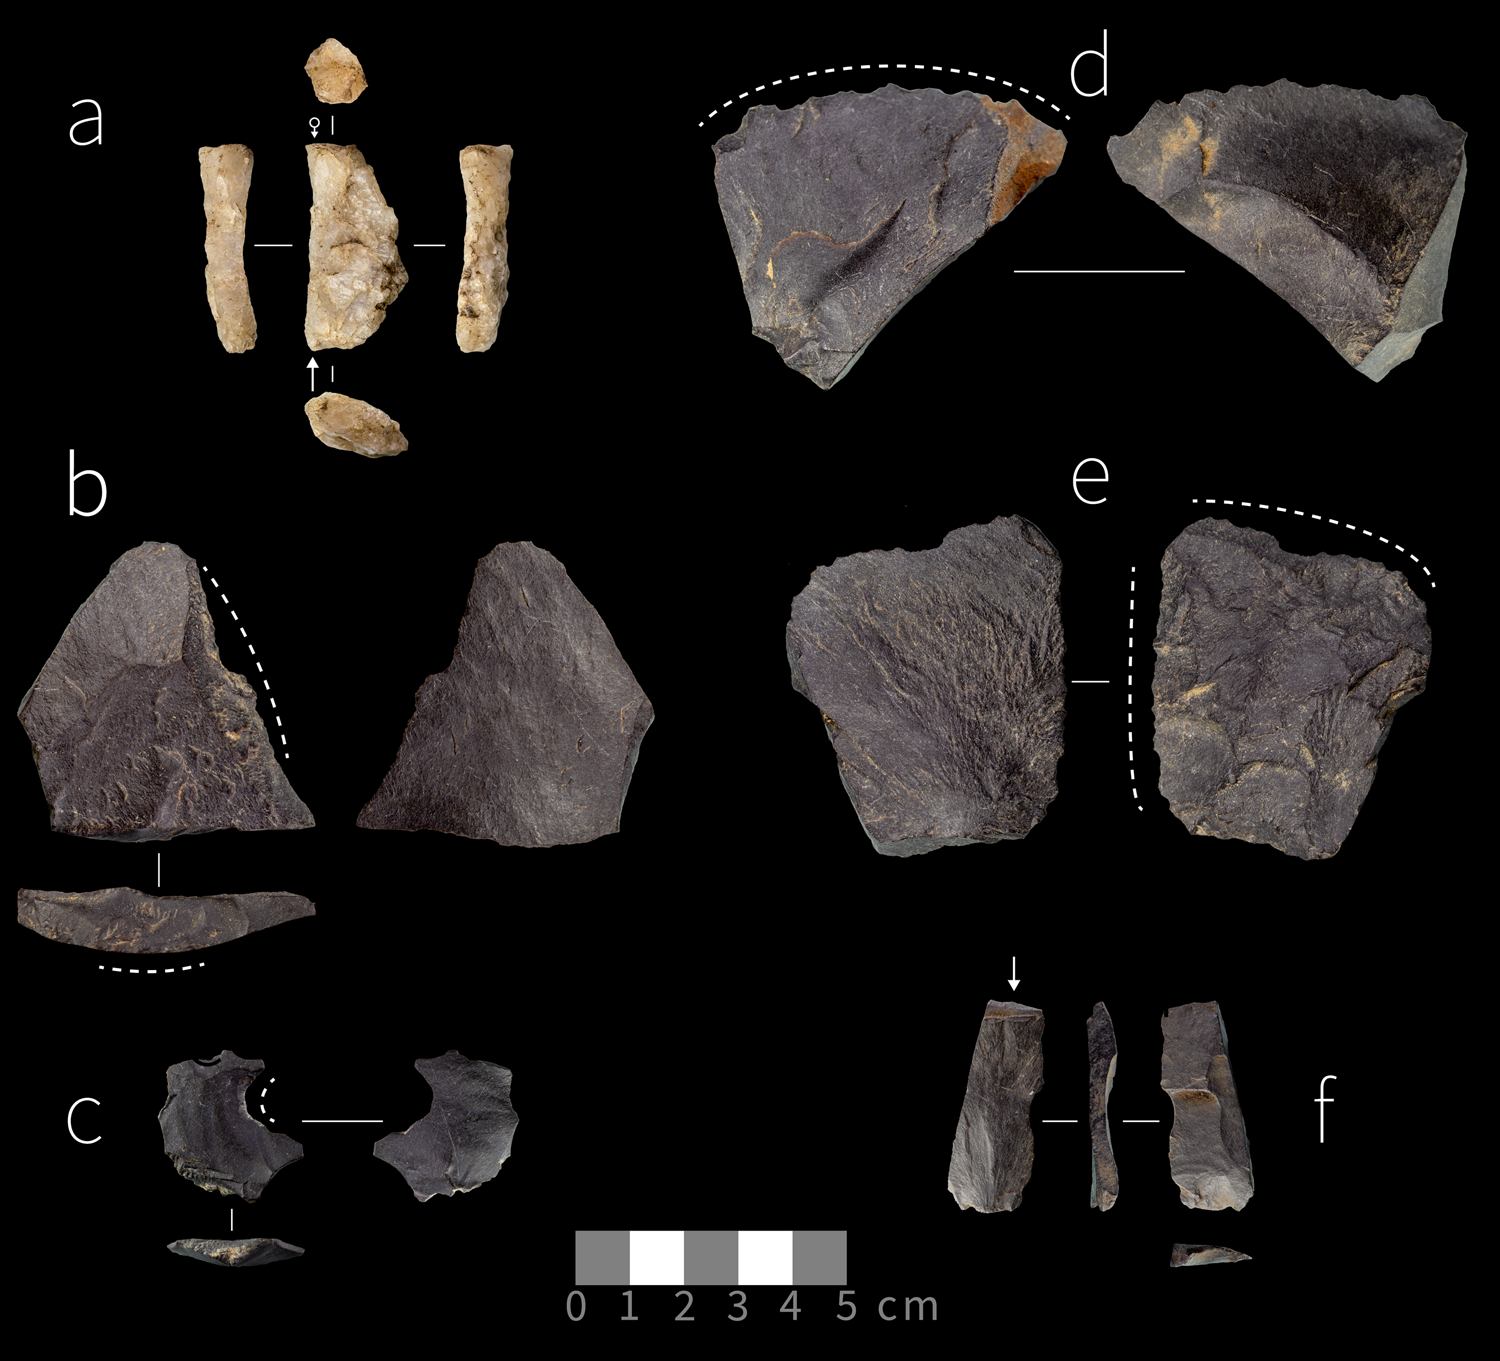
Figure 8. (color online) Sample of stone artifacts from LBCS. (a) anvil-supported bladelet core; (b) bipolar split flake with wear on the split surface; (c–e) notched flakes; (f) blade with bending fracture denoted by arrow. (a) made on quartz and (b–f) made on hornfels.
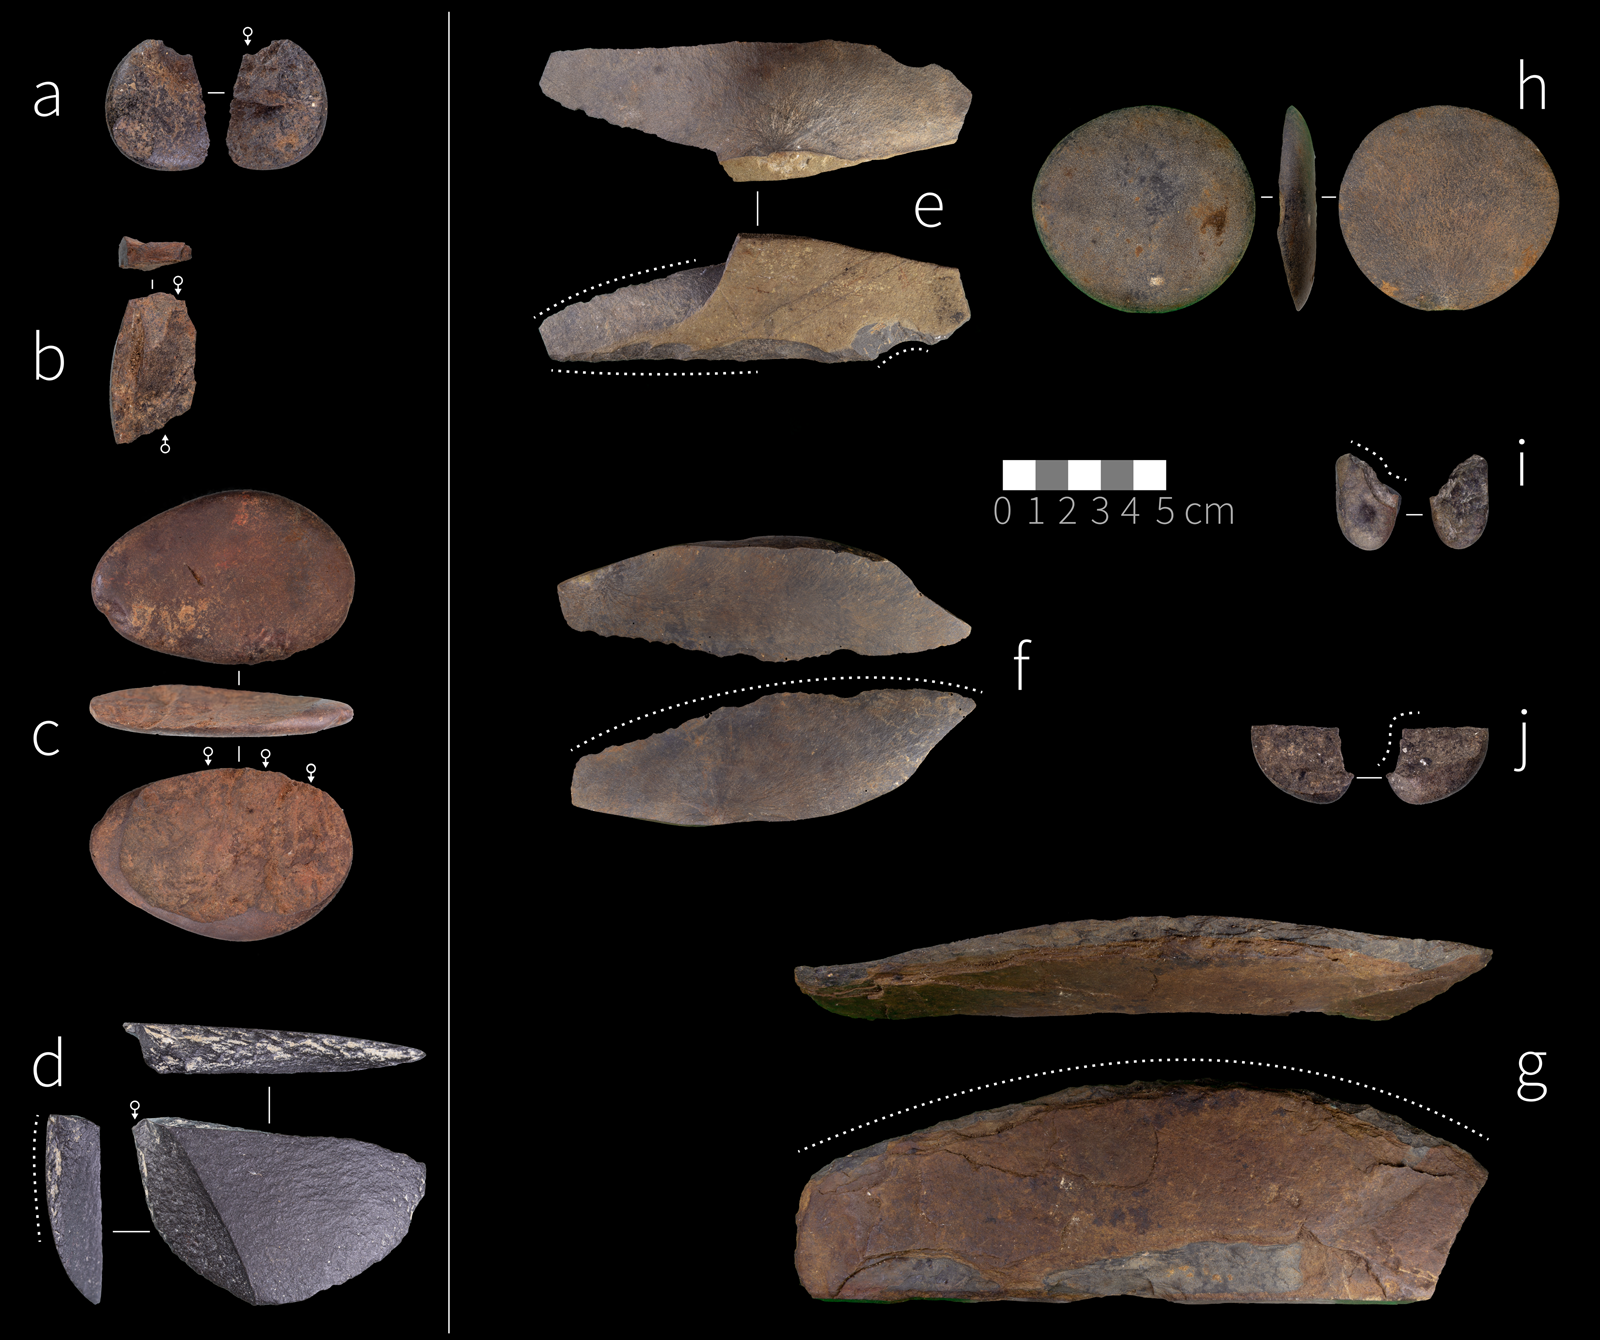
Figure 9. (color online) Sample of stone artifacts from the Shell-Rich Clayey Sands. (a) bipolar core on water-worn pebble; (b) platform core on thin water-worn pebble; (c) bipolar core on nodule; (d) core on flake with retouched edge; (e–g) naturally backed knifes; (h) large flake on cobble; (i, j) small retouched water-worn cobbles. All lithics were made on hornfels.
Flakes make up the majority of the lithic assemblages for both LBCS and SRCS. Comparisons of the SRCS and LBCS flake size (length and width) and elongation (length/width) show significantly larger and less elongated (i.e., wide and side-struck) flakes in the SRCS and smaller, more elongated flakes in the LBCS (F[1] = 15.22, p < 0.01; omega squared = 0.08). Several flakes in both the SRCS and LBCS assemblages show signs of bipolar damage (sheared bulbs of percussion and severe crushing) in their platform regions. The retouched tool frequencies are relatively high and similar between the LBCS and SRCS members. Scrapers and notched tools make up the majority of the formal tool inventory in both StratAggs. Scrapers are predominantly side and end forms, although this pattern is most common in the SRCS member with ~28% side, 21% end, and 8% double (side and end) scrapers (see Fig. 9e–g). Scraper retouch is also steeper and more invasive in the SRCS member compared to the LBCS member, where edges show shallower scarring. Only one backed tool was found in the LBCS assemblage. Additionally, at least one of the LBCS flakes shows clear evidence of a step-terminating bending fracture at its distal end suggesting use in tasks with a high degree of bending tension (see Fig. 8f).
Worked Bone
Bone is overall well preserved, but it varies in both LBCS and SRCS deposits based on proximity to the dripline where preservation is lower and sediments are largely de-calcified. Inside the dripline, bone and shell preservation rapidly improves and includes materials not limited to bone or teeth. For example, three preserved feathers have been recovered from SRCS Jess and SRCS Bonile.
A number of worked bone implements were shaped via cutting and abrasion (Fig. 10). Of particular interest is CN20667 (Lot 382) from SRCS Rosa (see Fig 10a). The implement is 25 mm long, but it is broken. One side has been abraded and cut to a conical point. Opposite the point at the thickest part of the tool are two parallel cuts that created an incision and stepped profile. The size and shape of the bone fragment is reminiscent of biconical fish gorges found in Holocene deposits elsewhere on South Africa's south coast (Bradfield, Reference Bradfield2019). Association of this piece with fishing technology, however, remains tentative.

Figure 10. (color online) Sample of modified bone implements. (a) CN20667 (Lot 382; Shell-Rich Clayey Sands [SRCS] Rosa), possibly fish gorge; (b) CN25758 (Lot 336; Light Brown Coarse Sands [LBCS] Kate) broken and facetted distal humerus of a rock hyrax (Procavia capensis); (c) CN7500 (Lot 228; SRCS Jess) bifacial bone point; (d) CN7499 (Lot 228; SRCS Jess) abraded bone point.
CN25758 (Lot 336) is from LBCS Kate (see Fig. 10b). It is a distal humerus of a rock hyrax (Procavia capensis) (S. Badenhorst, personal communication) that has been broken and facetted to create a bipointed keel on the shaft. Additionally, numerous beads have been found in SRCS Bonile and SRCS Josh that include 32 perforated tick shells (Nassarius kraussianus), perforated brown mussel shells (Perna perna), and one ostrich eggshell bead (Struthio camelus; CN26816, Lot 117; Fig. 11).
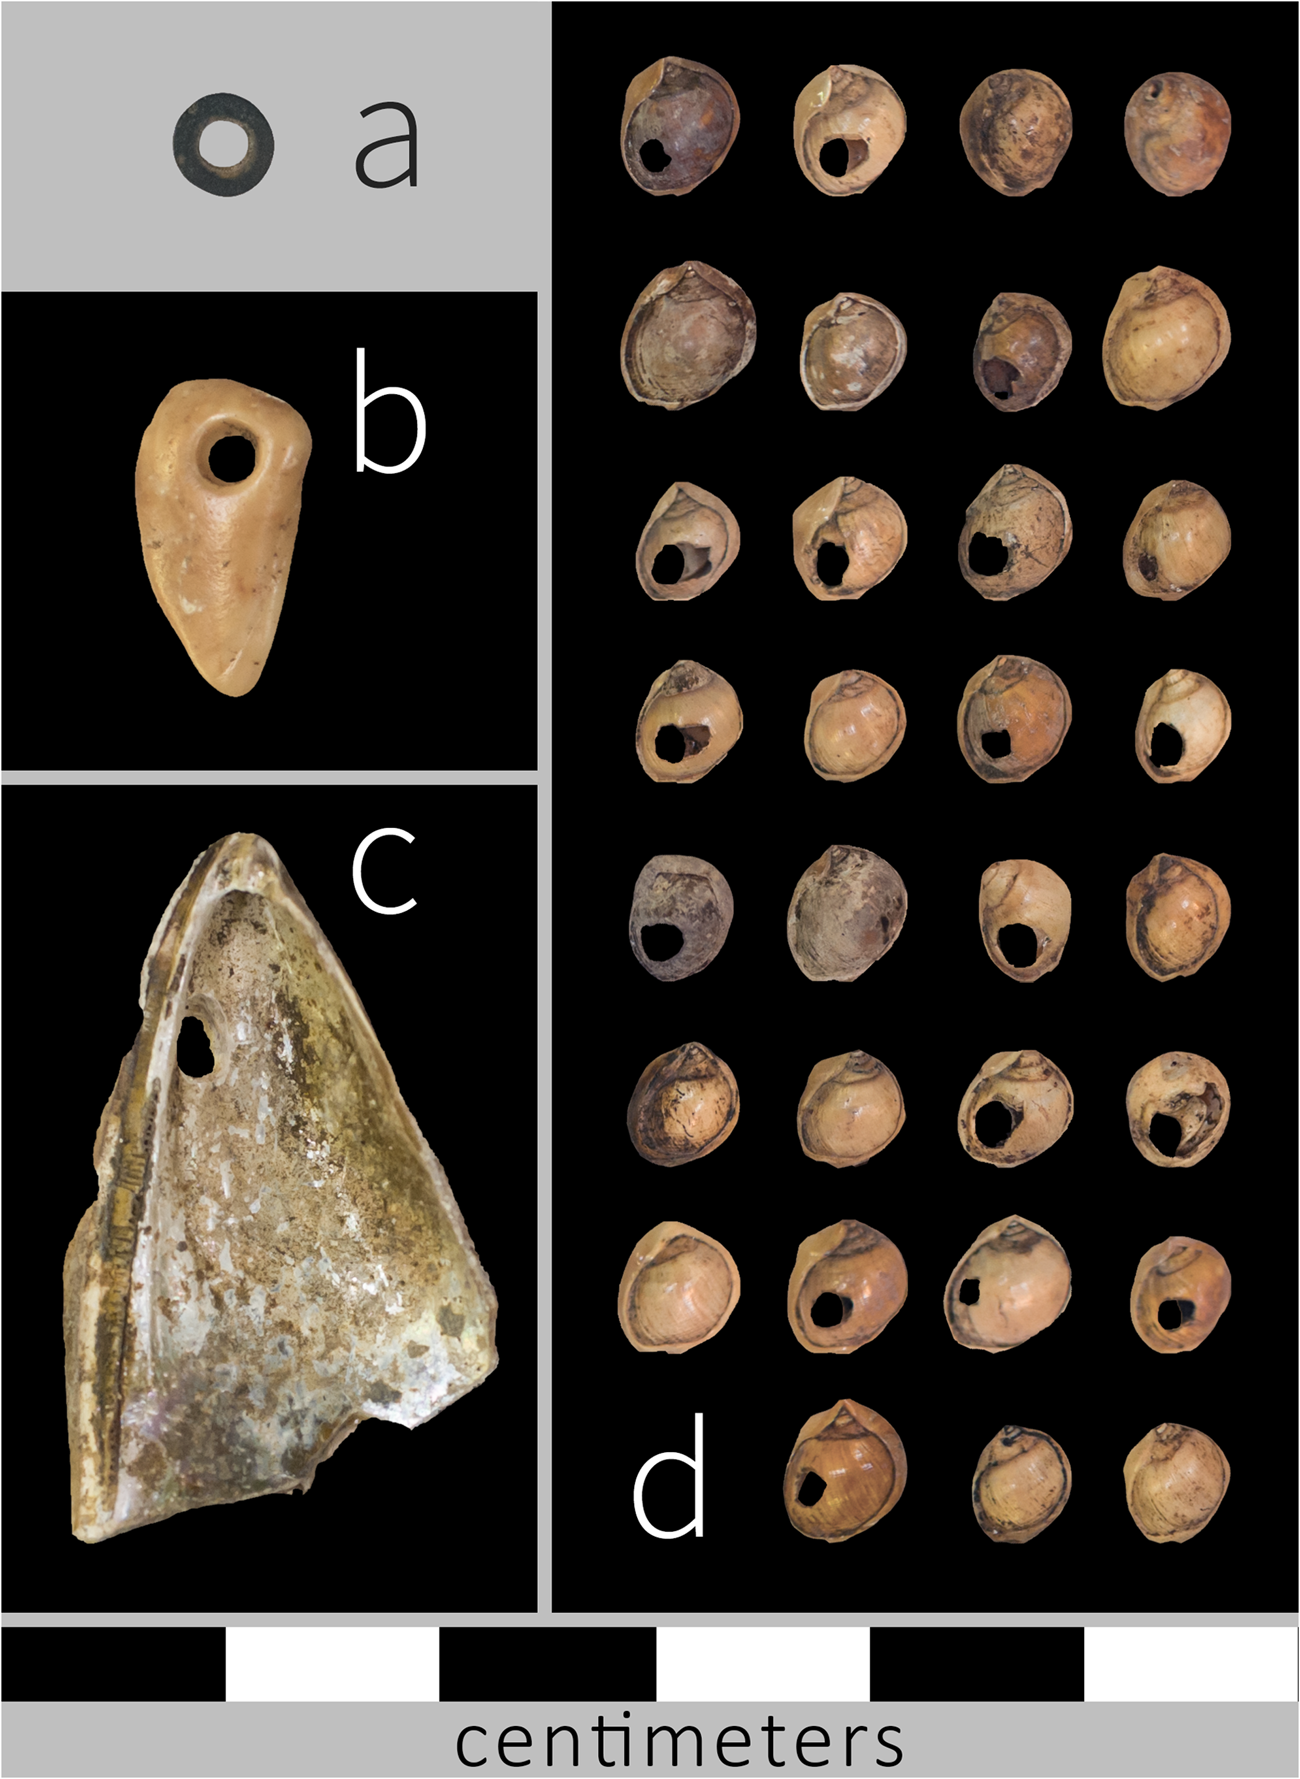
Figure 11. (color online) Perforated shells and beads from the Shell-Rich Clayey Sands (SRCS). (a) ostrich eggshell bead (Struthio camelus; CN26816, Lot 117, SRCS Josh); (b) perforated shell (Perna perna; CN26817; Lot 116, SRCS Bonile); (c) perforated shell (Perna perna; CN26818; Lot 116, SRCS Bonile); (d) perforated tick shells (Nassarius kraussianus; Lot 116, SRCS Bonile). The scale is the same for all objects in the figure.
Archaeomalacology
Archaeomalacological methods
Whenever possible, marine shell remains have been identified to genus or species level (Kilburn and Rippey, Reference Kilburn and Rippey1982; Ridgway, Reference Ridgway1998; Branch et al., Reference Branch, Griffiths, Branch and Beckley2010), from which minimum number of individuals (MNI) and weights were established. For bivalves, the highest number of either left or right hinges was used to determine the MNI. For limpets, and most whelks and winkles, the number of apices was used to determine the MNI (Jerardino, Reference Jerardino1997). In a few instances, MNI = 1 was established for a given species when no countable shell parts were encountered but taxonomically identifiable fragments were found. Each plotted shell fragment, whether countable or not, was weighed separately with a precision scale (0.01 g). Number of identified specimens or fragments (NISP) was also established.
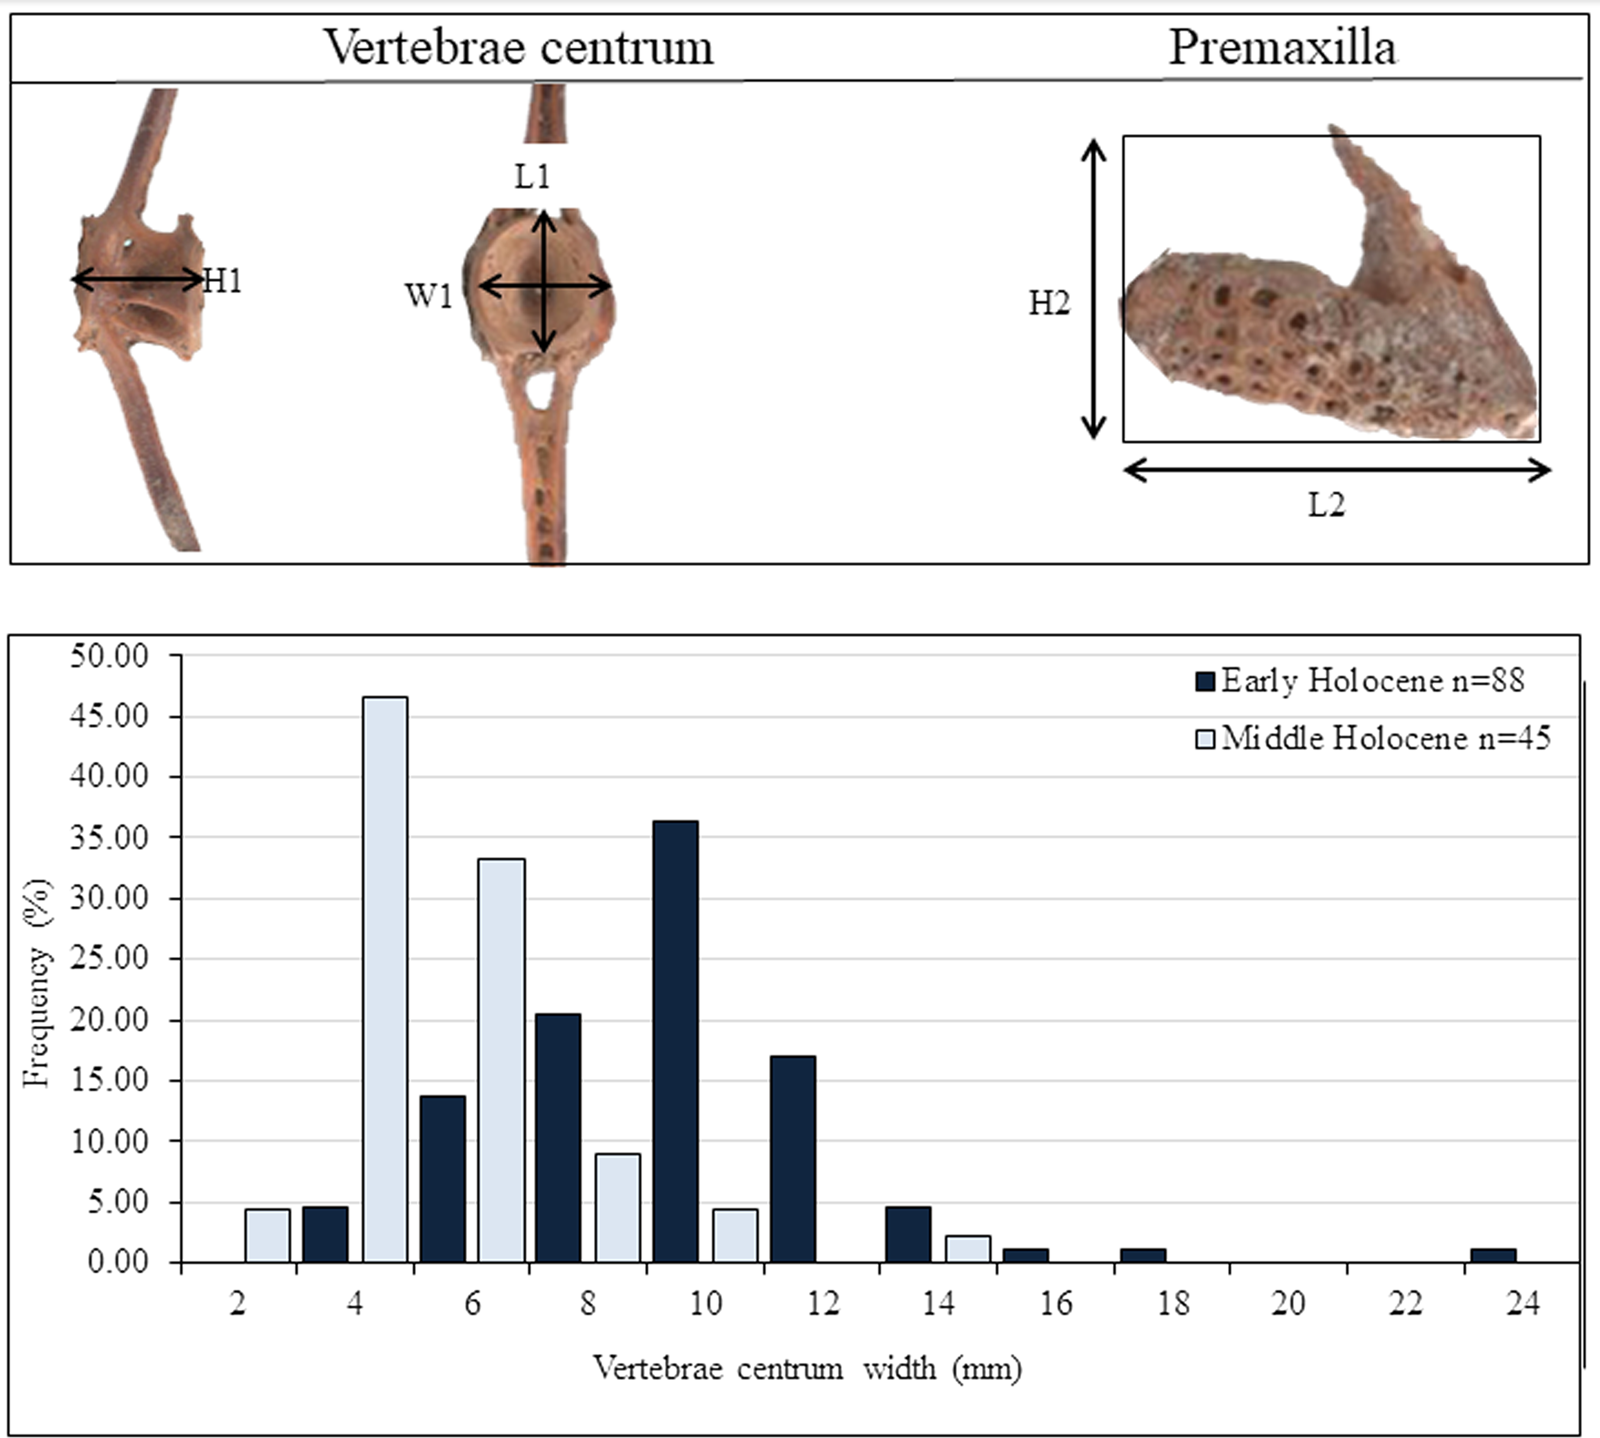
Maximum shell lengths and widths were derived from brown mussels (Perna perna) where these were preserved. Shell limpet length and widths, plus others that can render full-length sizes via morphometric equations, were also obtained from limpet shells wherever possible (see, Jerardino and Navarro, Reference Jerardino and Navarro2008). Water-worn shells were also quantified and measured, and the species of origin was determined whenever possible. Preservation status of marine shell was further established via more qualitative evaluation of the degree of chalkiness or burning.
Archaeomalacological preservation
LBCS shells (all analyzed SubAggs) show considerable fragmentation as evidenced by a high frequency of mussel fragments lacking hinges and having flat surfaces (Fig. 12). The majority of the shell currently recovered is from the 10-mm-sieve fraction. The deepest LBCS deposits are currently located at the dripline where there is visible evidence of decalcification. In one instance shellfish has been identified at a microscopic level using SEM and XRD. The sample, which was from LBCS Kuka, contained fragmented pieces of shell with clear nacre tablets, and XRD results showed high levels of calcite and aragonite, indicating recrystallized mussel shell (see Fig. 6).

Figure 12. (color online) Examples of Light Brown Coarse Sands (LBCS) shell remains. Assorted mussel and limpet shell remains from LBCS. (A) LBCS Ollie, Lot 320; (B) LBCS Kate, Lot 330; (C) LBCS Colton, Lot 342.
Quantitatively, by dividing the total weight of each stratigraphic unit by the number of specimens (fragments and the few whole shells), SRCS Bonile is relatively less fragmented (3.7 g/specimen), followed by West (2.6), Courtney and Rosa (2.1, each), Jess upper (1.5), and Jess lower (1.4). Despite being the least fragmented among the studied SubAggs, shells from SRCS Bonile appear noticeably more burned than shells from any other SRCS SubAgg studied in this analysis, with the exception of SRCS Lwando (which was not studied). Quantitatively, 37.5% of the shell fragments from SRCS Bonile are burnt compared to <14.5% of shell fragments from the rest of the SRCS stratigraphic units. The label “burnt” refers to any visible exposure to heat, which is revealed in the change of color and/or luster of shells. For example, sometimes a shell outer surface may not become discolored but will lose its shine or gloss, while the inner surface can sometimes become beige or slightly grey in color. The green gloss that is so characteristic of brown mussels is also often lost or lessened as a result of heat exposure.
Another unique quality of the SRCS Bonile shells is that they appear to be preserving macrobotanical remains. During excavations, numerous whole and fragmentary leaves and grass stems were found adhering to the insides of mussel shells. In these cases, shells were often oriented with the cup of the shell facing downward, and so we currently believe that the shells not only shielded the macrobotanical remains but may be creating unique microenvironments that inhibit deterioration of the plant tissues (e.g., Jerardino and Navarro, Reference Jerardino and Navarro2008).
SRCS Courtney specimens are powdery (chalky) and crumbly to different degrees yet appear unburnt. It is possible that the partial loss of the shell mineralogical structure in Courtney obscures the fact that they could have also been exposed to heat as in stratum Bonile. Additionally, marine shell remains from SRCS Jess were often chalky due to decomposition of the mineralogical shell structure and brittle compared to shell found in other SRCS SubAggs. The highly fragmented nature of the shell in SRCS Jess is also evidenced by a high frequency of mussel fragments lacking hinges and showing the greatest relative levels of fragmentation. Many fragments also had flat surfaces. This pattern is consistent with higher fragmentation rates due to longer exposure of shells on the site's surface and/or compression of the deposits (Jerardino, Reference Jerardino, Giovas and LeFebvre2018).
Archaeomalacological observations
Sample sizes and percentages of marine shell species in terms of MNI and weights for SRCS samples are shown in Table 6. Sample sizes are rather small for meaningful calculations of percentages, with only two stratigraphic units in SRCS represented by numbers above 100 individuals, namely SRCS West (MNI = 104) and Bonile (MNI = 267). The LBCS samples await full analysis, but some preliminary observations are available. The total shell fragment counts (NISP) are as follows: LBCS Chopi (21), LBCS Hayley (19), LBCS Kuka (shell remains only identified via SEM and XRD), LBCS Ollie (53), LBCS Kate (44), and LBCS Colton (8). No additional archaeomalacological observations are currently available for LBCS samples from the 2019 excavated deposits that greatly expanded the sample of LBCS materials.
Table 6. SRCS Shellfish. This table shows the species and common names of shellfish identified in Shell-Rich Clayey Sands (SRCS) deposits. The species are subdivided to show relative minimum number of individuals (MNI) and percentages by SubAggregate.

Among the studied SRCS samples, 17 shellfish taxa were identified to genus and to broad taxonomic groups (see Table 6). Brown mussel (Perna perna) is the dominant species in the assemblage (70.0%–86.5% by MNI), with minor but noticeable contributions of small barnacles, oysters, and limpets. Taking into account the small number of measurable individuals (total n = 90, including left and right valves), most of the collected brown mussels that were brought back to Waterfall Bluff appear to be rather small or medium in size, measuring between 40 mm and 80 mm. Initial observations from LBCS samples appear to reflect the same species abundance profile, but full analyses will test these first observations and provide quantified data to compare with the younger SRCS samples. Other much-less-frequent species in the Waterfall Bluff record, like Comus platyaulax, Nerita albicilla, and Mitra litterata, may have been picked up by chance during foraging activities or as potential personal ornaments. Others are known to arrive to campsites clinging to other shells (i.e., Helcion sp., keyhole limpets, and barnacles) or attached to the byssus or threads of rocky shore mussels (i.e., Barbatia obliquata) (Jerardino, Reference Jerardino2017). The latter species are all generally too small (<40 mm) for food consumption.
Water-worn shells
Water-worn shells (WWS) are organic macro-sediments that are often encountered with water-worn pebbles in many South African west-coast middens (Mbele et al., Reference Mbele, Mullins, Winkler and Woodborne2017). At Waterfall Bluff, these organic macro-sediments appear to derive mostly from the shells of oysters, and to a lesser extent from thick-shelled clams and scallops. Their sizes (3.1–45.2 mm) are larger than those observed for their equivalent on the west coast (2–20 mm) (Mbele et al., Reference Mbele, Mullins, Winkler and Woodborne2017). While the agency by which these sediments made their way to west-coast sites is largely understood, this is not yet the case for Waterfall Bluff organic macro-sediments, but hypothetical scenarios are discussed below. Water-worn pebbles were also encountered during the study of Waterfall Bluff shell samples, and they also constitute a part of the lithic assemblage. Several lithic artifacts were manufactured on small water-worn pebbles, suggesting that these secondary pebble sources likely served as a raw material source for toolmakers (see Fig. 9a, 9i, 9j). In order to quantify WWS abundance, a ratio was established (ratio = [#WWS/MNI marine invertebrates] × 100) and calculated for each stratigraphic unit. An overall average of 11.5 was established for SRCS samples. The strata with ratios around three times higher and more than the site's average were Jess (35.2) and Rosa (40.0), while those below the site's average correspond to the lowermost SRCS SubAggs, namely West (3.8), Bonile (4.1), and Courtney (7.3).
Archaeoichthyofauna
Temperature, geology, and biological interactions are the three main influences on South African fish distributions, but temperature is considered the most significant (Penrith, Reference Penrith1970; Turpie et al., Reference Turpie, Beckley and Katua2000). There is an east–west gradient in fish species richness due largely to the impact of the warmer-water Agulhas current on the east coast, which provides a high-latitude habitat for tropical Indo-Pacific fish species within South Africa's subtropical east-coast waters (Turpie et al., Reference Turpie, Beckley and Katua2000; Maggs, Reference Maggs2011). The east coast also has high species richness due to increased diversity in inshore habitats (Smith, Reference Smith, Bruton and Cooper1980). Pondoland's sub-tidal habitat is composed of coast-parallel shelving reef complexes. There is a shift in benthic composition from algal-dominated reefs in the north to sponge- and ascidian-dominated communities in the south, with a major shift from Mbotyi southwards (Celliers et al., Reference Celliers, Mann, Macdonald and Schleyer2007). Celliers and colleagues (Reference Celliers, Mann, Macdonald and Schleyer2007) attribute this shift to higher nutrient load from riverine runoff in the south.
Today, eight species of fish account for 90% of the total estuarine fish catch (Maggs et al., Reference Maggs, Mann and Cowley2013): Chrysoblephus puniceus (slinger seabream; Sparidae), Galeichthys trowi (Natal sea catfish; Ariidae), Polysteganus praeorbitalis (Scotsman seabream; Sparidae), Lethrinus nebulosus (green snapper; Lethrinidae), Epinephelus marginatus (dusky grouper; Serranidae), Epinephelus andersoni (cat-face rock-cod; Serranidae), Epinephelus rivulatus (halfmoon grouper; Serranidae), and Cymatoceps nasutus (black musselcracker; Sparidae). These fish belong to two main families: Sparidae and Serranidae.
Archaeoichthyofaunal methods
The remains described here include plotted bones recovered from the 10 mm and 3 mm sieves. Fish remains from the 1.5-mm sieve have not yet been studied. Skeletal elements terminology and calculations (NISP, %) were performed following standard zooarchaeological approaches and methods (Wheeler and Jones, Reference Wheeler and Jones1976; Grayson, Reference Grayson1984; Cannon, Reference Cannon1987; Rojo, Reference Rojo1991; Reitz and Wing, Reference Reitz and Wing1999; Ramsey, Reference Ramsey2009b). To visualize presentation of cranial and postcranial regions we grouped the skeletal elements according to these two groups and by eight anatomical regions (Butler, Reference Butler1992; Amante and Eakins, Reference Amante and Eakins2009).
NISP was used as a basic quantitative unit for measuring counts, relative abundance, ordinal ranking, body part representation, spatial distribution, and taxonomic composition. To aid our taxonomic identifications, we have partnered with the East London Museum, the South African Institute for Aquatic Biodiversity, the Eastern Cape Parks and Tourism Agency, and the East London Aquarium to develop a reference collection of local fishes. Since the collection has only just started, we have not been able to identify most remains. We were able to do preliminary taxonomic identification for a few diagnostic bones (dentary, premaxilla) that were indicative at the family level.
Measurements were performed with a digital caliper on vertebrae centrum height, width, and length (Morales Muñiz and Rosenlund, Reference Morales Muñiz and Rosenlund1979; Zohar et al., Reference Zohar, Dayan and Spanier1997; Zohar and Cooke, Reference Zohar and Cooke2019), and on dentary and premaxilla length and height (Fig. 13). We also recorded the color of the bone, and signs of burning were identified on charred bones displaying black, gray, and white colors.

Figure 13. (color online) Early and Middle Holocene fish vertebrae dimensions. This figure shows the distribution of fish vertebrae centrum width for Early Holocene and Middle Holocene assemblages with reference photos showing how the measurements were collected. The data suggest larger fish were collected during the Early Holocene.
Archaeoichthyofaunal results
Over 1,600 fish remains (NISP) have been identified to date from Waterfall Bluff, spanning LBCS SubAggs Kuka, Chopi, and Lily as well as all SubAggs in the SRCS. Most of the marine fish remains (69%; NISP = 1,108) are from SRCS SubAggs dated to the Early Holocene. The next greatest concentration of fish remains are found in the SRCS SubAggs dated to the Middle Holocene (31%; NISP = 492). Marine fish remains are also present in the LBCS (NISP = 4; 0.02%), but the sample is currently very small due to the limited LBCS excavations and sample that was available at the time of the analysis; the sample has been expanded since then.
Analysis of 767 skeletal elements sampled from SRCS show the presence of 73 different skeletal elements from the cranial and postcranial regions, including a single otolith from a very large fish (not yet identified) (Supplementary File 6). These data show that although the most abundant skeletal elements are vertebrae (37%, NISP = 287), in most SubAggs the cranial region is not underrepresented (Fig. 14). The poor preservation of bones from the branchial region is not surprising and supports our assumption that the fish were gutted in a different location, probably on the beach, close to their area of capture (Morales Muñiz and Rosenlund, Reference Morales Muñiz and Rosenlund1979; Zohar and Cooke, Reference Zohar and Cooke1997, Reference Zohar and Cooke2019). Additionally, many of the fish remains are well preserved, including preservation of fragile features such as the vertebrae with haemal and neural spines (see Fig. 13 and Fig. 15).
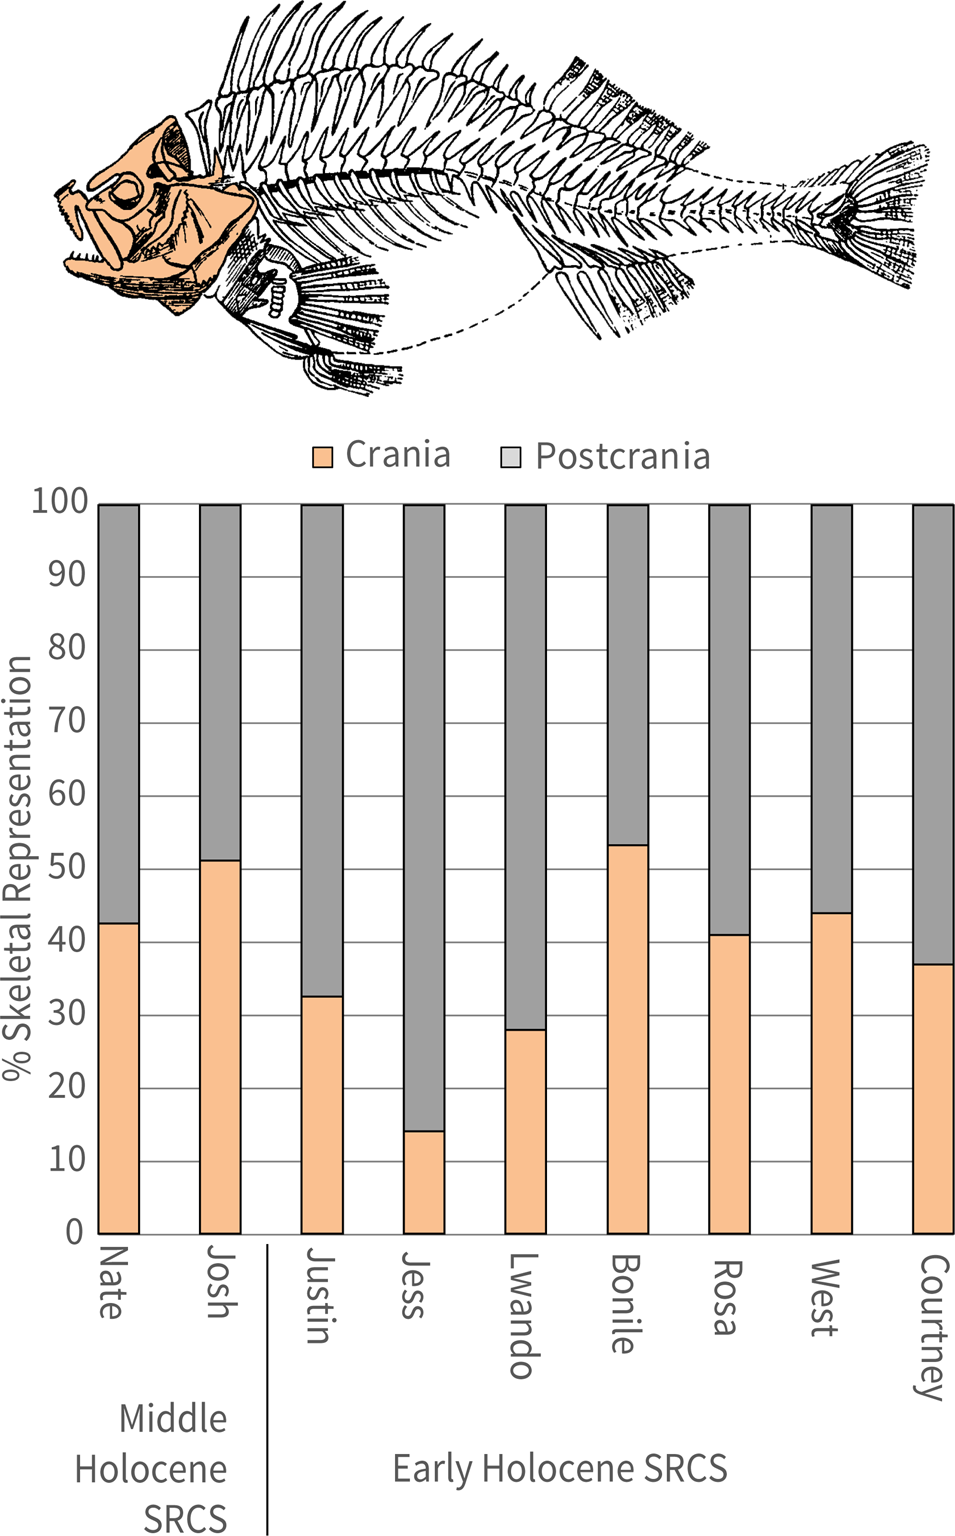
Figure 14. (color online) Percentage of preserved fish crania vs. postcrania. This chart shows the relative percentage of crania vs. post-crania in the Waterfall Bluff Shell-Rich Clayey Sands (SRCS) fish assemblage from 9 SubAggregates dating to the Middle Holocene and Early Holocene.

Figure 15. (color online) Examples of preserved fish bones from Waterfall Bluff. (a) Fish spine (CN471, Lot 107 Shell-Rich Clayey Sands [SRCS] Nate); (b) Sparidae premaxilla (CN10932, Lot 106, SRCS Nate); (c) vertebra CCN12124; Lot 115, SRCS Josh); (d) occipital crest (CN26765, Lot 266, SRCS West); (e) vertebra (CN2167, Lot 107, SRCS Nate); (f) hyomandibular (CN493, Lot 114, SRCS Bonile); (g) 1st dorsal pterygiophore (CN466, Lot 123, SRCS Josh).
Species-specific measurements of fish vertebra are well known to correlate to the overall size of the fish (Granadeiro and Silva, Reference Granadeiro and Silva2000). We measured the vertebrae centrum diameter (maximum length, width, and height) on a small sample (NISP = 133) from SRCS SubAggs attributed to either the Early Holocene (NISP = 88) or Middle Holocene (NISP = 45) (see Fig. 13). This analysis combines different species, so it only provides preliminary information on the relative sizes of the fishes that are represented in the assemblage. The observed SRCS pattern shows that all size groups of fishes are present, ranging from small (less than 10 cm in total length) to large fish (> 70 cm in total length). Larger fish are more abundant in the Early Holocene sample compared to the Middle Holocene sample (see Fig. 13). Future analysis will enable us to examine whether the reduction in fish size observed between Early and Middle Holocene samples accords with changes in fish population or changes in human exploitation patterns, or if it is biased due to sample sizes.
Taxonomic identification is currently in progress. So far, identifications at the family level include the following (in descending order): Sparidae (sea breams and porgies), Mugilidae (mullets), Sciaenidae (drums), Haemulidae (grunters), Serranidae (groupers), Carangidae (jacks), and Labridae (wrasses). Species of these families are among the most common fish captured in this area today (Maggs, Reference Maggs2011), and they are particularly common in littoral zones within estuaries and can tolerate both brackish and salt water. Additionally, we have identified the remains of crab (spp. unidentified) and spiny lobster (spp. unidentified).
DISCUSSION
At Waterfall Bluff, groups of hunter-gatherers occupied the site during both glacial and interglacial periods. The narrow and steep continental shelf kept coastlines within a maximum distance of 10 km from the site (and likely only ~8 km) even during the LGM, but these distances still appear to have impacted people's use of the site and the region's resources. Nevertheless, these occupations provide an unprecedented opportunity to study hunter-gatherer behavioral variability in a relatively persistent coastal context across a glacial/interglacial cycle.
The detailed OSL and AMS 14C dating results at Waterfall Bluff provide independent and reliable chronological assessments of the stratigraphic sequence. The Waterfall Bluff chronology is now one of the most robust sequences dating to the Pleistocene/Holocene transition in southern Africa, and our results demonstrate that there was neither a significant sedimentological nor occupational hiatus at the site from late MIS 3 to the Holocene, including during the LGM and LGIT. Current OSL dating results suggest the oldest current LBCS unit, Colton, starts ca. 38 ka and, along with LBCS Kate, these SubAggs currently comprise the MIS 3 sample. Thereafter, LBCS Hayley, Otis, and Lily formed during the LGM, while LBCS Chopi and Kuka date to the LGIT within MIS 2. LBCS Ollie, stratigraphically located between LBCS Kate and LBCS Otis, is currently undated, and therefore it is unknown whether it is associated with the underlying MIS 3 layers or the overlying LGM layers.
All LBCS deposits are characterized by coarse-grained, roofspall-rich sands. There are also isolated bands of darker, decalcified sediments (e.g., LBCS Ollie and Lily) within LBCS that contain stratified combustion features, and the LBCS stratigraphy is significantly better preserved farther inside the rock shelter where excavations are ongoing. Overlying LBCS, the SRCS shows a sedimentological change to clay-rich deposits. The earliest known SRCS occupations (SRCS Courtney and Irene) are found stratified above the LBCS deposits in the main excavation area. This contact between the coarse-grain LBCS sands and the clay-rich SRCS is very distinct, and ongoing micromorphological studies are providing more information about this contact. The modeled radiocarbon dates for the SRCS suggest a tightly constrained occupation of the site from ca. 11,000 cal yr BP to ca. 10,500 cal yr BP during the Early Holocene. There is also evidence for Middle Holocene occupations at the site in N844E335SW, but their relationship to other SRCS stratigraphy remains unknown.
The radiocarbon dating within SRCS presents some unique challenges because the calibration curve intersects 3 times over a 500-year period for all SRCS results. As a result, the span of SRCS ages appears largely homogenized, which may be due to potentially small deviations that tip the whole set of SubAggs to the older or younger side of the wiggle. Nonetheless, our modeling results show a subtle shift from older dates to younger dates in stratigraphic continuity with the sequence, and we trust the age of the SRCS overall even if differences between SRCS SubAggs are currently difficult to identify.
The character of the SRCS, and the narrow time span of the ages, strongly suggests that these deposits represent one or more tightly packed occupations at the site, though the duration and timing of the occupations is unknown. There is abundant evidence that during these occupations earlier and contemporaneous deposits were dug out and/or modified. For example, SRCS Bonile was dug out toward the mouth of the rock shelter to make room for the deposition of SRCS Lwando. The shells within SRCS Lwando all have a characteristic grey coloration indicative of being heavily burnt, yet there is little in situ evidence of stratified combustion features or the remains of these features (e.g., ash and charcoal). Therefore, it appears that after SRCS Bonile was dug out, the SRCS Lwando shell itself was secondarily deposited from another location. In another example, numerous vertical infillings ~8 cm in diameter and ~20 cm deep have been excavated in SRCS West; these infillings extend downward and cut into SRCS Irene. These vertical structures are localized at the site and appear to have some spatial patterning to them, suggesting it may be the remains of emplaced posts for as-yet-unknown purposes. Analysis of the sediments within these vertical structures is also ongoing.
Stone artifacts are found throughout the LBCS and SRCS deposits at Waterfall Bluff. However, preliminary observations suggest that the lithics and other anthropogenic and faunal materials are less abundant in the deepest LBCS layers dating to MIS 3 compared to the LGM or LGIT layers. This could be due to changes in human occupation, taphonomic effects, or the limited sample of the lowest LBCS. The sample of LBCS described here, for example, comes from just the earliest excavations into LBCS from 2016 that together only amounted to 0.18 m3, which is roughly equivalent to an excavation 1 m × 0.5 m × 0.35 m. In comparison, 0.77 m3 was excavated from SRCS during that same timeframe, representing over four times more material recovered from SRCS than all of the LBCS. Subsequent excavations in 2019 have significantly increased the LBCS sample (largely unanalyzed) and with it our understanding of the human occupations from these layers.
Both LGM and Early Holocene assemblages are dominated by the use of hornfels, which is found throughout the region in terrestrial-contact metamorphic contexts, but it is also commonly washed down rivers and onto beaches. Differences in cortex types (rounded vs. angular) suggests toolmakers may have targeted more rounded riverine or weathered coastal raw material sources during the Early Holocene versus more terrestrial sources during the LGM when the coastline was ~8 km from the site. If this observation is verified in future analyses, then it will show that raw material procurement patterns were tethered to Pondoland's shifting coastline.
The presence of higher cortex retention rates in the Early Holocene compared to the LGM deposits suggests differences in LGM and Early Holocene flaking technologies. Early Holocene toolmakers may have initiated flaking more often on-site or reduced cores less intensively, or they may not have fully exploited cortical surfaces compared to LGM toolmakers. Lithic reduction and modification patterns further suggest that Waterfall Bluff toolmakers cycled lithics through several stages and applied techniques that included using the same lithic pieces as both cores and implements. One Early Holocene core, for example, was broken along the lateral edge and then flaked longitudinally along the broken edge to create elongated flakes and to refresh the edge for tasks that left the tool's edge marginally modified. Additionally, a core from the LGM shows signs of platform-on-anvil technique (i.e., a freehand platform area opposed by a crushed distal core margin) specifically to maximize flaking potential and the production of elongated flakes (see Fig. 8a). Preliminary observations of the macro damage to the flakes show that at least one of the LBCS flakes has clear evidence of a step-terminating bending fracture at its distal end suggesting use in tasks with a high degree of bending tension. These tasks may have included the use of stone implements to pry open shellfish or to dislodge them from rocks. Future work will focus on testing this hypothesis.
Coastal foraging from the late Pleistocene to the Holocene
Across southern Africa, evidence of coastal foraging during MIS 3 and MIS 2 (including the LGM) is largely absent. There are preliminary reports of shellfish in deposits dating from ca. 35 ka to ca. 26 ka at the site of Knysna Eastern Heads 1 (KEH1), on South Africa's south coast, but these data are currently unpublished (N. Cleghorn personal communication, but see also Keller et al., Reference Keller, Hodgkins and Cleghorn2019). Initially, the coastline would have only been ~10 km away from KEH1, but as sea levels continued to drop through MIS 3 the coastline all along the south coast expanded outward by over 20 km leaving KEH1 and other contemporaneous coastal sites, like Klipdrift, Nelson Bay Cave, and Matjies River, as inland locations (see Fig. 1). A similar situation occurred on the west coast where once-nearby coastlines were relocated well over 20 km away from sites such as Elands Bay Cave during MIS 3. By the LGM, all documented sites on the south and west coasts of southern Africa were between 50 km and more than 100 km away from the coastline (Fisher et al., Reference Fisher, Bar-Matthews, Jerardino and Marean2010). Traces of marine mollusks and fish used as food sources are not seen in archaeological records during this period; they only appear in very small quantities at Byneskranskop in deposits dated ~17 ka (Schweitzer and Wilson, Reference Schweitzer and Wilson1982). Exploitation of marine mollusks, marine mammals, and marine fish is not reported at other west- and south-coast sites until ~14 ka, when quantities progressively increased into the Holocene in step with rising sea levels and transgressing coastlines (Fig. 16). The lack of marine resources used as food sources in later MIS 3 and LGM deposits from currently coastal sites therefore suggests that the coast was simply too far from the sites on the south and west coasts to exploit. This does not seem to be the case at Waterfall Bluff where the coastline was ~8 km from the site during MIS 3 and the LGM due to the narrow continental shelf.
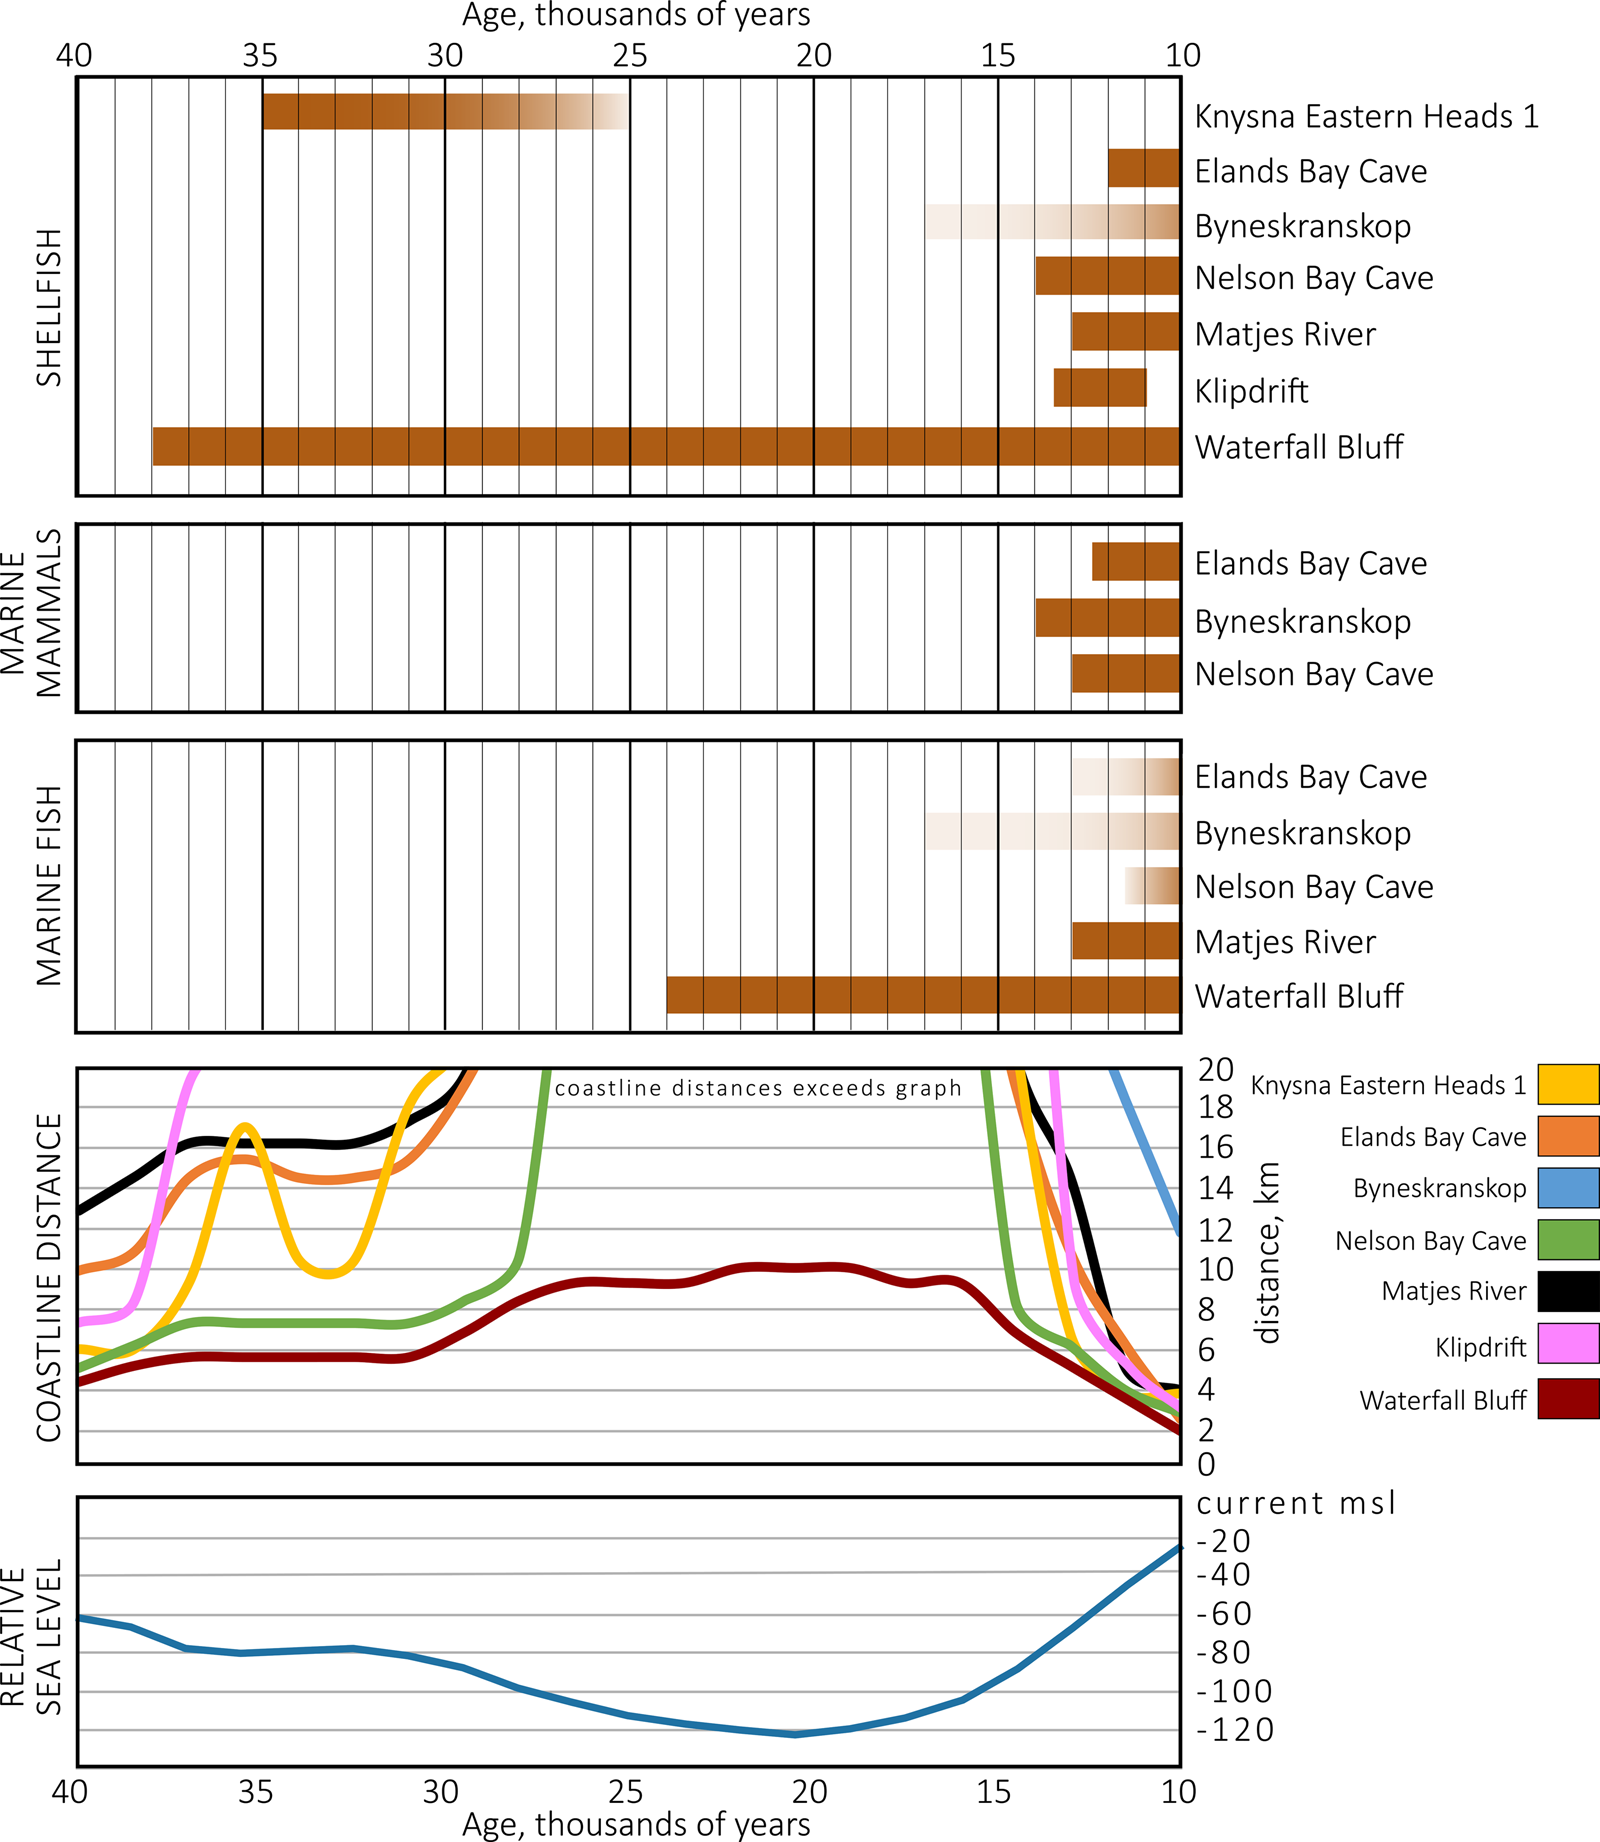
Figure 16. (color online) Archaeological evidence of coastal foraging 40 ka to 10 ka. This figure shows the distribution of marine shellfish, marine mammals, and marine fish that have been documented at archaeological sites along the coast of South Africa. Excepting Waterfall Bluff, evidence of marine resource procurement disappears by 25 ka and reappears only ~15 ka, corresponding very closely to glacial/interglacial sea level fluctuations that impacted the locations of coastlines. Coastline distance is derived from Fisher and colleagues (Reference Fisher, Bar-Matthews, Jerardino and Marean2010), showing linear minimum distances to coastlines from sites through time. Relative sea level is adapted from Waelbroeck and colleagues (Reference Waelbroeck, Labeyrie, Michel, Duplessy, McManus, Lambeck, Balbon and Labracherie2002).
Shellfish and/or fish remains are found in nearly all the anthropogenic deposits at Waterfall Bluff to varying degrees, though the more extensive 2019 LBCS excavated remains are unanalyzed and unreported here. The presence of the shellfish and fish in deposits dated to the LGM alone is important because it is the first time that direct evidence of coastal foraging activities has been observed in southern Africa from deposits dating to a glacial maximum. However, there is very little else that can be said about how hunter-gatherers were utilizing aquatic resources during the LGM at this time. The reason is threefold. First, as was noted above, the LBCS assemblages presented here derive only from the earliest excavations into LBCS from 2016, and so they were very limited (<1 m3) and four times smaller than the contemporary SRCS excavations. This is due simply to the deeper and harder-to-reach nature of the LBCS deposits, and it is already being rectified by new excavations. Second, that sample of 2016 LBCS material was also collected almost exclusively from the dripline where there were clear taphonomic influences on the deposits from drip water, discoloring all sediments through the post-depositional process of decalcification. SRCS Jess, for example, is an easily identifiable marker-horizon across the excavations, being composed of golden-colored Perna perna shells in a dense shell-supported matrix. Yet at the dripline the layer has a dark black/brown coloration lacking shell (see Fig. 4). LBCS Lily and Ollie have similar dark colorations at the dripline and SEM/XRD analyses of a sediment sample from LBCS Kuka has found microscopic traces of partly dissolved shell (see Fig. 4 and Fig. 6). The implication is that both LBCS and SRCS deposits at the dripline may have once contained much greater quantities of shell that were likely removed through the process of dissolution via drip water.
A third possibility is that coastal foraging strategies and the human occupation of the rock shelter differed between the LGM and Holocene. The LBCS lithic assemblage, dating to the LGM, shows an increase in cortex signatures in cores and flakes, suggesting raw material sourcing away from shorelines or river mouths. Additionally, the presence of bipolar reduction, emphasizing the production of small flakes and bladelets, points to increased reduction intensity of stone nodules. Elsewhere these kinds of patterns have been linked to greater group mobility (Jerardino and Navarro, Reference Jerardino and Navarro2008).
The multi-proxy paleoenvironmental data described in Esteban et al. (Reference Esteban, Bamford, Miller, Neumann, Schefuß, Zabel, Pargeter, Cawthra and Fisher2019) suggests a mosaic of open woodland vegetation and afrotemperate forests probably located in fire- and wind-protected cliffs and valleys on the exposed coastal plain during MIS 3 and the LGM when the coastline was between ~3 km and ~8 km from the site, respectively. During this time the climate was likely characterized by low rainfall seasonality and intensity but had sufficient perennial moisture availability to allow forest development. This started to change during the LGIT and the Early Holocene when multi-proxy evidence suggests higher rainfall intensity and seasonality (i.e., higher summer rainfall) coeval with evidence for forest retreat and open-land indicators like the expansion of mesic environments similar to those present in the region today.
These patterns establish a baseline for inferring changes in site occupation and coastal resource exploitation. Preliminary analysis of the fish remains shows abundance of Sparidae and Mugilidae, two families of fish that are known to occupy estuarine or brackish environments. These families are still abundant today and exploited by traditional fishing communities that harvest these fish from the mouths of nearby rivers like the Lupathana, Mkweni, and Msikaba (Turpie et al., Reference Turpie, Beckley and Katua2000; Maggs, Reference Maggs2011). These environments also often provide rocky outcrops that support dense shellfish populations. In the SRCS Early Holocene deposits, the fish assemblage shows evidence of both cranial and post-cranial remains suggesting nearby procurement and on-site processing. Similarly, the abundance of whole shells throughout the SRCS implies on-site processing of shellfish in post-glacial deposits that is consistent with a nearshore context. Likewise, the exploitation of coastal forests and forest margins for wood-fuel, and perhaps other purposes, is also observed in the charcoal record (Esteban et al., Reference Esteban, Bamford, Miller, Neumann, Schefuß, Zabel, Pargeter, Cawthra and Fisher2019).
Marine geoscience data of the seafloor near Waterfall Bluff shows the presence of submarine canyons linked to many modern river systems (e.g., Umzimvubu, Msikaba, Mtentu, and Tezana Rivers) in the area (see Fig. 1). These canyons were formed by paleorivers that would have been active during glacial periods when the narrow continental shelf was exposed by lower sea levels. The canyons are believed to have supported forest ecosystems during MIS 3 and the LGM, as described in the Podocarpus/Afrocarpus pollen record by Esteban et al. (Reference Esteban, Bamford, Miller, Neumann, Schefuß, Zabel, Pargeter, Cawthra and Fisher2019), while the rivers would have provided a ready supply of freshwater to support hunter-gatherers. These river systems also would have supported brackish estuarine habitats at river mouths for fishing adjacent to rocky coastlines supporting shellfish. We hypothesize that during the LGM, when the coastline was ~8 km away from the site, coastal foragers probably targeted these estuarine environments where field processing of fish would have been more common (e.g., salted, dried) and the meat either consumed immediately or transported back to the site (Zohar and Cooke, Reference Zohar and Cooke2019). Shell fishing may not have been so tethered to rocky shores adjacent to river mouths but would have been possible all along the nearby coastline. As is the case today, it is very possible that the nearby rocky shoreline was dominated by mussel beds during the entire site occupation. The archaeomalacological record from Waterfall Bluff shows that shellfish collection efforts were almost entirely geared toward the collection of brown mussels (>70% by MNI), with very sporadic pickings of oysters, limpets and whelks.
By and large, people's foraging rounds seem to have been limited to the mid-intertidal zone as evidenced by the medium-sized mussels. Ecological studies show that smaller brown mussels are more abundant upshore, while the opposite is the case for larger mussels (van Erkom Schurink and Griffiths, Reference van Erkom Schurink and Griffiths1993; McQuaid et al., Reference McQuaid, Lindsay and Lindsay2000). Hence, compared with the maximum sizes of up to 110 mm and 130 mm currently reached by brown mussels near Port Alfred and East London (McQuaid et al., Reference McQuaid, Lindsay and Lindsay2000), most of the collected mussels brought back to Waterfall Bluff appear to be rather small or medium in size.
Alternatively, we hypothesize that most large brown mussels were field processed before transport to the rock shelter. Ongoing archaeomalacological studies will likely shed further light on this topic. The implication is that catches of mollusks were either taken back whole to the site or shucked in various proportions before their transport to Waterfall Bluff. Some of them might also have also been consumed at processing points. This hypothesis is supported by both ethnographic observations and archaeological evidence for distance-based field processing of coastal resources (Bird and Bliege Bird, Reference Bird and Bliege Bird1997; Zohar and Cooke, Reference Zohar and Cooke1997; Bird et al., Reference Bird, Richardson, Veth and Barham2002; Jerardino, Reference Jerardino2016b). We predict that the archaeological signature of this pattern, therefore, would show lower amounts of shell and higher shell fragmentation, and the fish would show the absence of discarded areas like the branchial region during the LGM and perhaps also the LGIT. The implications of this are more field processing and transportation of coastal resources to Waterfall Bluff depending on how distant the site was from coastlines through time. The preservation of fragile structures on the fish bones—like vertebrae with haemal and neural spines—further suggests that they were either protected via rapid deposition, preventing predator scavenging, and/or that the site was abandoned soon after the fish were processed. Therefore, visits to the site may have been brief, and perhaps for specific purposes such as fish/shell processing and consumption, before the hunter-gatherer groups moved on to other encampments. These patterns support historical documentation that show foraging communities from the wider region using the Pondoland and Kwa-Zulu Natal coastlines for short-lived logistical forays to collect specific plant and animal resources lacking in other parts of the region (Wright, Reference Wright1971).
Linking the coast to the hinterland
The timing of occupation at Waterfall Bluff hints at region-wide behavioral patterning that may link coastal and inland foraging groups. In the nearby Maloti-Drakensberg region and other inland areas, prehistoric activity is documented at Rose Cottage Cave, Ha Makotoko, Strathalan B, and Sehonghong before the onset of the LGM (Opperman, Reference Opperman1996; Pargeter et al., Reference Pargeter, Loftus and Mitchell2017; Stewart and Mitchell, Reference Stewart and Mitchell2018; Loftus et al., Reference Loftus, Pargeter, Mackay, Stewart and Mitchell2019). At Grassridge Rock Shelter in the Eastern Cape an occupation hiatus is recorded after 39.9–36.8 ka (Opperman, Reference Opperman1984; Collins et al., Reference Collins, Carr, Schefuß, Boom and Sealy2017), and hiatuses are also recorded at Sehonghong (Lesotho) and Rose Cottage Cave (Free State) between ca. 29 and 25 ka (Pargeter et al., Reference Pargeter, Loftus and Mitchell2017; Loftus et al., Reference Loftus, Pargeter, Mackay, Stewart and Mitchell2019). Likewise, there is also an occupational hiatus at Umbeli Belli in KwaZulu-Natal between ca. 24.9 and ca. 17.8 ka (Bader et al., Reference Bader, Cable, Lentfer and Conard2016). Only at Umhlatuzana (Kaplan, Reference Kaplan1990) and Shongweni (Vogel et al., Reference Vogel, Fuls and Visser1986), both ~30 km inland of Durban, is occupation evident just prior to the LGM. At best, Umhlatuzana and Shongweni suggest that people were sporadically present some 30 km inland of the present coastline just before and—more convincingly—after the LGM. Similarly, the patterning in the distribution of radiocarbon dates from Sehonghong suggests that during the early LGM, ca. 24–23 ka, the Lesotho highlands offered increased opportunities for hunter-gatherers, but only before conditions deteriorated sufficiently to discourage further occupation (Pargeter et al., Reference Pargeter, Loftus and Mitchell2017). While the regional record shows a lack of occupation during the LGM, the archaeological records from Waterfall Bluff shows evidence for human occupation in near-coastal contexts (see Fig. 7 and Fig. 16). Without excluding the possibility of human movement into lowland Lesotho and the eastern Free State during these times (cf. Stewart and Mitchell, Reference Stewart and Mitchell2016), our data show that some populations likely also migrated eastward to the coastline.
An uptick in human activity occurred across the region ca. 11 ka, with peaks in archaeological occupation at Ha Makotoko and Ntloana Tšoana (Mitchell, Reference Mitchell1993; Mitchell and Arthur, Reference Mitchell and Arthur2014). The available palaeoclimatic and archaeological data (i.e., Zohar and Cooke, Reference Zohar and Cooke1997; Roberts et al., Reference Roberts, Lee-Thorp, Mitchell and Arthur2013) suggests that the shift toward a wetter, but more variable, climate in the summer rainfall region during the terminal Pleistocene and early Holocene greatly ameliorated conditions west of the Maloti-Drakensberg Escarpment, attracting hunter-gatherers after a long period of relatively sparse population. At this time, a single Nerita marine shell bead, whose distribution includes the Pondoland coastline ~200 km to the east, makes its first appearance in the Sehonghong sequence (ca. 14-15 ka).
A vervet monkey (Chlorocebus pygerythrus) scapula has also been documented from Sehonghong layer BAS dating to 24.5–22.8 ka during the early LGM. It is unlikely that a woodland-adapted species was present in highland Lesotho during this time (Plug and Mitchell, Reference Plug and Mitchell2008). At Waterfall Bluff, the presence of an ostrich eggshell bead (CN26816) from SRCS Josh also provides evidence for the movement of objects from inland to the coast during the Middle Holocene, assuming that the current distribution of ostriches—which are not indigenous to Pondoland today—was similar in the past (Cooper et al., Reference Cooper, Mahrose, Horbańczuk, Villegas-Vizcaíno, Sebei and Mohammed2009). Together, the marine and ostrich shell beads, as well as exotic faunal remains, hint at persistent contacts between coastal Indian Ocean and hinterland contexts, either through exchange via extensive social networks or group movement (Mitchell, Reference Mitchell1996). Future studies at Waterfall Bluff will enable us to shed light on possible connections between coastal foraging groups and those located at more inland regions.
More broadly, we can look at the technology to assess how the LBCS and SRCS assemblages fit into the regional culture-history framework (Lombard et al., Reference Lombard, Wadley, Deacon, Wurz, Parsons, Mohapi, Swart and Mitchell2012). The LBCS emphasis on small elongated flake production and the single platform-on-anvil bladelet core would align the assemblage with others labeled “Robberg” at sites such as Sehonghong, Melikane, Rose Cottage Cave, and Umhlatuzana (Deacon, Reference Deacon1984; Wadley, Reference Wadley1991; Mitchell, Reference Mitchell1996; Low and Mackay Reference Low and Mackay2016; Porraz et al., Reference Porraz, Igreja, Schmidt and Parkington2016; Low, Reference Low2019). However, high retouch frequencies in the LBCS suggest a point of departure from some Robberg assemblages elsewhere (cf. Deacon, Reference Deacon1984) and add to a growing understanding of technological variability within Robberg assemblages (Low, Reference Low2019). This should come as no surprise as Waterfall Bluff represents the first directly dated evidence for coastal foraging during the LGM with the associated technological adaptations having no prior referents in the local archaeological record. However, this pattern could also be a result of our limited sample size and will need to be assessed in future work on a larger lithic sample.
The SRCS lithic patterns are more directly associated with the ‘Oakhurst’ or late Pleistocene / early Holocene non-microlithic techno-complexes defined elsewhere at sites such as Rose Cottage Cave, Ha Makotoko, and Ntloana Tšoana by the emphasis on larger (>50 mm in maximum dimension) side-struck flakes, an assortment of scrapers (convex edges >45°), backed and naturally backed knives (straight edges <45°), adzes, irregular or informal multiplatform cores, and worked bone (Deacon, Reference Deacon1984). Absent from the SRCS assemblage are the Oakhurst's smaller (<40 mm in maximum dimension) convex scraper forms typically referred to as “Woodlot” or “duck-billed” scrapers that are characteristic of many similarly aged assemblages in Lesotho and on the south coast (Deacon, Reference Deacon1984; Mitchell, Reference Mitchell1993). Use-wear analyses show some of these tool types were used for specialized tasks such as woodworking and preparing hides, and their absence at Waterfall Bluff could reflect the lack of such tasks. It should also be mentioned that Goodwin and Van Riet Lowe (Reference Goodwin and van Riet Lowe1929) contended that scraper size variants were time-dependent; thus, larger scrapers occurred earlier in Oakhurst assemblages than smaller scrapers. One notable point of departure between the SRCS materials and other Oakhurst assemblages in southern Africa is the use of small water-worn hornfels cobbles for miniaturized flake production. This pattern suggests an opportunistic form of raw material procurement embedded with shellfish foraging strategies that has never before been documented. It also implies a close association between the coastline and lithic technological organization.
The hunter-gatherer occupants at Waterfall Bluff exhibited lithic technologies that have similarities to assemblages produced elsewhere in southern Africa across the late Pleistocene and Early Holocene, albeit with idiosyncrasies whose meanings are not yet fully understood. It is particularly intriguing that archaeological records in Lesotho are absent during the peak LGM while Waterfall Bluff now provides direct evidence that people were occupying the coastline. If, and how, those people at Waterfall Bluff were related to hunter-gatherers occupying the Lesotho highlands or other areas surrounding Pondoland remains to be seen. Yet, there is enough evidence to hypothesize links between the coastal lowlands and highlands.
CONCLUSION
Excavations by the P5 Project at Waterfall Bluff provide a new and rich data archive about hunter-gatherer occupations and behaviors from an under-studied part of southern Africa. Our multi-proxy paleoenvironmental data show varying but sustained moisture and presence of all major vegetation types found in the region today (e.g., forests, grasslands, etc.) from the end of the Pleistocene to the Holocene (Esteban et al., Reference Esteban, Bamford, Miller, Neumann, Schefuß, Zabel, Pargeter, Cawthra and Fisher2019). These data are linked with our high-resolution archaeological excavations, described here, to understand hunter-gatherer behavior in a persistent coastal context across a glacial/interglacial boundary.
Excavations at Waterfall Bluff have thus far revealed a complex but well-preserved stratigraphic sequence. Our robust and multi-proxy dating strategy has further demonstrated that hunter-gatherers visited the site throughout MIS 3, the LGM, the LGIT, and the Early Holocene with no evidence for substantial occupation hiatuses. There were also occupations during the Middle Holocene. We have coupled this detailed chronology to an equally robust sampling and analytical protocol that is beginning to yield new insights into the prehistoric contexts and behaviors of the hunter-gatherer groups who visited the site. Furthermore, the occurrence of shellfish and marine fish remains throughout the archaeological record at Waterfall Bluff makes this site unique in southern Africa, where evidence for marine exploitation from all other contemporaneous sites ends ~30,000 years ago and does not return until ~14,000 years ago.
Yet coastal resources at Waterfall Bluff do not appear to have been prioritized over any others. Instead, the central location of Waterfall Bluff between the coast and the surrounding landscape may have been the site's main draw, as hunter-gatherers moved throughout the landscape exploiting various resources. The site's occupation patterns align with regional site occupation trends across the LGM and Early Holocene suggesting broader region-wide processes linking coastal and inland hunter-gatherer groups. Further work will continue using multiple strands of evidence to elucidate various details about the variability of forager lifeways during the LGM and Early Holocene and will also aim at situating Waterfall Bluff within possible larger demographic and mobility patterns across the Eastern Cape and Maloti-Drakensburg escarpment.
ACKNOWLEDGMENTS
The P5 project thanks King Zanozuko Tyelovuyo Sigcau of AmaMpondo and the hospitality of the AmaMpondo people. The project further acknowledges the inestimable support of Nkosi Mthuthuzeli Mkwedini and the Lambasi AmaMpondo community for their continued interest in our research at Waterfall Bluff. P5 also thanks Lungiswa Sihlobo of the Ingquza Hill Municipality and local tourism associations for their support throughout the broader region and in promoting ecotourism at the site. We also want to acknowledge Sello Mokhanye and the Eastern Cape Provincial Heritage Resources Authority, Phillip Hine and the South African Heritage Resources Authority, Kevin Cole and the East London Museum, Celeste Booth and the Albany Museum of South Africa, and John Costello and Kathryn Costello. IE acknowledges the Department of Science and Technology - National Research Foundation Centre of Excellence in Palaeosciences. ECF acknowledges the support of Imatest, LLC for complimentary use of Imatest 5 software. AO and KS acknowledge use of the facilities at the University of Wollongong Electron Microscopy Centre and the assistance of Tony Romeo and Mitchell Nancarrow. IZ acknowledges the assistance of Qurban Rouhanni and the South African Institute of Aquatic Biology. RBS acknowledges the support of the Australian Government Research Training Program Scholarship. The field research was made possible through the support of a grant from the US National Science Foundation (BCS-1827326 to Fisher, Cawthra, Esteban, and Pargeter). Excavations at Waterfall Bluff were conducted under the auspices of the Eastern Cape Provincial Heritage Resources Authority, permit #2/2/APM-PERMIT/15/03/001-.
SUPPLEMENTARY MATERIAL
The supplementary materials for this article can be found at https://doi.org/10.1017/qua.2020.26.