INTRODUCTION
Climate records spanning the last 400,000 yr (Dansgaard et al., Reference Dansgaard, Johnsen, Clausen, Dahl-Jensen, Gundestrup, Hammer and Hvidberg1993; Martrat et al., Reference Martrat, Grimalt, Shackleton, de Abreu, Hutterli and Stocker2007; Wang et al., Reference Wang, Cheng, Edwards, Kong, Shao, Chen, Wu, Jiang, Wang and An2008) have shown that glacial–interglacial (G-IG) cycles are not simple repeating patterns (Martrat et al., Reference Martrat, Grimalt, Shackleton, de Abreu, Hutterli and Stocker2007; Past Interglacials Working Group of PAGES, 2016). Each cycle experienced a unique set of climatic boundary conditions based on variations in orbital parameters, including the earth’s eccentricity, axial tilt, and precession. Therefore, the resulting orbital-scale variations are far from being identical from one G-IG cycle to the next (Margari et al., Reference Margari, Skinner, Tzedakis, Ganopolski, Vautravers and Shackleton2010; Wainer et al., Reference Wainer, Genty, Blamart, Bar-Matthews, Quinif and Plagnes2013). In addition, differences in the magnitude of forcing factors such as ice rafted debris discharge and solar radiation influence the amplitude of global atmospheric and sea surface temperatures (SSTs), as well as the amplitude, number, and duration of stadial/interstadial periods during each G-IG cycle.
Millennial-scale climatic variations during the last glacial cycle are extensively documented in ice cores (Dansgaard, Reference Dansgaard1964; Blunier and Brook, Reference Blunier and Brook2001; Rohling et al., Reference Rohling, Mayewski and Challenor2003; North Greenland Ice Core Project, 2004; Capron et al., Reference Capron, Landais, Chappellaz, Schilt, Buiron, Dahl-Jensen and Johnsen2010; Wolff et al., Reference Wolff, Chappellaz, Blunier, Rasmussen and Svensson2010; Rasmussen et al., Reference Rasmussen, Bigler, Blockley, Blunier, Buchardt, Clausen and Cvijanovic2014), from marine records (Goñi et al, Reference Goñi, Turon, Eynaud and Gendreau2000; Peterson at al., Reference Peterson, Haug, Hughen and Röhl2000; de Abreu et al., Reference de Abreu, Shackleton, Schönfeld, Hall and Chapman2003; Siddal et al., Reference Siddall, Rohling, Almogi-Labin, Hemleben, Meischner, Schmelzer and Smeed2003; Jouzel et al., Reference Jouzel, Masson-Delmotte, Cattani, Dreyfus, Falourd, Hoffmann and Minster2007; Martrat et al., Reference Martrat, Grimalt, Shackleton, de Abreu, Hutterli and Stocker2007; Margari et al., Reference Margari, Skinner, Tzedakis, Ganopolski, Vautravers and Shackleton2010), and in terrestrial deposits (Fletcher and Sánchez Goñi, Reference Fletcher and Sánchez Goñi2008; Wang et al., Reference Wang, Cheng, Edwards, Kong, Shao, Chen, Wu, Jiang, Wang and An2008; Tzedakis et al., Reference Tzedakis, Pälike, Roucoux and de Abreu2009; Fletcher et al., Reference Fletcher, Goni, Allen, Cheddadi, Combourieu-Nebout, Huntley and Müller2010; Cheng et al., Reference Cheng, Zhang, Spötl, Edwards, Cai, Zhang, Sang, Tan and An2012; Genty et al., Reference Wainer, Genty, Blamart, Bar-Matthews, Quinif and Plagnes2013; Ünal-İmer et al., Reference Ünal-İmer, Shulmeister, Zhao, Uysal, Feng, Nguyen and Yüce2015). Much less is known about millennial-scale variability in older glacial cycles such as the penultimate glacial period, between 135 and 185 ka (Ehlers and Gibbard, Reference Ehlers and Gibbard2007) – equivalent to Marine Oxygen Isotope Stage 6 (MIS 6). With a lack of Northern Hemisphere ice core records covering the MIS 6 period, some marine (Margari et al., Reference Margari, Skinner, Tzedakis, Ganopolski, Vautravers and Shackleton2010, Reference Margari, Skinner, Hodell, Martrat, Toucanne, Grimalt, Gibbard, Lunkka and Tzedakis2014) and terrestrial records (Wang et al., Reference Wang, Cheng, Edwards, Kong, Shao, Chen, Wu, Jiang, Wang and An2008; Cheng et al., Reference Cheng, Zhang, Spötl, Edwards, Cai, Zhang, Sang, Tan and An2012) provide alternative paleoclimate records, along with the synthetic Greenland temperature proxy profile (Barker et al., Reference Barker, Knorr, Edwards, Parrenin, Putnam, Skinner, Wolff and Ziegler2011).
For the last glacial cycle, the well-dated Hulu-Sanbao cave records in China (Wang et al., Reference Wang, Cheng, Edwards, Kong, Shao, Chen, Wu, Jiang, Wang and An2008; Cheng et al., Reference Cheng, Zhang, Spötl, Edwards, Cai, Zhang, Sang, Tan and An2012) revealed enhanced monsoonal activity occurring synchronously with the Greenland Dansgaard-Oeschger (D-O) warming events. Speleothems from Villars Cave, France (Genty et al., Reference Genty, Blamart, Ouahdi and Gilmour2003), recorded similar millennial-scale patterns interpreted as warm and/or wet peaks. The occurrence of comparable millennial-scale variability in the Hulu-Sanbao and Villars Cave speleothem records (Wainer et al., Reference Wainer, Genty, Blamart, Bar-Matthews, Quinif and Plagnes2013) suggests that D-O–like millennial-scale climate fluctuations also occurred during the penultimate glacial period, albeit with different patterns, intensities, and duration compared with MIS 3.
In Europe, D-O–like patterns during the penultimate glaciation were reflected in the isotope patterns from Villars Cave, France (Wainer et al., Reference Wainer, Genty, Blamart, Bar-Matthews, Quinif and Plagnes2013), the Tana Che Urla Cave speleothems records, central Italy (Regattieri et al., Reference Regattieri, Zanchetta, Drysdale, Isola, Hellstrom and Roncioni2014), and the Abaliget Cave speleothem records, southern Hungary (Koltai et al., Reference Koltai, Spötl, Shen, Wu, Rao, Palcsu, Kele, Surányi and Bárány-Kevei2017). Pollen and δ18Oplank. marine records from the Portuguese MD01-2444 core (Margari et al., Reference Margari, Skinner, Tzedakis, Ganopolski, Vautravers and Shackleton2010, Reference Margari, Skinner, Hodell, Martrat, Toucanne, Grimalt, Gibbard, Lunkka and Tzedakis2014) also suggest warmer conditions during early MIS 6 (de Abreu et al., Reference de Abreu, Shackleton, Schönfeld, Hall and Chapman2003), with less prominent millennial-scale variability. D-O–like climatic oscillations are also recorded in the marine SSTalk. record from the Iberian margin ODP-977 core (Martrat et al., Reference Martrat, Grimalt, Shackleton, de Abreu, Hutterli and Stocker2007), with more than nine cold and warm events during early and mid-MIS 6 (ca. 150–178 ka, according to Margari et al., Reference Margari, Skinner, Tzedakis, Ganopolski, Vautravers and Shackleton2010). These identified climatic oscillations, triggered in response to global climatic warming, were not restricted to oceanic processes linked to deglaciation but also included shifts in atmospheric circulation (Stocker and Johnsen, Reference Stocker and Johnsen2003; Barker et al., 2009) that imprinted terrestrial records. Teleconnections of these stadial–interstadial changes across both Northern Hemisphere (Wang et al., Reference Wang, Cheng, Edwards, An, Wu, Shen and Dorale2001; Fleitmann et al., Reference Fleitmann, Cheng, Badertscher, Edwards, Mudelsee, Göktürk and Fankhauser2009) and mid- to low-latitude regions (Wang et al., Reference Wang, Cheng, Edwards, Kong, Shao, Chen, Wu, Jiang, Wang and An2008; Cheng et al., Reference Cheng, Zhang, Spötl, Edwards, Cai, Zhang, Sang, Tan and An2012; Ünal-İmer et al, Reference Ünal-İmer, Shulmeister, Zhao, Uysal, Feng, Nguyen and Yüce2015) are well established, partially thanks to speleothem records with their ability to constrain precisely the timing of these dynamics. However, understanding millennial-scale variability (Jouzel et al., Reference Jouzel, Masson-Delmotte, Cattani, Dreyfus, Falourd, Hoffmann and Minster2007) beyond the last G-IG cycle, such as for the penultimate glacial period, ca. 135–185 ka, is still hampered by the scarcity of continuous low- to midlatitude terrestrial records with robust chronologies and sufficiently high resolution.
Speleothems are terrestrial archives that can provide high-resolution proxy time series for paleoclimate reconstruction data with sufficient precision to date the timing of climatic changes (Genty et al., Reference Genty, Blamart, Ouahdi and Gilmour2003; Cheng et al., Reference Cheng, Zhang, Spötl, Edwards, Cai, Zhang, Sang, Tan and An2012). In the eastern Mediterranean basin, MIS 6 and 7 were both the subject of marine (Emeis et al., Reference Emeis, Schulz, Struck, Rossignol-Strick, Erlenkeuser, Howell and Kroon2003; Ziegler et al., Reference Ziegler, Tuenter and Lourens2010), lacustrine (Tzedakis et al., 2004; Tzedakis et al., Reference Tzedakis, Pälike, Roucoux and de Abreu2009; Roucoux et al., Reference Roucoux, Tzedakis, Frogley, Lawson and Preece2008, Reference Roucoux, Tzedakis, Lawson and Margari2011; Litt et al., Reference Litt, Pickarski, Heumann, Stockhecke and Tzedakis2014; Gasse et al., Reference Gasse, Vidal, Van Campo, Demory, Develle, Tachikawa and Elias2015), and speleothem (Ayalon et al., Reference Ayalon, Bar-Matthews and Kaufman2002; Bar-Matthews et al., Reference Bar-Matthews, Ayalon, Gilmour, Matthews and Hawkesworth2003; Bar-Matthews, Reference Bar-Matthews2014) paleoclimate studies. These studies demonstrate warmer and overall wetter conditions than previously thought for MIS 6 (Chedadi and Rossignol-Strick, Reference Cheddadi and Rossignol-Strick1995), concurrent with glacial conditions in northern latitude regions (Ehlers et al., Reference Ehlers, Grube, Stephan and Wansa2011). In fact, the penultimate glacial period corresponds to the late Saalian glaciation in Europe (Ehlers and Gibbard, Reference Ehlers and Gibbard2007) but was not a “typical” glacial period. Characteristic of this atypical nature is the deposition of sapropel S6 in the eastern Mediterranean (Bard et al., Reference Bard, Antonioli and Silenzi2002; Emeis et al., Reference Emeis, Schulz, Struck, Rossignol-Strick, Erlenkeuser, Howell and Kroon2003; Ziegler et al., Reference Ziegler, Tuenter and Lourens2010). Although most of the Mediterranean sapropel occurs generally during interglacial periods, the S6 occurred during a glacial period. The S6 deposition around 165–179 ka resulted from an enhanced low-latitude hydrologic activity through an intensified monsoon activity in eastern Africa, associated with an insolation maxima and a strong precession minima that led to a northward migration of the Intertropical Convergence Zone (Rossignol-Strick and Paterne, Reference Rossignol-Strick and Paterne1999).
On the surrounding landmasses, climate variations during MIS 6 showed a similar response to both regional and global forcing. Climatic variations on the continent were, however, distinctive in amplitude and rhythmicity, emphasized by topographic settings, steep temperature, and rainfall gradients across the Levant. The Yammouneh Lake records from Lebanon showed dry and cold climate conditions at the MIS 7/6 transition (Gasse et al., Reference Gasse, Vidal, Van Campo, Demory, Develle, Tachikawa and Elias2015), followed by more humid conditions and increased rainfall during the deposition of sapropel S6. Wet events during early and mid–MIS 6 were also recorded in the Peqiin and Soreq speleothem records (Ayalon et al., Reference Ayalon, Bar-Matthews and Kaufman2002) and in the Negev region (Vaks et al., Reference Vaks, Bar-Matthews, Ayalon, Matthews, Frumkin, Dayan, Halicz, Almogi-Labin and Schilman2006), during a generally cold but still humid period in the southern Levant. The Lake Van records (eastern Turkey) were less strongly influenced by the environmental conditions that led to sapropel deposition in the Mediterranean but show millennial climate variability intercalated by warm/wet conditions during the early MIS 6 (Stockhecke et al., Reference Stockhecke, Sturm, Brunner, Schmincke, Sumita, Kipfer, Cukur, Kwiecien and Anselmetti2014). Climatic oscillations with low-amplitude variations were also detected in the Ionian (Roucoux et al., Reference Roucoux, Tzedakis, Frogley, Lawson and Preece2008, Reference Roucoux, Tzedakis, Lawson and Margari2011) and Tenaghi-Philippon (Tzedakis et al., Reference Tzedakis, Roucoux, de Abreu and Shackleton2004) pollen profiles and demonstrate the significant downstream impact of North Atlantic millennial-scale climate variability on the hydrology and vegetation in northwestern Greece during MIS 6.
Although several records in northern and southern Europe demonstrated North Atlantic millennial-scale oscillations during MIS 6, only a few high-resolution records show a similar climatic pattern in the eastern Mediterranean for this time period. To expand our understanding of this critical time window in the eastern Mediterranean, the petrography, growth history, and stable isotope geochemistry of a speleothem from the northern Levant (Lebanon) was examined. Stalagmite K2-2010 from Kanaan Cave, located close to the Mediterranean coast, provides a precise U–Th dated and highly resolved terrestrial record of the climate history from the northern Levant. This record spans the late penultimate interglacial period (MIS 7a) and the early penultimate glacial period (MIS 6) at low resolution, and the mid–penultimate glacial period (mid-MIS 6) at high resolution. The new isotope time series is used to compare the climate variability in the northern Levant with high-resolution records from the eastern and western Mediterranean and to gain insight into the major climatic teleconnection patterns and forcing factors of that period.
SITE AND SAMPLE DESCRIPTION
The Kanaan Cave site and climatic setting
Kanaan Cave (33°54.4167 N, 35°36.4167 E) is located on the western flank of central Mount Lebanon, 15 km northeast of Beirut, Lebanon (Fig. 1). Situated only 2.5 km from the Mediterranean coast at an elevation of 98 meters above sea level (m asl), the site has a “maritime influenced” temperate Mediterranean climate (Csa climate in the Köppen-Geiger classification; Peel et al., Reference Peel, Finlayson and McMahon2007). The climate is seasonal, with wet winters (November to February) and dry, hot summers (from May to October) and an annual precipitation typically between 880 and 1100 mm (The World Bank, 2003). The present climate is influenced by the Atlantic westerlies, which bring in moist winds associated with extratropical cyclones. These originate in the Atlantic and track east across the Mediterranean Sea, forming a series of subsynoptic low-pressure systems. In winter, outbreaks of cold air plunging south over the relatively warm Mediterranean enhance cyclogenesis and create the Cyprus Low. These low-pressure systems drive moist air onshore, generating intense orographic rainfall across the mountains of the northern Levant. The duration, intensity, and track of these storm systems strongly influence the amount of rainfall in this region.
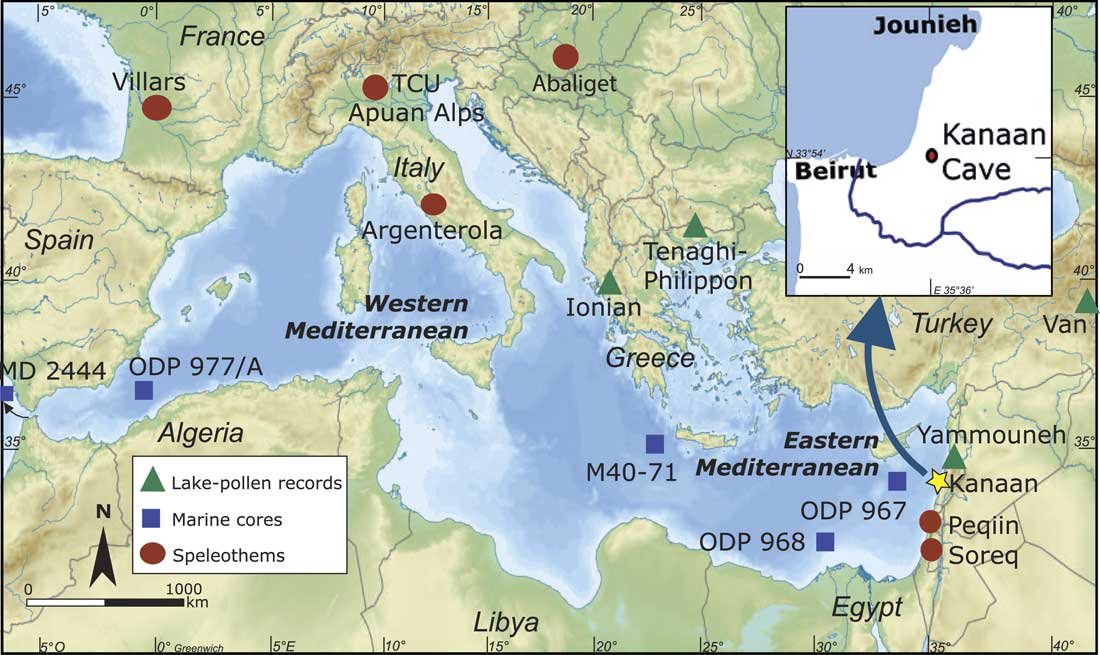
Figure 1 (color online) Location of Kanaan Cave and other Mediterranean palaeoclimatic records spanning Marine Oxygen Isotope Stage (MIS) 6 and MIS 7. Speleothems: Villars Cave (Wainer at al., Reference Wainer, Genty, Daeron, Bar-Matthews, Vonhof, Dublyansky and Pons- Branchu2011, Reference Wainer, Genty, Blamart, Bar-Matthews, Quinif and Plagnes2013), Apuan Alps–Tana Che Urla (TCU) Cave (Regattieri et al., Reference Regattieri, Zanchetta, Drysdale, Isola, Hellstrom and Roncioni2014), Abaliget Cave (Koltai et al., Reference Koltai, Spötl, Shen, Wu, Rao, Palcsu, Kele, Surányi and Bárány-Kevei2017), Argenterola Cave (Bard et al., Reference Bard, Antonioli and Silenzi2002), Peqiin Cave (Bar-Matthews et al., Reference Bar-Matthews, Ayalon, Gilmour, Matthews and Hawkesworth2003), and Soreq Cave (Ayalon et al., Reference Ayalon, Bar-Matthews and Kaufman2002). Lacustrine records: the Yammouneh paleolake (Gasse et al., Reference Gasse, Vidal, Van Campo, Demory, Develle, Tachikawa and Elias2015), Lake Van (Litt et al., Reference Litt, Pickarski, Heumann, Stockhecke and Tzedakis2014), and the Ionian (Roucoux et al., Reference Roucoux, Tzedakis, Frogley, Lawson and Preece2008, Reference Roucoux, Tzedakis, Lawson and Margari2011) and Tenaghi-Philippon (Tzedakis et al., 2004) paleo lakes. Marine cores: M40-71 (Emeis et al., Reference Emeis, Schulz, Struck, Rossignol-Strick, Erlenkeuser, Howell and Kroon2003), ODP 968 (Ziegler et al., Reference Ziegler, Tuenter and Lourens2010), ODP 967 (Rossignol-Strick, Reference Rossignol-Strick1995; Emeis et al., Reference Emeis, Schulz, Struck, Rossignol-Strick, Erlenkeuser, Howell and Kroon2003; Scrivner et al., 2004), ODP 977/A (Martrat et al., Reference Martrat, Grimalt, Lopez-Martinez, Chaco, Sierro, Flores, Zahn, Canals, Jason and Hodell2004, Reference Martrat, Grimalt, Shackleton, de Abreu, Hutterli and Stocker2007), and MD-2444 (Margari et al., Reference Margari, Skinner, Tzedakis, Ganopolski, Vautravers and Shackleton2010, Reference Margari, Skinner, Hodell, Martrat, Toucanne, Grimalt, Gibbard, Lunkka and Tzedakis2014).
The Kanaan Cave is a 162 m long relict conduit discovered during quarrying in 1997. It is developed in the Middle Jurassic Kesrouane Formation, a limestone unit with an average stratigraphic thickness of 1000 m (Dubertret, Reference Dubertret1975). Stalagmite K2-2010 was growing on rimstone dams covering clay sediments in the central part of the Collapse I chamber (Nehme et al., Reference Nehme, Voisin, Mariscal, Gérard, Cornou, Jabbour-Gédéon and Ahmaz2013) and at 20 m from the cave entrance (which did not exist prior to 1997). The passage height at this location is 0.5 m with approximately 50 m of limestone overburden. At the time of collection, the stalagmite received no drip water, although some drip water occurs in other parts of the Collapse I chamber during winter and spring seasons. The cave is generally dry during the summer months. The air temperature in Collapse I chamber is 19±0.5°C during the autumn season.
Petrographic description of sample K2-2010
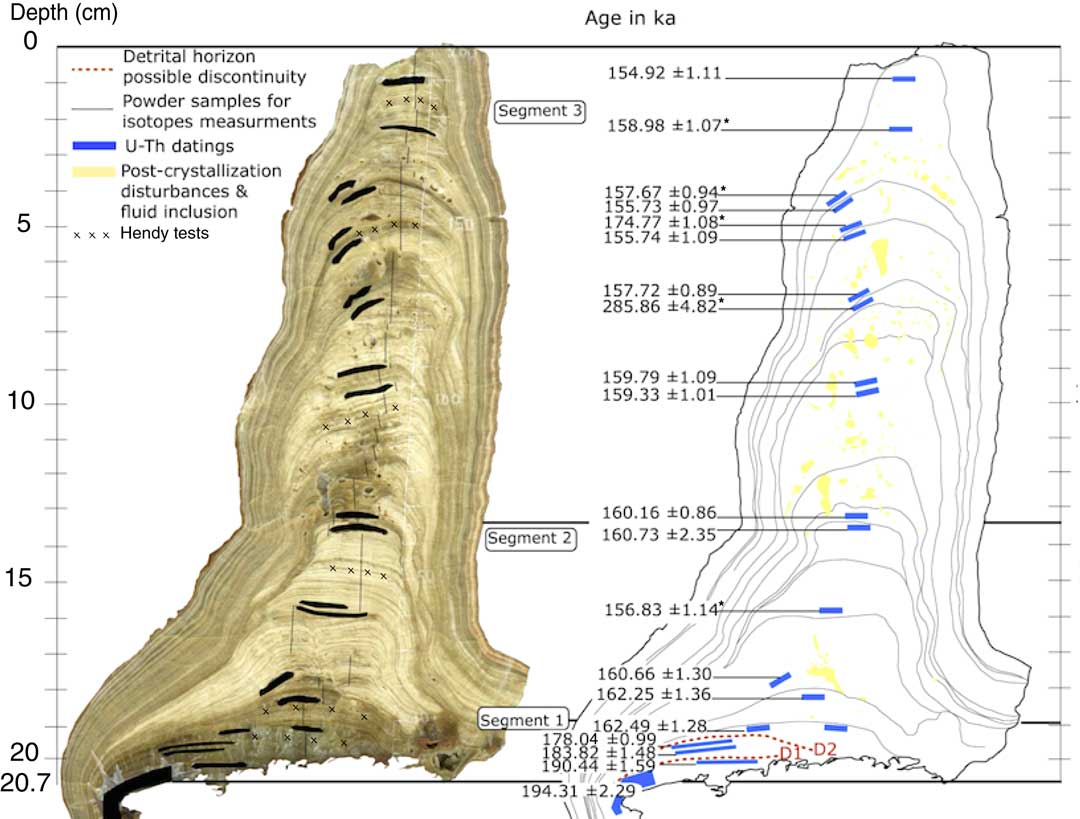
The speleothem K2-2010 is 21 cm long and up to 7 cm in diameter (Fig. 2). In cross section, it displays regular layers of dense calcite with thin (<0.1 mm) laminations in some sections. The speleothem has three clearly defined petrographic segments with different crystal fabrics along its growth axis. The basal segment (segment 1) is 1.5 cm thick (Fig. 2) and comprises uniform translucent carbonate with a columnar fabric (Frisia, Reference Frisia2015), considered closer to isotopic equilibrium. A thin clay layer occurs 19.9 cm below the top of the stalagmite. The middle segment (segment 2) is 5.8 cm thick and displays a translucent columnar microcrystalline fabric from 17.8 to 18.8 cm from the top. Between 13 and 17.8 cm from the top, this turns into a laminated fabric with white porous layers. The topmost segment (segment 3) is 13 cm long, with a general structure characterized by alternating couplets (Genty and Deflandre, Reference Genty and Deflandre1998; Fairchild and Baker, Reference Fairchild and Baker2012) of white porous and compact dark layers. In some parts of the segment, mainly at 8 to 9 cm and 5 to 5.5 cm depth, the white porous layers of the couplets are thicker and interrupted by postcrystallization disturbances. In other parts of segment 3, mainly from 11.2 to 13 cm, 5.6 to 6.8 cm, and at 5 and 3.8 cm, the dark compact layers are denser. Some pores were observed at several levels within segment 3. The base of the speleothem has a diameter of 7 cm, which decreases to 1.6 cm at the top.

Figure 2 (color online) Scan and sketch of speleothem K2-2010 showing the position of the powder samples for isotope measurements and uranium-series dating. The dashed line in segment 1 indicates a possible discontinuity; segment 2 is characterized by a candle-like shape and shows laminae fabrics, not seen in segment 1. Segment 3 shows varying diameters, many fluid inclusions, and postcrystallization disturbances in an alternating laminated texture of white porous and dark compact layers. Ages with asterisk (*) were excluded from the model age.
METHODS
U–Th isotope measurement
Stalagmite K2-2010 was cut along its growth axis and polished using 120–4000 µm silicon carbide sandpaper. Petrographic observations were performed with an optical binocular microscope. Two preliminary U-series dates were obtained at the National Isotope Geosciences Laboratory (NIGL), British Geological Survey, Keyworth (United Kingdom), and at the Geochemistry Laboratory, Earth Science Department, University of Melbourne, Australia, respectively. Subsequently, 18 ages were determined at the University of Minnesota (USA), using the procedures for uranium and thorium chemical separation and purification described in Edwards et al. (Reference Edwards, Chen, Ku and Wasserburg1987) and Cheng et al. (Reference Cheng, Edwards, Shen, Polyak, Asmerom, Woodhead and Hellstrom2013; Reference Cheng, Edwards, Sinha, Spötl, Yi, Chen, Kelly, Kathayat, Wang, Li, Kong, Wang, Ning and Zhang2016). One hundred to 400 mg powdered calcite samples were collected with a dental drill from 17 levels along the growth axis of the speleothem, taking care to sample along growth horizons. Minnesota and NIGL data were obtained on Thermo Neptune Plus multicollector inductively coupled plasma mass spectrometers (MC-ICP-MSs) following procedures modified from Cheng et al. (Reference Cheng, Edwards, Shen, Polyak, Asmerom, Woodhead and Hellstrom2013) at Minnesota and Heiss et al. (Reference Heiss, Condon, McLean and Noble2012) and Smith et al. (Reference Smith, Wynn, Barker, Leng, Noble and Wlodek2016) at NIGL. Melbourne data were obtained on a Nu Instruments MC-ICP-MS using an internally standardized parallel ion-counter procedure and calibrated against the HU-1 secular equilibrium standard following the procedures of Hellstrom (Reference Hellstrom2003). Correction for detrital Th content was applied using initial activity ratios of detrital thorium (230Th/232Th)i of 0.93±0.73. These values and their relative 2σ uncertainty were calculated using a Monte Carlo “stratigraphic constraint” procedure based on the series of U/Th ages (Hellstrom, Reference Hellstrom2006) and compatible with the approach of Roy-Barman and Pons-Branchu (Reference Roy-Barman and Pons-Branchu2016). Under this method, the (230Th/232Th)i and its uncertainty are optimized in order to bring all ages into correct stratigraphic order within their age uncertainties. Ages are calculated from time of analysis (2016) and reported in thousand years before present (ka BP) relative to AD 1950, with an uncertainty at the 2σ level, typically between 500 and 1000 yr (see Table 1). The age model was constructed using the Constructing Proxy Records from Age models (COPRA) routine (Breitenbach et al., Reference Breitenbach, Rehfeld, Goswami, Baldini, Ridley, Kennett and Prufer2012), based on polynomial interpolation and 5000 Monte Carlo simulations.
Table 1. Corrected U/Th ages for the Kanaan K2-2010 stalagmite with uncertainties given in 2σ level. U–Th isotope data are expressed as activity ratios. U decay constants: λ238=1.55125×10⁻¹⁰ (Jaffey et al., 1971); λ234=2.82206×10⁻⁶ (Cheng et al., Reference Cheng, Edwards, Shen, Polyak, Asmerom, Woodhead and Hellstrom2013). Th decay constant: λ230=9.1705×10⁻⁶ (Cheng et al., Reference Cheng, Edwards, Shen, Polyak, Asmerom, Woodhead and Hellstrom2013). Corrected 230Th/234U ages calculated using an initial 230Th/232Th activity ratio of 0.93±0.73 corresponding to an atomic ratio of 5.0±3.9×10⁻⁶. Data with asterisk (*) are outliers and not used to construct the age model.
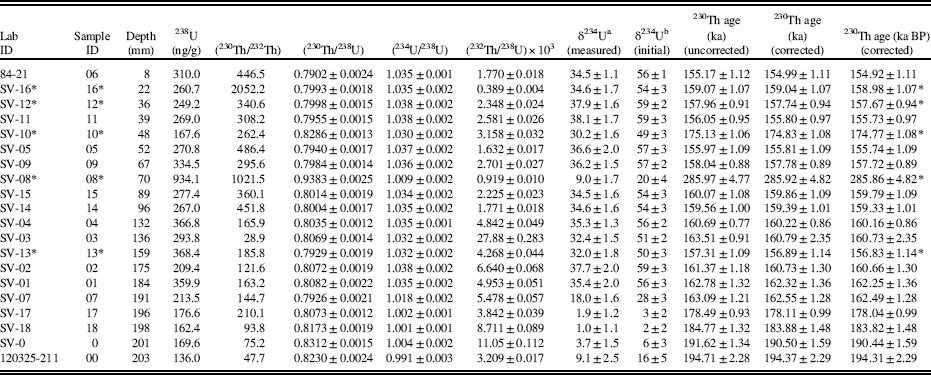
a δ234U=([234U/238U] activity−1)×1000.
b δ234Uinitial was calculated based on 230Th age (T) (i.e., δ234Uinitial=δ234Umeasured×eλ234×T).
Calcite and water stable isotope measurement
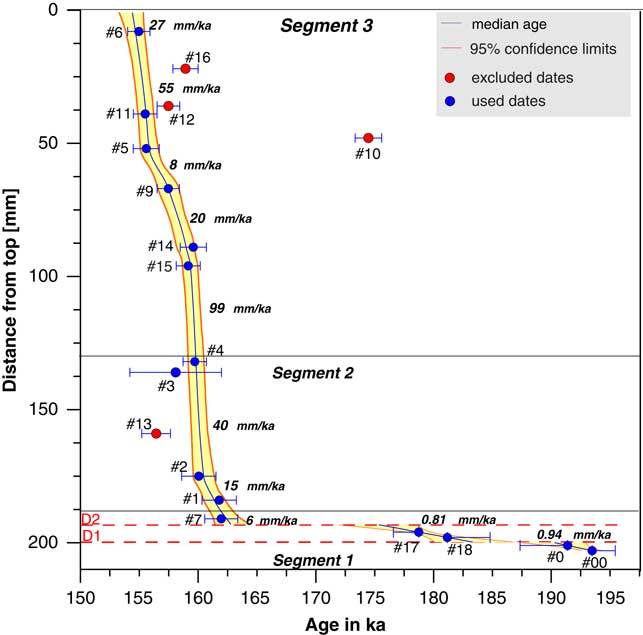
Samples for δ13C and δ18O measurements were drilled along the speleothem central axis with a Merchantek Micromill. Between every sample, the drill bit and sampling surface were blown clean with compressed air. Sampling resolution in K2-2010 was 250 µm. A total of 800 samples and 80 duplicate samples (92% replicability) were analyzed using either a Nu Carb carbonate device coupled to a Nu Perspective MS at the Vrije Universiteit Brussel or a Thermo Gas Bench II connected to a Thermo Delta Advantage mass spectrometer in continuous flow mode at Union College (USA). Analytical uncertainties were better than 0.1 ‰ (1σ) for oxygen and 0.05 ‰ (1σ) for carbon on both instruments. All δ18O and δ13C values are calibrated against the international standard and are reported in per mil (‰) relative to Vienna Pee Dee belemnite. The stalagmite was tested for isotopic equilibrium conditions using recent calcite samples collected in the cave and Hendy tests (Hendy, Reference Hendy1971), carried out at six different levels along the speleothem growth axis (Table 2).
Table 2. Hendy tests conducted on six levels from top (HB) to bottom (HG) using four to five samples on a single lamina for each level.

Six seepage and pool water samples from Kanaan Cave were collected in the autumn–winter season for δ18O and δD measurements in hermetically sealed glass bottles. Isotope measurements were performed at the Vrije Universiteit Brussel on a Picarro L2130-i analyzer using the cavity ring–down spectroscopy (CRDS) technique (Van Geldern and Barth Johannes, Reference Van Geldern and Barth Johannes2012). All values are reported in per mil (‰) relative to Vienna standard mean ocean water. Analytical uncertainties (1σ) were better than 1‰ for δD and 0.1‰ for δ18O.
RESULTS
Chronology
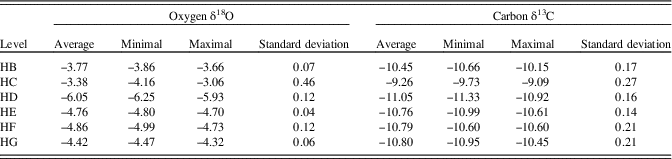
Twenty uranium series dates were obtained from stalagmite K2-2010 (Table 1). The age distribution indicates that K2-2010 grew discontinuously from ca. 194.3±2.3 ka to 154.3±1.2 ka (COPRA age model). In the basal part, two discontinuities, characterized by thin clay layers occur at 20 cm (D1) and 19.3 cm (D2) depth. These hiatuses are estimated to have occurred from 190.2 to 183.3 ka and from 175.3 to 162.7 ka (interpolated ages) (Fig. 3). After 162.7 ka (during the glacial maximum), the stalagmite growth is more continuous.

Figure 3 (color online) Age model of Kanaan record: growth rate of the stalagmite with respect to distance (in millimeters) from the top, using COPRA polynomial statistics model between two consecutive dates.
Age uncertainties are greatest for dates obtained from the lowermost part of the speleothem where segments 1 and 2 (Fig. 2) are in close proximity to the clay horizon on which the speleothem grew, as reflected in their relatively low 230Th/232Th values. The stratigraphic uncertainties are less than 1 mm (i.e., between 0.8 ka and 1.4 ka) for all dates except for the basal age of 194.3±2.3 (2σ), which shows a stratigraphic uncertainty of 2 mm (~2.1 ka). Several dates are not in stratigraphic order (i.e., samples, 8, 10, 12, 16, and 13; Table 1). Most of these samples are located in porous areas of the speleothem. These porous regions may have experienced U–Th open-system behavior (Richards and Dorale, Reference Richards and Dorale2003; Borsato et al., Reference Borsato, Quinif, Bini and Dublyansky2005) via dissolution and recrystallization processes of the primary carbonate (Frisia, Reference Frisia2015) with attendant uranium loss (Ortega et al., Reference Ortega, Maire, Devès and Quinif2005; Hoffmann et al., Reference Hoffmann, Spötl and Mangini2009; Lachniet et al., Reference Lachniet, Bernal, Asmerom and Polyak2012), remobilization, or postdepositional filling of pores (Schwarcz, Reference Schwarcz1989) resulting in out-of-sequence ages. These samples were considered as geologically induced age outliers and excluded from the age model. On the other hand, two couples of U–Th dates (e.g., coupled dates 14 and 15; 1 and 2) have overlapping uncertainties at the 2σ level, both of which were included in the age model.
The age model is based on a polynomial interpolation for each of the three segments of the stalagmite. For the basal segments of the stalagmite, dated between ~194 and ~163 ka and including at least two long hiatuses, interpolation between the available four dates was used to construct the age model, allowing an estimation of an extremely low growth rate from ~194 to 190 ka and ~183 to 175 ka, with at least one hiatus (Fig. 3). The overall finding is that there are very likely multiple hiatuses, which cannot be resolved with four dates. The age model of the basal part of the stalagmite is therefore regarded as only approximate. In the upper part, dated between ~163 and ~155 ka, the interpolation was performed between 11 ages (Fig. 3), permitting calculation of continuous growth rate changes without any drastic inflections in the age-depth plot. The polynomial function assumes that all dates should be traversed (within errors) and generates a monotonously positive depth-age slope (Breitenbach et al., Reference Breitenbach, Rehfeld, Goswami, Baldini, Ridley, Kennett and Prufer2012). The median and 2.5% and 97.5% confidence intervals are based on 5000 Monte Carlo simulations. COPRA handles multiple hiatuses, as long as each is bracketed by at least two dates, which is the case in this sample.
Oxygen and carbon isotope variations
If carbonate precipitation occurs at or near isotopic equilibrium, the calcite δ18O values should not show any significant enrichment along a single lamina away from the growth axis and no covariation between δ18O and δ13C values should occur (Hendy, Reference Hendy1971). Hendy tests performed along six different growth layers (Fig. 2) show less than 1‰ variation for δ18O values and less than 0.5‰ for δ13C values along the tested laminae (Table 2). Therefore, no indication of out-of-equilibrium deposition was detected in the central part of the stalagmite (apex), which is where the samples for isotope analysis were collected from.
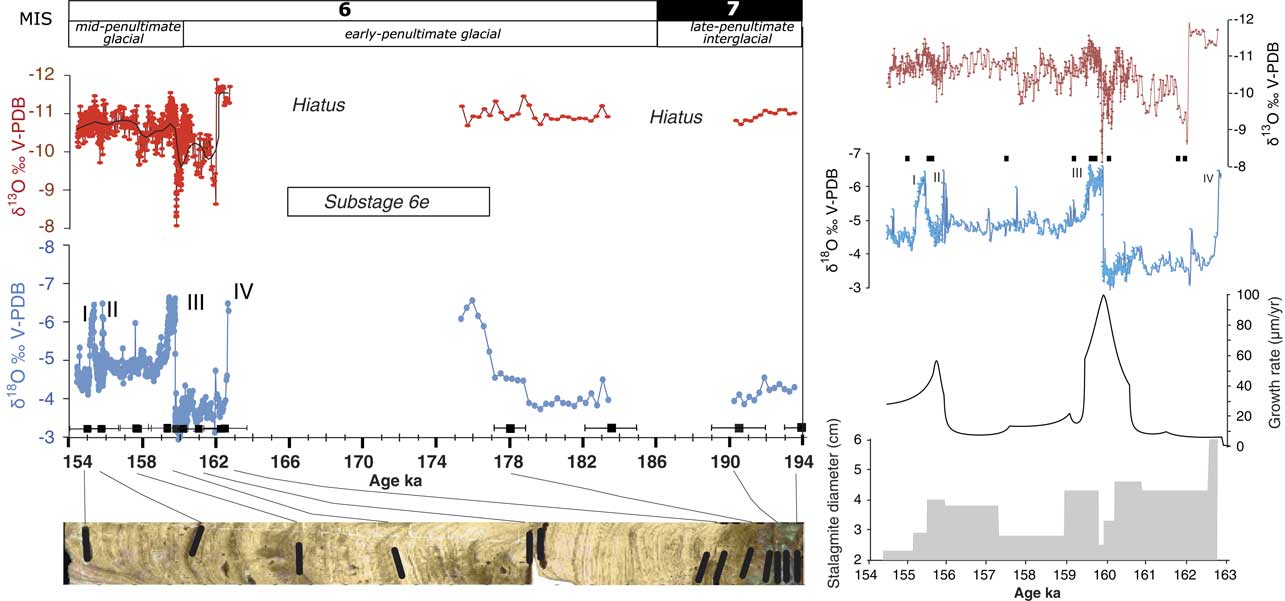
The δ18O values from K2-2010 (Fig. 4) range from −2.9‰ to −6.6‰, with an overall mean of −4.7 ‰. Four distinct peaks in δ18O values can be identified: at 3 cm (peak I), 5 cm (peak II), 13 cm (peak III), and 19.4 cm (peak IV) depth. The δ13C values range from −8.1‰ to −12.2‰ around a mean of 10.6‰. Based on the δ 18O variations, the stalagmite can clearly be divided in a basal part (segment 1) with overall δ18O values of approximately −4.4‰, but lower δ18O values of −4.0‰ to −6.6‰ in the upper part. In segment 2, a positive shift of ~3‰ occurred around 19 cm from top, visible in the δ13C record, albeit less pronounced in the δ18O record. Both δ18O and δ13C begin to decrease between 19 and 13 cm depth, with a decrease to −3.6‰ (mean value) for δ18O and −10.2‰ (average value) for δ13C. The δ13C shift occurs simultaneously with a decrease in stalagmite diameter. Higher δ18O and δ13C values are rather stable compared with the isotopic values in segment 1, but the stalagmite diameter decreases slowly from the bottom to the top of segment 2.
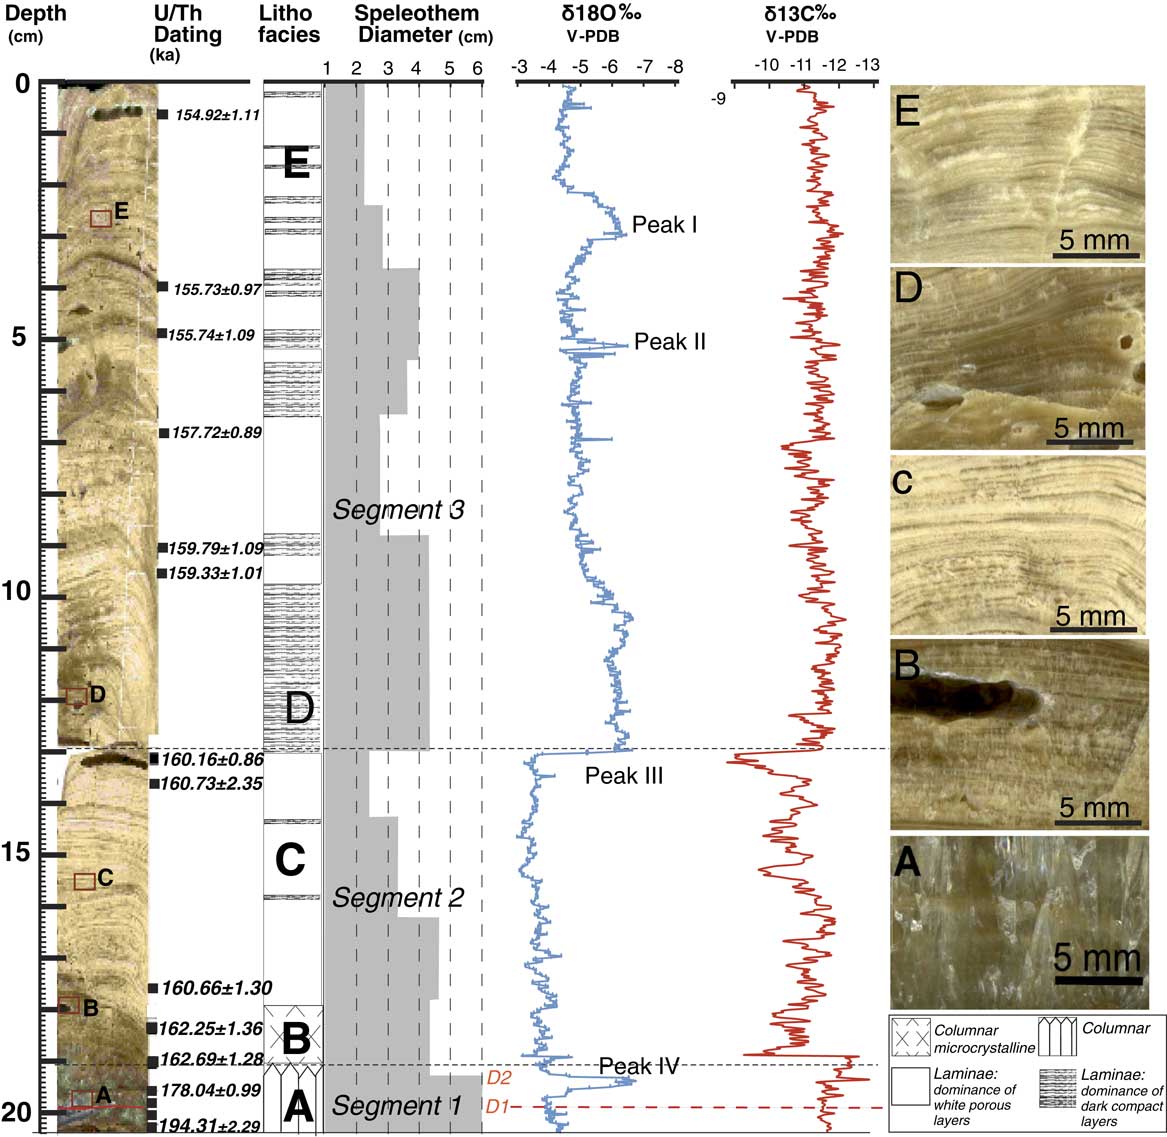
Figure 4 Stratigraphic log of the speleothem K2-2010 showing from left to right: an image scan of the speleothem in the center of the growth axis, the location of the U–Th dating, the lithofacies describing the structure of the calcite fabric, the diameter of the speleothem, and the δ18O and δ13C isotopic data. The red boxes on the left side of the figure show the locations of the photographs (A, B, C, D, and E) on the right side. (A) Columnar fabric. (B) Columnar microcrystalline fabric. (C) Abundance of white porous laminae. (D) Abundance dark compact laminae with fluid inclusion pores. (E) Alternating couplets of white porous and compact dark layers. V-PDB, Vienna Pee Dee belemnite. (For interpretation of the references to color in this figure legend, the reader is referred to the web version of this article.)
At about 13 cm depth (Segment 3), a second shift in δ18O (3‰ amplitude) and δ13C (2.5‰ amplitude) values occurred simultaneously (peak III) with an abrupt increase in stalagmite diameter and a change in petrographic fabric (Fig. 4). However, other changes in diameter do not occur simultaneously with changes in isotopic values as demonstrated within segment 2 (Fig. 4). From 13 to 10 cm depth (basal part of segment 3), δ18O values vary between −5.0‰ and −6‰, and δ13C values decrease from approximately −10.5‰ to approximately −12‰. Whereas δ13C values remained unchanged onward from 10 cm depth to the top (mean approximately −10.7‰), δ18O values showed two rapid significant negative excursions, located respectively at 5 cm (peak II) and 3 cm (peak I) depth. Peak I shows low δ18O values, reaching −6.5‰. The stalagmite diameter in segment 3 follows the δ18O value variability pattern. The diameter is larger at peaks I, II, and III (Fig. 4) and decreases with higher δ18O values.
DISCUSSION
Integrated climatic interpretation of the speleothem proxies
Speleothem growth rate has three significant determinants: (1) calcite saturation (Ca2+ and HCO3 − concentrations), (2) CO2 degassing, and (3) temperature and water supply rate (Dreybrodt, Reference Dreybrodt1988; Baker et al., Reference Baker, Genty, Dreybrodt, Barnes, Mockler and Grapes1998; Genty et al., Reference Genty, Baker and Vokal2001). The water supply rate indirectly depends on the amount of rainwater. Ca-ion concentration depends on host rock dissolution processes governed by soil CO2 concentration. Soil CO2 concentration activity is mainly a function of precipitation (or evapostranspiration) and temperature that would control the biological activity in the soil. In a Mediterranean climate, the precipitation could be more important than temperature as the precipitation amount could be the limiting factor for biological activity. Therefore, warm and humid conditions are generally seen as ideal for speleothem deposition. Cave ventilation, as well as in-cave pCO2 dynamics will govern precipitation processes (Dreybrodt, Reference Dreybrodt1988; Baker and Smart, Reference Baker and Smart1995; Genty et al., Reference Genty, Blamart, Ghaleb, Plagnes, Causse, Bakalowicz and Zouari2006; Breitenbach et al., Reference Breitenbach, Lechleitner, Meyer, Diengdoh, Mattey and Marwan2015).
Speleothem diameter can also be used to infer climatic conditions because it is strongly related to the water supply, drip water flow, and thus the effective precipitation (Dreybrodt, Reference Dreybrodt1988, Reference Dreybrodt1999) leading us to generally relate maximal diameter to wetter periods and minimal diameter to drier periods. Calcite fabrics in speleothems develop under certain environmental conditions. The most important parameters are fluid flow, which is directly dependent on drip rates and the presence of impurities that influence a determined spatial arrangement of crystal habit with dominant forms (Frisia, Reference Frisia2015). The sudden change in crystal habit could be related to rapid shifting in the dripping conditions and behavior such as a change from a homogenous drip rate to irregular with seasonal change (Muñoz-García et al., Reference Muñoz-García, Cruz, Martín-Chivelet, Ortega, Turrero and López-Elorza2016).
Generally, variations in δ13C values can be the result of several factors: soil biogenic CO2, a mix between C3/C4 vegetation, reduced or increased soil vegetation, increased residence time and carbonate dissolution, change in soil respiration rate, and/or seasonality. In the eastern Mediterranean, δ13Ccalcite variations are mainly linked to changes in soil biogenic CO2 through changes in local effective hydrologic conditions (Bar-Matthews et al., Reference Bar-Matthews, Ayalon, Kaufman and Wasserburg1999, Reference Bar-Matthews, Ayalon, Gilmour, Matthews and Hawkesworth2003; Frumkin et al., 2000; Verheyden et al., 2008; Cheng et al., 2015). The δ18Ocalcite is mainly related to effective precipitation and source δ18O (Bar-Mathews et al., Reference Bar-Matthews, Ayalon, Gilmour, Matthews and Hawkesworth2003; Verheyden et al., 2008; Grant et al., Reference Grant, Rohling, Bar-Matthews, Ayalon, Medina-Elizalde, Bronk Ramsey, Satow and Roberts2012; Nehme et al., Reference Nehme, Verheyden, Noble, Farrant, Sahy, Hellstrom, Delannoy and Claeys2015).
The general climate conditions of the penultimate glacial period in the central Levant
The isotope values of Kanaan stalagmite K2-2010 discontinuously cover the penultimate glacial period (Fig. 5). Overall, the Kanaan isotope record for MIS 6 exhibits a higher δ13C and δ18O variability (~4‰ for both) than the record for MIS 5 (Fig. 6) inferred from a stalagmite from the same cave (2.5‰ and 3‰, respectively) (Nehme et al., Reference Nehme, Verheyden, Noble, Farrant, Sahy, Hellstrom, Delannoy and Claeys2015) with infilling conditions, altitude, aspect, and distance from the sea that remained unchanged. The δ18O values of the overall penultimate glacial period are comparable to values found after the glacial inception change from 120 to 84 ka (Nehme et al., Reference Nehme, Verheyden, Noble, Farrant, Sahy, Hellstrom, Delannoy and Claeys2015), invoking similar cold and drier climate conditions than the Eemian period. However, the climatic conditions of the penultimate glacial period were less severe than the full glacial conditions of the MIS 3/4 period in the Levant as seen in the Soreq-Peqiin isotopic record (Bar-Matthews, Reference Bar-Matthews2014). The period from ~160 to ~162 ka was, however, exceptionally dry and cold, with less negative δ18O and δ13C values (Fig. 6).
The first speleothem studies on MIS 6/7 from the Soreq, Peqiin, Tzavoa, and Ma’ale-Dragot Caves demonstrated that the penultimate glacial conditions in the eastern Mediterranean were unstable and relatively cold, but more humid than the last glacial MIS 3 (Ayalon et al., Reference Ayalon, Bar-Matthews and Kaufman2002; Bar-Matthews et al., Reference Bar-Matthews, Ayalon, Gilmour, Matthews and Hawkesworth2003; Vaks et al., Reference Vaks, Bar-Matthews, Ayalon, Matthews, Frumkin, Dayan, Halicz, Almogi-Labin and Schilman2006). Consequently, conditions were sufficiently humid to maintain drip water flow in the epikarst zone, and temperatures warm enough to support the soil CO2 concentration activity, leading to calcite precipitation in the cave during this glacial period. These findings contradict Cheddadi and Rossignol-Strick (Reference Cheddadi and Rossignol-Strick1995), who argued that conditions in the eastern Mediterranean during early MIS 6 were very cold and arid, with precipitation below 200 mm, similar to the last two glacial maxima of MIS 4 and 2.
In the Kanaan speleothem, although δ18O shows important changes during MIS 6 (Fig. 5), δ13C does not exceed −9‰ (with exception of two short excursions to −8‰), reflecting the contribution of carbon from soil CO2 derived from C3 type vegetation. Additionally, the regular changes in δ18O, speleothem diameter, and macroscopic aspect of the speleothem suggest the occurrence of climatic instabilities.

Figure 5 (color online) δ18O and δ13C profiles microdrilled along the growth axis of stalagmite K2-2010 (Kanaan Cave, Lebanon) reported with their radiometric age. The δ13C data are presented with their moving average (black line) to clearly show the isotopic variations during the δ18O peaks I, II, III, and IV. On the right, the isotopic changes from 154 to 163 ka are displayed together with growth rate and stalagmite diameter. V-PDB, Vienna Pee Dee belemnite.
The climate conditions during the early penultimate glacial period (185–163 ka)
The basal part of the stalagmite covers discontinuously the early penultimate glacial period from 163 to 194 ka, with an arrangement of columnar and monocrystalline crystals, attributed by Frisia (Reference Frisia2015) to a slow/very low drip rate (Fig. 5). This is in agreement with growth rates of up to ~1 mm/ka as suggested by Dreybrodt (Reference Dreybrodt1988). During the early penultimate glacial period, two long hiatuses have been detected from ~190 to ~183 ka and from ~175 to ~163 ka (Fig. 5). The second hiatus starts at a time of very negative δ18O values and suggests either a sample-specific signal or a flooding period (Zhornyak et al., Reference Zhornyak, Zanchetta, Drysdale, Hellstrom, Isola, Regattieri, Piccini, Baneschi and Couchoud2011) as the basal part of the speleothem grew on rimstone dams that cover the cave floor of this part of Kanaan Cave. Hiatuses for the same time frame were observed in the Peqiin speleothem record in the southern Levant, interpreted as reflecting a sampling bias rather than periods when speleothem growth actually ceased. However, no such hiatus is observed in the continuous Soreq record for the same period even though both records are controlled by the same eastern Mediterranean moisture source. Therefore, the occurrence of hiatuses in the Kanaan record precludes any regional significance for the growth interruption. Still, the mid–penultimate period is continuous in the Kanaan records and displays high variability in the isotope profile.
Overall, the basal part of the stalagmite suggests unfavorable conditions for speleothem deposition during the end of the penultimate interglacial period and the start of the penultimate glacial period. δ18O values of approximately −4‰ (Fig. 5), previously interpreted as dry conditions (Verheyden et al., 2008; Nehme et al., Reference Nehme, Verheyden, Noble, Farrant, Sahy, Hellstrom, Delannoy and Claeys2015) during the MIS 5 period, are in agreement with Gasse et al., (Reference Gasse, Vidal, Van Campo, Demory, Develle, Tachikawa and Elias2015) who showed that rather dense steppic vegetation around the Yammouneh paleolake reflect a dry and cold episode. By contrast, the δ13C values of approximately −11‰, similar to last interglacial δ13C values (Fig. 6), indicate a significant contribution of soil biogenic CO2 and thus relatively humid (temperate to warm) conditions. Alternatively, low rainfall amounts sufficient to maintain an active soil and vegetation, but too low to sustain a regular effective recharge in the epikarst zone, might be a possible explanation for the observed stable isotope signatures versus growth rate.
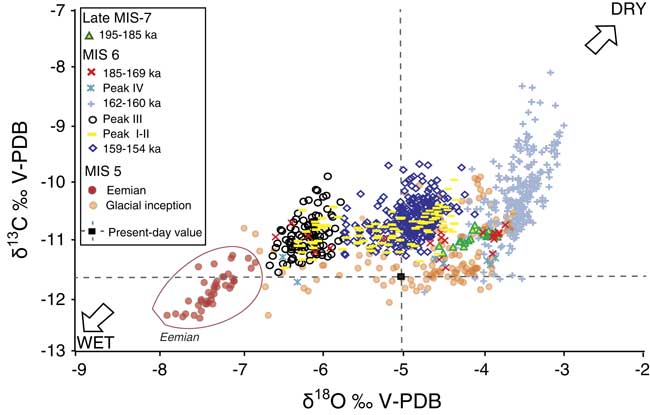
Figure 6 (color online) Cross plot of the stable isotope values from Kanaan Cave from late Marine Oxygen Isotope Stage (MIS) 7 to mid–MIS 6 (this study), MIS 5 (84–129 ka), and late Holocene (Nehme et al., Reference Nehme, Verheyden, Noble, Farrant, Sahy, Hellstrom, Delannoy and Claeys2015). The Eemian period recorded in Kanaan stalagmite lasted from 129 to 126 ka. The last glacial inception after ∼120 ka is marked the beginning of a cooling period at the end of the Eemian period until the beginning of full glacial conditions of MIS 4. V-PDB, Vienna Pee Dee belemnite.
Climatic dynamics during the mid–MIS 6 (163–154 ka)
An important change in speleothem growth rate and macroscopic form occurred around 163 ka. The upper part of the stalagmite shows growth rates ranging from 6 to 99 mm/ka. During the mid–penultimate glacial period (~163 to ~154 ka), δ18O values are low (mean: −5.18‰) compared with the early penultimate (mean: −3.69‰), in agreement with a change toward more humid conditions, as also indicated by the increased growth rate (Fig. 5). The petrographic change from columnar monocrystalline in segment 1 to laminated structures in segments 2 and 3 (Fig. 4C, D, and E) reflects a significant hydrologic change within the epikarst. Layering in stalagmites consists of alternating dark and compact layers with whiter and more porous layers. This petrographic structure has been recorded in speleothems from high latitudes (Treble et al., Reference Treble, Chappell and Shelley2005; Baldini et al., Reference Baldini, McDermott and Fairchild2006; Verheyden et al., 2006; Van Rampelbergh et al., Reference Van Rampelbergh, Verheyden, Allan, Quinif, Keppens and Claeys2014) and tropical-subtropical sites (Shen et al., Reference Shen, Lin, Duan, Jiang, Partin, Edwards, Cheng and Tan2013; Breitenbach et al., Reference Breitenbach, Lechleitner, Meyer, Diengdoh, Mattey and Marwan2015; Ridley et al., Reference Ridley, Asmerom, Baldini, Breitenbach, Aquino, Prufer and Culleton2015). Such lamination is considered as indicative of seasonal changes in cave climate and chemistry (Proctor et al., Reference Proctor, Baker, Barnes and Gilmour2000; Fairchild et al., Reference Fairchild, Baker, Borsato, Frisia, Hinton, McDermott and Tooth2001; Genty et al., Reference Genty, Baker and Vokal2001; Treble et al., Reference Treble, Chappell and Shelley2005; Verheyden et al., 2006; Mattey et al., Reference Mattey, Lowry, Duffet, Fisher, Hodge and Frisia2008; Van Rampelbergh et al., Reference Van Rampelbergh, Verheyden, Allan, Quinif, Keppens and Claeys2014) and in infiltration, which is related to the hydrologic functioning of the aquifer (Genty and Deflandre Reference Genty and Deflandre1998; Fairchild et al., Reference Fairchild, Smith, Baker, Fuller, Spötl, Mattey and McDermott2006; Verheyden et al., 2006; Van Rampelbergh et al., Reference Van Rampelbergh, Verheyden, Allan, Quinif, Keppens and Claeys2014; Breitenbach et al., Reference Breitenbach, Lechleitner, Meyer, Diengdoh, Mattey and Marwan2015). The significance of such structures in a Mediterranean climate is very likely related to the Precipitation - Evaporation (P-E) balance, which determines the amount of effective precipitation (Bar-Matthews et al., 1996; Verheyden et al., 2008; Cheng et al., 2015) that could lead to higher seasonality with laminated structures in stalagmites (Ayalon et al., Reference Ayalon, Bar-Matthews, Frumkin and Matthews2013).
From ∼163 to ∼155 ka, moderate to high growth rates infer a reactivation of water recharge (after the second, long hiatus). This growth rate change corresponds well with an alternation of white porous and dark compact layers (Fig. 4C and D). Although the layer couplets are very similar to seasonal layering as observed in other speleothems (Treble et al., Reference Treble, Chappell and Shelley2005; Baldini et al., Reference Baldini, McDermott and Fairchild2006; Verheyden et al., 2006; Van Rampelbergh et al., Reference Van Rampelbergh, Verheyden, Allan, Quinif, Keppens and Claeys2014), the seasonal character has yet to be confirmed.
Between 163 and 154 ka, oxygen and carbon isotopes evolve synchronously, although with higher amplitude variability in δ18O values. This pattern is marked by several negative excursions in δ18O values (Fig. 5) centered at ∼155.3 ka (peak I), ∼155.8 ka (peak II), ∼159.7 (peak III), and ∼162.7 ka (peak IV). The remarkable agreement between the evolution of growth rate, laminae fabric, and isotopic values (Fig. 5) supports a change in general conditions (i.e., rainfall, temperature, and/or soil conditions). As explained previously and based on earlier speleothem studies in the Levant, the changes in δ18O most probably result from a change in source δ18O and/or rainfall variations. It suggests short phases of wetter conditions during peaks I, II, III, and IV. High growth rates of 99 mm/ka for peak III and 58 mm/ka for peaks I and II are in agreement with higher rainfall amounts. These excursions lasted up to 500 yr and coincide with thicker dark compact laminae (Fig. 5), which might indicate excessive rainfall during a particular season, enough to maintain active infiltration conditions and calcite growth during the whole year. An alternative explanation of the low δ18O values by only temperature changes is rather unlikely, as the observed changes of approximately 2‰ would require a change in temperature of 8°C to 10°C, which seems unreasonably high.
In the same section, the δ13C values are fairly constant. However, two significant δ13C excursions with less negative δ13C values occur at 161.9 and 159.8 ka. Both coincide, within chronological uncertainties, with the stadial periods as defined in the Chinese Hulu-Sanbao record (Fig. 7B). The peak IV (∼162.7 ka) with a noticeable negative shift in δ18O coinciding with negative δ13C values, combined with a slightly higher growth rate (6 mm/ka) than the basal part, suggests a short-lived wetter interval.

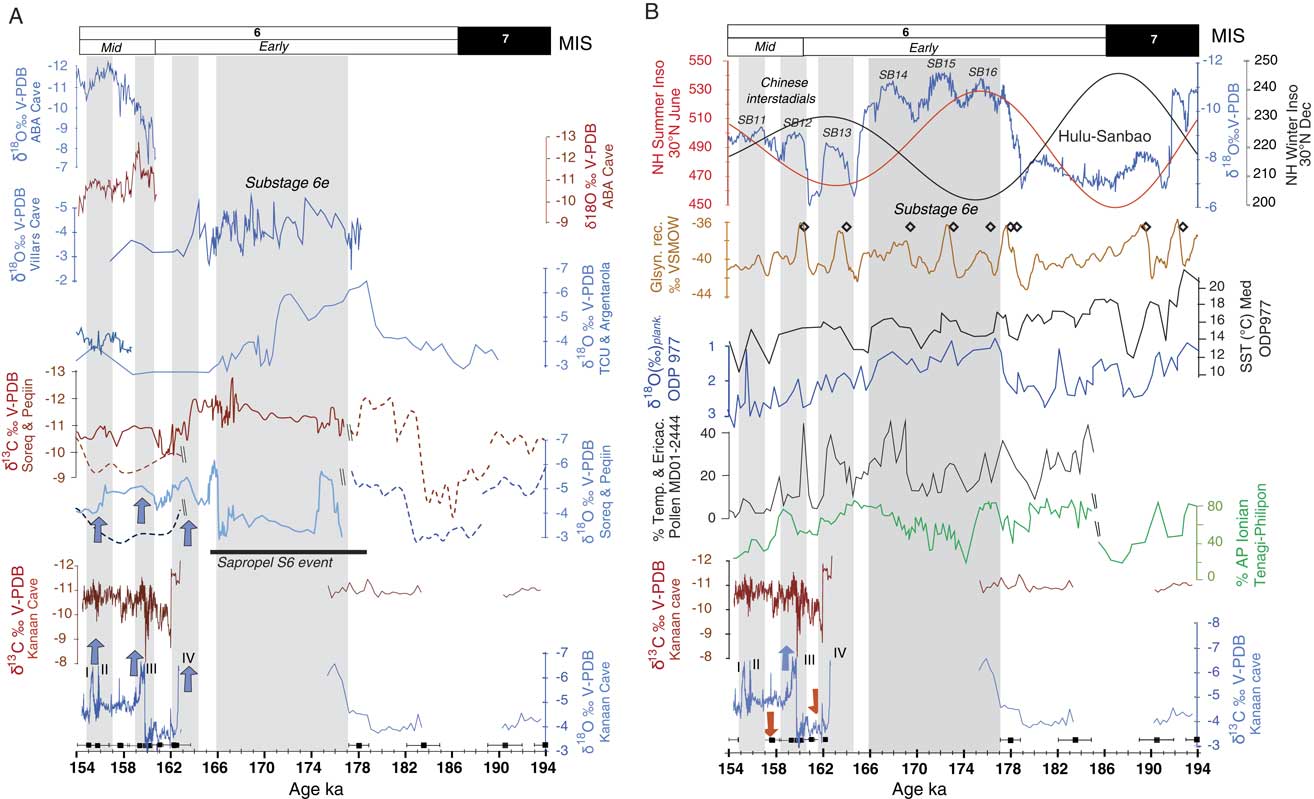
Figure 7 (color online) (A) Kanaan Cave δ18O and δ13C profiles compared with speleothem records in the Mediterranean basin. From bottom to the top: Soreq-Peqiin records (Ayalon et al., Reference Ayalon, Bar-Matthews and Kaufman2002; Bar-Mathews et al., Reference Bar-Matthews, Ayalon, Gilmour, Matthews and Hawkesworth2003), Argentarola and Tana Che Urla (TCU) records in central and northern Italy (Bard et al., Reference Bard, Antonioli and Silenzi2002; Regattieri et al., Reference Regattieri, Zanchetta, Drysdale, Isola, Hellstrom and Roncioni2014), Villars Cave record in southern France (western Europe), and Abaliget (ABA) Cave records in southern Hungary (Koltai et al., Reference Koltai, Spötl, Shen, Wu, Rao, Palcsu, Kele, Surányi and Bárány-Kevei2017). (B) Kanaan Cave δ18O and δ13C profiles compared with continental and marine records in the Mediterranean and Northern Hemisphere. From bottom to the top: percent arboreal taxa records from the Ionian and Tenaghi-Philippon paleolakes (Tzedakis et al., 2004; Roucoux et al., Reference Roucoux, Tzedakis, Frogley, Lawson and Preece2008, Reference Roucoux, Tzedakis, Lawson and Margari2011), percent temperate and Ericaceae taxa from the marine MD01-2444 core (Margari et al., Reference Margari, Skinner, Hodell, Martrat, Toucanne, Grimalt, Gibbard, Lunkka and Tzedakis2014), δ18Oplanktonic records of the ODP 977 core (Martrat et al., Reference Martrat, Grimalt, Lopez-Martinez, Chaco, Sierro, Flores, Zahn, Canals, Jason and Hodell2004), sea surface temperature (SST) (°C) variations from ODP 977 (Martrat et al., Reference Martrat, Grimalt, Lopez-Martinez, Chaco, Sierro, Flores, Zahn, Canals, Jason and Hodell2004) in the western Mediterranean basin, the synthetic Greenland record (Barker et al., Reference Barker, Knorr, Edwards, Parrenin, Putnam, Skinner, Wolff and Ziegler2011) with the Dansgaard-Oeschger synthetic events (open diamonds), the Hulu-Sanbao speleothem (Wang et al., Reference Wang, Cheng, Edwards, Kong, Shao, Chen, Wu, Jiang, Wang and An2008), and the Northern Hemisphere (NH) insolation curve (Berger and Loutre, Reference Berger and Loutre1991). Gray shading indicates warming interstadial periods within the penultimate glacial period. Black squares indicate the age control points on the Kanaan isotope profile. Blue and red arrows highlight wet and dry periods, respectively. MIS, Marine Oxygen Isotope Stage; V-PDB, Vienna Pee Dee belemnite; VSMOW, Vienna standard mean ocean water.
Millennial-scale oscillations during penultimate glacial MIS 6
Millennial- to submillennial-scale climate variability is clearly visible in the Kanaan record for 163 to 154 ka and with pronounced high-amplitude changes in the δ18O profile. The δ18O time series suggests at least three wetter phases (Fig. 7A) at ∼155.3 ka (peak I), ∼155.8 ka (peak II), ~159.7 (peak III), and ∼162.7 ka (peak IV), in agreement with more negative δ13C values and petrographic observations. These periods of low δ18O and δ13C values are interpreted as intervals of higher rainfall. This interpretation is in agreement with interstadial periods identified in the Hungarian Abaliget record (Koltai et al., Reference Koltai, Spötl, Shen, Wu, Rao, Palcsu, Kele, Surányi and Bárány-Kevei2017) and the Italian Tana Che Urla Cave record (Regattieri et al., Reference Regattieri, Zanchetta, Drysdale, Isola, Hellstrom and Roncioni2014), as well as in Villars Cave, France (Wainer et al., Reference Wainer, Genty, Blamart, Bar-Matthews, Quinif and Plagnes2013), and Soreq and Peqiin Caves in Israel (Ayalon et al., Reference Ayalon, Bar-Matthews and Kaufman2002).
The amplitude of the δ18O peaks is 2‰ to 3‰. The δ18O changes in the Kanaan records are slightly higher than the interstadial peaks identified in the Abaliget and Tana Che Urla records, with a 1.5‰ shift decrease in δ18O from 150 to 155 ka. The negative δ18O shifts in the Villars record reach an amplitude of up to 2‰ for the early MIS 6. In the Soreq-Peqiin record, δ18O varies between 1‰ and 1.2‰ during mid–MIS 6 and up to 3‰ for early MIS 6. Indeed, Soreq Cave is located at 400 m asl in the southern Levant, with a lower rainfall gradient than the north Levant. The amplitudes of the δ18O shifts in the Kanaan records are higher and are attributed to the cave’s location at low elevation at 98 m asl, 1.2 km from the Mediterranean Sea, with higher rainfall amounts with isotopically heavier composition reaching the cave. The δ18O change during the warm interstadial peaks most probably reflects a combined change in rainfall amount and seasonality, because large source changes as demonstrated for Soreq and Argentarola Caves during the S6 interval (Rossignol-Strick, 1995; Ayalon et al., Reference Ayalon, Bar-Matthews and Kaufman2002; Bard et al., Reference Bard, Antonioli and Silenzi2002; Bar-Matthews et al., Reference Bar-Matthews, Ayalon, Gilmour, Matthews and Hawkesworth2003; Emeis et al., Reference Emeis, Schulz, Struck, Rossignol-Strick, Erlenkeuser, Howell and Kroon2003; Schmiedl et al., Reference Schmiedl, Mitschele, Beck, Emeis, Hemleben, Schulz, Sperling and Weldeab2003) seem unlikely. Within the age uncertainties of the marine records, the δ18O minima in Kanaan Cave correspond roughly with δ18Oplank.g.bul. peaks (0.8‰ to 1.8‰ amplitude) observed in marine core ODP-977A from the western Mediterranean (Martrat et al., Reference Martrat, Grimalt, Lopez-Martinez, Chaco, Sierro, Flores, Zahn, Canals, Jason and Hodell2004), with an abrupt warming event recorded in the same core at ∼156 ka and with warmer SST-Uk 37 between ∼158 and ∼164 ka. These high SST values combined with δ18Oplank., both indicating changes in the Mediterranean hydrologic budget, suggest a possible link with short global warming phases. In the eastern Mediterranean basin, SSTs were also not lower than 15°C (Emeis et al., Reference Emeis, Schulz, Struck, Rossignol-Strick, Erlenkeuser, Howell and Kroon2003), suggesting that climatic conditions during mid–MIS 6 were certainly not those of an extreme glacial state. These related changes imply that even under glacial conditions, rainfall peaks in the Levant were predominantly governed by westerly cyclones bringing moisture from the Atlantic Ocean with sufficiently temperate SSTs to produce moisture over the Mediterranean Sea and precipitation over the Levantine coast.
According to the age model with decadal resolution (average: 11 yr) for the 163–154 ka period, these wet events lasted 0.64, 0.24, 0.5, and 0.2 ka, respectively. The time interval of the four peaks in the Kanaan record is short compared with the duration of the millennial-scale peaks (0.8 to 2.6 ka) in the Villars record for the early MIS 6. Also, the Abaliget (Hungary) and Tana Che Urla (Italy) speleothem records show an interstadial peak that lasted up to 2 ka (from 154 to 155 ka and from 151.6 to 154 ka, respectively). Within the limit of the age uncertainties, the wet peaks in the Kanaan record invoke a rapid and short response to regional wet pulses in the eastern Mediterranean similar to other European records.
The timing of the four wet δ18O peaks (I–II, III, and IV) are consistent with the timing of smaller isotope excursions in the Peqiin-Soreq record, within the limit of age uncertainties of the Kanaan record (Fig. 7A). Peak I–II in Kanaan Cave coincides with the timing of the interstadial event in Abaliget Cave, Hungary, that lasted from 154 to 155 ka. All interstadial peaks in the Kanaan record coincide, in general, with the arboreal pollen variations in the Ionian (Roucoux et al., Reference Roucoux, Tzedakis, Frogley, Lawson and Preece2008, Reference Roucoux, Tzedakis, Lawson and Margari2011) and Tenaghi-Philippon (Tzedakis et al., 2004) pollen profiles, despite their limited age control (Fig. 7B). Temperate coniferous forest expanded in a broadscale pattern from 185 to 155 ka in northern Greece (Roucoux et al., Reference Roucoux, Tzedakis, Frogley, Lawson and Preece2008). In northern Lebanon, the Yammouneh pollen curve (Gasse et al., Reference Gasse, Vidal, Van Campo, Demory, Develle, Tachikawa and Elias2015) shows widespread temperate deciduous forests (Quercus) during mid–MIS 6, while steppe taxa (Artemisia and Chenopodiaceae) are less significant during the mid–penultimate glacial period, reflecting a generally humid climate that supported elevated vegetation activity in the central Levant, with a more negative δ13C signal. The temperate tree pollen curve from the Portuguese margin (Margari et al., Reference Margari, Skinner, Tzedakis, Ganopolski, Vautravers and Shackleton2010, Reference Margari, Skinner, Hodell, Martrat, Toucanne, Grimalt, Gibbard, Lunkka and Tzedakis2014) and specifically the Ericaceae curve (Hodell et al., Reference Hodell, Channell, Curtis, Romero and Röhl2008, Reference Hodell, Crowhurst, Skinner, Tzedakis, Margari, Maclaghlan and Rothwell2013) reveal millennial-scale variations within the same time frame of Kanaan interstadial peaks (Fig. 7B).
On a global scale, peaks III and IV agree with the timing of D-O-like events in the synthetic Greenland temperature record, GLTsyn (Barker et al., Reference Barker, Knorr, Edwards, Parrenin, Putnam, Skinner, Wolff and Ziegler2011), suggesting a possible atmospheric teleconnection between the North Atlantic and the midlatitude Mediterranean region. Rapid changes of δ18O values in peaks IV, III, II, and I closely track the Chinese SB11, 12, and 13 interstadial periods (Fig. 7B). The Kanaan record clearly shows a double peak (peaks II and I), with a return to drier conditions between both minima, only slightly visible in SB11 and not found in the GLT record (Wang et al., Reference Wang, Cheng, Edwards, Kong, Shao, Chen, Wu, Jiang, Wang and An2008; Cheng et al., Reference Cheng, Edwards, Sinha, Spötl, Yi, Chen, Kelly, Kathayat, Wang, Li, Kong, Wang, Ning and Zhang2016). Similarities do exist in the timing and structure of the Chinese interstadial periods recorded by Hulu Cave stalagmites and the Kanaan record for the period 154–163 ka. This underlines the intrahemispheric teleconnection between the North Atlantic region (including the Mediterranean basin) and the low- to midlatitudes of eastern Asia, which argues for an atmospheric link via the interaction between the westerlies and the subtropics (Cheng et al., Reference Cheng, Zhang, Spötl, Edwards, Cai, Zhang, Sang, Tan and An2012).
CONCLUSIONS
The stalagmite record K2-2010 from Kanaan Cave, Lebanon, provides a multiproxy (stable isotopes and petrography) record at a centennial resolution for the early MIS 6 (194–163 ka) in the eastern Mediterranean and a more highly resolved, multiproxy record in mid–MIS 6 (163–154 ka) that exhibits annual to decadal resolution. The well-constrained age model for the upper part of MIS 6 enables the correlation of climatic variability recorded in the synthetic Greenland and Chinese speleothem records. The main features of the K2-2010 record show the following.
The basal part of the Kanaan records covers discontinuously the early penultimate glacial period from 194 to 163 ka. During the end of the penultimate interglacial period and the start of the penultimate glacial period, the climatic conditions were unfavorable for speleothem deposition with low rainfall amounts sufficient to maintain an active soil and vegetation, but too low to sustain a regular effective recharge.
The mid–penultimate glacial period (∼163 to ∼154 ka) was characterized by wet conditions in the central Levant. The Kanaan speleothem shows higher growth rates and marked laminae, indicating increased water recharge of the epikarst. δ18O and δ13C values evolve coevally, with high-amplitude variations in δ18O values, but relatively stable low δ13C values during the mid–MIS 6. Several sudden negative δ18O peaks (peaks I, II, III, and IV) concomitant with higher growth rates during each peak interval suggest intensified rainfall.
The negative δ18O excursions during mid–MIS 6, combined with higher growth rates and low δ13C, can be associated with increased seasonal rainfall, similar to interstadial intervals. All wet periods (peaks I, II, III, and IV) show isotopic variations comparable with the Peqiin-Soreq and Abaliget speleothem records. The most striking similarity is the alignment of Kanaan peaks during the mid–penultimate glacial period with the D-O–like events observed in the GLT curve, indicating short interstadial periods in the central Levant. The Kanaan δ18O peaks, occurring after the S6 sapropel event, infer a possible link between short regional wet phases in the Levant with global changes in surface and deep-water hydrography, as shown in the pollen records in the eastern and western Mediterranean basins and high-resolution marine records from the Iberian and Portuguese margins.
ACKNOWLEDGMENTS
This study was funded by the mobility fellowship program of the Belgian Federal Scientific Policy (BELSPO). The U.S. National Science Foundation funded Union College’s isotope ratio mass spectrometer and peripherals (NSF-MRI #1229258). We acknowledge the assistance of the EDYTEM Laboratory (UMR-5204 CNRS) and Saint-Joseph University for making stalagmites from Kanaan Cave available for analyses during this study. We would like to thank the support of ALES (Association Libanaise d’Etudes Spéléologiques) members who accompanied us during field trips, as well as Kevin de Bondt and David Verstraten for laboratory analyses. S.R. Noble, A.R. Farrant, and D. Sahy publish with the approval of the executive director, British Geological Survey. We also thank the anonymous reviewers for their constructive comments and reviews.