


INTRODUCTION
The extent of ice sheets at various times in the Pleistocene is important for modeling glacioisostasy and comparing ice volume and glacial history to climate and marine records. New Jersey has the easternmost outcrop belts of pre-Marine Isotope Stage (pre-MIS) 5 glacial deposits in North America. The pre-MIS 5 deposits are from at least two glaciations: an older one with magnetically reversed sediments, and so of early Pleistocene age (pre-780 ka), and an intermediate one of probable MIS 6 age (Illinoian in North American stage terminology). New Jersey also has the terminus of the Hudson-Champlain Lobe, which is the southernmost limit of the last glacial maximum (LGM, indicating the period of maximum glaciation during MIS 2, also known as the late Wisconsinan in North American stage terminology) on the North American east coast (Fig. 1). The age of these advances is thus important for defining the size and position of the Laurentide Ice Sheet.
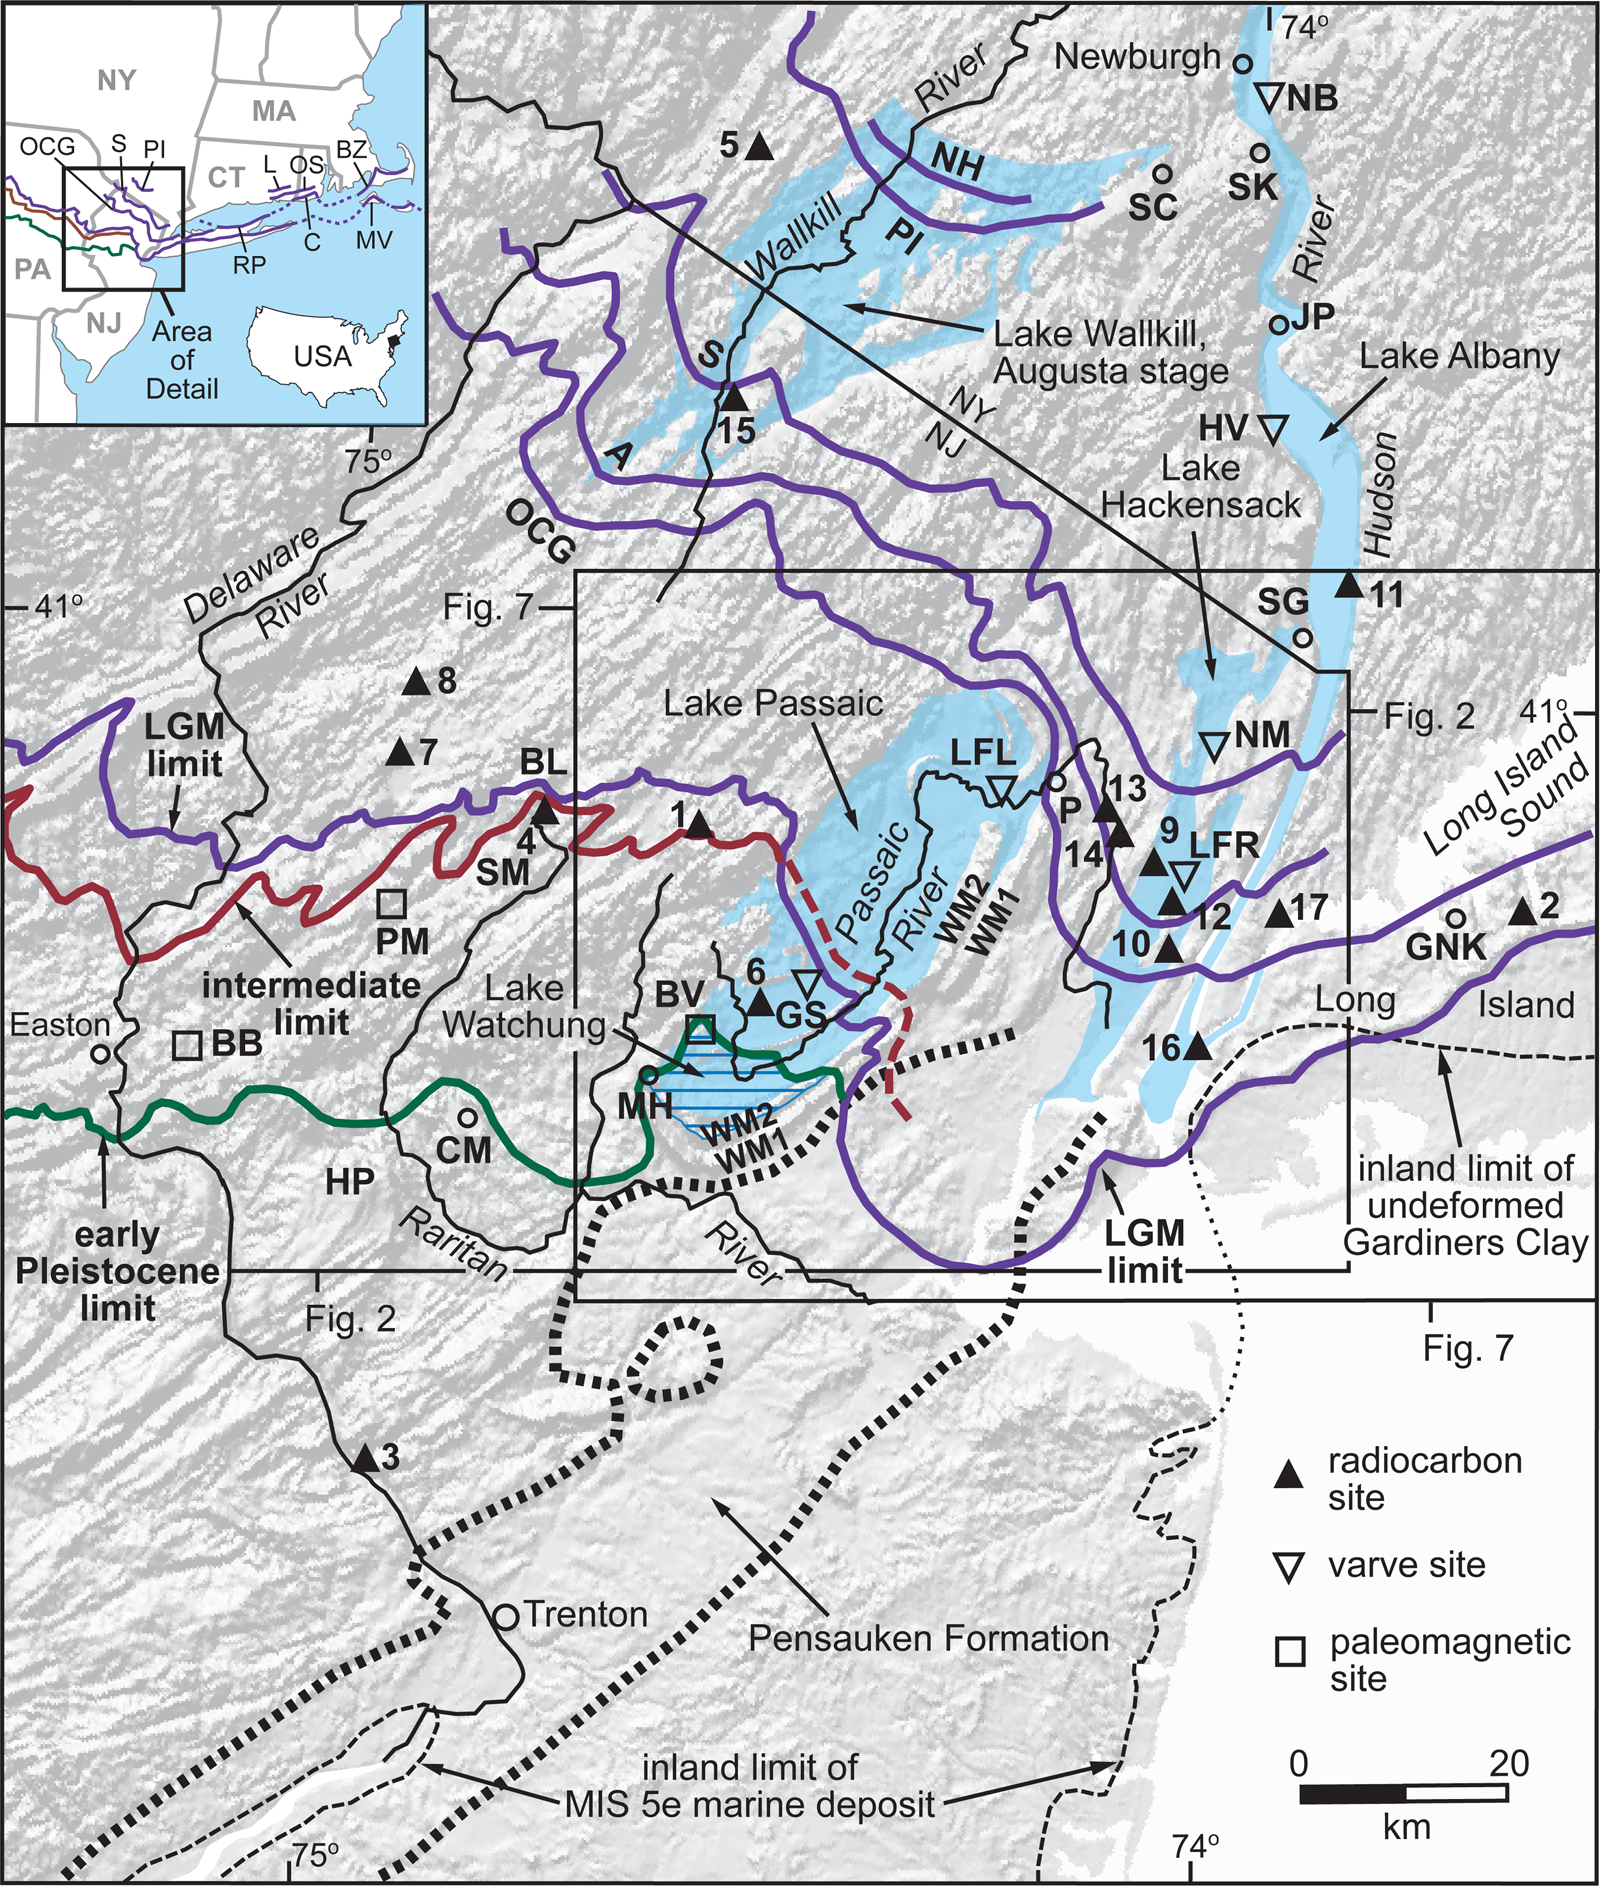
Figure 1. (color online) Ice margins, glacial lakes, and features discussed in text for New Jersey and vicinity. Abbreviations for sites and locales are: BB=Bloomsbury, BL=Budd Lake, BV=Bernardsville, CM=Cushetunk Mountain, GNK=Great Neck, GS=Great Swamp, HP=Hunterdon Plateau, HV=Haverstraw, JP=Jones Point, LFL=Little Falls, LFR=Little Ferry, MH=Moggy Hollow, NB=Newburgh, NM=New Milford, P=Paterson, PM=Port Murray, SC=Schunnemunk Mountain, SK=Storm King, SM=Schooleys Mountain, WM1=First Watchung Mountain, and WM2=Second Watchung Mountain. Abbreviations for ice margins in the Wallkill River valley are: A=Augusta, NH=New Hampton, OCG=Ogdensburg-Culvers Gap, PI=Pellets Island, and S=Sussex. Names for these ice margins are from Salisbury (Reference Salisbury1902) and Connally and Sirkin (Reference Connally and Sirkin1970, Reference Connally, Sirkin, Black, Goldthwait and Willman1973). Abbreviations on inset are: BZ=Buzzards Bay moraine; C=Charlestown moraine; L=Ledyard moraine; MV=Martha's Vineyard; OS=Old Saybrook moraine; RP=Roanoke Point moraine; and OCG, S, and PI as above. LGM, intermediate, and early Pleistocene margins on inset are the same as on the detailed map. Glacial limits in Pennsylvania are from Braun (Reference Braun, Ehlers and Gibbard2004). Ice margins in New England are from Stone and Borns (Reference Stone and Borns1986) and Stone et al. (Reference Stone, Schafer, London, DiGiacomo-Cohen, Lewis and Thompson2005). Numbers next to radiocarbon sites refer to Table 1. Area of Figures 2 and 7 are shown by outline on the detailed map.
Historically, relative age and stage correlations for these deposits have been based on their degree of weathering and soil development (Salisbury, Reference Salisbury1902; Leverett, Reference Leverett1934; MacClintock, Reference MacClintock1940, Reference MacClintock1954; Tedrow and Wilkerson, Reference Tedrow and Wilkerson1953; Krebs and Tedrow, Reference Krebs and Tedrow1957, Reference Krebs and Tedrow1958; Novak et al., Reference Novak, Motto, Douglas and Yaalon1971; Owens et al., Reference Owens, Hess, Denny and Dwornik1983; Ridge et al., Reference Ridge, Braun and Evenson1990a, Reference Ridge, Evenson and Sevon1992). These properties vary from place to place due to differences in topographic position, drainage conditions, lithology, depth of erosion, and incorporation of older weathered material in younger deposits. This variation creates some overlap of the weathering and soil properties of deposits from separate advances. This overlap has led to some uncertainty in determining the number, age, and extent of glaciations. Early workers were unsure whether the pre-LGM deposits represented one, two, or three glaciations (Salisbury, Reference Salisbury1902; Leverett, Reference Leverett1934; MacClintock, Reference MacClintock1940). Later, multiple advances were proposed for the LGM deposits based on the depth of carbonate leaching (MacClintock, Reference MacClintock1954) and on the interpretation of ice-flow indicators and moraine trends (Connally and Sirkin, Reference Connally, Sirkin, Black, Goldthwait and Willman1973). Some of the ice margins inferred for these proposed glaciations, as shown on maps (Leverett, Reference Leverett1934; MacClintock, Reference MacClintock1954; Stone et al., Reference Stone, Stanford and Witte2002), imply flat or reversed ice-surface profiles and so are physically impossible. The same problem with limits based on weathering properties has been noted in eastern Pennsylvania (Ridge et al., Reference Ridge, Braun and Evenson1990a; Braun, Reference Braun, Ehlers and Gibbard2004).
The LGM in this region has been dated using radiocarbon and cosmogenic 10Be and 26Al. The radiocarbon dates include subtill dates from Long Island (Sirkin and Stuckenrath, Reference Sirkin and Stuckenrath1980; Thieme et al., Reference Thieme, Schuldenrein, Herbster and Schabel2003); dates from glacial-lake sediments (Weiss, Reference Weiss1971; Reimer, Reference Reimer1984; Stone et al., Reference Stone, Reimer and Pardi1989, Reference Stone, Stanford and Witte2002; Thieme, Reference Thieme, Hart and Cremeens2003); dates from postglacial fluvial, colluvial, and estuarine sediments (Newman et al., Reference Newman, Thurber, Zeiss, Rokach and Musich1969; Weiss, Reference Weiss1971; Thieme, Reference Thieme, Hart and Cremeens2003; Stanford, Reference Stanford2010; Miller et al., Reference Miller, Sugarman, Stanford, Browning, Baldwin, Buttari, Dunham, Miller, Sugarman and Browning2018); and dates from postglacial lakes and bogs (Harmon, Reference Harmon1968; Connally and Sirkin, Reference Connally and Sirkin1970; Sirkin and Minard, Reference Sirkin and Minard1972; Watts, Reference Watts1979; Parris, Reference Parris1983; Cotter et al., Reference Cotter, Ridge, Evenson, Sevon, Sirkin, Stuckenrath and Cadwell1986; Peteet et al., Reference Peteet, Vogel, Nelson, Southon, Nickmann and Heusser1990, Reference Peteet, Daniels, Heusser, Vogel, Southon and Nelson1993, Reference Peteet, Rayburn, Menking, Robinson, Stone and Vollmer2009, Reference Peteet, Beh, Orr, Kurdyla, Nichols and Guilderson2012; Maenza-Gmelch, Reference Maenza-Gmelch1997a, Reference Maenza-Gmelch1997b; Robinson et al., Reference Robinson, Pigott Burney and Burney2005; Li et al., Reference Li, Yu, Kodama and Moeller2006). Because macrofossils have not been found in any glacial sediments in this region and are no older than 16 ka where recovered from postglacial deposits, the dates that closely bracket the LGM are on minute organic materials disseminated in bulk sediment and so may incorporate old preglacial carbon that could produce ages older than the time of deposition (Cotter at al., Reference Cotter, Ridge, Evenson, Sevon, Sirkin, Stuckenrath and Cadwell1986; Ridge et al., Reference Ridge, Besonen, Brochu, Brown, Callahan, Cook, Nicholson and Toll1999; Peteet et al., Reference Peteet, Rayburn, Menking, Robinson, Stone and Vollmer2009, Reference Peteet, Beh, Orr, Kurdyla, Nichols and Guilderson2012). These bulk dates have been viewed as unreliable, and instead the macrofossil dates have been proposed as deglaciation dates in this region (Peteet et al., Reference Peteet, Beh, Orr, Kurdyla, Nichols and Guilderson2012). However, macrofossils in postglacial sediments were deposited some unknown time after deglaciation and so yield minimum ages for retreat. In some cases, this gap can be thousands of years (Mickelson and Borns, Reference Mickelson and Borns1972). An additional difficulty is that sandy clastic sediments deposited in ponds shortly after deglaciation, before the transition to organic-rich silt and clay deposition, are difficult or impossible to penetrate and sample with hand-coring techniques. This limits access to organic material deposited in those settings shortly after deglaciation. Anchoring radiocarbon dates in a varve chronology and a deglaciation sequence provides a means of circumventing these difficulties and independently testing the validity of bulk-sediment dates.
Cosmogenic exposure ages have been measured on outcrops and boulders just north of the LGM terminal moraine in north-central New Jersey (Clark et al., Reference Clark, Bierman and Larsen1995; Corbett et al., Reference Corbett, Bierman, Stone, Caffee and Larsen2017), on boulders and outcrops at and north of the LGM terminal moraine on Long Island and in the lower Hudson valley (McCabe et al., Reference McCabe, Kelly, Schaefer, Schwartz, Hanson and Benimoff2006), and on boulders on the LGM terminal and recessional moraines in southern Massachusetts and southeastern Connecticut (Balco et al., Reference Balco, Stone, Porter and Caffee2002; Balco and Schaefer, Reference Balco and Schaefer2006). The accuracy of these dates is affected by uncertainties in isotope production rates, inheritance, shielding, and surface erosion. Originally, cosmogenic ages relied on a theoretical production rate (Balco et al., Reference Balco, Stone, Porter and Caffee2002; Balco and Schaefer, Reference Balco and Schaefer2006). Since 2009, a regional production rate for the northeastern United States has been established based in part on calibration using regional radiocarbon dates and varve records (Balco et al., Reference Balco, Briner, Finkel, Rayburn, Ridge and Schaefer2009; Ridge et al., Reference Ridge, Balco, Bayless, Beck, Carter, Dean, Voytek and Wei2012; Corbett et al., Reference Corbett, Bierman, Stone, Caffee and Larsen2017). More recent cosmogenic dates based on the regional production rate are older than the original cosmogenic ages based on the theoretical production rate but are usually within the uncertainties of the dating technique. Anchoring radiocarbon dates in a varve and deglaciation chronology thus helps improve regional cosmogenic production rates and the accuracy of cosmogenic ages.
The goals of this paper are to build on prior efforts in order to: (1) refine the extent of pre-LGM glaciations in New Jersey based on new detailed mapping, (2) report new data and interpretations of the age of the pre-LGM glaciations, (3) detail the timing and pace of LGM glaciation by integrating radiocarbon dates and varve counts with reconstructions of ice margins and lake-drainage events based on new detailed mapping, and (4) compare the New Jersey chronology of glaciation to ice-core and marine records of Laurentide glaciation and to regional LGM dates based on the North American Varve Chronology and cosmogenic exposure ages.
METHODS
The glacial limits, recessional ice margins, and lake histories presented here are based on detailed geologic mapping. This mapping is published at 1:100,000 scale as a statewide summary (Stone et al., Reference Stone, Stanford and Witte1995, Reference Stone, Stanford and Witte2002) and at 1:24,000 scale to provide full local details. Maps and supporting data are accessible at the New Jersey Geological and Water Survey website (http://www.nj.gov/dep/njgs) and at the National Geologic Map Database (http://ngmdb.usgs.gov/ngmdb/ngmdb_home.html). Local details of the LGM glaciation based on the detailed mapping are discussed in Cotter et al. (Reference Cotter, Ridge, Evenson, Sevon, Sirkin, Stuckenrath and Cadwell1986), Stanford and Harper (Reference Stanford and Harper1991), Stanford (Reference Stanford1993), and Witte (Reference Witte1997, Reference Witte, Inners and Fleeger2001). The maps include subsurface stratigraphy based on records of several thousand wells and borings on file at the New Jersey Geological and Water Survey and at the New Jersey Department of Environmental Protection, and on approximately 20 power-auger, core, and push borings drilled to depths of as much as 40 m in support of the mapping. Logs of the wells and borings are provided on the published 1:24,000 scale maps. The subsurface data are particularly important in determining glacial-lake histories and identifying pre-LGM deposits where they are covered by LGM deposits in eastern New Jersey.
Glacial deposits were mapped using the morphosequence approach (Koteff, Reference Koteff and Coates1974; Koteff and Pessl, Reference Koteff and Pessl1981). Morphosequence mapping uses topographic, sedimentologic, and geomorphologic criteria to establish the relative ages of glaciolacustrine and glaciofluvial deposits. This technique is especially useful for the LGM deposits, which are well preserved. In New Jersey, till moraines mark the intermediate and LGM terminal ice margins and a few recessional LGM margins. But recessional moraines in New Jersey, and in the northeastern United States generally, are smaller and less continuous than in the midcontinent, so mapping and correlation of ice-marginal morphosequences among different glacial-lake and fluvial basins are essential tools for deciphering deglaciation history here.
Paleomagnetic (remanent magnetization) measurements were obtained from multiple samples of laminated fine sand, silt, and clay at Bloomsbury, New Jersey, and of till at Port Murray, New Jersey (BB and PM, respectively, on Fig. 1), along with alternating field (AF) demagnetization. Paleomagnetic samples were collected in two different ways dictated by the consolidation and coarseness of the sediment. In the laminated deposits at Bloomsbury, oriented blocks of clay and silt were cut out of bedding planes with a knife and then trimmed in the lab to fit in 2.5-cm-OD-×-2.4-cm-long styrene plastic tubes that were sealed with clear 5-minute epoxy (Ridge, Reference Ridge2012). At Port Murray the till was too consolidated and stony for efficient excavation with a knife. A gas-powered concrete saw was used to first cut a horizontal plane in the till. The plane was then vertically cut to free individual oriented blocks that were trimmed to 2.5-cm cubes with an X-ACTO knife. The cubes were sprayed with quick-drying enamel to preserve their integrity. All remanence directions were measured at Tufts University on a Molspin Ltd. Minispin spinner magnetometer using a 24-s spin routine. Remanences were read for all samples after AF demagnetization using a Sapphire Instruments SI-4 single axis demagnetizer at peak AF steps of 0 (natural remanent magnetization, NRM), 2.5, 5, 10, 20, 30, 40, 50, 60, 70, 80, 100, and 120 mT. Above 20 mT a repeat AF demagnetization and remanence reading was obtained with the sample rotated 180° on each axis to test for any bias created by the demagnetizer. Averages of the duplicate measurements were used as remanence values at each step.
Results of the mapping, paleomagnetic analyses, radiocarbon dates, and stratigraphic studies for the three glaciations are presented below from oldest to youngest. The New Jersey record is correlated to regional and continental glacial events, and to marine and ice-core data, in the Discussion section.
EARLY PLEISTOCENE GLACIATION
Intensely weathered till (Port Murray Formation, till facies, of Stone et al., Reference Stone, Stanford and Witte2002, hereafter, “Port Murray till”), and a few stratified deposits (Port Murray Formation, stratified facies, of Stone et al., Reference Stone, Stanford and Witte2002) occur in a 30-km-wide belt south of the LGM and intermediate limits (Fig. 2). These deposits were first recognized as pre-LGM glacial deposits by Salisbury (Reference Salisbury1892, Reference Salisbury1902), although he was uncertain of their extent in the eastern part of the state. They were named “Jerseyan” by Chamberlin and Salisbury (Reference Chamberlin and Salisbury1906), who considered them to be pre-Kansan (pre-MIS 14). Salisbury (Reference Salisbury1902), Leverett (Reference Leverett1934), and MacClintock (Reference MacClintock1940) considered them to be Kansan (MIS 12 or 14; the traditional North American Kansan stage includes several advances of middle Pleistocene age, including the pre-Illinoian B and C glaciations of Richmond and Fullerton [1986] and possibly earlier advances [Boellstorff, Reference Boellstorff1978], and the name is now obsolete) based on weathering properties and degree of erosion.
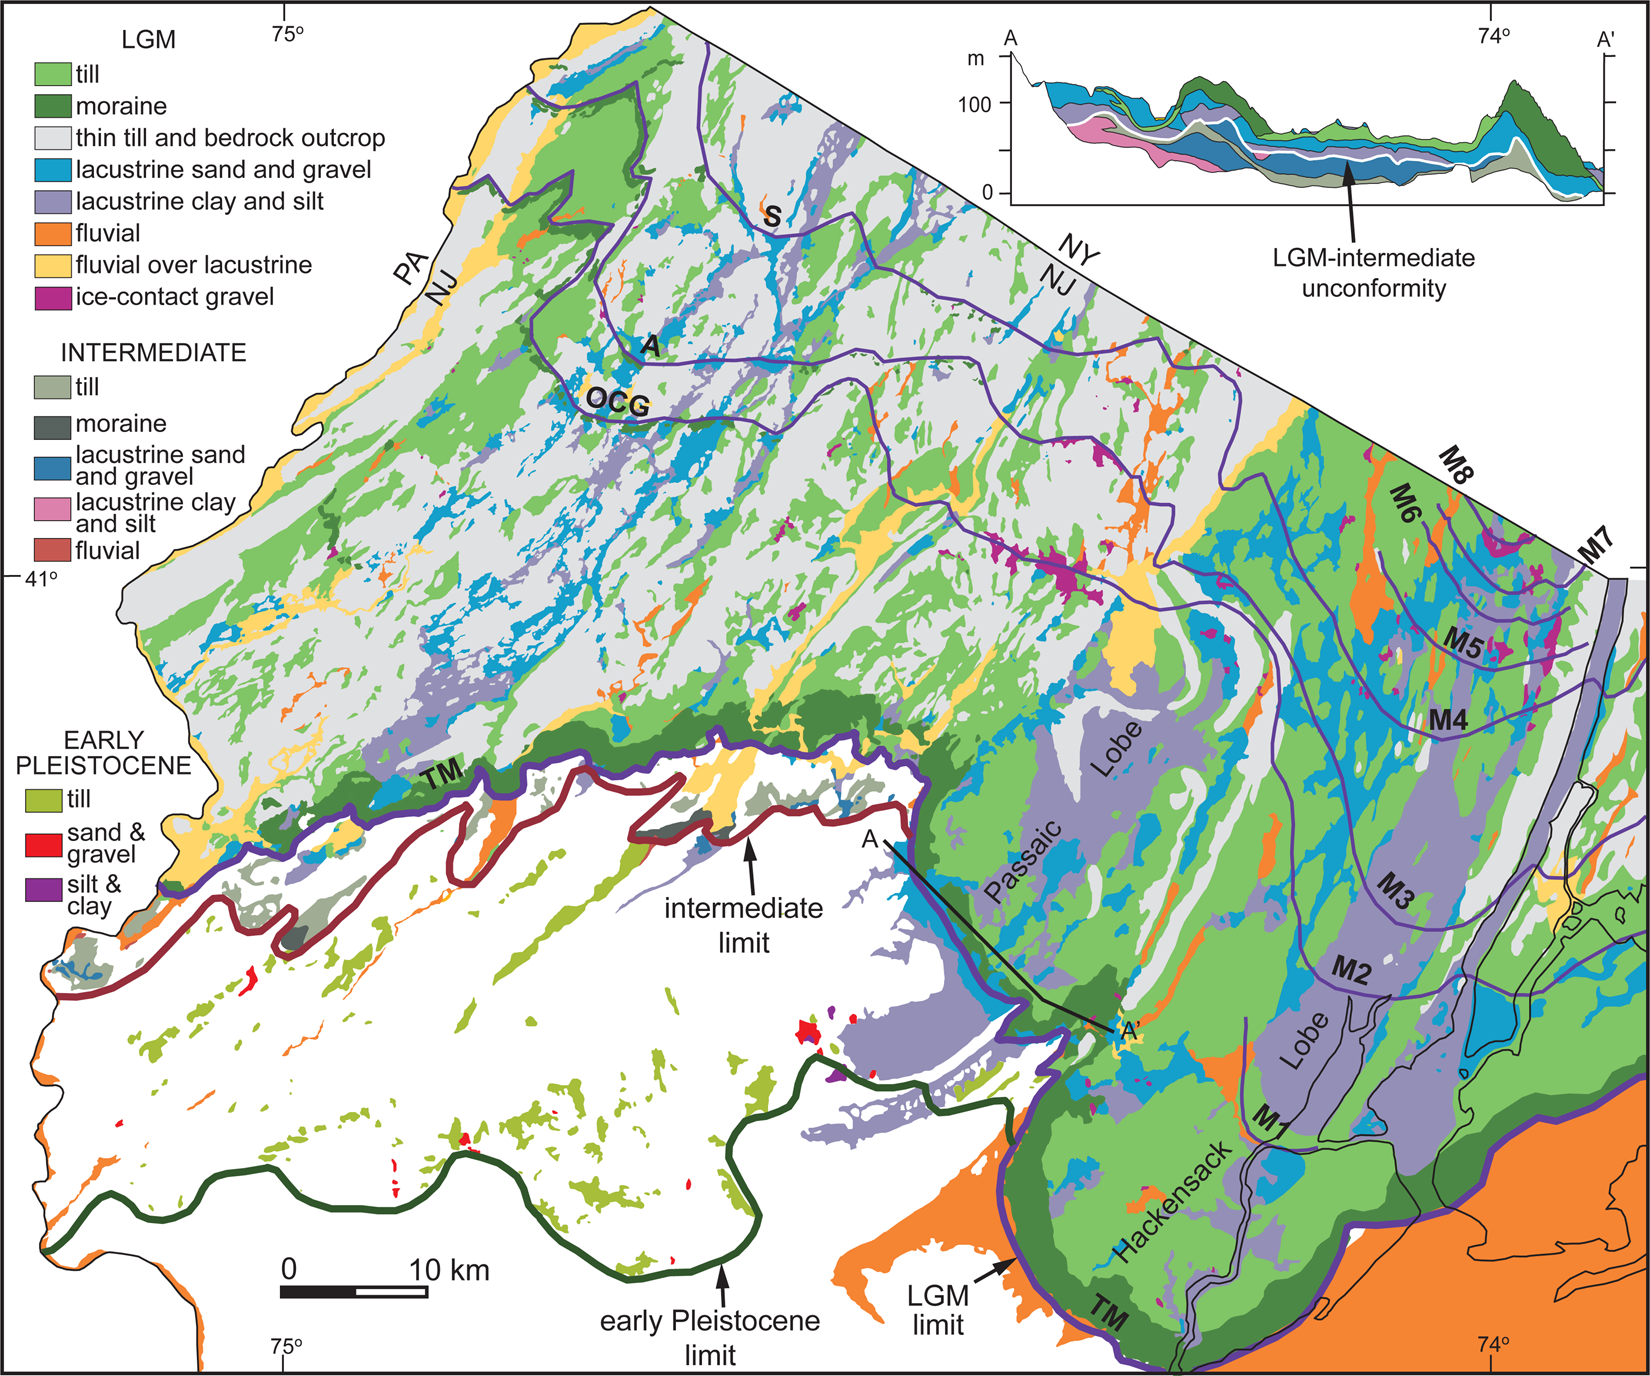
Figure 2. Glacial deposits of New Jersey and adjacent parts of New York City. Uncolored areas are weathered rock, colluvium, and nonglacial fluvial deposits. Section AA' shows LGM till and lacustrine deposits over similar deposits of intermediate age (below white line) in the Lake Passaic basin, based on well and boring data in Stanford (Reference Stanford1991, Reference Stanford2006) and Stone et al. (Reference Stone, Stanford and Witte1995, Reference Stone, Stanford and Witte2002). Abbreviations on ice margins are: TM=terminal moraine; M1–M8 as on Figures 6 and 7; A, OCG, and S as on Figure 1. Deposits in New Jersey are from Stanford et al. (Reference Stanford, Witte, Harper, Scott, Herman and Girard1996a) and Stone et al. (Reference Stone, Stanford and Witte2002), with revisions. Deposits in New York are based on Merrill et al. (Reference Merrill, Darton, Hollick, Salisbury, Dodge, Willis and Pressey1902).
Gneiss, arkosic sandstone, shale, and siltstone clasts are decomposed or have thick (>1 cm) weathering rinds for the full depth of the till or gravel (up to 20 m) (Salisbury, Reference Salisbury1902; Stone et al., Reference Stone, Stanford and Witte2002). Quartz sandstone clasts are crumbly, many quartzites are easily fractured along grain boundaries, and carbonate clasts are completely decomposed (Salisbury, Reference Salisbury1902; Stone et al., Reference Stone, Stanford and Witte2002). Chert and some quartzites have surface staining but are otherwise unweathered. A few high-standing, well-drained gravel deposits show less clast decomposition. Clay minerals in the matrix are predominantly kaolinite, gibbsite, and illite (Krebs and Tedrow, Reference Krebs and Tedrow1958; Owens et al., Reference Owens, Hess, Denny and Dwornik1983).
Till and a few glaciolacustrine and glaciofluvial deposits are preserved in patches on flat to gently sloping uplands and interfluves or on high rock-cut terraces in main valleys that are 20 to 60 m above the present valley bottom (Salisbury, Reference Salisbury1902; Stone at al., Reference Stone, Stanford and Witte2002). They are absent from similar flats lower in the landscape, so their distribution is not the result of the deposits having been eroded from all slopes in the present landscape but rather indicates that the valleys have been incised into bedrock to depths of as much as 60 m since the glaciation. Solution collapse has lowered some till patches on carbonate rock and mixed the till with silty-clayey carbonate-rock residuum, but the topographic setting is clear on other rock types like shale and gneiss. The extensive weathering and erosion may have obscured evidence for multiple tills. There may have been more than one early glacial advance, although no sections showing multiple tills have been observed.
Early Pleistocene glacial limit and Lake Watchung
The early Pleistocene limit, based on the distribution of till and erratics, is lobate. It extends southward in the Raritan River valley and loops over or around the bordering uplands of First and Second Watchung Mountain, Cushetunk Mountain, and the Hunterdon Plateau (WM1, WM2, CM, and HP, respectively, on Fig. 1). The limit in eastern New Jersey was previously considered uncertain (Salisbury, Reference Salisbury1902; Stone et al., Reference Stone, Stanford and Witte2002; Ridge, Reference Ridge, Ehlers and Gibbard2004) due to incomplete mapping and questions about the age of the till in this area but is now known from detailed mapping (Stanford, Reference Stanford2007, Reference Stanford2008). The looping of the margin as mapped from the till limit in the Raritan River valley indicates an ice-surface profile of 6 to 15 m/km, compared to 30 to 70 m/km for the LGM. These values are determined by projecting elevations of the ice margin as it rises on uplands within a single ice lobe (not along an interlobate reentrant) to a center line parallel to ice flow in the axis of the lobe. For the early Pleistocene glacier this was done for two valleys in the Raritan River basin: one between Cushetunk Mountain and Second Watchung Mountain and one between Cushetunk Mountain and the Hunterdon Plateau (see Fig. 1). The LGM values are based on the same method applied to loops of terminal and recessional moraines in seven valleys.
Till-like sediments in central New Jersey south of the early Pleistocene limit have been interpreted as glacial (Rocky Hill till of Neumann, Reference Neumann1980; Fullerton, Reference Fullerton1986). These sediments consist of rounded pebbles and cobbles of quartz, quartzite, chert, and a few weathered sandstone and gneiss clasts on the surface and mixed into the upper 1 to 2 m of reddish brown to yellowish brown silty clay to sandy silty clay formed by weathering of shale and diabase bedrock. The clasts are identical to Neogene fluvial gravel present as erosional remnants in higher topographic position within the area of the proposed glacial deposit (Salisbury and Knapp, Reference Salisbury and Knapp1917; Newell et al., Reference Newell, Powars, Owens, Stanford and Stone2000; Stanford, Reference Stanford2002). No clasts occur above the level of the Neogene fluvial deposits. Thus, the proposed till is likely a fluvial lag mixed into the weathered-rock residuum by bio- and cryoturbation and does not record a glacial advance.
The lobate early Pleistocene ice front dammed several valleys, including the southwestern Passaic River basin and several tributary valleys in the Raritan River basin, to form glacial lakes. Glacial Lake Watchung in the Passaic basin is the largest of these (Stanford, Reference Stanford1997) (see Fig. 1). This lake was impounded between the ice margin and the curved ridge of Second Watchung Mountain (WM2 on Fig. 1), which forms the basin divide. An eroded ice-contact delta deposited in this lake, with laminated clay and silt at its base, is preserved on a drainage divide near Bernardsville, New Jersey (BV on Fig. 1). The laminated clay is magnetically reversed. Preliminary results from thermal demagnetization treatment show that seven of nine samples of the clay are reversed, with declination between 180° and 210° (C. Lepre, personal communication, 2010). The delta is high standing (30 m above the divide on bedrock) and the upper parts are well drained, so the upper gravel is not as weathered as other early Pleistocene deposits. For this reason, some previous workers considered it to be of Illinoian (MIS 6) age (Leverett, Reference Leverett1934; Stone et al., Reference Stone, Stanford and Witte2002), leading to the mapping of an Illinoian ice lobe extending 12 km south of the LGM limit in the Passaic River basin. However, in addition to the magnetically reversed lake clay, an early Pleistocene age is indicated by the elevation of the delta top, which records a lake level at 135–140 m. This level requires an ice dam in the Moggy Hollow gap (elevation 110 m) at the west end of Second Watchung Mountain (MH on Fig. 1), which caused a higher gap at 130–135 m to the south beyond the glacial limit to serve as the lake spillway. Such a dam was present only during the early Pleistocene glaciation, as indicated by Port Murray till on Second Watchung Mountain south of Moggy Hollow, not during the intermediate glaciation, which terminated 20 km north of Moggy Hollow (see Fig. 1).
Paleomagnetic measurements
In western New Jersey, a nearly horizontal (dipping <5°) 25-cm-thick bed of reddish yellow, weathered, and laminated fine sand to silty clay within fluvial pebbly sand that sits on a rock-cut terrace 25 m above the present valley bottom of Pohatcong Creek, a tributary of the Delaware River near Bloomsbury, New Jersey (BB on Fig. 1), also has a reversed remanent magnetization (Fig. 3). The site is in a south-draining valley within the early Pleistocene glacial limit, so the sediments are either glaciofluvial deposits of that advance or fluvial deposits younger than that glaciation. Although this site has a relatively weak signal from a low magnetite content, 33 of 38 samples from six different horizons have a reversed inclination and southerly declination that is stable after AF demagnetization to at least 80–100 mT (see Fig. 3A and 3B). The by-products of weathering (oxy-hydroxide minerals), and likely a small fraction of multi-domain ferromagnetic particles, carry a normal polarity overprint that is almost completely removed in all but five of the specimens measured after AF demagnetization above 30 mT (see Fig. 3A). Removal of this normal overprint occurs long before most samples reach their median destructive field at 50–60 mT (sample BLM2G is an exception on Fig. 3B but still has reversed polarity). Samples that start with normal polarity in NRM measurements become reversed during AF demagnetization up to 30 mT and higher and exhibit a tighter clustering than NRM results upon AF demagnetization (see Fig. 3C to 3E). This stable reversed polarity appears to be from the time of deposition. The few samples that maintain a normal polarity are from the top of the silty clay unit, where reorientation due to weathering and ground water movement are likely most intense. The deposit has a declination of ~170° and a low reversed inclination of ~ 15° (see Fig. 3D and 3E). Inclinations are likely low due to combined flattening during deposition and by weathering and compaction after deposition, which is the norm in rapidly deposited and laminated glacial sediment (Ridge et al., Reference Ridge, Brennan and Muller1990b; Ridge, Reference Ridge2012).

Figure 3. Paleomagnetic results from laminated silty clay at Bloomsbury, New Jersey (BB on Fig. 1). A. Vector (Zjderveld) plots of stepwise alternating field (AF) demagnetization of representative samples (samples are prefixed “BLM”). B. Normalized remanence of stepwise AF demagnetization of representative samples. C. Polar plot of natural remanent magnetization (NRM) directions. D. Polar plot of remanence directions after AF demagnetization in a peak field of 30 mT. E. Polar plot of remanence directions after AF demagnetization in a peak field of 60 mT. Note: on all polar plots lower hemisphere (normal) results are in black, while upper hemisphere (reversed) results are in red. (For interpretation of the references to color in this figure legend, the reader is referred to the web version of this article.)
At the type section of the Port Murray till at Port Murray, New Jersey (PM on Fig. 1), magnetic directions measured in a stony, compacted, and highly weathered till with abundant pebble ghosts (62 samples, 3 horizons) do not appear to have a well-defined or stable remanence direction (Fig. 4). The till does not carry a remanence that is stable after AF demagnetization above 60–70 mT (see Fig. 4A and 4B), and demagnetized remanence directions (both declination and inclination) are more scattered than NRM directions when a modern overprint is removed (see Fig. 4C to 4E). Only six samples showed reversed inclinations after progressive AF demagnetization in a peak field of up to 60 mT (see Fig. 4D and 4E). Unlike the reversed inclinations at Bloomsbury, only one sample with a reversed direction has a southerly declination that would be expected with a reversed polarity (120–240°) at the time of deposition. All other samples have normal polarity (NRM and AF demagnetized) with widely varying declinations that average close to the modern field direction at the site (348.4° in 1998). Inclinations also appear to be poorly defined with NRM values (see Fig. 4C) clustering close to the modern field direction (68.4° in 1998). Low inclination due to depositional processes and post-depositional flattening by weathering and compaction would be expected in this unit. While inclination often decreases with AF demagnetization to 60 mT, many samples maintain high inclinations (>55°) after demagnetization, contributing to an increase in scatter of remanence directions (see Fig. 4D and 4E). The till has a much higher mean NRM intensity (by about an order of magnitude) than the clay/silt deposits described at Bloomsbury above (89.1 mA/m ± SD 57.8 at Port Murray vs. 8.4 mA/m ± SD 2.5 at Bloomsbury), which is mostly carried by coarse (multi-domain) particles of magnetite that could not orient to an ancient field during till deposition. This viscous magnetism is easily removed at very low peak fields (<20 mT) during AF demagnetization but the remaining remanence has a poorly defined direction. Two things likely contribute to a remanence not representing a signal fixed at the time of deposition by the magnetic orientation of particles in the till: (1) the abundant clasts in the till, which are too large to have oriented magnetically during till deposition but still carry a stable remanence related to their ancient rock formation, overprint a weaker matrix remanence carried by fine particles that may have been aligned to a field at the time of deposition; and (2) given the intense weathering of the till, fine magnetite particles (<4μ, pseudo-single and single domain) that might have carried a matrix remanence were altered by weathering and at least partly replaced by oxy-hydroxides with a later and weaker chemical remanence, thus replacing any well-defined detrital remanence from the time of wet till deposition. As a result, we judge these samples to have a poorly clustered normal polarity, but they are inconclusive for determining the polarity of the magnetic field at the time of deposition. We report them only as a cautionary note to others investigating clast-rich, weathered ancient till deposits for their magnetic polarity characteristics. Additionally, detailed mapping has not identified a boundary between, or distinct weathering characteristics of, two or more separate sets of glacial deposits within the area of early Pleistocene glaciation.

Figure 4. Paleomagnetic results from stony weathered till at Port Murray, New Jersey (PM on Fig. 1). A. Vector (Zjderveld) plots of stepwise alternating field (AF) demagnetization of representative samples (samples are prefixed “PMT”). B. Normalized remanence of stepwise AF demagnetization of representative samples. C. Polar plot of natural remanent magnetization (NRM) directions. D. Polar plot of remanence directions after AF demagnetization in a peak field of 30 mT. E. Polar plot of remanence directions after AF demagnetization in a peak field of 60 mT. Note: on all polar plots lower hemisphere (normal) results are in black, while upper hemisphere (reversed) results are in red. (For interpretation of the references to color in this figure legend, the reader is referred to the web version of this article.)
Palynologic and stratigraphic relations
Pollen in lake sediment at Budd Lake, New Jersey (BL on Fig. 1), is also indicative of an early Pleistocene age. Budd Lake occupies a headwater valley on Schooleys Mountain (SM on Fig. 1), a gneiss plateau. It is just outside both the LGM and intermediate glacial limits but is 20 km north of the early Pleistocene limit and so is well positioned to contain a long Pleistocene record. A buried valley trending northeasterly from the lake is filled with as much as 90 m of LGM and pre-LGM till and lacustrine sediment (Stanford et al., Reference Stanford, Stone and Witte1996b). A core of the upper 18 m of sediment in the lake, taken for a palynologic study, penetrated 10 m of gyttja over 8 m of gray finely laminated clay (Harmon, Reference Harmon1968). An additional 10 m of underlying clay was probed but not sampled. The upper 14 m of the core consists of an interval of Pinus (pine), Picea (spruce), and a little Quercus (oak) pollen at the base with a date of 27 cal ka (all finite radiocarbon dates in the text are reported in median calibrated years; full data are in Table 1) overlain by a spruce zone with no oak pollen that marks the peak cold at LGM, in turn overlain by postglacial spruce, pine, and oak zones (Harmon, Reference Harmon1968) (see “LGM Glaciation” section below). In the 14 to 18–m interval of the core, gray laminated clay contains exotic pollen taxa that account for 64 out of 480 total grains counted at seven levels. The exotic taxa include Ephedra, Platycarya, Pterocarya, Podocarpus, Dissacites, and Phyllocladus, and others not identified, in an assemblage of Pinus (pine) (32%), Picea (spruce) (6%), Betula (birch) (3–4%), Quercus (oak) (10%), and Alnus (alder) (3%). The exotic taxa are intolerant of severe frost where they survive today in East Asia and central America (Greller and Rachele, Reference Greller and Rachele1984) and, although present in Neogene deposits, are generally absent from Quaternary deposits in eastern North America (Groot, Reference Groot1991). Harmon (Reference Harmon1968) interpreted the exotic pollen as redeposited, but the only Neogene source deposits in the region are fluvial and coastal sediments more than 50 km to the south of, and more than 180 m lower in elevation than, Budd Lake. The absence of these taxa in all other Pleistocene deposits in the region suggests that if the pollen are redeposited, they originated in a local glacial bog or lake because there are no karst or other nonglacial basins on the gneiss uplands in which Neogene pollen could be preserved. If the pollen are not reworked from older deposits and represent the vegetation extant at the time of the early Pleistocene glaciation, or reestablished after that glaciation, then their absence from all other Quaternary deposits in the region suggests an earliest Pleistocene age for the advance. The first Laurentide advance is dated by ash stratigraphy and cosmogenic burial ages in the Missouri River valley in the midcontinent to ~2.4 Ma (Boellstorff, Reference Boellstorff1978; Balco et al., Reference Balco, Rovey and Stone2005; Balco and Rovey, Reference Balco and Rovey2010). This glaciation was followed by a long hiatus of ~1 Ma before the next advance (Balco and Rovey, Reference Balco and Rovey2010), perhaps providing a window for frost intolerant plants to reestablish.
Table 1. Radiocarbon dates bracketing the last glacial maximum (LGM) glaciation in New Jersey and vicinity. Dates are calibrated using Reimer and others (Reference Reimer, Bard, Bayliss, Beck, Blackwell, Bronk Ramsey and Buck2013) and CALIB 7.1 (Stuiver and others, Reference Stuiver, Reimer and Reimer2019). NA = data not reported or not measured, AMS = accelerator mass spectrometry.

At its southern limit the Port Murray till overlies the Pensauken Formation (Salisbury and Knapp, Reference Salisbury and Knapp1917), a fluvial quartz-chert gravel (the extent of the Pensauken Formation is shown by the heavy dotted line on Fig. 1). The Pensauken has weathering properties and topographic position like that of the early Pleistocene glacial deposits, contains pollen with the Neogene exotics Pterocarya and Engelhardia (Stanford et al., Reference Stanford, Ashley, Russell and Brenner2002), and interfingers downvalley to the southwest with Pliocene marine deposits in the Delmarva peninsula south of New Jersey (Pazzaglia, Reference Pazzaglia1993). It has been interpreted as glacial outwash (Salisbury and Knapp, Reference Salisbury and Knapp1917) but pollen and plant fossils in the formation indicate a temperate climate (Berry and Hawkins, Reference Berry and Hawkins1935; Stanford et al., Reference Stanford, Ashley, Russell and Brenner2002). Also, the predominantly quartz-chert gravel composition indicates that the Pensauken is derived largely from fluvial erosion of older Miocene gravels, which are also of quartz and chert composition and were formerly widespread in the New Jersey region at elevations above that of the Pensauken (Owens and Minard, Reference Owens and Minard1979; Stanford, Reference Stanford2010), rather than from glacial erosion of inland bedrock. Paleocurrent measurements, slope of the fluvial plain, and accordance of the plain to wind gaps in northeastern New Jersey (Owens and Minard, Reference Owens and Minard1979; Martino, Reference Martino1981; Stanford, Reference Stanford2010), indicate that the Pensauken was deposited by a regional trunk river flowing southwesterly along the inland edge of the Coastal Plain from southern New England (see Fig. 1). Geomorphic and stratigraphic relations of the Pensauken to Pleistocene fluvial and estuarine deposits in central New Jersey indicate this trunk river was diverted seaward to the southeast in the New York City area in the early Pleistocene. The diversion was most likely caused by the early Pleistocene glacier, which advanced across the Pensauken valley at the diversion site (see Fig. 1) (Stanford, Reference Stanford2010). The diversion of this Pliocene river by the early Pleistocene glacier also suggests an earliest Pleistocene age for this glaciation.
Also indicating an earliest Pleistocene age is the >20 m depth of incision into rock following the glaciation in both the Raritan River and Delaware River basins (see Fig. 1). Basin-wide incision in this passive-margin coastal setting requires a long-term sustained decline of relative sea level. Such a sustained decline of ~30 m in the early Pleistocene is indicated by progressive interglacial enrichment in the global marine benthic δ18O record between 3.5 and 1.5 Ma (Lisiecki and Raymo, Reference Lisiecki and Raymo2005; Hansen et al., Reference Hansen, Sato, Russell and Kharecha2013), supplemented in the mid-Atlantic coastal region by epeirogenic uplift related to passage of the North American plate over the subducted Farallon slab, which is modeled at ~10 m in the New Jersey area since 3 Ma (Rowley et al., Reference Rowley, Forte, Moucha, Mitrovica, Simmons and Grand2013). After 1.5 Ma, in contrast, successive interglacial high stands were at similar eustatic height, particularly in the middle and late Pleistocene (Spratt and Lisiecki, Reference Spratt and Lisiecki2016), inhibiting sustained incision.
An earliest Pleistocene glaciation followed by a long period of erosion and valley deepening through the early Pleistocene and into the middle Pleistocene would also explain the absence or scarcity of early Pleistocene till in eastern North America north of the LGM limit (Fullerton, Reference Fullerton1986; Stone and Borns, Reference Stone and Borns1986; Muller and Calkin, Reference Muller and Calkin1993; Shilts and Caron, Reference Shilts and Caron2019). Early Pleistocene glacial deposits do not occur north of the LGM limit in New Jersey, or farther north, because the deep valleys in which they could be protected from subsequent glacial erosion, particularly valleys trending transverse to ice flow, were cut after their deposition.
Braun (Reference Braun, Ehlers and Gibbard2004) describes glacial-lake sediments with both reversed and normal polarity outside the intermediate glacial limit in eastern Pennsylvania and infers at least two pre-MIS 6 glaciations, one in the early Pleistocene with reversed polarity and one in the middle Pleistocene with normal polarity. The lake sediments are weathered and the normally polarized samples, unlike the reversed samples, do not show inclination shallowing (Sasowsky, Reference Sasowsky and Braun1994), and it seems possible that the normal polarities may have been acquired during weathering rather than during deposition. There are no stacked till sequences showing normal over reversed stratigraphy, so the deposits may instead record only a single early Pleistocene advance equivalent to that in New Jersey.
Farther west, magnetically reversed glacial-lake deposits in central Pennsylvania (Lake Lesley; Gardner et al., Reference Gardner, Sasowsky and Schmidt1994; Ramage et al., Reference Ramage, Gardner and Sasowsky1998), and in western Pennsylvania, West Virginia, eastern Ohio, and northern Kentucky (Lake Tight and Lake Monongahela; Jacobsen et al., Reference Jacobsen, Elston and Heaton1988; Bonnett et al., Reference Bonnett, Noltimier, Sanderson, Melhorn and Kempton1991) also document early Pleistocene glaciation south of the LGM limit, as in New Jersey.
INTERMEDIATE GLACIATION
Deposits of the intermediate glaciation include till (Flanders and Bergen Tills of Stone et al., Reference Stone, Stanford and Witte2002, which are contemporaneous lithic variants) and glaciolacustrine and glaciofluvial deposits (Lamington Formation of Stone et al., Reference Stone, Stanford and Witte2002) that are exposed in a 10-km-wide belt south of the LGM limit in western New Jersey and occur in the subsurface beneath deposits of LGM age in the central Passaic River basin (see Fig. 2). They also occur beneath till of LGM age in the cores of some drumlins in New Jersey and to the northeast in New England. The deposits of the intermediate glaciation infill present-day valleys and preserve subdued constructional morphology, including moraine ridges, deltas, and fluvial plains. On uplands, till of the intermediate glaciation is eroded from steep slopes but remains on moderate and gentle slopes. The intermediate deposits are less weathered than early Pleistocene sediments. Gneiss, sandstone, and mudstone clasts generally have weathering rinds <0.5 cm thick and carbonate clasts are fully decomposed; quartzite and chert are unweathered (MacClintock, Reference MacClintock1940; Stone et al., Reference Stone, Stanford and Witte2002). Soils generally lack the reddish yellow clay-rich B and C horizons of the early Pleistocene deposits, although locally reddish B horizons have developed on stable surfaces (Ridge et al., Reference Ridge, Evenson and Sevon1992).
These deposits were recognized by Salisbury (Reference Salisbury1902) who considered their weathering properties and thought it possible that some or most of them were from a brief advance of LGM ice beyond the terminal moraine that incorporated older weathered material. Leverett (Reference Leverett1934) correlated them, and similar deposits in Pennsylvania, with the Illinoian (MIS 6) deposits in the midwestern United States. MacClintock (Reference MacClintock1940) proposed that the deposits might be from both Illinoian and early Wisconsinan (MIS 4) advances, based on the degree of decomposition of gneiss pebbles. This proposed MIS 4 till was informally termed the Budd Lake till by Minard and Rhodehamel (Reference Minard, Rhodehamel and Subitzky1969) and Fullerton (Reference Fullerton1986).
A radiocarbon date of 40.7 cal ka on peat overlying glaciolacustrine clay of this advance, in turn overlain by 2 m of colluvium near Dover, New Jersey (Stanford, Reference Stanford2012) (site 1, see Fig. 1, Table 1), proves a pre-MIS 2 age. Several lines of evidence suggest an MIS 6 age. In the Delaware River valley, the intermediate glaciofluvial deposit forms a terrace that is preserved in several bench-like erosional remnants against the valley wall ~10 m higher than the LGM plain in the narrow valley from north of Easton to Trenton (Ridge et al., Reference Ridge, Evenson and Sevon1992; Stanford et al., Reference Stanford, Witte, Braun and Ridge2016). The terrace grades topographically to fluvial terraces in the Trenton area (“upper terrace” of Stanford et al., Reference Stanford, Witte, Braun and Ridge2016) that in turn are onlapped by an estuarine deposit south of Trenton (Stanford et al., Reference Stanford, Witte, Braun and Ridge2016) (see Fig. 1). This estuarine deposit (Cape May Formation, unit 2 of Newell et al., Reference Newell, Powars, Owens, Stanford and Stone2000) forms a coastal terrace with a top elevation of +8 m and is dated to MIS 5 by amino-acid racemization (AAR) ratios of shells in the deposit in the Delaware Bay area of southern New Jersey (Lacovara, Reference Lacovara1997; Wehmiller and Pellerito, Reference Wehmiller and Pellerito2015). Both the upper fluvial terrace and the Cape May Formation, unit 2 estuarine deposit are inset by a younger, lower nonglacial fluvial terrace deposit dated by radiocarbon to MIS 3 (36–33 cal ka) (“lower terrace” of Stanford et al., Reference Stanford, Witte, Braun and Ridge2016). The upper and lower fluvial terraces and the Cape May Formation, unit 2 are themselves all inset into an older, higher estuarine deposit with a top elevation of +20 m (Cape May Formation, unit 1 of Newell et al., Reference Newell, Powars, Owens and Schindler1995; renumbered to Cape May Formation, unit 3 in Newell et al., Reference Newell, Powars, Owens, Stanford and Stone2000) of MIS 9 or 11 age, as dated by AAR in the Delaware Bay area (Lacovara, Reference Lacovara1997; O'Neal et al., Reference O'Neal, Wehmiller, Newell, Goodfriend, Collins, Fogel, Macko and Wehmiller2000; Wehmiller and Pellerito, Reference Wehmiller and Pellerito2015).
Intermediate glacial deposits correlative to those in New Jersey also occur on Long Island, where they are interbedded with marine clays (Fig. 5). The stratigraphic relations on Long Island also suggest an MIS 6 age for the intermediate glaciation. In western Long Island a glaciofluvial or fluvial gravel (part of the Jameco Gravel of Fuller, Reference Fuller1914) occurs in buried valleys as deep as 120 m below present sea level, including the pre-LGM trunk valley of the Hudson River across Queens, New York, and is overlain by marine clay (part of the Gardiners Clay of Fuller, Reference Fuller1914) (deLaguna, Reference deLaguna1948; Perlmutter and Geraghty, Reference Perlmutter and Geraghty1963; Soren, Reference Soren1971; Buxton and Shernoff, Reference Buxton and Shernoff1999). The depths of the valleys indicate that sea level was at a full glacial low stand during deposition of the gravel. Clays historically correlated with the Gardiners contain shells yielding AAR ratios that indicate both MIS 5 and MIS 7 or 9 age (Belknap, Reference Belknap1979; Stone and Borns, Reference Stone and Borns1986; Wehmiller et al., Reference Wehmiller, Belknap, Boutin, Mirecki, Rahaim, York and Easterbrook1988; Muller and Calkin, Reference Muller and Calkin1993) indicating clay deposition during at least two interglacials. On the northern half of Long Island these clays are glacially folded and thrust-faulted along with till and sand and gravel (Fuller, Reference Fuller1914; Sirkin, Reference Sirkin and Cadwell1986), complicating the stratigraphic relations, but south of the glacial limit in southwestern Long Island the clays are undeformed (see Fig. 1). In southwestern Long Island the Gardiners Clay is an extensive, continuous subsurface unit that overlies the Jameco Gravel and is overlain by the Wantagh Formation, a younger marine clay (Rampino and Sanders, Reference Rampino and Sanders1981; also known as the “20-foot clay” of Perlmutter et al., Reference Perlmutter, Geraghty and Upson1959). LGM outwash (Bellmore Formation of Rampino and Sanders, Reference Rampino and Sanders1981) is the surface unit and overlies the Wantagh. Peat and shells from silty clay correlated with the Wantagh sampled in an offshore borehole at an elevation of –20 m yielded a radiocarbon age of 32 cal ka (28,150 14C yr BP, no error or laboratory number reported; Rampino and Sanders, Reference Rampino and Sanders1981); other shells from the Wantagh date to >38 14C ka (Perlmutter et al., Reference Perlmutter, Geraghty and Upson1959). A shell from the Wantagh sampled in an offshore borehole at an elevation of –16 m yielded a late MIS 5 (perhaps MIS 5a or 5c) AAR ratio (site 4015 of Wehmiller et al., Reference Wehmiller, Belknap, Boutin, Mirecki, Rahaim, York and Easterbrook1988 and Wehmiller and Pellerito, Reference Wehmiller and Pellerito2015). If this shell is not reworked it suggests that the Wantagh there is of MIS 5 age. The elevations of both dated Wantagh samples are consistent with sea levels in the Long Island area during MIS 3 and MIS 5a calculated from glacio-isostatic models (Potter and Lambeck, Reference Potter and Lambeck2003; Pico et al., Reference Pico, Creveling and Mitrovica2017). In central Long Island, shells from the Gardiners sampled in a borehole drilled through the frontal ridge of the LGM terminal moraine at the east end of the undeformed belt (site 4006 of Wehmiller et al., Reference Wehmiller, Belknap, Boutin, Mirecki, Rahaim, York and Easterbrook1988, and Wehmiller and Pellerito, Reference Wehmiller and Pellerito2015) yielded an older MIS 5 (perhaps 5e) AAR ratio, as did shells from undeformed Gardiners at an elevation of –27 m in a borehole 15 km to the east of site 4006 (site 4004 of Wehmiller et al., Reference Wehmiller, Belknap, Boutin, Mirecki, Rahaim, York and Easterbrook1988, and Wehmiller and Pellerito, Reference Wehmiller and Pellerito2015). A sand and gravel unit with tabular form (Merrick Formation of Rampino and Sanders, Reference Rampino and Sanders1981) lies between the Wantagh and Gardiners. If the Merrick is glaciofluvial, as proposed by Rampino and Sanders (Reference Rampino and Sanders1981), and if the Wantagh is of MIS 5 age, then the Merrick records an MIS 6 glaciation, and the underlying Gardiners and Jameco in this area are of pre-MIS 6 age. There is no till associated with the Merrick, and it may be a nonglacial fluvial-estuarine deposit of MIS 5 age (perhaps MIS 5b or 5d) or of MIS 4 age if the overlying Wantagh is of MIS 3 age. If both the Wantagh and Gardiners in southwestern Long Island are of MIS 5 age, then the underlying Jameco is MIS 6 or older.

Figure 5. Proposed correlation of glacial and marine deposits in New Jersey and western Long Island. MIS 3 marine deposits offshore of New Jersey are at elevations below –15 m. They are described by Sheridan et al. (Reference Sheridan, Ashley, Miller, Waldner, Hall and Uptegrove2000), Wright et al. (Reference Wright, Sheridan, Miller, Uptegrove, Cramer and Browning2009) and Uptegrove et al. (Reference Uptegrove, Waldner, Stanford, Monteverde, Sheridan and Hall2012). Nonglacial fluvial deposits of proposed MIS 4 age beneath glaciofluvial gravel of MIS 2 age in the Delaware River valley are described by Ridge et al. (Reference Ridge, Evenson and Sevon1992). Similar nonglacial fluvial deposits of MIS 4 age may be present in western Long Island as part of the Herod Gravel of Fuller (Reference Fuller1914), which overlies the Gardiners Clay, or the Merrick Formation, which underlies the Wantagh Formation. Unit 3 of the Cape May Formation (Newell et al., Reference Newell, Powars, Owens and Schindler1995, renumbered to unit 1 in Newell et al., Reference Newell, Powars, Owens, Stanford and Stone2000) crops out only in southern New Jersey at elevations of less than 4 m (Stanford et al., Reference Stanford, Witte, Braun and Ridge2016). Ages of MIS boundaries (at left) are from Lisiecki and Raymo (Reference Lisiecki and Raymo2005).
On the north shore of Long Island at Port Washington (site 2 on Fig. 1), glacially deformed sand and clay containing peat dated as old as >42.5 14C ka BP (Sirkin and Stuckenrath, Reference Sirkin and Stuckenrath1980) overlie till (Montauk Till of Fuller, Reference Fuller1914) that may correlate to either the Jameco Gravel or the Merrick Formation, although the contact of the Montauk and the Jameco or Merrick has not been observed (Stone and Borns, Reference Stone and Borns1986). The peat contains Pinus (pine), Carya (hickory), Quercus (oak), and Nyssa (blackgum) pollen indicating deposition during a full interglacial as warm as present (Sirkin and Stuckenrath, Reference Sirkin and Stuckenrath1980), again suggesting a pre-MIS 5 age for the underlying Montauk Till. Fuller (Reference Fuller1914) describes the Montauk Till as overlying the Gardiners Clay in several outcrops on the northwest shore of Long Island. If the underlying Gardiners at these sites is a marine clay of MIS 7 or 9 age, as is the case at Port Washington (Belknap, Reference Belknap1979; sites 4010 and 4013 of Wehmiller et al., Reference Wehmiller, Belknap, Boutin, Mirecki, Rahaim, York and Easterbrook1988, and Wehmiller and Pellerito, Reference Wehmiller and Pellerito2015) and adjacent Great Neck (GNK on Fig. 1) (Ricketts, Reference Ricketts1986; site 4011 of Wehmiller et al., Reference Wehmiller, Belknap, Boutin, Mirecki, Rahaim, York and Easterbrook1988, and Wehmiller and Pellerito, Reference Wehmiller and Pellerito2015), then the Montauk is likely of MIS 6 age (Illinoian). An MIS 4 age was proposed for the Montauk Till (Sirkin, Reference Sirkin and Cadwell1986; Stone and Borns, Reference Stone and Borns1986) based in part on correlation to pre-LGM till in drumlins in the Boston, Massachusetts, area that contains shells with AAR ratios indicating an MIS 5 age (Belknap, Reference Belknap1979; Wehmiller et al., Reference Wehmiller, Belknap, Boutin, Mirecki, Rahaim, York and Easterbrook1988), but the probable position of the Montauk on top of MIS 7 or 9 clay on the north shore of Long Island and the presence of MIS 5 clay over outwash that likely correlates to the Montauk (either the Jameco Gravel or the Merrick Formation) in southwestern Long Island favors an MIS 6 age.
The intermediate terminal moraine in New Jersey is marked by a few till ridges in valleys. The ridges are <20 m high, <1 km long, and <500 m wide, unlike the wide (2-to-4-km) continuous belt of till and minor stratified deposits as much as 50 m thick forming the LGM terminal moraine. This mismatch seems to indicate a much shorter residence time at the terminus for the intermediate glaciation, perhaps 100 to 200 years compared to the ~750 years documented for the LGM (see below), or a much slower depositional rate. The intermediate terminal margin, as mapped from the moraines in the valleys and till patches on uplands, records an ice-surface profile of 20 to 30 m/km, based on looping of the margin in four valleys in the Passaic River and Raritan River basins, compared to 30 to 70 m/km for the LGM, using the same method as described above for the early Pleistocene ice-surface profiles. Glaciolacustrine sand and gravel and till of intermediate age in the bottoms of valley fills beneath LGM sediments at and as much as 10 km north of the LGM limit (see Fig. 2) are comparable in thickness (up to 50 m) to the LGM valley fill sediments, suggesting similar retreat rates for the two glaciations.
LGM GLACIATION
Deposits of LGM age (late Wisconsinan in North American stage terminology) include till that forms moraines, till sheets, and drumlins (Rahway, Netcong, and Kittatinny Mountain Tills of Stone et al., Reference Stone, Stanford and Witte2002, which are contemporaneous lithic variants), and glaciofluvial and glaciolacustrine stratified deposits (Rockaway Formation of Stone et al., Reference Stone, Stanford and Witte2002). In contrast to the deposits of early Pleistocene and intermediate age, the deposits of LGM age are unweathered or lightly weathered and their depositional landforms are well preserved. A prominent terminal moraine (TM on Fig. 2) marks the LGM limit. In a few places non-morainic till extends as much as 2 km in front of the moraine, indicating a brief advance beyond the moraine limit before slight retreat and stabilization of the glacier margin in the moraine belt. Recessional positions (A, OCG, S, and M1 through M8 on Fig. 2) are marked by discontinuous moraines, ice-contact deltas and lacustrine fans, and heads of glaciofluvial plains (Salisbury, Reference Salisbury1902; Herpers, Reference Herpers1961; Minard, Reference Minard1961; Ridge, Reference Ridge1983; Cotter et al., Reference Cotter, Ridge, Evenson, Sevon, Sirkin, Stuckenrath and Cadwell1986; Stanford and Harper, Reference Stanford and Harper1991; Stanford, Reference Stanford1993; Stone et al., Reference Stone, Stanford and Witte1995, Reference Stone, Stanford and Witte2002; Witte, Reference Witte1997, Reference Witte, Inners and Fleeger2001). Retreat was stepwise with only a few local readvances of <3 km marked by till overlying deformed lake sediments (Salisbury, Reference Salisbury1902, p. 526; Stanford, Reference Stanford2003).
LGM advance
Radiocarbon dates at four sites (sites 2, 3, 4, and 16, see Fig. 1 and Table 1), and possibly two others (sites 5 and 17, see Fig. 1 and Table 1), provide maximum ages for the LGM advance. At Port Washington, New York, 29 dates on peat, wood, shells, and organic silt in folded sand, clay, and peat beneath till (Roslyn Till of Mills and Wells, Reference Mills and Wells1974) range from >44 14C ka yr BP to 26 cal ka (silt) and 26.9 cal ka (peat) (Sirkin and Stuckenrath, Reference Sirkin and Stuckenrath1980) (site 2, see Fig. 1 and Table 1). A bed of organic mud beneath till in Buttermilk Channel between Brooklyn and Governors Island, New York, dates to 30.2 cal ka (Thieme et al., Reference Thieme, Schuldenrein, Herbster and Schabel2003) (site 16, see Fig. 1 and Table 1). In the Delaware River valley near Lambertville, New Jersey, organic silt under 5 m of glaciofluvial sand and pebble gravel dates to 27.8 cal ka (Stanford et al., Reference Stanford, Witte, Braun and Ridge2016) (site 3, see Fig. 1 and Table 1). This silt was deposited during early aggradation of the glaciofluvial plain and so may date entry of the glacier into the Delaware River basin. At Budd Lake, New Jersey, organic clay at a depth of 11.3 m, dated to 27.1 cal ka and within an interval of Pinus (pine) (50–60%), Picea (spruce) (10–20%), and Quercus (oak) (5–10%) pollen, is 2 m below the LGM maximum as marked by peaks in grass and sedge, and 70% spruce and no oak in the arboreal pollen (Harmon, Reference Harmon1968) (site 4, see Fig. 1 and Table 1). The depth of the dated clay places it at, or just below, the top of the pre-LGM valley fill (274 m) in the buried valley leading north of the lake basin (Stanford et al., Reference Stanford, Stone and Witte1996b), indicating that a lake or wetland was present in the basin at that elevation before the LGM advance. Supporting this interpretation is oxidation in the clay between 10 and 14 m in depth (Harmon, Reference Harmon1968), marking the level of the fluctuating water table in the pre-advance lake or wetland and corresponding to the pre-LGM pollen zone. Deposition of lacustrine deposits and till during the LGM on top of the pre-LGM deposits in the valley fill north of the lake raised the lake level ~10 m and shifted the spillway for the basin to the south across the former divide on bedrock (Stanford et al., Reference Stanford, Stone and Witte1996b).
At Binnewater Pond, New York (site 5, see Fig. 1), finely laminated silty clay at a depth of 12 m, dated to 27.2 cal ka and associated with pollen like that dated to 27.1 cal ka in the Budd Lake core, is 1 m below the base of a postglacial gyttja dated between 15.5 and 10 cal ka (Robinson et al., Reference Robinson, Pigott Burney and Burney2005) (site 5, see Fig. 1 and Table 1). Although there is no till over the dated clay at this site, which is ~70 km north of the LGM limit, the pond is in an upland headwater valley like Budd Lake, and pre-advance lake sediment could be preserved there beneath a glacially scoured surface at the top of the laminated silty clay.
Both the Budd Lake and Binnewater Pond dates were rejected as too old and presumed to be contaminated with old carbon (Harmon, Reference Harmon1968; Robinson et al., Reference Robinson, Pigott Burney and Burney2005). In the Budd Lake core, a date of 14.5 cal ka (15.9–13.2 cal ka, 2-sigma calibration age range; 12,290 ± 500 14C yr BP, GXO 330, Harmon, Reference Harmon1968) on gyttja at a depth of 8.2 m, at the top of the postglacial pine zone, is 2 to 3 ka older than other pine zone dates in the area (Cotter et al., Reference Cotter, Ridge, Evenson, Sevon, Sirkin, Stuckenrath and Cadwell1986; Peteet et al., Reference Peteet, Daniels, Heusser, Vogel, Southon and Nelson1993), implying that the lower date is also too old. However, at Binnewater Pond the postglacial dates are consistent with other dated pollen zones in the region (Robinson et al., Reference Robinson, Pigott Burney and Burney2005). In addition, a date of 26.0 cal ka (Schuldenrein and Aiuvalasit, Reference Schuldenrein, Aiuvalasit, Brown, Basell and Butzer2011) (site 17, see Fig. 1 and Table 1) on organic sediment at a depth of 15.5 m within lacustrine silt in a narrow, deep, east–west trending buried bedrock valley (Baskerville, Reference Baskerville1994) on the east side of Manhattan may also be a pre-advance date. As at Binnewater Pond there is no till reported over the dated sediment here, but the setting is favorable for preservation of pre-advance deposits. The older dates at Budd Lake, Binnewater Pond, and Manhattan are consistent with the pre-advance dates from Lambertville and Port Washington. Most of the Port Washington dates are on macrofossils and so are not significantly affected by old carbon, suggesting that the sediment dates at the other sites, given their similar ages, are also not affected. If this is true then the Budd Lake, Binnewater Pond, and Manhattan dates, along with those at Port Washington, indicate that between 28 and 25 ka LGM ice advanced at a rate no slower than ~30 m/yr to its terminus (the slope of the lower advance line on Fig. 6). This rate is consistent with an optically stimulated luminescence date of 27.58 ± 0.74 ka (1-sigma uncertainty) on overridden varves deposited in a lake dammed by advancing LGM ice in the upper Esopus Creek valley in the Catskill Mountains of New York, about 150 km north of the LGM limit (Rayburn et al., Reference Rayburn, DeSimone, Staley, Mahan and Stone2015), which yields an advance rate of ~60 m/yr.

Figure 6. Time-distance plot for the LGM glaciation in New Jersey, with radiocarbon dates (site numbers as in Table 1), varve records, lake-drainage events, and eastern New Jersey ice margins (M1 through M8). Approximate line of plot is along the axis of the Hackensack Lobe (Fig. 2) to Newburgh, New York (Fig. 1), with sites to the east and west of the axis plotted at their respective local up-ice distance from the terminal moraine.
LGM maximum
While the ice front stood at the LGM limit about 750 upper varves were deposited in the southern basin of Lake Passaic, which is that part of the lake south of the terminal moraine, in what is now known as the Great Swamp (GS on Figs. 1 and 7). These upper varves overlie a sand interval and an underlying lower varve section. These sediments were cored and sampled in borings GS1, GS4, GS5, and GS6 (Reimer, Reference Reimer1984; Stone et al., Reference Stone, Stanford and Witte1995, Reference Stone, Stanford and Witte2002; see Fig. 7). In boring GS1 the upper varves overlie 5 m of laminated to cross-laminated sand and silt with minor gravel, which in turn is in sharp erosional contact on 1.4 m of deformed lower varves on bedrock. In borings GS4 and GS5 the upper varves overlie a 10- to 12-m-thick section of sand and silty sand with laminated and graded bedding that in turn overlies 7 to 10 m of lower varves on bedrock. The sand section above the lower varves in GS4 and GS5, which are close to the LGM and intermediate limits, may be lacustrine fans deposited by either LGM or intermediate ice at their terminal positions. In GS1, which is 8 km from the terminal positions, the sand may be an interglacial alluvial deposit, although no evidence of soil development, weathering, or organic deposition was encountered in the borings. In GS5 there are ~500 lower varves below the sand section (Reimer, Reference Reimer1984). These may have been deposited during the intermediate glaciation, when a lake also occupied the basin, or, as suggested by the absence of weathering features and as shown on Figure 6, during LGM advance, when an advance stage of Lake Passaic (Chatham stage of Stone et al., Reference Stone, Stanford and Witte2002) occupied the basin (correlations of lakes and glacial events are shown on Fig. 8). The Chatham stage formed when ice of the Hackensack Lobe to the east of First Watchung Mountain (see Fig. 2) blocked Millburn Gap in First Watchung Mountain (MG on Fig. 7). The Hackensack Lobe extended about 15 km farther south than ice of the Passaic Lobe to the west of Second Watchung Mountain (see Fig. 2). This offset indicates that the Chatham stage formed when ice was ~15 km from its terminal position. If the 500 lower varves in GS5 were deposited in the Chatham stage, then they record the duration and rate (30 m/yr) of the last 15 km of advance (see Fig. 6).

Figure 7. LGM ice margins and glacial lakes for eastern New Jersey and the New York City area, with radiocarbon and varve sites. Abbreviations for places and features named in text are: GNK=Great Neck; GS=Great Swamp borings 1, 4, 5, and 6; HB=Hoboken; LFL=Little Falls; LFR=Little Ferry; LM=lower Manhattan; MG=Millburn Gap; N=Newark; NM=New Milford; P=Paterson; PR=Preakness; RD=Riverdale; SHG=Short Hills Gap; SP=Sands Point ice margin; TM=terminal moraine; and TM(HH)=Harbor Hill moraine (segment of terminal moraine). Recessional margins M1–M8 are also shown on Figures 2 and 6 and discussed in text. Numbers next to radiocarbon sites refer to Table 1. Abbreviations on shorelines indicate the following glacial lakes: AL=Albany, BN=Bayonne, CT=Connecticut, HK=Hackensack, GN=Great Notch stage of Lake Passaic, MH=Moggy Hollow stage of Lake Passaic, and PM=Paramus. Unlabeled shorelines are local upland lakes. Overlapped lake-extent pattern shows areas submerged during successive lakes or lake stages. Major ice margins are marked by the terminal moraine (TM) or large ice-contact deltas (M1–M8). Minor ice margins are marked by small ice-contact deltas.

Figure 8. Correlation of lakes, lake stages, and glacial events for the LGM glaciation in the Wallkill, Passaic, Hackensack, and Hudson River valleys.
When the Hackensack and Passaic Lobes reached their terminal positions they blocked Short Hills Gap in Second Watchung Mountain (SHG on Fig. 7), just west of Millburn Gap, and Lake Passaic rose ~15 m to form the Moggy Hollow stage (Salisbury and Kummel, Reference Salisbury and Kummel1894; Stone et al., Reference Stone, Stanford and Witte2002). A large fan and delta complex was deposited in the Moggy Hollow stage in front of the terminus of the Passaic Lobe (see Fig. 2). The upper varve section in the Great Swamp was deposited from the delta complex and consists of silt-clay couplets with an average thickness thinning slightly from 1.5 cm proximal to the deltas to 0.9 cm distally. The southern basin was isolated from meltwater input, and thus was isolated from a major source of sediment upon retreat from the terminal position because the moraine and its fronting deltas formed a continuous blocking ridge on the north edge of the basin. Thus, the approximately 750 varves in the upper varve section, which were counted in the GS1 and GS5 cores and include some extrapolated counts, based on varve thickness, across coring gaps, record residence time at the terminus. Microvarves (mean thickness 0.35 cm; Reimer, Reference Reimer1984) overlying the glacial varves in GS1 indicate a minimum of 450 years of nonglacial deposition in the Moggy Hollow and Great Notch lake stages (the Great Notch stage of Stone et al., Reference Stone, Stanford and Witte2002, is a recessional stage 21 m lower than Moggy Hollow; see Fig. 7). This interval gives the duration of the retreat from the terminal moraine to margin M3, about 33 km north of the moraine (see Figs. 6 and 7), when the gap at Paterson was uncovered and the Great Notch stage drained, leaving only a shallow (<15 m deep) postglacial lake (Millington stage of Salisbury and Kummel, Reference Salisbury and Kummel1894; Stanford, Reference Stanford2007) and ending varve deposition in the Great Swamp basin. Several meters of thicker, graded silty clay rhythmites above the microvarves (Reimer, Reference Reimer1984) were deposited in the shallow postglacial lake.
Calcareous concretions in borings GS1 and GS6 were sampled and dated. Although concretions may incorporate ancient lithogenic carbon and therefore yield unreliable dates, the carbon in the concretions from GS1 and GS6 is likely of contemporaneous organic origin because of their depleted δ13C values, which are similar to those of biogenic concretions in glacial-lake sediments in the St. Lawrence River valley of Canada (Hillaire-Marcel, Reference Hillaire-Marcel and Gadd1988). The discoid to spherical shape of the concretions, abundant trace fossils on their surfaces, and highly substituted calcite also indicate that they formed from organic matter in the varves during early diagenesis. Several concretions were combined from depths of 17.7 m and 28.3 m (in order to provide sufficient material for dating) in a 29-m-thick section of varves deposited in the Moggy Hollow stage in boring GS1 and yielded an age of 24.3 cal ka (site 6, see Fig. 7 and Table 1). These concretions had a δ13C value of −19.56 per mil and a δ18O value of −6.02 per mil. A second set of concretions within the upper postglacial rhythmites above the microvarves at a depth of 3 m in boring GS6 yielded a radiocarbon date of 14,060 ± 240 14C yr BP (QC-1305), calibrating to 17.1 cal ka (17.7–16.3 cal ka, 2-sigma calibration range, δ13C = −18.7 per mil, δ18O = −4.58 per mil). Because the concretions formed some time after the sediment was deposited, they provide minimum ages for the host sediments.
LGM recessional dates
Radiocarbon dates from recessional deposits include bulk dates of organic silts and clays and a concretion date in postglacial lake sediments. In western New Jersey these include a date of 23.3 cal ka in a postglacial wetland at Jenny Jump Mountain, New Jersey (D. Cadwell, personal communication reported in Muller and Calkin, Reference Muller and Calkin1993) (site 7, see Fig. 1 and Table 1), and dates of 22.4 and 22.2 cal ka in Francis Lake, New Jersey (Cotter et al., Reference Cotter, Ridge, Evenson, Sevon, Sirkin, Stuckenrath and Cadwell1986) (site 8, see Fig. 1 and Table 1). The Francis Lake dates are on combined multiple samples of thin clay containing tundra-zone pollen and are 1 to 2 m below organic clay containing spruce-zone pollen, dated 15.5 to 13 cal ka, which is consistent with other spruce-zone dates in the region (Cotter et al., Reference Cotter, Ridge, Evenson, Sevon, Sirkin, Stuckenrath and Cadwell1986).
In eastern New Jersey the recessional dates include a date of 23.4 cal ka on organic clay-silt in varves deposited in glacial Lake Hackensack at North Bergen, 35 km north of the terminal moraine (Thieme, Reference Thieme, Hart and Cremeens2003) (site 10, see Figs. 1 and 7 and Table 1). The dated sediment here is underlain by ~5 m of varves above till. Assuming an average thickness of 1.3 cm per varve, based on logs of nearby test borings (New Jersey Department of Transportation, 2019), about 400 years elapsed between deglaciation and deposition of the dated varves at North Bergen. A concretion dated to 21.2 cal ka in postglacial lake sediments near Teterboro, New Jersey, 40 km north of the terminal moraine (site 9, see Figs. 1 and 7 and Table 1) has a depleted δ13C value of –18.5 per mil, suggesting an organic origin. It provides a minimum age for the postglacial lake sediments. Organic clay-silt in varves deposited in glacial Lake Albany in the Hudson valley at Tarrytown, New York, 75 km north of the terminal moraine, dates to 21.7 cal ka (Weiss, Reference Weiss1971) (site 11, see Figs. 1 and 7 and Table 1). The dated sediment here is underlain by 30 m of varves with an average thickness of ~2 cm above ice-marginal sand and gravel (Weiss, Reference Weiss1971), suggesting about 1500 years elapsed from deglaciation to deposition of the dated sediment. The Tarrytown date, like the oldest dates at Budd Lake and Binnewater Pond, was rejected by Weiss (Reference Weiss1971) because it was much older than expected, but it is consistent, within its large analytic uncertainty, with the varve chronology (see next section).
Bulk dates of 26.5 and 26.3 cal ka on the uppermost lacustrine silt in the Hackensack basin near Moonachie, New Jersey (Rue and Traverse, Reference Rue and Traverse1997) (site 12, see Figs. 1 and 7 and Table 1), are considerably older than the nearby concretion date of 21.2 cal ka in similar stratigraphic position at Teterboro. The presence of Cretaceous pollen in the Moonachie core (Rue and Traverse, Reference Rue and Traverse1997), which was better preserved than the Quaternary pollen and which does not occur elsewhere in Quaternary deposits in this region, suggests anthropogenic contamination from spilled Cretaceous-age petroleum, which may have contained pollen, as a cause of these old dates. The Moonachie core site is adjacent to a navigable waterway in an industrial area where such spills are common.
Luminescence dates on an ice-contact delta deposited in Lake Albany at Jones Point, New York, 90 km north of the LGM terminus (JP on Fig. 1), range from 27 to 14 ka (Gorokhovich et al., Reference Gorokhovich, Nelson, Eaton, Wolk-Stanley and Sen2018). The uppermost fluvial beds, which are most likely to have been subaerially exposed and bleached before deposition, yielded ages of 16.2 ± 5.6 and 14.2 ± 6.1 ka (2-sigma uncertainty). These beds may have been reworked and re-exposed by the large Lake Iroquois outflow floods down the Hudson valley as late as 13.0 ka (Rayburn et al., Reference Rayburn, Knuepfer and Franzi2005; Stanford, Reference Stanford2010) when the ice margin had retreated into the St. Lawrence River valley in Canada, and so do not necessarily record the time of deposition at a local ice margin.
LGM recessional varve chronology and lake history in eastern New Jersey
The dates in the Hackensack and lower Hudson valleys are consistent with varve chronology and lake-drainage events (see Fig. 8). In clay pits at Little Ferry, New Jersey (LFR on Figs. 1 and 7), in the Lake Hackensack basin, Reeds (Reference Reeds1926) and Antevs (Reference Antevs1928) measured 1097 glacial varves and 1433 postglacial varves. The onset of postglacial deposition here is marked by an abrupt thickening of the varves (the “0 datum plane” of Reeds, Reference Reeds1926). The same abrupt thickening is exposed in a streambank outcrop of 260 varves in New Milford, New Jersey, 11 km north of Little Ferry (NM on Figs. 1 and 7). The thickening marks the time that Sparkill Gap (see Fig. 7)—a low pass through the Palisades ridge, which forms the east side of the basin—was deglaciated and glacial Lake Hackensack lowered ~15 m to a postglacial lake (Stanford and Harper, Reference Stanford and Harper1991). Lowering of the lake level caused fluvial drainage from the Passaic basin to the west, which formerly had emptied into a northwestern arm of Lake Hackensack in a tributary valley, to discharge into a postglacial lake closer to Little Ferry with a smaller lake-floor area, delivering more sediment and producing thicker varves there. This fluvial drainage is recorded by the Oradell terrace deposit of Stanford and Harper (Reference Stanford and Harper1991) and Stone et al. (Reference Stone, Stanford and Witte2002). The base of the glacial varves at Little Ferry lies on till and, based on the sequence of recessional ice margins, postdates the opening of the Paterson Gap and the end of postglacial varve deposition in the Great Notch stage in the Great Swamp basin of Lake Passaic, which occurred when the ice front was 35 km north of the terminal moraine (see Figs. 6 and 7).
The duration of the 40 km of retreat from the terminal moraine to Little Ferry, as recorded by the varves in Lake Passaic, and the 25 km of retreat from Little Ferry to Sparkill Gap, as recorded by the glacial varves at Little Ferry, agree with the radiocarbon dates in the glacial varves at the Great Swamp, North Bergen, and Tarrytown (sites 6, 10, and 11 on Figs. 6 and 7). Retreat from the terminal moraine to margin M4 near Little Ferry was rapid (~80 m/yr; see Figs. 6 and 7). Retreat from margin M4 to margin M8 at Sparkill Gap was much slower (~16 m/yr; see Figs. 6 and 7). This rate change is reflected in the ice-marginal sedimentary record. The rapid retreat to M4 is indicated by the absence of large ice-contact deltas in those parts of Lakes Passaic, Bayonne (BN on Fig. 7), and Hackensack (see Fig. 2). Slowed retreat north of M4 is indicated by a series of large ice-contact deltas, some of which have kame belts at their heads (“ice-contact gravel” on Fig. 2), deposited from ice margins M4 through M8 in Lakes Hackensack and Paramus (PM on Fig. 7) and smaller lakes northwest of Lake Paramus. Each delta records 100 to 200 years of ice-margin stability (see Fig. 6). A similar duration is directly recorded by a short readvance of ~3 km at the M2 margin in the northern Lake Passaic basin (Preakness readvance, shown by heavy dashed line on Fig. 7), where till overlies deformed deltaic sand and varves (Salisbury, Reference Salisbury1902; Stanford, Reference Stanford2003). This readvance lasted ~200 years based on 222 varves near Little Falls, New Jersey (LFL on Figs. 1 and 7; locality 101 of Antevs, Reference Antevs1928). These varves occur below the readvance till and rest on the till or gravel substrate exposed during initial retreat. The Little Falls varves precede the opening of the Paterson Gap. They also precede the Little Ferry varve record (see Fig. 6). They overlap with the postglacial microvarves in the Great Swamp basin of Lake Passaic (see Fig. 6) but cannot be matched to them because the microvarves are not meltwater sourced. Upper limiting ages for recession in this area are provided by dates of 18.7 cal ka and 16.8 cal ka on silts in postglacial fluvial terrace deposits (lower Passaic terrace of Stanford and Harper, Reference Stanford and Harper1991; Passaic terrace of Stone et al., Reference Stone, Stanford and Witte2002) at Clifton, New Jersey, and Passaic, New Jersey, respectively (Thieme, Reference Thieme, Hart and Cremeens2003) (sites 13 and 14, see Figs. 1 and 7 and Table 1). These terraces are inset into ice-contact deltas deposited in Lake Paramus along margins M2 and M3.
Margin M2 can be correlated westward to the Ogdensburg-Culvers Gap recessional moraine in western New Jersey (OCG on Figs. 1 and 2) and eastward to the Sands Point recessional margin on Long Island (Sirkin, Reference Sirkin, Larson and Stone1982; SP on Fig. 7) by the following observations. West of the Lake Passaic basin the margin is marked by a series of large ice-contact gravel deposits in small upland valleys and by ice-contact deltas and heads of outwash in larger valleys (see Fig. 2). Small till moraines mark the margin on some bedrock uplands between the valleys and link to the east end of the Ogdensburg-Culvers Gap moraine (Stanford, Reference Stanford1993). In the Lake Passaic basin, the position of margin M2 is marked by the location of stepped ice-contact deltas at Riverdale and Preakness in Lake Passaic (RD and PR on Fig. 7). These deltas consist of an upper level at the Moggy Hollow stage elevation and a lower level at the Great Notch stage elevation (Stone et al., Reference Stone, Stanford and Witte1995, Reference Stone, Stanford and Witte2002; Stanford, Reference Stanford2003). They therefore record the position of the ice front when ice to the east uncovered the gap at Great Notch just after the Preakness readvance, causing Lake Passaic to drop from the Moggy Hollow to the Great Notch level. East of Great Notch, M2 is marked by ice-contact deltas at Newark, Hoboken, and lower Manhattan (N, HB, and LM on Fig. 7). These deltas were deposited in Lake Bayonne (BN on Fig. 7), a precursor to Lakes Hackensack and Albany. Lake Bayonne requires that the ice margin be at or south of the Sands Point position on Long Island in order to block Hell Gate, a gap between Queens and Manhattan through which water could drain eastward to a lower lake (Lake Connecticut, CT on Fig. 7) in the Long Island Sound lowland (Stanford and Harper, Reference Stanford and Harper1991; Stone et al., Reference Stone, Schafer, London, DiGiacomo-Cohen, Lewis and Thompson2005). When Hell Gate was deglaciated, Lake Bayonne lowered to the level of the Hell Gate stage of Lake Albany in the Hudson valley (Stanford, Reference Stanford2010; previously referred to as Lake Hudson by Stanford and Harper, Reference Stanford and Harper1991, and Stone et al., Reference Stone, Stanford and Witte2002) and to the Lake Hackensack level in the Hackensack valley. These lower lakes were controlled by spillways on bedrock at Hell Gate and in the Kill van Kull, respectively.
LGM recession in western New Jersey
Recessional deposits in western New Jersey (west of the Lake Passaic basin, see Fig. 1) document a similar tempo of early rapid retreat followed by slowed retreat, although here they are not directly dated. Ice-contact deltas are small, and there is only one small recessional moraine (Franklin Grove moraine; Ridge, Reference Ridge1983; Cotter et al., Reference Cotter, Ridge, Evenson, Sevon, Sirkin, Stuckenrath and Cadwell1986; Witte, Reference Witte1997) in a 40-km belt north of the terminal moraine (see Fig. 2) but at and north of the Ogdensburg-Culvers Gap recessional moraine (OCG on Figs. 1 and 2) deltas are larger and there are three recessional moraines (OCG, A, and S on Figs. 1 and 2) (Salisbury, Reference Salisbury1902; Connally and Sirkin, Reference Connally and Sirkin1970; Stone et al., Reference Stone, Stanford and Witte1995, Reference Stone, Stanford and Witte2002; Witte, Reference Witte1997). The recessional moraines are about 10–20% of the volume of the terminal moraine. Based on the 750-yr residence time at the terminal moraine recorded by the glacial varves in the Great Swamp basin of Lake Passaic, the recessional moraines record about 100 to 200 years of ice-margin stability, assuming that the rates of till deposition at the terminal and recessional positions were similar. This duration of ice-margin stability is the same as that recorded by the Preakness readvance and the ice-contact deltas at margins M2, M3, and M4 in eastern New Jersey, which are the eastern correlates of the recessional moraines (see Fig. 2). Connection of M3 and M4 to the Augusta and Sussex margins (A and S, respectively, on Figs. 1 and 2) is based on a linked series of ice-contact gravel deposits and heads of outwash in valleys, and small till moraines on uplands (Stanford, Reference Stanford1993), like the linkage of M2 to the Ogdensburg-Culvers Gap moraine described above.
The drainage history of glacial Lake Wallkill, which occupied the Wallkill River valley (see Fig. 1), links these recessional positions to the Hudson River valley varve chronology. Near Sussex, New Jersey, a clast of organic clay in colluvium on the toe of an ice-contact delta dates to 18.4 cal ka (site 15, see Fig. 1 and Table 1). This delta was deposited in the Augusta stage of glacial Lake Wallkill (Stone et al., Reference Stone, Stanford and Witte2002; equivalent to the “500-foot” level of Connally and Sirkin, Reference Connally and Sirkin1970) at the Sussex recessional margin (S on Figs. 1 and 2), and the colluvium was deposited after the Augusta stage lowered, exposing the delta and the surrounding lake bottom. The date provides a minimum age for this lowering. The Augusta stage dropped 70 m when the retreating ice margin uncovered the north end of Schunnemunk Mountain (SC on Fig. 1) and the Storm King gap (SK on Fig. 1) in the Hudson River valley south of Newburgh, New York, allowing eastward drainage into the Hudson (Stanford, Reference Stanford2010). This drainage occurred shortly before the deposition of the earliest varves in the North American Varve Chronology (NAVC) in Lake Albany at Newburgh (NB on Fig. 1) at 18.3 ka (Ridge et al., Reference Ridge, Balco, Bayless, Beck, Carter, Dean, Voytek and Wei2012), which is 5 km north of the Schunnemunk outflow site (see Figs. 1 and 6).
Extension of the NAVC to the LGM terminus
The chronology presented here provides a preliminary extension of the NAVC to the LGM terminus. Our chronology indicates a gap of 2500 to 3000 years between the base of the NAVC at Newburgh at 18.4 ka and the top of the varves at Little Ferry at ~21 ka, and a smaller gap of ~700 years between the base of the Little Ferry varves at 23.5 ka and the top of the glacial varves deposited at the LGM terminus in the Great Swamp basin of Lake Passaic at 24.2 ka. The 732 varves deposited in Lake Albany at Haverstraw, New York (HV on Fig. 1) (Antevs, Reference Antevs1928; Ridge et al., Reference Ridge, Balco, Bayless, Beck, Carter, Dean, Voytek and Wei2012), occur within the Newburgh-Little Ferry gap (see Fig. 6). They were not observed in contact on till, but the oldest varves at Haverstraw were thought to be close to till or ice-contact gravel (Antevs, Reference Antevs1928). The lower varves at Haverstraw may overlap the postglacial varves at Little Ferry. The 222 varves deposited in Lake Passaic at Little Falls (LFL on Fig. 7) (Antevs, Reference Antevs1928) occur within the Great Swamp-Little Ferry gap (see Fig. 6). The varves at Little Falls likely overlap the upper postglacial varves in the Great Swamp. In both the Little Ferry and Great Swamp cases the postglacial varves are not fed by glacial meltwater and so do not record ice-sheet melting patterns, and a match to the glacial varves is not possible. The link to the NAVC at Newburgh indicates a retreat rate in the Hudson River valley of ~10 m/yr from margin M8 to Newburgh (see Fig. 6).
DISCUSSION
The pollen associations and stratigraphic relations of the early Pleistocene glacial deposits suggest that they are of earliest Pleistocene age, correlative to the earliest continental-scale Laurentide glaciation recorded by the C tills of Boellstorff (Reference Boellstorff1978), pre-Illinoian K glaciation of Richmond and Fullerton (Reference Richmond and Fullerton1986), and Atlanta till (informal name) of Balco and Rovey (Reference Balco and Rovey2010) in the Missouri River valley (Fig. 9). This glaciation is dated to 2.4 Ma by volcanic-ash stratigraphy (Boellstorff, Reference Boellstorff1978) and cosmogenic burial ages (Balco et al., Reference Balco, Rovey and Stone2005; Balco and Rovey, Reference Balco and Rovey2010). If this correlation is correct it implies that the first Laurentide Ice Sheet was comparable in extent in eastern North America to those in the middle and late Pleistocene. Supporting this possibility is the presence of ice-rafted debris of eastern North American provenance in marine sediments in the North Atlantic beginning at 2.6 Ma (Bailey et al., Reference Bailey, Hole, Foster, Wilson, Storey, Trueman and Raymo2013) and dust of mid-latitude North American origin beginning at 2.7 Ma (Lang et al., Reference Lang, Bailey, Wilson, Beer, Bolton, Friedrich and Newsam2014), indicating glacial advance onto the eastern North American continental shelf and into mid-latitudes.

Figure 9. Correlation of tills and interglacial marine deposits in New Jersey and Long Island and oldest midcontinent Laurentide tills (in Missouri). Age of Missouri tills is from Balco and Rovey (Reference Balco and Rovey2010). Composite marine benthic δ18O record is from Lisiecki and Raymo (Reference Lisiecki and Raymo2005), with glacial marine isotope stage numbers shown on the right-hand side. Ages of boundaries of epochs and chrons are in Ma. Cape May Formation, unit 1 (Newell et al., Reference Newell, Powars, Owens and Schindler1995) was renumbered to unit 3 in Newell et al. (Reference Newell, Powars, Owens, Stanford and Stone2000).
An earliest Pleistocene age implies that this glaciation correlates to one of the significant enrichments in the benthic marine δ18O record between 2.6 and 2.1 Ma (MIS 78–100; see Fig. 9) (Lisiecki and Raymo, Reference Lisiecki and Raymo2005). The lesser enrichment of δ18O during this period compared to that during glacials in the middle and late Pleistocene would seem to exclude the possibility of glaciation of LGM extent. However, if the earliest ice sheet was thinner because it flowed on a mantle of regolith (Clark and Pollard, Reference Clark and Pollard1998; Balco et al., Reference Balco, Rovey and Stone2005), and perhaps also because it flowed on a surface of lower relief than later glaciers, it may have contained less depleted δ18O and so could grow to LGM extent without the same enrichment effect on marine δ18O (Bailey et al., Reference Bailey, Bolton, DeConto, Pollard, Schiebel and Wilson2010). The observed early Pleistocene ice-surface profile in New Jersey (6 to 15 m/km), based on the mapped terminal margin as marked by till limits, which is 10–50% of the LGM profile (30 to 70 m/km), indicates a thinner ice sheet and supports this hypothesis.
It is possible that the early Pleistocene advance in New Jersey correlates to the younger early Pleistocene glaciations in the midcontinent (pre-Illinoian F and G of Richmond and Fullerton, Reference Richmond and Fullerton1986). The oldest of these younger advances is marked by the Moberly till (informal name) in Missouri, which is dated to 1.3 Ma by cosmogenic burial methods (Balco and Rovey, Reference Balco and Rovey2010). This age indicates that the younger early Pleistocene glaciations in the midcontinent came after the period of lowering sea level between 3.5 and 1.5 Ma that drove the 20 to 60 m of fluvial incision into bedrock following the early Pleistocene advance in New Jersey. The mismatch of the age of the younger glaciation with the time of incision supports correlation of the New Jersey advance with the 2.4 Ma glaciation in the midcontinent.
The intermediate glaciation is most likely of MIS 6 (Illinoinan) age based on the relationship of the intermediate glacial deposits to interglacial estuarine and marine deposits in central and southern New Jersey and western Long Island. MIS 4 and 3 (early and middle Wisconsinan) glacial sediments occur in central and western New York state (Fullerton, Reference Fullerton1986; Muller and Calkin, Reference Muller and Calkin1993; Young and Burr, Reference Young and Burr2006; Karig and Miller, Reference Karig and Miller2013; Kozlowski et al., Reference Kozlowski, Bird, Mahan, Graham and Wiant2014), but no MIS 4 or 3 glacial sediments are documented in the Hudson or Delaware basins (Ridge et al., Reference Ridge, Braun and Evenson1990a; Muller and Calkin, Reference Muller and Calkin1993). A pre-MIS 4 age for the intermediate glaciation is also indicated by glacio-isostatic modeling controlled by MIS 3 and 5a sea levels in the mid-Atlantic region. The observed sea levels require sharply reduced eastern Laurentide ice during MIS 4 and 3 between 80 and 44 ka (Pico et al., Reference Pico, Creveling and Mitrovica2017). Nonglacial sediments in the Hudson Bay area also indicate reduced eastern Laurentide ice between 52 and 40 ka (Dalton et al., Reference Dalton, Finkelstein, Forman, Barnett, Pico and Mitrovica2019), although the degree of this reduction is uncertain (Miller and Andrews, Reference Miller and Andrews2019). Global δ18O records also indicate that ice volume during MIS 4 and 3 was significantly smaller than during MIS 2, but ice volume during MIS 6 was comparable to MIS 2 (Spratt and Lisiecki, Reference Spratt and Lisiecki2016). These lines of evidence indicate that ice volume was insufficient during MIS 4 and 3 to overtop the Adirondack and Catskill Mountains and enter the Hudson and Delaware valleys, and support the MIS 6 age indicated by the local stratigraphic relationships. If this age is correct, the deposits in New Jersey indicate an MIS 6 Laurentide Ice Sheet nearly equivalent in extent to that at MIS 2.
A radiocarbon and varve chronology for the LGM dates the terminus of the Hudson-Champlain Lobe to between 25 and 24 ka, slightly younger than, but within the uncertainty of, the >25.2 ± 2.1 ka age from cosmogenic 10Be and 26Al exposure ages on boulders and bedrock outcrops just north of the terminal moraine in western New Jersey (Clark et al., Reference Clark, Bierman and Larsen1995; Balco et al., Reference Balco, Briner, Finkel, Rayburn, Ridge and Schaefer2009; Corbett et al., Reference Corbett, Bierman, Stone, Caffee and Larsen2017). It is also somewhat younger than the 27.5 ± 2.2 ka age of the LGM terminal moraine on Martha's Vineyard (Balco et al., Reference Balco, Stone, Porter and Caffee2002, recalculated in Corbett et al., Reference Corbett, Bierman, Stone, Caffee and Larsen2017, using the revised production rate of Balco et al., Reference Balco, Briner, Finkel, Rayburn, Ridge and Schaefer2009). Our retreat chronology is much older than the 16 to 15 ka age of deglaciation inferred from radiocarbon dates on the oldest postglacial macrofossils (Peteet et al., Reference Peteet, Beh, Orr, Kurdyla, Nichols and Guilderson2012), suggesting that several thousand years elapsed between deglaciation and the transition from sandy and low-organic content deposits to fine-grained organic deposits (from which the macrofossils are obtained) in postglacial lakes and bogs.
Retreat from the terminus in eastern New Jersey and the Hudson River valley was relatively rapid (80 m/yr) until 23.5 ka, then slowed to ~15 m/yr until ~22.5 ka and slowed again to ~10 m/yr until 18 ka (see Fig. 6). Retreat rates in southern Connecticut and the Connecticut River valley (Balco and Schaefer, Reference Balco and Schaefer2006; Balco et al., Reference Balco, Briner, Finkel, Rayburn, Ridge and Schaefer2009; Ridge et al., Reference Ridge, Balco, Bayless, Beck, Carter, Dean, Voytek and Wei2012) show retreat at ~30 m/yr from ~21 to 18 ka, accelerating to between 50 and 100 m/yr between 18 and 17.5 ka. The early rapid retreat from the terminal moraine in New Jersey is not observed in the Martha's Vineyard-Cape Cod area, where cosmogenically dated boulders in the terminal moraine and Buzzards Bay recessional moraine seemingly indicate slow early retreat rates of ~3 m/yr between 27 and 21 ka (Balco et al., Reference Balco, Stone, Porter and Caffee2002; Balco and Schaefer, Reference Balco and Schaefer2006; Balco et al., Reference Balco, Briner, Finkel, Rayburn, Ridge and Schaefer2009). The cosmogenic dates also imply that the New Jersey recessional moraines (Ogdensburg-Culvers Gap, Augusta, and Sussex margins; OCG, A, and S, on Fig. 1), which were deposited between 23.5 and 22.5 ka and lie 40–60 km north of the terminal moraine, predate the Buzzards Bay-Charlestown, Old Saybrook, and Ledyard moraines in Connecticut, Rhode Island, and Massachusetts (BZ, C, OS, and L on Fig. 1 inset), which are dated to between 21 ± 1 and 20 ± 1 ka and lie 20–50 km north of the terminal moraine (Balco et al., Reference Balco, Briner, Finkel, Rayburn, Ridge and Schaefer2009). The New England moraines, and the Roanoke Point moraine on the north shore of eastern Long Island (RP on Fig. 1 inset; Sirkin, Reference Sirkin, Larson and Stone1982), which is the western extension of the Buzzards Bay-Charlestown moraine (Stone et al., Reference Stone, Schafer, London, DiGiacomo-Cohen, Lewis and Thompson2005), may instead correlate to the Pellets Island and New Hampton moraines in the Wallkill valley in New York (PI and NH on Fig. 1; Connally and Sirkin, Reference Connally and Sirkin1970), which lie 85–90 km north of the terminal moraine. They predate the lowering of the Augusta stage of Lake Wallkill and so were deposited at ~21 to 20 ka, like the New England moraines. Their greater distance from the terminal moraine indicates that the Hudson-Champlain Lobe in New Jersey retreated faster than the Connecticut and Narraganset Lobes in southern New England during early deglaciation.
The 25 to 24 ka age of the LGM terminus in New Jersey is within the last 1.5 ka of Greenland Stadial 3 as recorded by δ18O in Greenland ice-sheet cores (Rasmussen et al., Reference Rasmussen, Bigler, Blockley, Blunier, Burchardt, Clausen and Cvijanovic2014), and corresponds to Heinrich Stadial 2 in the North Atlantic marine ice-rafted debris record (Heath et al., Reference Heath, Loope, Curry and Lowell2018). The abrupt warming marked by a Dansgaard-Oeschger (D-O) event at 23.5 ka (Greenland Interstadial 2.2; Rasmussen et al., Reference Rasmussen, Bigler, Blockley, Blunier, Burchardt, Clausen and Cvijanovic2014) that terminates Greenland Stadial 3 appears to lag by ~500 years the onset of rapid early retreat documented in New Jersey. Slowed retreat starting at ~23.5 ka in New Jersey seems to precede by 200 to 300 years the colder interval observed in the Greenland ice-core records between 23.2 and 23.0 ka (Greenland Stadial 2.2; Rasmussen et al., Reference Rasmussen, Bigler, Blockley, Blunier, Burchardt, Clausen and Cvijanovic2014). The continued slow retreat in New Jersey and New York until 18 ka occurred during another cold period in Greenland (Greenland Stadial 2.1; Rasmussen et al., Reference Rasmussen, Bigler, Blockley, Blunier, Burchardt, Clausen and Cvijanovic2014) that began at 22.9 ka after another D-O event at 23.0 ka (Greenland Interstadial 2.1; Rasmussen et al., Reference Rasmussen, Bigler, Blockley, Blunier, Burchardt, Clausen and Cvijanovic2014). The 23.0 ka D-O event does not seem to be associated with a period of rapid retreat in New Jersey. These correlations suggest that the Hudson-Champlain Lobe reached its MIS 2 maximum during the same period as the MIS 2 temperature minimum in Greenland, began a rapid retreat slightly before an abrupt warming in Greenland, and perhaps began slowed retreat slightly before a return to cold conditions in Greenland, although the time differences in this last case may be at or beyond the resolution of our chronology.
The LGM terminus in New Jersey is 3 to 4 ka older than the maximum advance of the Huron-Erie Lobe in Ohio and Indiana, although it is contemporaneous with an earlier advance of lesser extent, and is 1.5 to 2 ka older than the maximum advance of the Lake Michigan Lobe (Heath et al., Reference Heath, Loope, Curry and Lowell2018). Both the Huron-Erie and Lake Michigan Lobes reached ~200 km farther south than the Hudson-Champlain Lobe in New Jersey but traversed lower-relief terrain and large proglacial lake basins and so were moving on more mobile beds, which may account for the asynchronous behavior of the lobes.
CONCLUSIONS
The earliest glacial deposits in New Jersey are magnetically reversed, intensely weathered, predate basin-wide incision to depths of 20 to 60 m into bedrock, and are associated with fluvial and lacustrine deposits containing exotic plant taxa that are generally considered as indicators of Neogene age in eastern North America. These properties suggest that these deposits are from the earliest Laurentide advance dated to 2.4 Ma in Missouri. If so, this easternmost occurrence records a first Laurentide Ice Sheet of equal or slightly greater southern extent than those in the middle and late Pleistocene.
Deposits of an intermediate glaciation fill modern valleys and are overlain by peat dated to 40.7 cal ka in New Jersey and wood and peat dated to >43.8 14C ka BP, and that contain warm-temperate pollen, in western Long Island. Outwash of this glaciation grades to fluvial terraces that are onlapped by MIS 5 interglacial estuarine deposits in the Delaware River valley and are directly overlain by MIS 5 marine deposits in southwestern Long Island. Till of this glaciation may overlie MIS 7 and 9 marine clay in northwestern Long Island. These relationships are consistent with an Illinoian (MIS 6) age.
Radiocarbon dates and varve sequences, placed into a chronology by detailed mapping of recessional ice margins and lake-drainage events, indicates that LGM ice of the Hudson-Champlain Lobe arrived at its terminus at ~25 ka, remained there for ~750 years, began to retreat by 24 ka, retreated at 80 m/yr until 23.5 ka, and retreated at ~12 m/yr from 23.5 to 18 ka. This age for the LGM in New Jersey is slightly younger than, but within the uncertainties of, cosmogenically derived ages but is significantly older than the oldest postglacial macrofossil radiocarbon ages. The LGM in New Jersey is within the final 1.5 ka of Greenland Stadial 3 and Heinrich Stadial 2, and the period of rapid retreat starting at 24 ka in New Jersey may precede by ~500 years the D-O warming event that terminates Greenland Stadial 3 as recorded in Greenland ice cores.BB
ACKNOWLEDGMENTS
Mapping and drilling were funded by a cooperative agreement between the New Jersey Geological Survey and U.S. Geological Survey (COGEOMAP) between 1982 and 2000 and by grants to the New Jersey Geological Survey under the STATEMAP component of the National Geologic Mapping Program between 1992 and 2017. Federal projects were funded by the U.S. Geological Survey Climate-Change Program, 1980–1982, and FEDMAP projects for mapping and drilling activities, 1983–1995, and map compilation and publication, 1995–2002. Donald Queen and Eugene Cobbs, Jr. (U.S. Geological Survey) drilled stratigraphic coreholes, and Gregg Steidl and John Curran (New Jersey Geological and Water Survey) drilled push borings as part of the geologic mapping projects between 1982 and 2015. We thank Christopher Lepre (Rutgers University) for providing preliminary results of paleomagnetic analysis of samples from Bernardsville, New Jersey. We thank Andrew Kozlowski, an anonymous reviewer, Associate Editor Tom Lowell, and U.S. Geological Survey reviewers Gregory Gohn, Randall Orndorff, and Deborah Stoliker, for careful and thorough reviews.


