INTRODUCTION
Lateral erosion and deposition processes cause loss of land and stabilization of new surfaces, that is, the conversion of floodplain into active channel and vice versa. Thus, these dynamic processes are responsible for an important part of the sediment cycle (Kondolf, Reference Kondolf1994; Sear et al., Reference Sear, Newson and Thorne2003). In agricultural and urbanized landscapes, fluvial lateral dynamics can cause conflicts with landowners and provoke damages to infrastructure and people (Piégay et al., Reference Piégay, Darby, Mosselman and Surian2005). However, channelization, that is, interruption of fluvial processes that shape the landscape, means transforming “wonderful ecosystems into run-down hydraulic pipelines” (Sansoni, Reference Sansoni1995, p. 1), producing negative ecological, geomorphic, and hydraulic effects (Piégay and Rinaldi, Reference Piégay and Rinaldi2006).
Many researchers around the world have studied river planform changes over time to define the evolutionary trends, assess the triggering factors, and manage the fluvial environment, particularly for river systems highly impacted by humans (Werritty and Ferguson, Reference Werritty and Ferguson1980; McEwen et al., Reference McEwen, Bevens and Carling1989; Gurnell et al., Reference Gurnell, Downward and Jones1994; Lajczak, Reference Lajczak1995; Gurnell, Reference Gurnell1997; Kondolf, Reference Kondolf1997; Malavoi et al., Reference Malavoi, Bravard, Piégay, Héroin and Ramez1998; Leys and Werritty, Reference Leys and Werritty1999; Shields et al., Reference Shields, Simon and J. Steffen2000; Winterbottom, Reference Winterbottom2000; Liébault and Piégay, Reference Liébault and Piégay2002; Rapp and Abbe, Reference Rapp and Abbe2003; Piégay et al., Reference Piégay, Darby, Mosselman and Surian2005; Gordon and Meentemeyer, Reference Gordon and Meentemeyer2006; Hooke, Reference Hooke2008; Giardino and Lee, Reference Giardino and Lee2011; Nelson et al., Reference Nelson, Erwin and Schmidt2013; Block, Reference Block2014; Das and Pal, Reference Das and Pal2016). Research conducted on planform changes in Italian rivers identified some morphological evolutionary phases from the nineteenth century onward (Canuti et al., Reference Canuti, Cencetti, Conversini, Rinaldi and Tacconi1991; Dutto and Maraga, Reference Dutto and Maraga1994; Castaldini and Piacente, Reference Castaldini and Piacente1995; Surian, Reference Surian1999; Aucelli and Rosskopf, Reference Aucelli and Rosskopf2000; Marchetti, Reference Marchetti2002; Rinaldi, Reference Rinaldi2003; Surian and Rinaldi, Reference Surian and Rinaldi2003; Rinaldi et al., Reference Rinaldi, Simoncini and Sogni2005, Reference Rinaldi, Teruggi, Simoncini and Nardi2008; Cencetti and Fredduzzi, Reference Cencetti and Fredduzzi2008; Pellegrini et al., Reference Pellegrini, Maraga, Turitto, Audisio and Duci2008; Surian et al., Reference Surian, Rinaldi, Pellegrini, Audisio, Maraga, Teruggi, Turitto and Ziliani2009b; Turitto et al., Reference Turitto, Cirio and Nigrelli2010; Comiti et al., Reference Comiti, Da Canal, Surian, Mao, Picco and Lenzi2011; Ziliani and Surian, Reference Ziliani and Surian2012, Reference Ziliani and Surian2016; Magliulo et al., Reference Magliulo, Valente and Cartojan2013; Bollati et al., Reference Bollati, Pellegrini, Rinaldi, Duci and Pelfini2014; Clerici et al., Reference Clerici, Perego, Chelli and Tellini2015; Cencetti et al., Reference Cencetti, De Rosa and Fredduzzi2017).
Two historical phases of predominant channel narrowing are evident from the last decades of the nineteenth century up to the 1950s and from the 1950s to the 1990s. These phases were accompanied by a reduction in braiding degree, an increase of sinuosity, and increasing active-channel stabilization. The most recent stage, from the 1990s onward, reveals a slight inversion of the abovementioned morphodynamic trends and involved several Italian rivers.
Today, it is widely recognized that a detailed analysis of river dynamics over the past two centuries yields valuable information to understand ongoing dynamics and potential future evolutionary trends, under a river management perspective (Rinaldi, Reference Rinaldi2006; Brierley et al., Reference Brierley, Fryirs, Boulton and Cullum2008; Dufour and Piégay, Reference Dufour and Piégay2009).
This paper focuses on the active-channel planform changes along the Scrivia River floodplain between 1878 and 2016. The choice of this time interval is dictated by data availability and accuracy (Cencetti and Fredduzzi, Reference Cencetti and Fredduzzi2008; Cortemiglia, Reference Cortemiglia2011) for defining the medium (>25 years and<250 years) and short-term (<25 years) channel evolutionary trends and adjustments (Winterbottom, Reference Winterbottom2000). Moreover, even if many rivers were subjected to human alterations before the nineteenth century (Petts et al., Reference Petts, Möller and Roux1989; Billi et al., Reference Billi, Rinaldi and Simon1997; Winterbottom, Reference Winterbottom2000; Montgomery, Reference Montgomery2008; Comiti, Reference Comiti2012), the most intense and widespread morphological adjustments of the historical period affected Italian floodplain rivers since the last years of this century, and particularly after the 1950s (Winterbottom, Reference Winterbottom2000; Rinaldi et al., Reference Rinaldi, Surian, Comiti and Bussettini2011, Reference Rinaldi, Surian, Comiti and Bussettini2014).
In a heavily urbanized and cultivated zone such as the Scrivia floodplain, mainly fields, but also facilities and infrastructures, have often spread up to the edges of the riverbanks, increasing hydraulic and geomorphic risks and modifying the fluvial environment. During recent years, the Scrivia River floodplain reach has been affected by an intense reactivation of bank erosion after decades of stability. Bank erosion highlights the ongoing difficult relationship between people and rivers, highlighting serious management issues.
This paper outlines planform changes along the Scrivia River at a medium temporal scale, over the last 100–150 years, the so-called “management scale” of Rinaldi et al. (Reference Rinaldi, Surian, Comiti and Bussettini2014, p. 36). In particular, we examine the extent and the pattern of variations of the active channel both at reach scale and in continuity along the entire study reach. We aim to understand the historical and recent active-channel planform evolution and identify its overall morphological change and its current dynamics to aid in effective and sustainable riverscape management.
STUDY AREA
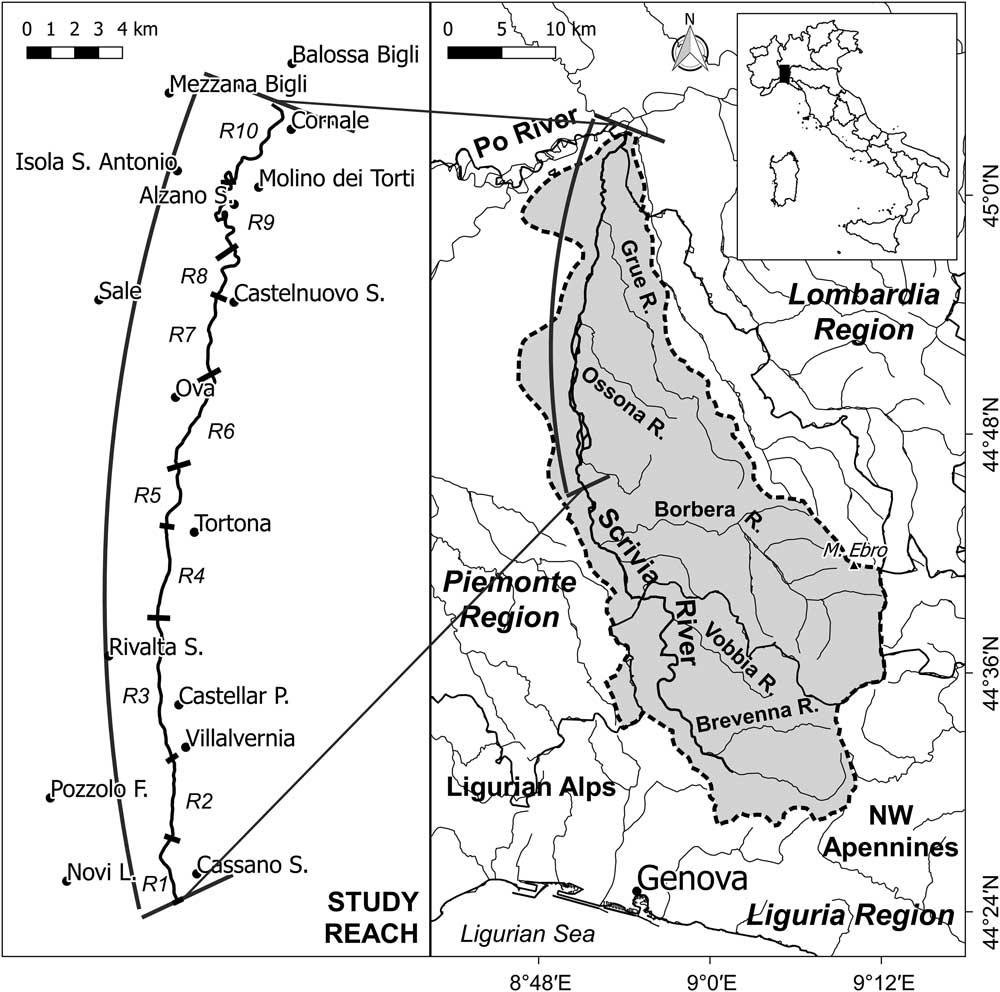
The Scrivia River is one of the main right-bank (looking downstream) tributaries of the Po River. It originates in the Ligurian–Piedmontese Apennines, in the hinterland of Genoa, very close to the Ligurian Sea, and flows northward for some 90 km (Fig. 1). Some reaches of the Scrivia River and its main tributary, the Borbera River, are among the most representative examples of braided rivers in the northwestern parts of Italy. The Scrivia River catchment covers ~1000 km², of which 80% consists of hilly and mountainous areas, with altitudes ranging from the highest peak at 1700 m asl (Mount Ebro) to 67 m asl at the confluence with the Po River.

Figure 1. Location of study reach. Abbreviated terms are defined as follows: Cassano S., Cassano Spinola; Novi L., Novi Ligure; Pozzolo F., Pozzolo Formigaro; Castellar P., Castellar Ponzano; Rivalta S., Rivalta Scrivia; Castelnuovo S., Castelnuovo Scrivia; Alzano S., Alzano Scrivia.
The main outcrop rocks are sedimentary, including marly limestone, mudstone, marlstone, sandstone, and conglomerate belonging to the Ligurian and Epiligurian Units and to the Tertiary Piedmont Basin succession (Molli et al., Reference Molli, Crispini, Malusà, Mosca, Piana and Federico2010; Federico et al., Reference Federico, Crispini, Vigo and Capponi2014; Barbero et al., Reference Barbero, Festa, Fioraso and Catanzariti2017; Piana et al., Reference Piana, Fioraso, Irace, Mosca, d’Atri, Barale and Falletti2017). A narrow belt of Pliocene sedimentary rocks is present where the Apennines meet the Quaternary floodplain (Fig. 2). The topography of the mountainous part of the basin is greatly controlled by tectonics and lithology (Pellegrini, Reference Pellegrini, Boni and Carton2003). Important geological structures and lineaments constrained the hydrography of the area, conditioning the landscape evolution and most likely causing the pronounced asymmetry of the basin (Fannucci and Nosengo, Reference Fannucci and Nosengo1977; Pellegrini et al., Reference Pellegrini, Boni and Carton2003; Capponi et al., Reference Capponi, Crispini, Federico, Piazza and Fabbri2009; Festa et al., Reference Festa, Fioraso, Bissacca and Petrizzo2015; Mandarino et al., Reference Mandarino, Ferraris and Firpo2015; Sacchini et al., Reference Sacchini, Faccini, Ferraris, Firpo and Angelini2016a). Furthermore, generally wide valleys and gentle slopes characterize areas with a clayey bedrock, whereas steep slopes and narrow valleys have formed on marly limestones and conglomerates. There are also steep slopes in some parts of the hilly portion of the catchment, mainly on badlands. The evident and extensive series of fluvial terraces spreading out mostly west of the Scrivia River, at the outlet of its V-shaped valley, reveals that during the Quaternary the Scrivia River migrated east–northeast, entrenching into its own sediments (Braga and Casnedi, Reference Braga and Casnedi1976; Cortemiglia, Reference Cortemiglia1998).
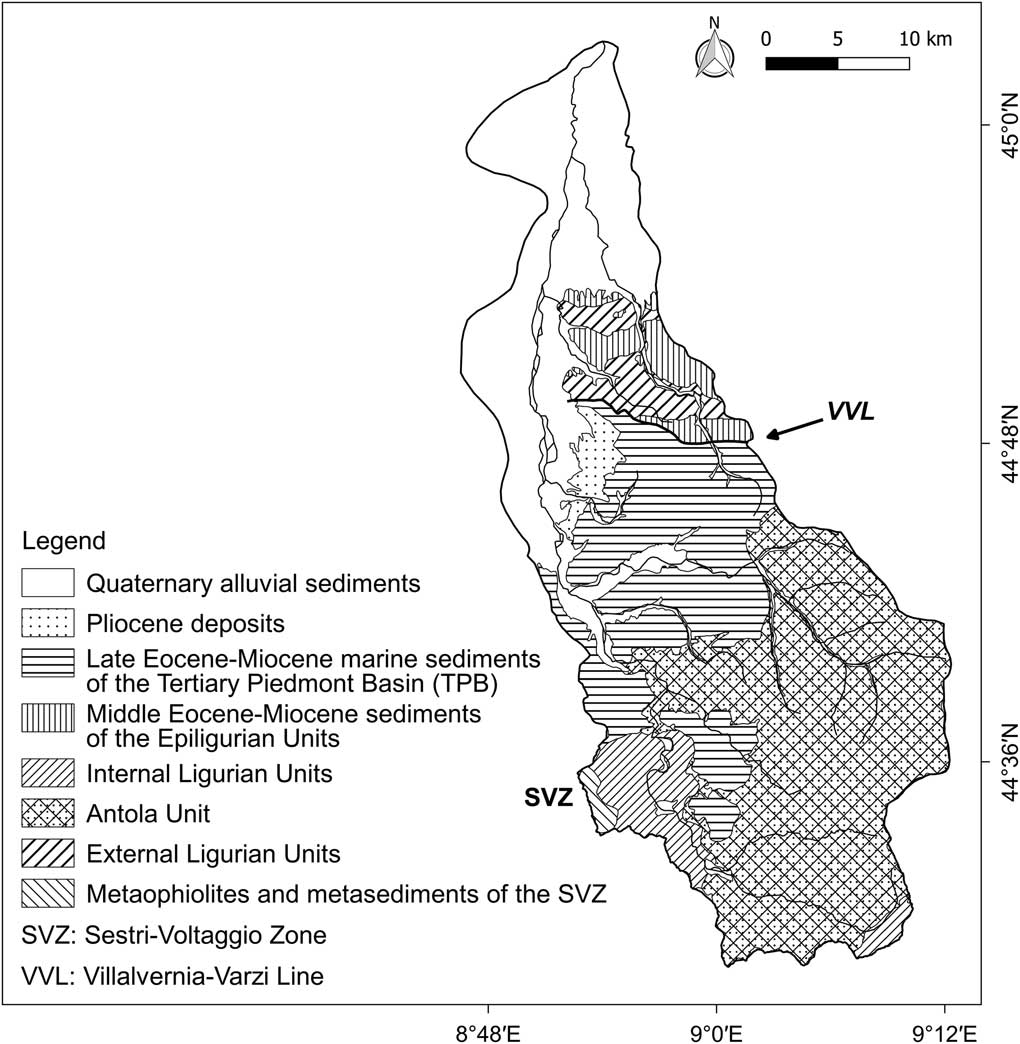
Figure 2. Geological sketch of the Scrivia River catchment. The SVZ is a fault zone that traditionally represents the boundary between the Alps and Apennines. The VVL is a fault zone that separates TPB, to the south, from external Ligurian Units and Epiligurian Units, to the north (see references cited in the text).
The Scrivia River has a mean daily discharge of 14.2 m3/s and a mean annual maximum discharge of 304 m3/s, as recorded for the period 2001–2016 at the gauging station located 5.14 km upstream from the Po confluence. The climate is characterized by hot and dry summers and cold and wet winters, with rainfall concentrated mainly in autumn and at its minimum in summer (Cortemiglia, Reference Cortemiglia2012; Sacchini et al., Reference Sacchini, Ferraris, Faccini and Firpo2012). The annual average rainfall for the catchment is ~900 mm (Autorità di Bacino del Fiume Po, 2001). However, a large difference in rainfall intensity and cumulative rainfall exists between the lower and upper part of the catchment, with the wettest areas being close to the Po–Ligurian drainage divide, near Genoa. These zones are influenced by the atmospheric circulation prevailing over the Ligurian Sea, called the Genoa low (Sacchini et al., Reference Sacchini, Faccini and Luino2016b), which causes exceptional precipitation followed by flood peaks.
The largest floods in the twentieth century occurred in 1945 and 1951, with a peak discharge of ~1800–1900 m3/s (these data are uncertain) and 1650 m3/s measured at the gauging station located 4 km upstream of our study reach. Other extreme floods occurred in 1931, 1934, 1935, 1953, 1960, 1963, 1970, 1977, and 1982 (Alpha Cygni, 1994; Tropeano et al., Reference Tropeano, Govi, Mortara, Turitto, Sorzana, Negrini and Arattano1999). The most recent extreme floods occurred in 1993, 2000, 2002, 2010, 2011, 2013, and 2014 (Mandarino, Reference Mandarino2018, and references therein).
The mountain areas are covered mainly by forest, with sparse cultivated patches. The valley floors are generally very urbanized and contain transportation infrastructure of nationwide importance. Both the hilly areas and the Scrivia River floodplain are intensively cultivated. However, in the past few decades, a growing urbanization of the floodplain has continually encroached upon agricultural land. In the mountainous part of the catchment, there are four reservoirs located in tributary basins.
The study reach is located north of Serravalle Scrivia, from which the valley spreads out and the river becomes unconfined, down to the Po River, for a total length of 40 km. Three main segments characterized by homogeneous landforms are recognizable along the active channel: (1) the upstream section (12.5 km), which has a very wide, straight, and multithread channel; (2) the central section (14.5 km), which has a transitional channel pattern and is the most urbanized; and (3) the downstream segment (13 km), which has a narrow, deeply incised, and sinuous active channel, with short consecutive meanders that give the way to a wide curving river in the last few kilometers (Fig. 3). Bedrock can be observed only at the upstream border of the study reach and about 11 km downstream, where the river erodes the edge of an old fluvial terrace and sedimentary rocks outcrop from sediments in the middle of the active channel, respectively. River sediment can be up to 30 cm in diameter.
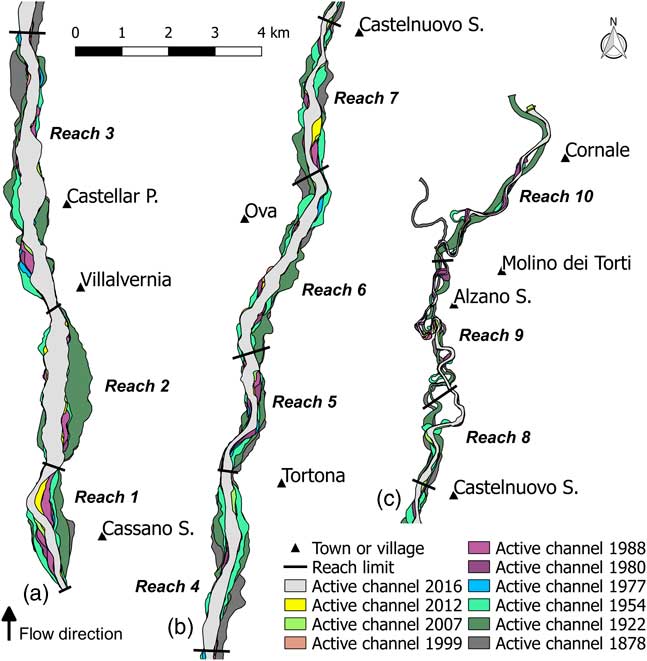
Figure 3. (color online) Sketch representing the complete sequence of digitized active channels in the three homogeneous segments recognized along the Scrivia River. Abbreviated terms are defined as follows: Cassano S., Cassano Spinola; Castellar P., Castellar Ponzano; Castelnuovo S., Castelnuovo Scrivia; Alzano S., Alzano Scrivia.
Many facilities and much infrastructure are located close to the channel, and cultivated fields often spread up to the riverbanks, occupying paleochannels and most of the river corridor (Piégay et al., Reference Piégay, Darby, Mosselman and Surian2005). Moreover, a diffuse presence of river management works, mainly bank-protection structures, is located along the whole study reach. These structures are overall longitudinal defenses, mainly constituted of prisms of concrete used as ripraps (the so-called “prismate”) and to a less extent of rock or concrete revetments.
According to reports and historical sources, sediment was intensively dredged along the Scrivia River during the second half of the twentieth century, as is documented for many other Italian rivers (Conti et al., Reference Conti, Di Eusebio, Dramis and Gentili1983; Farabollini et al., Reference Farabollini, Arigoni, Gentili, Materazzi and Pambianchi2008; Colombo and Filippi, Reference Colombo and Filippi2010). In-channel sediment extraction was particularly severe from the 1960s to 1980s, and after the ban in the early 1990s, it has been sometimes authorized as a river maintenance intervention to prevent flooding or as remuneration for other kinds of hydraulic works (e.g., bank-protection construction). Some studies document a considerable narrowing of the active channel after the 1950s, and a deepening of about 2.5 m of the middle segment near Tortona from 1970 to 1994 (Alpha Cygni, 1994; Cortemiglia, Reference Cortemiglia1998; Tropeano et al., Reference Tropeano, Govi, Mortara, Turitto, Sorzana, Negrini and Arattano1999; Duci, Reference Duci2011). This period was followed by a phase of stabilization or a slight reversal trend evident between Serravalle Scrivia and Castelnuovo Scrivia since 2000, which involved both channel width and riverbed elevation (Duci, Reference Duci2011). At the confluence, the Po active-channel incision was about 4 m wide between 1954 and 1988 (Alpha Cygni, 1994).
METHODS
We performed a detailed historical analysis of riverbeds, considering available cartographic documents and aerial photographs to assess the Scrivia River planform changes. This multitemporal analysis was carried out in a geographic information system (GIS) environment using GRASS GIS (GRASS Development Team, 2017) and QGIS (QGIS Development Team, 2017). Our analysis consisted of three phases: (1) georeferencing of images, (2) interpretation of photographs and digitizing of morphological elements, and (3) vector and raster geoprocessing. Graphs were plotted using the Python library Matplotlib (Hunter, Reference Hunter2007). A large campaign of field surveys conducted during 2016 and 2017 allowed us to characterize the current morphological conditions of the river and support and validate the photographic interpretation phase.
Data sources
We used 10 different data sources covering the period between 1878 and 2016 to investigate channel planform changes. The oldest datum considered is the Gran Carta d’Italia, which is the first existing modern cartographic document covering the study area (Cortemiglia, Reference Cortemiglia2011). This map of Italy, completed in 1903 (Cortemiglia, Reference Cortemiglia2011), was produced by the Italian Institute for Military Geography and is composed of sheets of different scales (1:100,000, 1:50,000, and 1:25,000); we used the 1:25,000 scale sheets published in 1878 (Villalvernia, Tortona, and Castelnuovo S.) and 1882 (Casei Gerola). We combined all the 1:25,000 sheets to obtain a complete coverage of the area, referring to this series as the “1878 map.” The other map we used is dated 1922 and represents an updated version of the 1878 map. From the 1950s onward, the availability of aerial photos grew considerably; and there are many photos available that cover part or the entirety of the Scrivia River floodplain reach. We selected the most representative to ensure consistent interpretations.
We used aerial photographs at ~1:33,000 scale from the “GAI flight,” the first aerial photogrammetric survey covering Italy (1954/1955), and aerial photographs from a 1977 flight. For data from 1980 to 2012, we used a series of orthophotos at 1:5,000 scale (1980) and at 1:10,000 scale (1988, 1999, 2007, 2012). Google Earth images (dated 2016) provide the most recent data.
The QGIS Georeferencer plug in was used to rectify and georeference the oldest maps (1878) and the oldest aerial photos (1954) by applying a thin plate spline transformation for the oldest maps and a second-order polynomial transformation for the aerial photographs. Both were resampled with a nearest neighbor method. We used the 2012 orthophoto series as the base for the georeferencing procedure (UTM-WGS84). Ground control points were located for each processed image around the riverbed but not too far from it (i.e., no more distant than a few kilometers) to minimize the distortion in the area of interest (Hughes et al., Reference Hughes, McDowell and Marcus2006; Block, Reference Block2014; Clerici et al., Reference Clerici, Perego, Chelli and Tellini2015). To assess positional accuracy, we calculated the root mean-square error (RMSE) of each fixed location, and the average RMSE of each image was maintained around 1 pixel width to minimize errors. Available aerial photographs from the 1977 flight and orthophotos dated to 1980 were already georeferenced in the UTM-ED50 coordinate reference system. The 1922 map and data sources from 1988 to 2012 were available from the National Geoportal Web Map Service, with a positional accuracy ≤4 m for the orthophotos. Google Earth images (dated 2016) were visualized in QGIS at a scale of 1:2500 through the Quick Map Service plug in. Working at a fixed scale allowed us to always use the same images whose date was checked directly in Google Earth. The positional accuracy of these “ready-to to-use” data was checked referring to the orthophotos of 2012 by computing the RMSE of a series of control points located on well-defined locations, both on the reference map and the one under evaluation (Winterbottom, Reference Winterbottom2000). These procedures allowed us to obtain a positional error of ≤15 m for the maps and, generally, ≤5 m for the images (Surian et al., Reference Surian, Rinaldi and Pellegrini2009a). An orthorectification process for maps and aerial photos was not required, because the analysis concerned only the floodplain reach of the Scrivia River and did not include slopes (Neteler and Mitasova, Reference Neteler and Mitasova2002; Block, Reference Block2014; Cencetti et al., Reference Cencetti, De Rosa and Fredduzzi2017).
Photographic interpretation and digitization
We performed a photographic interpretation phase to generate a consistent vector geodatabase after the georeferencing procedure was completed. Channel planform changes cannot be assessed by comparing inundated channel dimensions, because discharge may be very different in the data sources considered (Nelson et al., Reference Nelson, Erwin and Schmidt2013), so we manually digitized the active-channel polygon for each series of documents (maps and aerial photographs). The active channel is defined as that portion of surface constituted by wetted channels and adjacent bare or partially vegetated bars (Winterbottom, Reference Winterbottom2000; Surian et al., Reference Surian, Rinaldi and Pellegrini2009a; Nelson et al., Reference Nelson, Erwin and Schmidt2013; Cencetti et al., Reference Cencetti, De Rosa and Fredduzzi2017). The active-channel polygon reflects ongoing geomorphic processes independently of flow conditions at the time of the survey (Block, Reference Block2014). Hence, we assume that the active-channel polygon marks the boundaries of annual high water, substantially coinciding with the bankfull channel (Wallick et al., Reference Wallick, Lancaster and Bolte2006; Cencetti et al., Reference Cencetti, De Rosa and Fredduzzi2017).
The active-channel limits were defined as the boundary between water or bars and surfaces densely covered by stable vegetation; they were generally marked by an abrupt linear change in vegetation density or by a clear topographic break. However, it was very difficult to identify precise riverbed edges in many cases, particularly where steep banks could not be identified and where active vegetated bars blended into the modern floodplain (Rinaldi et al., Reference Rinaldi, Belletti, Comiti, Nardi, Mao and Bussettini2015b). In these cases, changes in vegetation coverage were used to locate the edges. Vegetated surfaces located within the active channel, that is, entirely surrounded by base-flow channels or emergent sediments units, were incorporated into the active-channel polygon due to the complexity of distinguishing between islands and bars covered by annual or biennial plants with a certain degree of accuracy (Rinaldi et al., Reference Rinaldi, Belletti, Comiti, Nardi, Bussettini, Mao and Gurnell2015a). We also digitized wetted channels as lines to compute the braiding index, taking into consideration that aerial photograph series might not show extreme events such as floods or droughts.
Finally, river management works such as bank protection, bridges, weirs, and embankments were digitized on the 2016 images. Bank-protection structures such as gabionades, ripraps, and walls were classified as “longitudinal defenses,” whereas features like groynes were classified as “cross defenses.” Moreover, we characterized them as “certain” or “uncertain” according to their recognizable presence in the field and/or in the data.
Polygons and lines were digitized at 1:5000 scale on maps and at 1:2500 scale from the photographs. In this phase, we identified 10 reaches with homogeneous landforms, each generally ≤5 km (Rinaldi et al., Reference Rinaldi, Surian, Comiti and Bussettini2014), to perform a more detailed analysis. Their limits were located at stable constructions such as weirs and bridges that were present at different time steps. Subsequently, the reaches were defined by considering channel pattern and channel width variations, the presence of ancient fluvial terraces, channel slope, tributaries, and river management works. Channel slope was assessed qualitatively by considering the active-channel longitudinal profile at 10 m steps derived from a high-resolution digital terrain model (5-m-cell size) produced with LIDAR data from a 2009 survey (property of the Piemonte Region).
GIS analysis
We performed a detailed GIS analysis to assess the morphodynamic evolution of the river, starting from the preprocessed set of vector layers. First, we automatically generated the channel centerline, defined as the line of points equidistant from the banks, smoothing the line extracted from Thiessen polygons to obtain a sinuous line (Block, Reference Block2014; Cencetti et al., Reference Cencetti, De Rosa and Fredduzzi2017). Channel width at different time steps was computed at the reach scale by using the ratio of the active-channel area to its length. Moreover, we continuously located transects perpendicular to and at a regular spacing along the whole channel centerline, clipping the transects by the bankfull polygon. Because the direction of the overall planform course did not change significantly over time, except for the more downstream reach, the sinuosity index (Schumm, Reference Schumm1963; Brice, Reference Brice1964; Malavoi and Bravard, Reference Malavoi and Bravard2010), hereafter abbreviated as SI, was computed at reach scale by dividing the channel centerline by the straight line merging the reach endpoints to compare the value in different years. For assessment of the degree of braiding, the braiding index (Ashmore, Reference Ashmore1991; Egozi and Ashmore, Reference Egozi and Ashmore2008), hereafter abbreviated as BI, was computed automatically at reach scale. The BI is defined as the ratio of the total number of channels divided by bars intersecting transects to the total number of transects used. By overlapping all active-channel layers, we identified the historical migration zone (HMZ), following the method of Rapp and Abbe (Reference Rapp and Abbe2003).
To describe channel migration over time, we applied the following parameters: distance of migration (Rapp and Abbe, Reference Rapp and Abbe2003; Giardino and Lee, Reference Giardino and Lee2011; Block, Reference Block2014; Das and Pal, Reference Das and Pal2016), rate of migration (Shields et al., Reference Shields, Simon and J. Steffen2000; Rapp and Abbe, Reference Rapp and Abbe2003; Urban and Rhoads, Reference Urban and Rhoads2003; Hooke, Reference Hooke2008; Giardino and Lee, Reference Giardino and Lee2011), channel activity (Downward et al., Reference Downward, Gurnell and Brookes1994; Nelson et al., Reference Nelson, Erwin and Schmidt2013; Kuo et al., Reference Kuo, Chen, Chen, Yang and Chen2017), and historical channel stability (Downward et al., Reference Downward, Gurnell and Brookes1994).
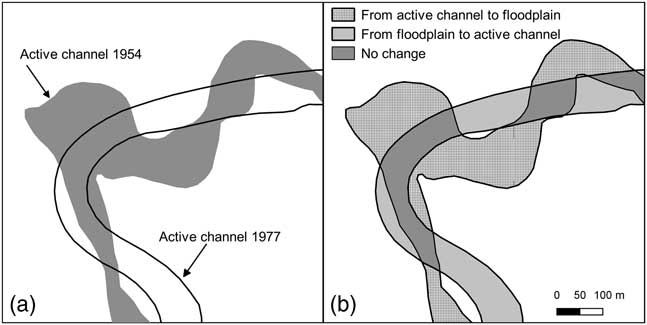
Initially, we defined polygons representing the space subjected to the migration process, hereafter called migration polygons, as illustrated in Figure 4. We did this by considering the portion of surface occurring between two consecutive channel centerlines (centerline migration polygons) and between two consecutive right- or left-bank edges (bank migration polygons) (Fig. 4b). Then we extracted the line equidistant to the two consecutive channel centerlines, hereafter called the migration centerline, using a procedure similar to the one used to obtain the channel centerline (Fig. 4c). Furthermore, we located transects at 25 m regular interval along and perpendicular to the migration centerline (Fig. 4d). These transects were clipped once by centerline migration polygons (Fig. 4e) and by left- and right-bank migration polygons (Fig. 4f), creating three transect layers. The lengths of obtained transects define the distance of migration for centerlines, left banks, and right banks. These length values are referred to the progressive distance from the upstream limit to the outlet of the migration centerline, thus to the entire study reach. This procedure was performed for each couple of consecutive years. This approach allows analysis of both channel migration and channel width changes through channel migration. The latter element, particularly, is rather innovative and likely constitutes the first time that bank migration has been used to accurately assess channel width variations at site scale over time.
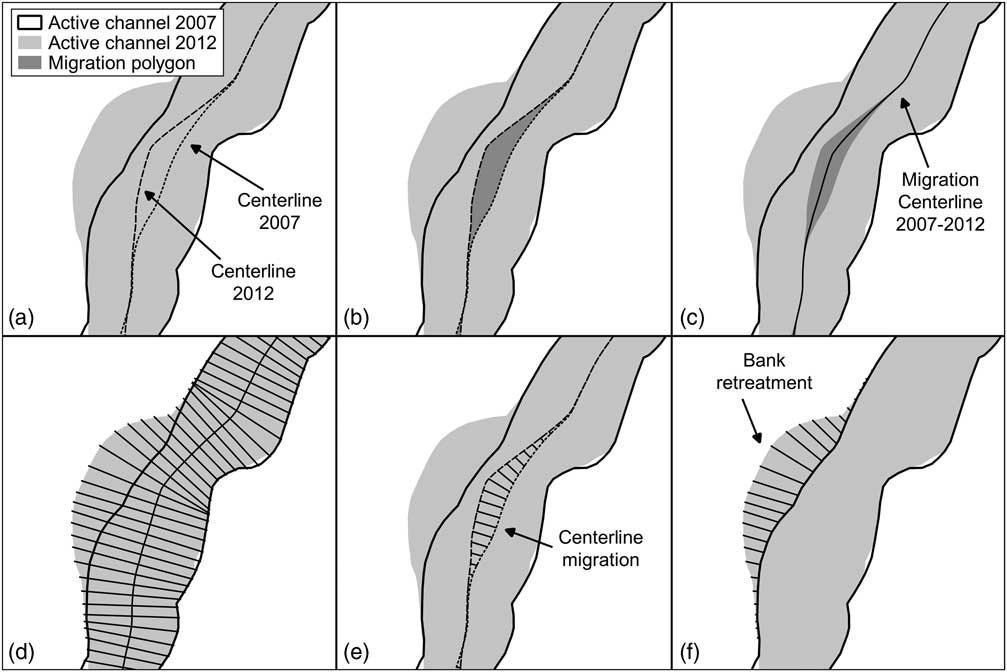
Figure 4. GIS procedure to assess the distance of migration of channel centerline and banks. The 2007–2012 interval is shown as an example. (a) Overlapping of consecutive active-channel polygons with relative centerlines. (b) Centerline migration polygon derived from consecutive centerline intersection. (c) Definition of the migration polygon centerline. (d) Tracing of equally spaced transects orthogonal to the migration centerline. (e) Transects clipped by centerline migration polygon representing the centerline distance of migration. (f) Transects representing the bank retreat that occurred between 2007 and 2012.
To obtain a migration rate (m/yr) for each reach expressed, we divided the centerline migration polygons’ total surface by the length of the oldest of the two channel centerlines and the number of years of the analyzed time interval (see Fig. 4). The same was done for the banks. We started from right- and left-bank migration polygons, dividing their surfaces by the oldest right and left bank length, respectively, and the number of years.
Channel activity is a relevant indicator of channel stability over time; it was defined here by overlaying two consecutive active-channel positions (Fig. 5a) and identifying new active-channel areas (erosion: from floodplain to active channel) and abandoned surfaces (deposition: from active channel to floodplain) (Fig. 5b). We computed the channel activity as the sum of eroded and abandoned surface areas per year (m2/yr) as well as per year and per unit of longitudinal distance (m2/yr/m) (Nelson et al., Reference Nelson, Erwin and Schmidt2013). To identify the prevalent process, we calculated the balance between eroded and abandoned areas and the percentage of no change, for example, stable, active-channel surfaces and the percentage of changed active-channel surfaces referring to the former active-channel area. The latter is defined as the difference between abandoned and eroded areas divided by the oldest of the two channels surfaces compared. Channel activity was computed for both each reach and each kilometer along the whole study reach.

Figure 5. Significance of channel activity parameters; see the text for explanation.
Finally, active-channel polygons were converted to raster files and binarized: pixels were assigned the number of years dividing two consecutive active channels. No data pixels were treated as a zero value. Through an overlay procedure, the historical channel stability (Downward et al., Reference Downward, Gurnell and Brookes1994) was defined by summing up all raster files of the analyzed period to create a map showing the number of years of active-channel occupancy for each pixel. The accuracy of this parameter is strictly related to the number of overlapping data and to their respective survey dates (Downward et al., Reference Downward, Gurnell and Brookes1994); the more data that are available and the closer the survey dates are, the higher the precision.
In recent years, GIS analysis has substantially improved this kind of analysis. Nevertheless, the procedures for computing considered parameters and indices are very time-consuming and error prone. We developed a set of GRASS GIS shell scripts to conduct the analysis to address this aspect. Some of the scripts can be executed automatically, and some in a semiautomatic way.
RESULTS
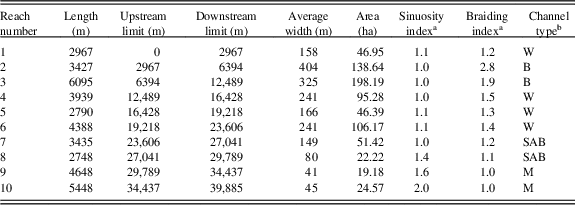
The analyzed maps, aerial photographs, and satellite images show consistent planform changes that occurred along the Scrivia River between 1878 and 2016. Processes of active-channel lateral migration, narrowing, widening and channel-pattern variation took place at different rates in space and time, shaping new riverscapes. We split the study reach into 10 reaches to perform a detailed analysis, the features of which are described in Table 1. From the upstream end to the outlet, the channel pattern changes from multithread to transitional and finally to a single-thread channel. The upstream three reaches present a wide active channel with maximum widths of 404 and 325 m for the second and third reaches, respectively. These reaches are characterized by wide, bare bars or partially vegetated bars that divide some flow channels, resulting in a braided pattern. From the fourth reach downstream, the active channel loses its braiding degree and narrows, thus showing transitional features. The four downstream reaches are characterized by almost parallel banks with a single flow channel. Quite large, alternating bars are evident in the seventh and eighth reaches, but almost disappear in the two downstream meandering reaches, which are about 40 m wide. The mean length of the study reach over the time period considered is 39,464 m. A maximum value of 40,626 m was determined for 1954, and a minimum of 35,228 m for 1878. The most consistent channel length variability is recorded from 1878 to 1954 in the downstream reaches. Thereafter, this parameter was overall quite stable, with variations smaller than 1 km.
Table 1. Main morphological features of identified reaches (related to the 2016 active channel).

a Sinuosity index and braiding index are dimensionless parameters.
b Channel type: B, braided; M, meandering; SAB, sinuous with alternate bars; W, wandering.
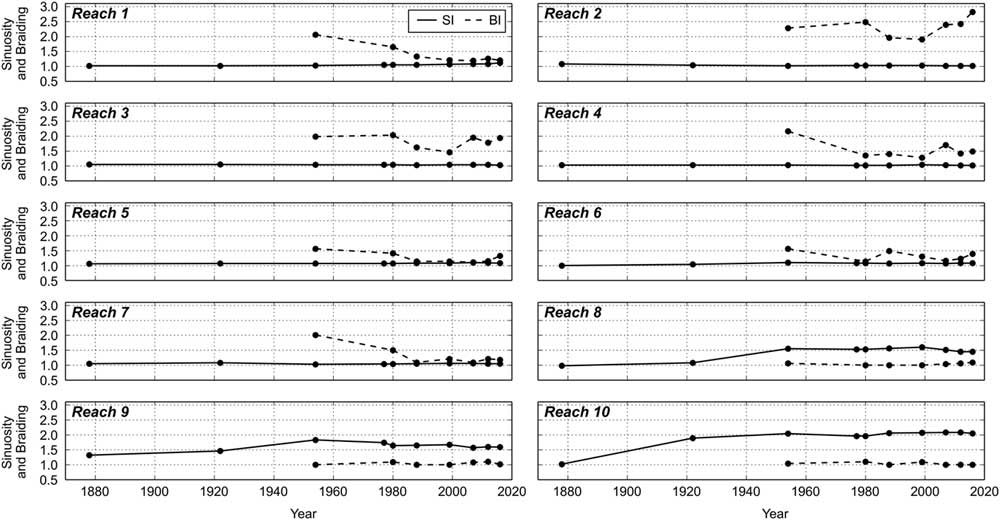
Changes over time for SI and BI are plotted in Figure 6. Differences in SI between reaches 1 to 7 and 8 to 10 are noticeable over the entire period analyzed. The BI evolutionary trend reveals a general decrease until 1999. Subsequently, a comparable reversal trend is noticed for most of the reaches upstream of Tortona, whereas downstream of Tortona up to Castelnuovo Scrivia a smaller inversion of BI tendency is detected from 2007 onward. The BI was quite stable in the last ~13 km, close to 1.

Figure 6. Variations of sinuosity index (SI) and braiding index (BI) over time for each reach.
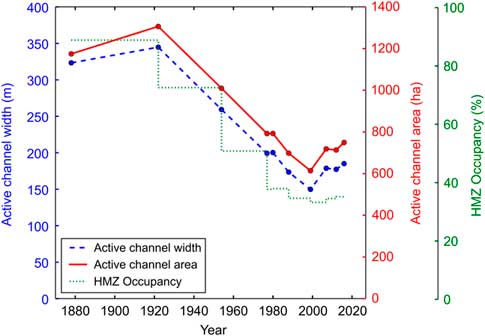
Significant channel width variations affected the Scrivia River over the last 138 yr, as illustrated in Figure 7. In particular, narrowing occurred in all reaches from the upstream end of the study area down to Castelnuovo Scrivia. In contrast, the last 10 km have always been the most stable, showing only small fluctuations over time. Today, each reach has a smaller channel width than its mean channel width computed over the time period considered in this research. In 1922, only the second and the tenth reaches show a consistent widening in comparison with 1878, and no general trend is evident. Thereafter, from the first half of the twentieth century to the end of the 1990s, almost all reaches have a narrowing trend that becomes more representative due to measurements of channel width on aerial photographs (from the 1950s). Comparing active-channel width for 1954 and 1999, from the upstream end of the study reach to Castelnuovo Scrivia, there is mean narrowing of>100 m with width reduction peaks of 240 m (−58%), 178 m (−48%), 142 m (−56%), and 149 m (−52%) in reaches 1, 4, 5, and 7, respectively. Compared with 2016, the decrease is generally minor, with peaks of 128 m (−35%), 88 m (−35%), and 136 m (−48%) for reaches 4, 5, and 7, respectively. Seven of 10 reaches have a maximum narrowing rate (from 3 to 12 m/yr) between 1954 and 1999, and six of those seven reaches from 1954 to 1988. This is the main period of narrowing. Seven of 10 reaches have their minimum mean channel width in 1999, and two in 1988. Nonetheless, referring to the total active channel, the mean channel width decreases almost linearly from 1922 onward (Fig. 8).
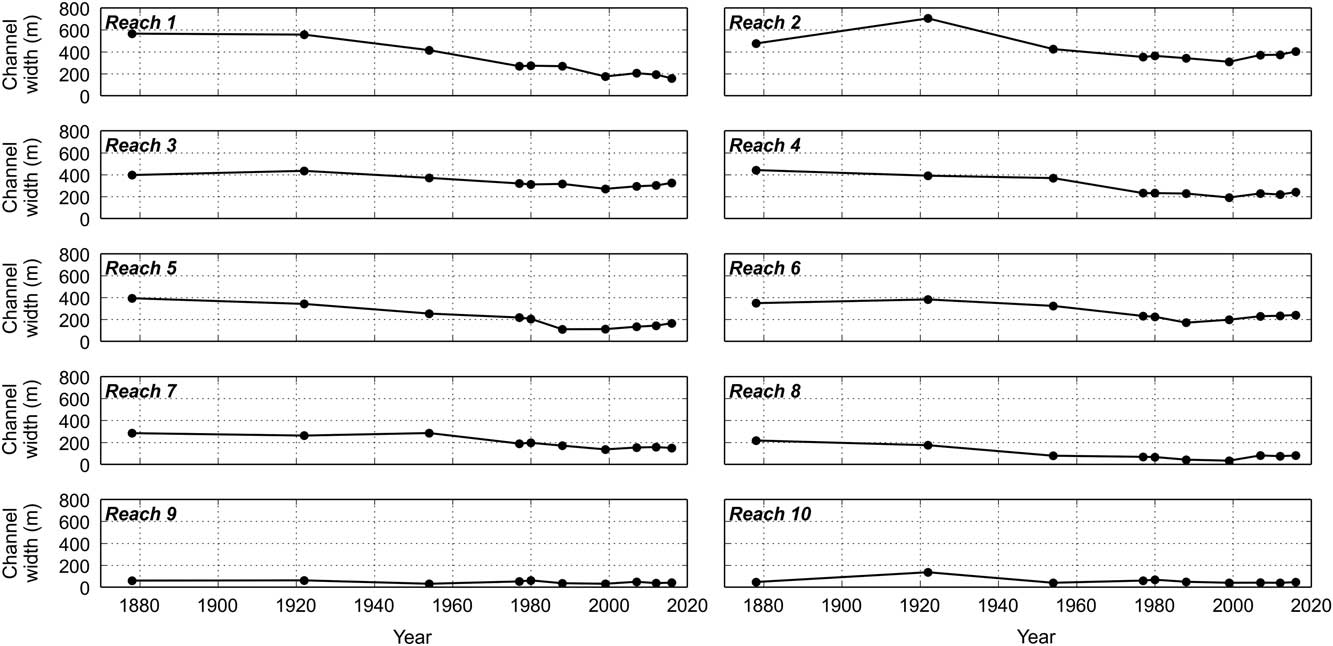
Figure 7. Active-channel mean width variations over time at reach scale.
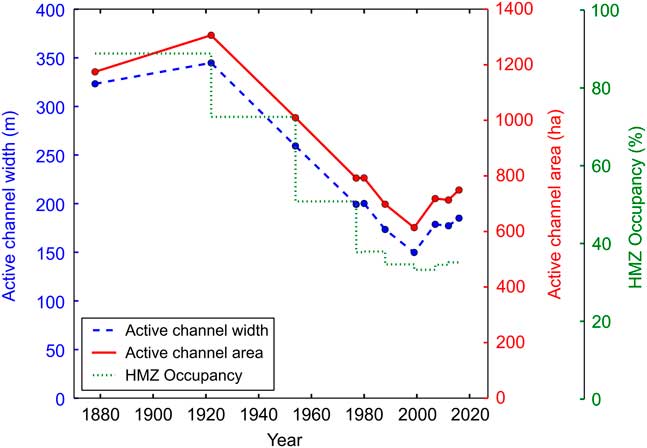
Figure 8. (color online) Comparison of changes in active-channel surface, in mean active-channel width and in percentage of historical migration zone occupied by partial historical migration zone referred to single time steps over time for the entire study reach.
In comparison with 1954, the 1999 channel width was 240 m (58%) smaller in the first reach, about 100 m (27%) smaller in the second and third reaches, and 177 m (48%) smaller in the fourth reach. From Tortona to Castelnuovo Scrivia, the narrowing ranges between about 120 and 150 m (about 50%) in 1988 and 1999 with respect to the 1954 channel width. Channel width changes from a mean value of 288 m measured in 1954 to 149 m in 1999. Just downstream of Castelnuovo Scrivia, after a maximum narrowing of 58% documented in 1999, the stream returns to its former width. In the last two reaches, widening is evident until 1980, followed by a decrease in 1988 and by slightly fluctuating values until 2016. Generally, from 1999 onward, widening is evident in the entire Scrivia River floodplain reach (Fig. 8). Comparing the width at reach scale between 1999 and 2016, peaks of 31%, 48%, and 142% are evident for the second, fifth, and eighth reaches, respectively.
The active-channel area trend analysis (shown in Fig. 8) reveals a loss in surface of 4,253,000 m2 (36%), from 11,743,000 m2 in 1878 to 7,490,000 m2 in 2016. In 1988 and 1999, the lowest active-channel areas are documented. Today, the total channel surface is 24.65% smaller than in 1954 upstream of Tortona, 34.55% smaller between Tortona and Castelnuovo Scrivia, and 6.67% wider up to the Po River.
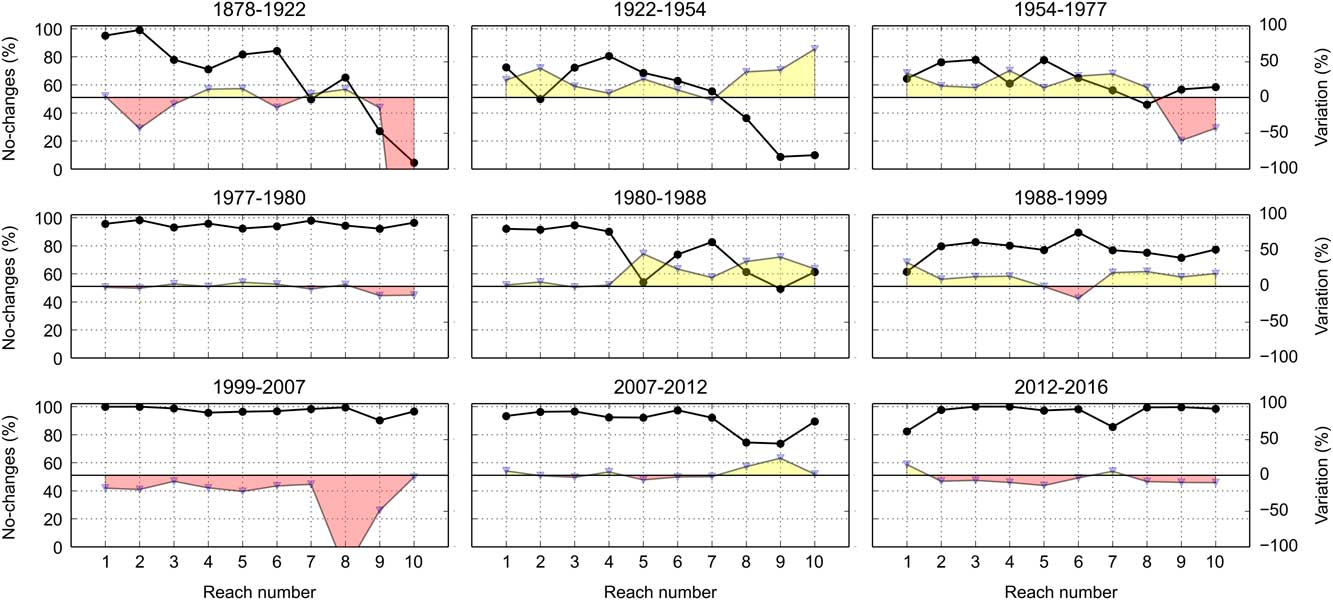
Annual channel activity was generally greater between 1922 and 1954 and in the periods 1977–1980, 1980–1988, and 2012–2016. Net channel change (Fig. 9) reveals that most of the active-channel area was abandoned between 1922 and 1999, which contrasts with changes between 1977 and 1980. From 1999 onward, the conversion from floodplain to active channel dominates, with peaks from the second to the sixth reaches. The percentage of altered active-channel surfaces denotes the previously described evolutionary tendencies, whereas the percentage of unchanged active-channel areas highlights the greatest planform stability in the most recent periods, with the most relevant active channel shifts generally occurring up to the 1950s (Fig. 10). Channel activity analysis at the kilometer scale reveals the same trend, allowing us to identify the placement of changes along the study reach with more spatial detail.
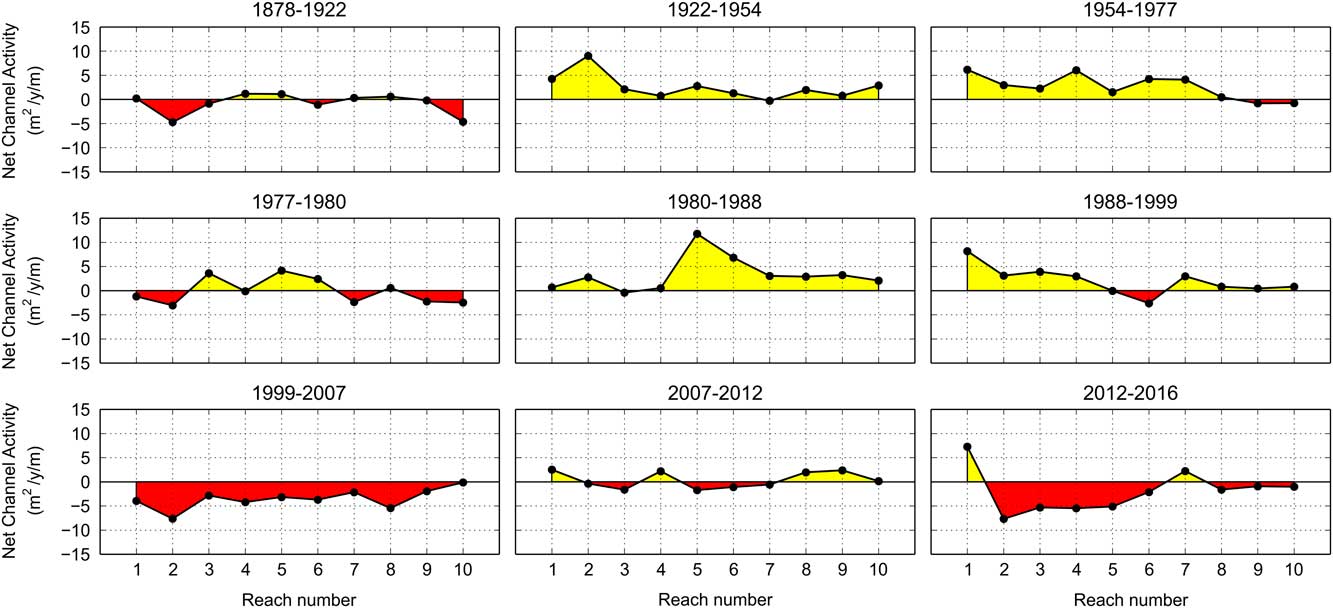
Figure 9. Net channel activity variation at reach scale for each consecutive time step. Values higher than zero (yellow highlight) represent prevailing changes from active channel to floodplain; values lower than zero (red highlight) represent prevailing changes from floodplain to active channel. (For interpretation of the references to color in this figure legend, the reader is referred to the web version of this article.)

Figure 10. Percentage of unchanged area and variation for each consecutive time step. The black line is keyed to the left y-axis and represents the percentage of the most recent channel area overlapping the oldest active channel, referring to the latter's total surface. The gray line is keyed to the right y-axis and represents the percentage of surface variation, referring to the oldest active channel. See Fig. 9 caption for the meaning of yellow and red highlighting. (For interpretation of the references to color in this figure legend, the reader is referred to the web version of this article.)
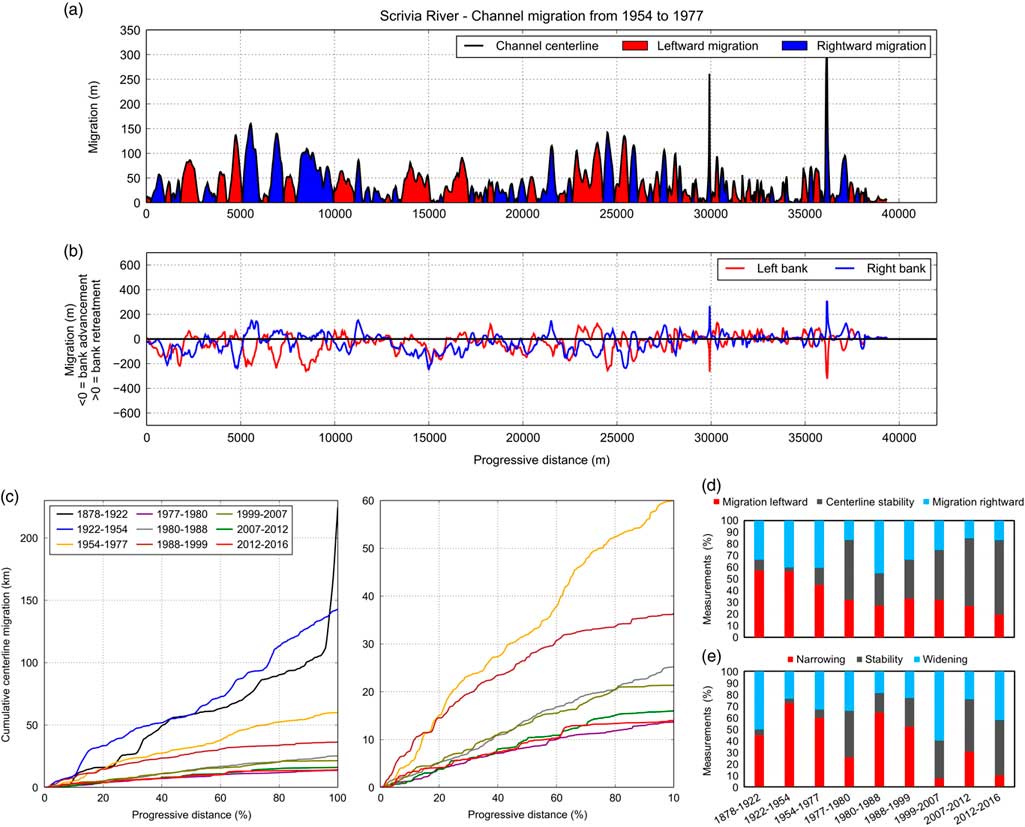
Lateral migration along the entire study reach was assessed in detail continuously and at the reach scale (Figs. 11 and 12). Figure 11a illustrates the channel centerline magnitude and direction of migration plotted against progressive distance, whereas right- and left-bank edge lateral migration is shown in Figure 11b. The period 1954–1977 is chosen as a representative example. This composed plot (Fig. 11a and b) allows the distinction of channel centerline shifting caused by the complete active-channel migration, that is, with banks maintaining their distance from each other, from that associated with active-channel narrowing or widening processes. If a peak referring to the centerline corresponds to two specular peaks for banks (one negative and one positive), the active channel shifted while maintaining its width. In contrast, if it corresponds to only one peak or to two positive or negative peaks, this implies that the indicated shift is accompanied by changes in width. Analyzing all considered periods, the most relevant channel lateral migrations are noticeable before 1977. Between 1878 and 1922 shifts of hundreds of meters are evident. After 1922, the distance of migration values decrease, and the advancement of both banks implies a channel narrowing. From the 1999–2007 period onward, the mean centerline shift was about 10 m, with maximum values<100 m. In the last two periods, that is, after 2007, a few peaks are shown.
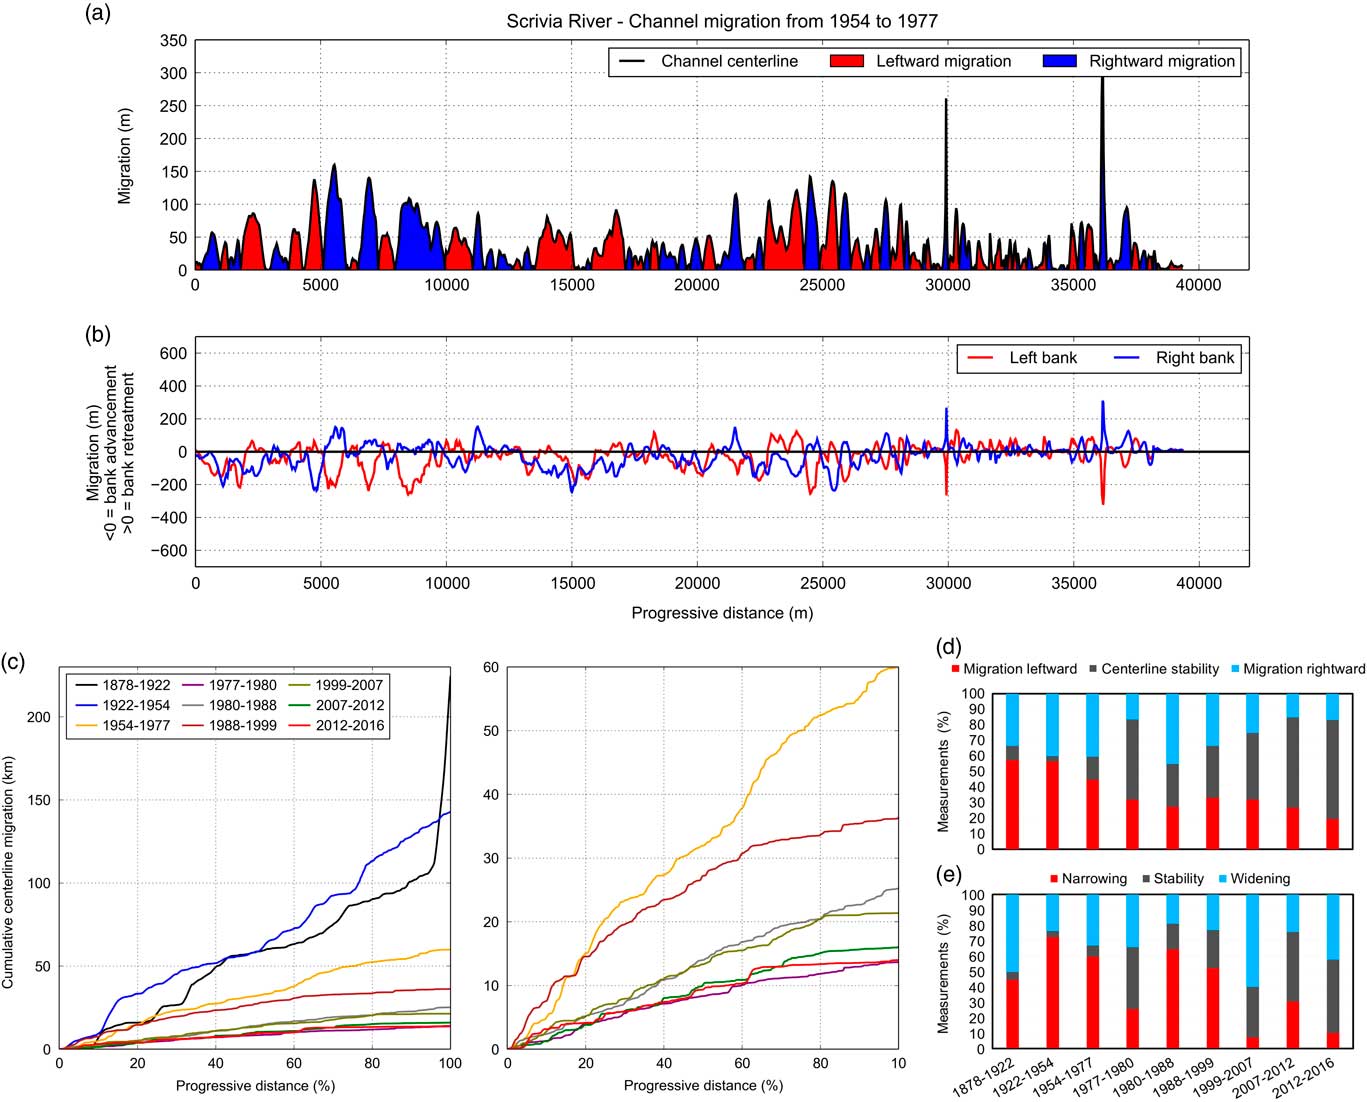
Figure 11. (color online) Distance of migration data. (a) Channel centerline migration plotted against the progressive distance from the upstream limit of the study reach to the outlet. (b) Lateral bank migration; values lower (higher) than zero represent an advance (retreat) of the bank edge with respect to the earliest location. (c) Cumulative channel centerline migration plotted against progressive distance. Steep slopes indicate abrupt migration processes, such as cutoff or avulsion; moderate slopes represent progressive lateral erosion; gentle slopes indicate minimal or absent lateral migration. Channel centerline length is normalized to the percentage of total length (Block, Reference Block2014). The graph on the right shows cumulative curves after the 1954–1977 interval at an enlarged scale. (d) Percentage of channel centerline migration measurements representing channel migration leftward, rightward, or stable over time. (e) Percentage of bank migration measurements recording prevalence of channel narrowing, widening, or stability assessed through the difference between left- and right-bank shifts.
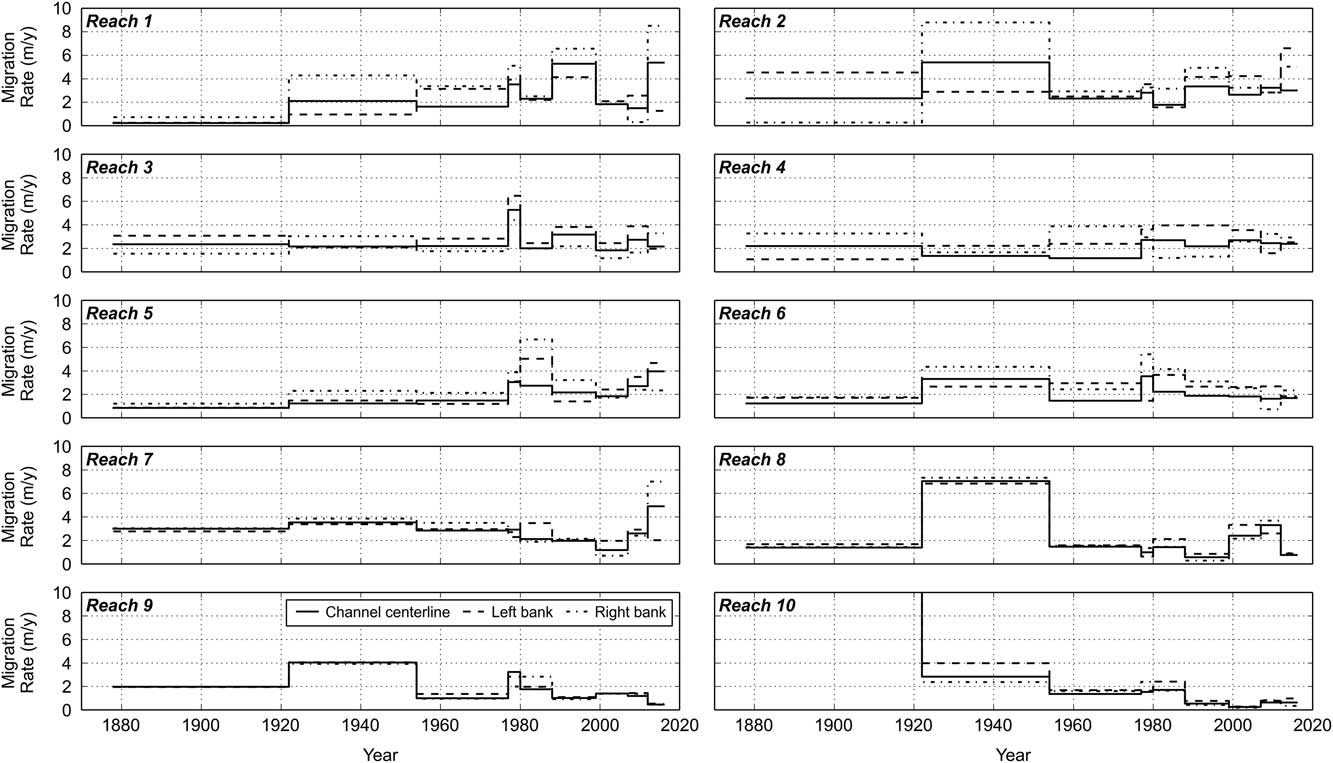
Figure 12. Migration rate variation over time at reach scale.
Figure 11c shows the cumulative migration curves for each period analyzed. Between 1878 and 1922, the curve shows frequent and pronounced steps, indicating abrupt channel migration. In this period, the most relevant increase of the active-channel centerline cumulative migration is evident at ~100% of progressive distance. From the period 1954–1977 onward, lateral shifts become less relevant and pronounced. The cumulative curves reveal that most channel shifts occurred in the periods 1954–1977 and 1988–1999 at a larger scale (Fig. 11c). Other periods show lower values without relevant changes in slope. A general variation in trend is noticed downstream the 70% of progressive distance, where the reduction of steepness implies more stable conditions.
Distance of migration plots (Fig. 11a) show that the number of measurements (i.e., of clipped transects; see Fig. 4) that do not represent centerline lateral migration grows over time, with a minimum of 3.3% between 1922 and 1954 and a maximum of 63.3% in the latest interval (Fig. 11d). The net bank migration, defined for each measurement along the migration centerline as the sum of left- and right-bank migration values (negative or positive values for advances or retreats, respectively, for each bank), was also computed for each time step (Fig. 11e). We assumed that values between −5 and 5 m correspond to no width changes, thereby taking into account errors associated with image-to-map rectification and bank edge location identification. In contrast, values<−5 and>5 m imply that migration of banks is related to active-channel narrowing (negative values) or widening (positive values). Changes in active-channel width related to the lateral migration of bank edges show a great number of records identifying narrowing or widening up to 1977 (Fig. 11e). Thereafter, stability increased considerably up to 48% in the latest period.
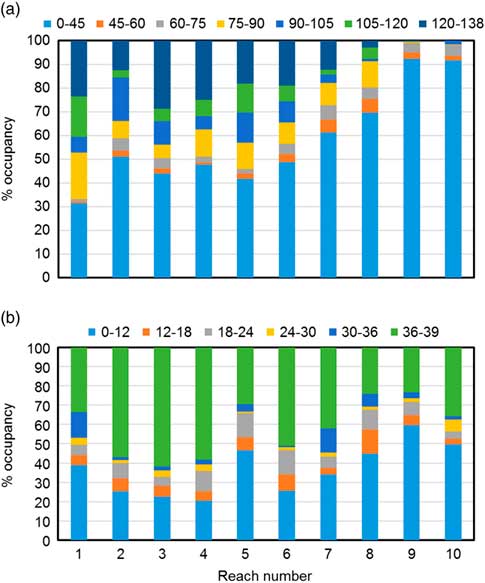
The mean migration rate for the entire Scrivia River ranges between 5.7 and 1.7 m/yr in 1878–1922 and 1954–1977, respectively. At reach scale (Fig. 12), mean migration rate varies between a mean value of 1.8 and 5 m/yr and a median value of 1.3 and 2.8 m/yr. This parameter fluctuates over time. The maximum peak of 35 m/yr is between 1878 and 1922 for the tenth reach. Sometimes left- and right-bank and channel centerline migration rates are not the same and present very different values over time, as seen in the upstream reaches. Five of nine periods show a migration rate less than or close to 3 m/yr for all reaches. The HMZ occupation by partial migration zones over time defines an evolutionary trend similar to that of other parameters (Fig. 8). This trend may be due to a reduction in lateral migration and a moderate lateral migration performed by a narrower channel. Indeed, a narrower channel that shifts moderately into the floodplain involves a lower amount of surface in comparison with a wider channel. The period of active-channel occupancy of the Scrivia floodplain surface over 138 yr reveals that the channel was generally more stable upstream of Tortona (Fig. 13). Downstream of Tortona, the floodplain is progressively younger and the ninth and tenth reaches show>90% of surface to be the lowest class of channel occupancy. The short-term analysis performed between 1977 and 2016 reveals that most of surfaces are in the lowest and highest channel-occupancy classes.
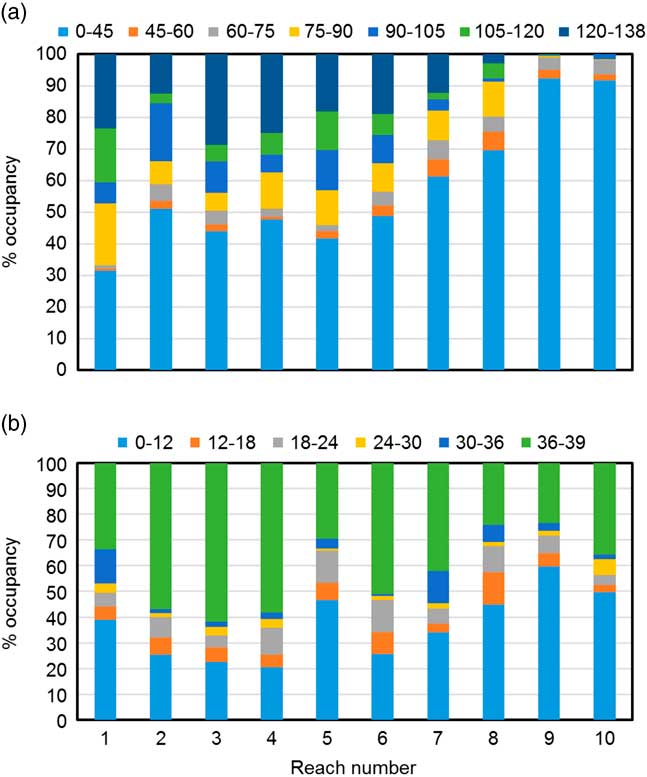
Figure 13. (color online) Long-term (a) and short-term (b) active-channel occupancy of the Scrivia River floodplain at some stage in the 138 yr recorded in this research and in latest 39 yr, respectively. Classes represent the number of years.
DISCUSSION
The results show that relevant planform changes affected the Scrivia River floodplain reach from 1878 to 2016. Furthermore, computed hydromorphological parameters outline clearly recognizable trends in active-channel morphological evolution and allow identification of a sequence of channel-adjustment stages.
In 1878, the Scrivia River flowed approximately northward according to the actual direction up to Castelnuovo Scrivia; then a completely different path is documented. Where meanders developed in the twentieth century, the riverbed was quite straight and flowed northwestward up to the Po River. Two bottlenecks already existed close to Tortona and Castelnuovo Scrivia in 1878, due to the presence of bridges and the town itself. An avulsion occurred between 1878 and 1922. According to historical sources, in 1887 an intense Po River flood created a new channel southward, close to Alzano Scrivia. This avulsion process caused the flooding and ruin of the small village Rotta dei Torti, already damaged by previous flooding events. The Scrivia River was shortened, and in the period covering the late nineteenth century and early twentieth century, it joined the Po River some 3.6 km upstream from its present location (Sacco, Reference Sacco1928). Later, the Po River abandoned its new channel, which became the Scrivia active channel, and the confluence therefore shifted toward the northeast. Evidence of these events is recognizable on maps and aerial photographs and was visible in the field up to few years ago. Moreover, the relevant difference in radius of meander curvature upstream (narrow meanders) and downstream (soft and wide bends) of Alzano Scrivia is likely due to these events. These events also represent the forces shaping the consistent channel length and sinuosity increase recorded in that period. From the upstream end to Castelnuovo Scrivia, in the period from 1922 to 1999, a general trend of consistent narrowing and progressively decreasing channel lateral mobility is evident, as is increased channel stability. Nevertheless, banks became gradually closer due to the narrowing process described earlier, and this precluded a generalized lowering of the channel centerline migration rate. Furthermore, the reduction in HMZ occupancy by both active channel and partial HMZ of consecutive time steps confirms narrowing and stabilization, respectively.
Downstream of Castelnuovo Scrivia toward the Po River, different geomorphic evolutionary trends are noticeable, and meandering occurred up to 1977. Channel width decreased significantly in reach 8 up to 1954, and after that a lower reduction is evident until 1977. The last two reaches show low fluctuations around the mean value of about 50 m, except for the tenth reach in 1922, the width of which is influenced by the previously described dynamics. From 1977 to 1999, a slight increase in channel width was followed by narrowing and a lack of channel-bend evolution. The clearly recognizable variations of computed values in 1977 and between 1977 and 1980 are due to the flood of the October 7–8, 1977, which was one of the most relevant recent floods and triggered diffuse bank-erosion processes along the whole study reach.
Since the 2000s, geomorphic evolutionary trends have changed. A morphological restoration is recorded collectively by all considered parameters. This reversal trend was triggered by some relevant floods, in particular the consecutive events that occurred from 2010 to 2014. These events reactivated geomorphic processes modeling bars, wetted channels, and banks. In particular, between 2012 and 2016, multiple and locally very intense bank-retreat processes are evident. However no avulsions or cutoff occurred, and cumulative curves of centerline migration generally register a gradual shift, with only a few steps related to locally intense bank-retreat processes.
Aerial photographic analysis highlights that before the 1950s, the lateral migration of the Scrivia River was already controlled by bank protections. Initially groynes and, from the 1970s and 1980s onward, prisms of concrete used as ripraps heavily conditioned lateral dynamics stabilizing riverine areas. Generally, this active-channel stabilization, together with narrowing, led to a gradual disconnection between the riverbed and adjacent areas. This caused the active floodplain to become a recent river terrace, and parts of the active channel have transformed into the modern floodplain. This kind of morphological evolution is usually associated with a channel incision process (Hupp, Reference Hupp1999; Simon and Darby, Reference Simon and Darby1999; Hupp and Rinaldi, Reference Hupp and Rinaldi2007). In the case of the Scrivia River, this process actually occurred during the second half of the twentieth century, and it certainly was promoted by intense in-channel sediment quarrying. Consequently, riverine areas were farmed and occupied by quarries, facilities, and infrastructure, increasing the level of river-related risk. Today, the main critical issues are near Tortona, where industrial areas, highways, and dumps are located close to the bank edge. Elsewhere agriculture has spread up to the riverbed. Especially in the second half in the twentieth century, a diffuse and often illegal practice consisting of occupying the terrain left by rivers was realized by farmers (Brunetti, 1987a, 1987b; Ente Riserve Naturali Garzaia di Valenza e Garzaia di Bosco Marengo, 1988; Mandarino, Reference Mandarino1995). These events set off a growing citizen protest from the 1970s to the end of the 1980s (Brunetti, 1987b; Regalzi, Reference Regalzi1989). Supported by two municipalities, this protest led to the institution of restricted areas to preserve fluvial, that is, state-owned, plots of land.
These morphological adjustments led to a variation in channel type generally from a multithread to a transitional or single-thread pattern for some reaches. This channel planform change occurred just where sediment-mining activity, bridge-associated check dams, facilities, and infrastructure were concentrated, that is, mainly in the central part of the study reach. Furthermore, channelization caused a decrease in sinuosity downstream of Castelnuovo Scrivia.
Recent widening, triggered by floods and underlined by the presence of diffuse high and steep retreating banks along the river, particularly downstream of the seventh reach, can be interpreted as a morphological response to alterations and to riverbed narrowing and lowering. Today, the Scrivia River is widening, affecting recent river terraces and modern floodplains, both of which formed during the recent decades characterized by channel incision and narrowing. Bank-protection structures are often undercut at their base or have already collapsed. For this reason, during the last 10–15 yr, further bank protections were built locally to stabilize some natural banks or to restore ancient defenses. This accounts for the channel widening and the increase in activity noticed between 2007 and 2012 in reaches 8 and 9. Today, 52% of the Scrivia River banks are protected by human-built structures. The least-channelized reach is the second reach, which has the highest diversity of fluvial landforms. From the third reach up to the Po River, high percentages of protected banks are registered, ranging between 47% and 71% of total bank length (sum of left and right), and always greater than 60% downstream of the sixth reach.
CONCLUSIONS
This study highlights channel planform changes that occurred along the Scrivia River floodplain reach from 1878 to 2016. Three well-defined periods of active-channel evolution in the Scrivia River are evident: (1) from 1878 to the 1950s; (2) from the 1950s to the end of 1990s; and (3) from the end of 1990s onward. In the first period, the river was generally able to migrate in its floodplain, shaping the riverscape, and even if people acted to gain land and to use the river resource, we cannot exclude that those morphological variations were due to natural processes. Because groynes are documented as already existing in the 1954 aerial photographs, it is likely that a diffuse bank-stabilization process had already begun in the last part of the first period. Active-channel narrowing, progressive blocking of lateral dynamics, and the resulting increase in channel stability characterize the second period. Narrowing affected all reaches between Cassano Spinola and Castelnuovo Scrivia, whereas a reduction in braiding degree is evident in some reaches. Downstream of Castelnuovo Scrivia, meandering processes were blocked from the 1970s onward. During the second period, particularly between the 1960s and the 1980s, the Scrivia River was greatly affected by human alteration mainly consisting of severe in-channel sediment quarrying, channelization works, and consecutive occupation of old channels and areas of fluvial pertinence. The most recent period shows a reversal of these evolutionary trends and is characterized by reactivation of stabilized surfaces and diffuse bank erosion that caused local channel widening and reactivation of lateral dynamics blocked for decades.
The active-channel planform evolution generally follows the morphological trends displayed by most of Italian and European rivers for the same period, as reported by Pellegrini et al. (Reference Pellegrini, Maraga, Turitto, Audisio and Duci2008) and Cencetti et al. (Reference Cencetti, De Rosa and Fredduzzi2017). Considering the morphological response of rivers to human disturbance, as described by Surian and Rinaldi (Reference Surian and Rinaldi2003), it is evident that the morphological evolution of the Scrivia River over the last 138 years has been heavily influenced by documented human activities. Sediment mining, channelization, and consequent occupation of riverine areas are certainly a relevant cause of such consistent and rapid morphological changes. Floods also played an important role in triggering the main processes and in distributing morphological responses to human alterations along the entire riverbed (Kondolf, Reference Kondolf1994). In particular, the extreme floods of 1977 and 2010 to 2014 have been important in the morphological evolution of the Scrivia River.
The current phase of the river’s evolution represents a partial recovery of morphological processes, that is, the response of the Scrivia River to severe channel alterations, as documented by Ziliani and Surian (Reference Ziliani and Surian2012) and Bollati et al. (Reference Bollati, Pellegrini, Rinaldi, Duci and Pelfini2014) for other Italian rivers that experienced similar morphological changes. However, after decades of stability, narrowing, and blocked dynamics, it seems unthinkable to people that the river can move in its floodplain, where agriculture, facilities and infrastructure have often spread up to the bank edges. For cultural, historical, and economic reasons, people bordering the river ask for new but “old school” interventions, such as new bank protections and/or dredging activities, to stabilize the ongoing dynamics. In this light, the complaints of neighboring people and local governments stating “the river has always been there” have to be questioned, because this is obviously not the case, as documented in this research. Our findings are of potentially great importance, especially in terms of river management. Moreover, our results might also be taken into consideration in urban planning processes and disseminated widely to raise awareness about rivers. Finally, understanding river dynamics allows easier execution of sustainable and effective river management strategies aimed at mitigating risks and restoring the fluvial environment. This is particularly relevant, especially in regard to the European Water Framework Directive and the European Flood Directive (European Commission, 2000, 2007; Hooke, Reference Hooke2008).
ACKNOWLEDGMENTS
The authors thank Luisa Pellegrini (University of Pavia), who provided much information and many maps and aerial photos of the Scrivia River. Furthermore, we sincerely thank the Senior Editor Lewis Owen, the Guest Editor David Bridgland, and two anonymous reviewers for detailed and helpful comments and suggestions that substantially improved the article.