


INTRODUCTION
A series of sea caves and rock shelters with strong anthropogenic contributions are found at Pinnacle Point (PP) near Mossel Bay in the Western Cape Province, South Africa (Fig. 1). All of the caves preserve isolated sediment exposures with different depositional facies and vertical and lateral variations. Two of these, PP13B and PP5-6, have been the target of extensive archaeological excavation and analysis (Marean et al., Reference Marean, Bar-Matthews, Bernatchez, Fisher, Goldberg, Herries and Jacobs2007; Brown et al., Reference Brown, Marean, Herries, Jacobs, Tribolo, Braun, Roberts, Meyer and Bernatchez2009; Marean, Reference Marean2010; Marean et al., Reference Marean, Bar-Matthews, Fisher, Goldberg, Herries, Karkanas, Nilssen and Thompson2010; Brown et al., Reference Brown, Marean, Jacobs, Schoville, Oestmo, Fisher, Bernatchez, Karkanas and Matthews2012; Karkanas et al., Reference Karkanas, Brown, Fisher, Jacobs and Marean2015; Smith et al., Reference Smith, Jacobs, Johnsen, Ren, Fisher, Oestmo and Wilkins2018), and study of their sediments demonstrated that a suite of natural sedimentation processes operated at the same time when anthropogenic sediments were accumulating. These include beach formation, spring water action, aeolian activity, roofspalling, speleothem formation, and root encrustation and cementation. Additionally, several erosional episodes have resulted in a complicated stratigraphy (Karkanas and Goldberg, Reference Karkanas and Goldberg2010; Karkanas et al., Reference Karkanas, Brown, Fisher, Jacobs and Marean2015). It was also shown that PP13B and PP5-6 are associated with a fluctuating coastal environment (Fisher et al., Reference Fisher, Bar-Matthews, Jerardino and Marean2010; Cawthra et al., Reference Cawthra, Jacobs, Compton, Fisher, Karkanas and Marean2018), and frequent changes in sea level and climate controlled patterns of sedimentation and the presence or absence of humans. Research in Pinnacle Point caves and rock-shelters with anthropogenic contributions (PP9 and PP5-6) is ongoing.

Figure 1. (color online) Panorama of Pinnacle Point caves and an example of fault zone photographed from boat to the southeast.
A variety of caves at PP do not bear anthropogenic remains. Some of their sedimentary remnants have been dated to more than 1.1 Ma based on the correlation of four different chronological methods (Pickering et al., Reference Pickering, Jacobs, Herries, Karkanas, Bar- Matthews, Woodhead, Kappen, Erich Fisher and Marean2013). Staircase Cave and Crevice Cave have been studied in detail and do not have anthropogenic remains. PP29 is filled with sediment but there are no archaeological remains visible on the surface and it has not been excavated. Most caves at PP have extensive speleothem formations and samples from Staircase Cave, Crevice Cave, and PP29 have been isotopically analyzed for paleoclimate and paleoenvironmental reconstruction (Bar-Matthews et al., Reference Bar-Matthews, Marean, Jacobs, Karkanas, Fisher, Herries and Brown2010; Braun et al., Reference Braun, Bar-Matthews, Matthews, Ayalon, Cowling, Karkanas, Fisher, Dyez, Zilberman and Marean2019; Braun et al., Reference Braun, Bar-Matthews, Matthews, Ayalon, Zilberman, Cowling, Fisher, Herries, Brink and Marean2020). These caves offer the opportunity to understand the purely geogenic signature of the locality under the same geologic and sedimentary conditions as those caves with anthropogenic contributions, and thus represent a geogenic baseline for the locality. They can also provide important information on the opening and closing of the caves by external processes, such as dunes or wave erosion, and internal processes, such as collapse and seepage water. Study and reconstruction of this “life history” of the caves provides contextual background to the paleoanthropological and speleothem studies, but also enriches our understanding of the paleoenvironment and evolution of the paleoscape (Marean et al., Reference Marean, Anderson, Bar-Matthews, Braun, Cawthra, Cowling and Engelbrecht2015).
Archaeologists generally focus their attention on the archaeological deposits without concerning themselves with the life history of the cave, and we think this limits the potential contribution of archaeological studies of caves. The life history of sea caves sets the potential for occupation—they have a birth (generally through cutting by high sea levels), they are sometimes closed by dunes or in the intertidal range and thus exclude human occupation, and then they open and die by collapse usually during a new sea-level high stand. The cave life history has important information on climate, environment, and, of course, human occupation embedded in it and provides important links to global and regional sequences of paleoclimate and paleoenvironmental changes. However, even if individual cases are well-studied in this respect, the processes that characterize an area are often not modeled. One reason that archaeologists have not modeled this life history is because they do not typically have well-preserved records of pre-occupational processes and the record is usually dominated by the most recent processes. The earliest processes typically are only recorded in very small, isolated remnant sediments not easily studied or the excavation stops when archaeologically sterile layers are found. On the other hand, geomorphological or sedimentological studies of non-archaeological caves do not normally link particular stages of their evolution with the possibility of being occupied by humans and the environmental conditions related to this occupation.
At PP we have studied in detail the remnant deposits at Staircase Cave, Crevice Cave, and PP29 (Fig. 1). The surviving sediments are small and patchy, and do not provide rich field data for adequate interpretation of their evolution. Nevertheless, using a suite of field and petrographic techniques and dating analyses we were able to develop a cave life history model for the caves’ life history that characterizes them well and helps us understand the history of human occupation at PP.
METHODS
All the caves, sediments, and samples were mapped by total station in the South African National grid. 3D models of all the caves have been constructed in ArcGIS. In addition to field study of the sediment's micromorphology, samples were cut from the cemented sediments with an angle grinder or diamond-tipped core bit mounted on a modified chain saw body. Large format (7 × 5 cm) petrographic thin sections were prepared by Spectrum Petrographics and studied under a stereomicroscope and a petrographic microscope following standard petrographic techniques. A set of polished thin sections were also prepared and further analyzed with the microprobe. Elemental analysis on the carbonate cement of the sediments was performed with a JEOL JSM 5600 with Oxford microanalysis system in the Institute of Geology and Mineral Exploration, Greece.
230Th–U dating of speleothems was conducted at the Geological Survey of Israel following the procedures described by Vaks et al. (Reference Vaks, Bar-Matthews, Ayalon, Matthews, Frumkin, Dayan, Halicz, Almogi-Labin and Schilman2006) using a multicollector inductively coupled plasma mass spectrometer (MC-ICP-MS, Nu Instruments [UK]) equipped with 12 Faraday cups and three ion counters. The samples were introduced to the MC-ICP-MS through an Aridus micro-concentric desolvating nebuliser sample introducing system. The instrumental mass bias was corrected for (using an exponential equation) by measuring the 235U/238U ratio and correcting with the natural 235U/238U ratio. The calibration of ion counters relative to Faraday cups was performed using several cycles of measurement with different collector configurations. The age determination was possible due to the accurate determination of 234U and 230Th concentrations by isotope dilution analysis using the 236U-229Th spike. Values of half-lives for 230Th and 234U were taken from Cheng et al. (Reference Cheng, Edwards, Shen, Polyak, Asmerom, Woodhead and Hellstrom2013). All ages were corrected for detrital thorium assuming an initial 230Th/232Th atomic ratio of 4.4 ± 2.2 × 10⁻⁶, the values of material in secular equilibrium with the bulk earth 232Th/238U ratio of 3.8. Results of the stable isotopic analysis of individual samples are given in Supplementary Tables 1 and 2.
All optically stimulated luminescence (OSL) dating was performed at the University of Wollongong, Australia. OSL dating provides an estimate of the time elapsed since luminescent minerals, such as quartz, were last exposed to sunlight (Huntley et al., Reference Huntley, Godfrey-Smith and Thewalt1985; Aitken, Reference Aitken1998; Lian and Roberts, Reference Lian and Roberts2006; Jacobs and Roberts, Reference Jacobs and Roberts2007). Buried grains will accumulate the effects of the nuclear radiation flux to which they are exposed, and the burial dose (“equivalent dose,” De) can be measured using the OSL signal. The burial ages were calculated from the equivalent dose divided by the total dose rate due to ionizing radiation.
In situ samples were obtained by either drilling the cemented outcrops inside the cave with a core drill, or by hammering lumps of sediment off with a hammer or hammering opaque plastic tubes into cleaned section walls to collect unconsolidated sand samples. For the core-drilled samples, a subsample was chosen for OSL dating based on the presence of visible colour or texture changes. If the samples were homogeneous, but overlain by a flowstone, then the sample was taken furthest away from the flowstone to overcome any complexities with dosimetry due to the presence of the flowstone. The outer light-exposed grains were removed in the laboratory under dim, red light illumination using concentrated hydrochloric acid (HCl) to dissolve the carbonate holding the grains together. The samples for which lumps were hammered off were very thin and small and were totally dissolved in HCl, which introduced the likelihood of zero-age grain contamination in these samples. Quartz grains of 180–212 μm diameter were isolated for OSL dating and purified using standard procedures (e.g., Aitken, Reference Aitken1998), including etching by hydrofluoric acid to remove the external alpha-dosed layer.
De values were estimated from multi-grain aliquots (~30 grains/aliquot) for most samples. Individual grains were measured for those samples that contained zero-age contamination, individual grains were also measured to enable rejection of zero-age grains. OSL data were obtained and analyzed using the single aliquot regenerative-dose protocol, experimental apparatus and statistical models described elsewhere (Galbraith et al., Reference Galbraith, Roberts, Laslett, Yoshida and Olley1999; Bøtter-Jensen et al., Reference Bøtter-Jensen, Bulur, Duller and Murray2000; Wintle and Murray, Reference Wintle and Murray2006).We used the central age model (Galbraith et al., Reference Galbraith, Roberts, Laslett, Yoshida and Olley1999) to determine the relative spread in De values remaining after making allowance for measurement uncertainties (i.e., the overdispersion). Burial doses and OSL ages were calculated from the weighted mean of the independent estimates of De, using the central age model for each of the samples.
The total dose rate for each sample was calculated as the sum of the beta, and gamma and cosmic-ray dose rates external to the grain and an effective alpha dose rate from radioactive inclusions internal to the quartz grains (estimated from measurements made previously on quartz grains from the southern Cape coast; Jacobs et al., Reference Jacobs, Wintle and Duller2003) was also included. The De and dose rate information are presented in Supplementary Table 3, together with the optical ages for all samples. The error on the weighted mean is reported at the 68% confidence interval.
GEOLOGIC FRAMEWORK
The caves and rock-shelters at PP are formed within the Table Mountain Sandstone (TMS), which in the area of PP is a strained and recrystallized mica and feldspar quartzite. Brittle-ductile shear zones transect the TMS along which most of the caves of the area are developed, facilitated also by the presence of a dense fracture system. The process of formation of a cave is mainly mechanical and involves grain-by-grain removal by water flowing with high energy, since in quartzite, dissolution is restricted to crystal contacts (Martini, Reference Martini, Klimchouk, Ford, Palmer and Dreybrodt2000). Differential erosion along the shear zones, which act as planes of weakness, must be the result of prolonged high stands of the sea, since a series of caves all formed at the same heights (Fig. 1). It has been observed that the same shear zone when it is steeply inclined can bear more than one cave or cavities at different heights (e.g., PP5-6; Karkanas et al., Reference Karkanas, Brown, Fisher, Jacobs and Marean2015). The height of the floor of the cave entrance can be up to ~20 m, their depth reaches more than 35 m (and may be deeper as they are filled with sediment) and the largest (PP9) has a floor area of over 600 m2. It is thus reasonable to assume that multiple marine transgressions were responsible for producing some of the larger caves in the hard, non-dissolving quartzite. Note that some of the caves have complex internal configurations (small blind tunnels and ledges) where beach remnants are found in different discrete levels, suggesting that the caves can survive several high stands without collapsing (Pickering et al., Reference Pickering, Jacobs, Herries, Karkanas, Bar- Matthews, Woodhead, Kappen, Erich Fisher and Marean2013).
The height of the cliffs at PP is ~60 m. On top of the cliffs an abrasion platform is developed that should be attributed to a pre-Pliocene high sea level (Hendey, Reference Hendey, Deacon and Lambrechts1983; Haq et al., Reference Haq, Hardenbol and Vail1988). The platform is covered by a 1–2 m thick calcrete with a laminar indurated cap (cf. Wright and Tucker, Reference Wright, Tucker, Wright and Tucker1991) formed on aeolian sand. Remnants of red sandy paleosols are located between the modern top soil and an extensive loose aeolian sand cover. The intensively fractured TMS facilitates percolation of water, which, upon dissolving the calcrete, becomes saturated with calcite that precipitates calcium carbonate speleothems inside the caves (Bar-Matthews et al., Reference Bar-Matthews, Marean, Jacobs, Karkanas, Fisher, Herries and Brown2010). However, relatively higher energy seepage water is expected in caves close to sea level since the small thickness of the overlying quartzite bedrock and its dense fracture system facilitates fast downward movement of the infiltrated ground water forming a temporary water table that is always close to sea level.
MODERN DAY ANALOGUES OF THE MAJOR EVENTS IN THE CAVE LIFE HISTORY
Caves are forming today throughout the south coast of South Africa in the intertidal zone along the aforementioned shear zones (Fig. 2a). We have visited many of these to better understand the formation of the PP caves. Their floors are usually covered with well-rounded boulders of quartzite, gravel, and sand (Fig. 2b). Breakdown of the roof and wall quartzite contributes to the clastic sedimentation of the beach at the front but high energy waves ensure redistribution, rounding and sorting of the roofspall clasts.

Figure 2. (color online) Image of a modern sea cave. Length of opening of the cave is about 2 m. (a) Note the collapsed block in front of the cave. (b) Formation of rounded pebbles and boulders on the floor of the cave due to wave action.
Old caves that are above the intertidal zone are covered with angular and unsorted loose roofspall due to slow weathering of the schistose quartzite by seepage water. Where there is some space between the intertidal zone and the cliffs, depending on the orientation of the cliffs and the wind, aeolian activity forms climbing dunes on the cliffs. Therefore, the caves can be seen in different stages of opening and closing of their entrance and sometimes the entrance is completely blocked. Weathering of old inactive cemented dunes (aeolianites) or undercutting by waves gradually reopens the caves. Caves can also be partially closed by retreat and collapse of the cliff face. This usually produces a pile of quartzite angular boulders and other finer collapsed material that blocks the entrance. Today speleothems are preferentially developed inside the caves by calcite saturated waters originated in the calcritic soils of the overlying abrasion platform. Cliff-top dunes and aeolian sheets on the platform are vegetated and thus provide the necessary carbon dioxide for the dissolution of the calcretes and saturation of the percolating waters. Clean columnar and fibrous calcitic or aragonitic speleothems without a detrital component need a stable humid environment without any major fluctuations in water discharge and in air flow conditions (Frisia et al., Reference Frisia, Borato, Fairchild and Mcdermott2000). Therefore, such speleothems develop in closed or partially closed caves, in the deepest, dark parts and preferably inside niches. Nevertheless, if the opening is further enlarged, tufa-like speleothems develop. In this case speleothems are dirtier, rich in clastic material, and some of them are associated with algal or root action occurring in the light or twilight zone of the caves.
Finally, continuous retreat of the cliffs by waves and gradual collapse leads to total destruction of the cave and exposure of their clastic infilling and speleothem formations to open-air weathering processes.
Using the present day observations of the stages in the life histories of sea caves we can create a model for the trajectory of landscape evolution under variable environmental conditions.
LIFE HISTORY OF STAIRCASE, CREVICE, AND PP29 CAVES
The sedimentary sequence of Staircase Cave
Staircase Cave is a collapsed cave preserving a sandstone and speleothem complex that outcrops for ~10 m2 on a steep east-facing cliff of PP at a height of 20 m asl (Fig. 3). In some areas it is fully exposed as a small remnant of deposit clinging to the TMS cliff, and in other areas it is covered by colluvium. A test trench excavated into the colluvium revealed parts of its buried extension. Thus, the total exposed height of the outcrop is ~2 m and its length is ~5 m. The roof of the cave is now completely gone, and is likely represented by large boulders at the base of the cliff. Its name derives from a 200-step wooden staircase that descends down the cliff over the cave deposits. Erosion during a heavy rainstorm eventually revealed the site. The cave deposits abut against friable, weathered, yellowish, and locally reddish quartzite with a well-developed schistosity, formed along shear zones of TMS (Fig. 3). The base of the sedimentary sequence against the TMS is a reddish, cemented roofspall-rich layer (Fig. 3, 4a and e). It consists of poorly sorted angular sandy to fine pebble-sized quartzite fragments embedded in a clay-rich calcitic matrix (Fig. 4c). The contact with the overlying sandstone is defined as sharp in the field but under the microscope is gradational with rounded sand component increasing and angular roofspall decreasing over several cm.

Figure 3. (color online) Staircase Cave general view showing the different formations, samples, and U-Th dates (with star). White folding rule at the center of the image is 1 m long.

Figure 4. (color online) Staircase: polished slabs from core sample 46325 (a) and related photomicrographs (b, c, d, e and f) showing the different types of sedimentary rocks. See text for further details.
The overlying sandstone formation shows clear trough cross- and wedge cross stratification with individual sets being 10 to 30 cm thick. Cross-bed thickness is not as clear, because cementation obscures planes, but generally is in the range of a few cm. Basal contacts of cross-beds are tangential. Maximum inclination of cross-beds is about 25°, and axes of troughs have an almost north-south trending, i.e., perpendicular to the cliff face.
The sandstone is a well-sorted, medium-to-fine grained, arenite with well-rounded grains and cemented by carbonate (samples 46333, 46328; Fig. 4a and d). Quartz is the main component with subordinate feldspar, mica-rich quartzite, siltstone and mudstone clasts, glauconite, and some 20–30% bioclasts. Dark laminae consisting of heavy minerals (magnetite, rutile, and zircon) were observed. In a few cases, cross stratification is defined by millimeter-thick silty clay laminae, some showing grading features. The basal part of trough sets consists of fine crudely laminated sandstone, with alternating sand, silt, and clay silt laminae. A pebble-sized aggregate of clayey sand was also identified. Carbonate cementation consists of remnants of thin micritic envelopes that may grade to rather isopachous rinds of fibrous or bladed high- to low-magnesium calcite (chemistry based on microanalysis) followed by high-magnesium vadose micrite with menisci and pendants (Fig. 4f). These cementation phases are replaced by drusy, sparry, low- but also high-magnesium, calcite filling the voids completely (Fig. 4f).
Near the top of the sequence, the sandstone gradually gives way to a roofspall-rich layer (Fig. 4a and b). The whole sequence is capped with flowstones and stalagmites (samples 46321 and 46324; Fig. 3, 4a, 4b). The gradational change in the upper part of the sandstone towards pure roofspall and finally speleothem formation implies that the date of the speleothem that caps the sandstone should be very close to the date of the last sand deposition. The capping speleothems are flowstones with alternating layers of clear columnar calcite and porous, micritic, tufa-like layers with evidence of algal filaments.
A characteristic feature of the sandstone outcrop is the presence of several solution cavities (with diameters of a few tens of cm) some of them filled with clay-rich clastic material (Fig. 3, Cavity 2). The cavities have dissolution features on their roofs and walls (rounded sculptured walls) as well as small conduits on their back, runnels on the floor, and small speleothem formations. Thus, their formation clearly postdates the sandstone formation. Two main varieties of speleothems are observed in these cavities: 2–7 cm-thick flowstones consisting of clear columnar calcite; and small, up to 6-cm-high, candle-like formations (Fig. 3, Cavity 1).
Life history of Staircase Cave
The cave was formed along schistose quartzite beds representing shear zones of the TMS during a sea-level high stand that predates 500 ka as indicated by the U-Th ages in secular equilibrium (samples 46321, 46324, 46325, 46327, 46330, 46440, 46442 and 142834; Fig. 3 and 5, Supplementary Tables 1 and 2). Furthermore, given that the 20 m elevation of Staircase Cave is similar to that of PP13 G and PP Opera House (PPOH) caves, the age of its formation might also be in the same range, that is, approximately equal to or older than 1.1 Ma (Pickering et al., Reference Pickering, Jacobs, Herries, Karkanas, Bar- Matthews, Woodhead, Kappen, Erich Fisher and Marean2013). A recent study on the constraints of the sea level during warm periods of the Pliocene suggests a high stand around 17 m asl, culminated during the warmer Pliocene Climatic Optimum at ~23 m asl (Dumitru et al., Reference Dumitru, Austermann, Polyak, Fornós, Asmerom, Ginés, Ginés and Onac2019). Staircase Cave and several other PP caves at these elevations could have been formed during these Pliocene sea-level high stands.

Figure 5. 230Th-U ages measured on speleothem samples from Staircase Cave. New dates and 2-σ errors are shown separately for individual samples (orange diamonds), samples with dates in secular equilibrium are also indicated (black asterisk). Published dates are shown at the bottom of the graph (blue dots; Braun et al., Reference Braun, Bar-Matthews, Matthews, Ayalon, Cowling, Karkanas, Fisher, Dyez, Zilberman and Marean2019). Marine Oxygen Isotope Stages (MIS) are indicated at the top of the graph with grey shading showing interglacials. Continuous speleothem deposition that could be dated by 230Th-U dating is observed mainly between MIS 9 and 6. Older depositional phases are only represented by single speleothem samples which are often small and ages have large errors. These deposition phases therefore could be short and restricted to a small part of the cave and their age is not clearly defined. (For interpretation of the references to color in this figure legend, the reader is referred to the web version of this article.)
Formation of the basal roofspall layer occurred during a subsequent low stand by weathering processes. Macroscopic sedimentary structures (trough cross stratification), microscopic sedimentary structures (occasional alternation of laminae of sand and silt or clay), and clast content (bioclast-rich sand) of the overlying sandstone point to a marine origin, and particularly to a shoreface environment (McCubin, Reference McCubin, Scholle and Spearing1982; Zecchin et al., Reference Zecchin, Nalin and Roda2004). Because the foreshore facies is missing, the elevation of the marine deposits in Staircase Cave gives only a minimum value of the sea-level high stand. The initial cementation by isopachous, high-magnesium calcite is most likely related to the marine environment, followed by sparry, drusy calcite cementation in a phreatic fresh-water setting (Tucker and Wright, Reference Tucker and Wright1990). The latter implies that, after the sea retreated, the cave sediments were soaked in fresh water probably seeping from the back of the cave along the schistose quartzite. At the same time, terrestrial clastic sedimentation (roofspall) replaced marine sedimentation.
The sequence is capped by alternations of flowstone and tufa layers, suggesting variations of open and closed conditions. Clean flowstones formed in a stable, wet environment when the cave was closed or almost closed, whereas tufa formed by organic-mediated processes when the cave was at least partly opened. Given observations from modern analogues but also using the results from the study of the nearby Crevice Cave (see Life history of Crevice Cave) the most likely cause of closing was blocking by climbing dunes during transgression or regression of the sea. Opening was facilitated by wave erosion during prolonged high stands. The ages of these events can however not be determined by U-Th dating, since all dating attempts in the capping flowstones suggested secular equilibrium (samples 46321 and 46324).
The erosion process that caused the opening of the cave coupled with dissolution of the sandstone by calcite-undersaturated waters resulted in the formation of the small dissolution cavities in the sandstone. Clear flowstone and candle-like speleothems developed inside these cavities under stable, wet microenvironmental conditions most likely during consequent dune excursions and sealing of the cave (samples 46322, 46323, 46324, 46325, 46326, 46330, 46331, 46332, 46441, 46442, 46861, 50100, 142819, 142820, and 142821). The formation started before ~500 ka (U-Th ages in secular equilibrium). Non-equilibrium U-Th results start during Marine Oxygen Isotope Stage (MIS) 13 and deposition continued until the end of MIS 6 with a hiatus between 413 and 334 ka (Fig. 5, Supplementary Tables 1 and 2). It is of interest that there are no indications of opening of the cave during this hiatus as no tufa or siliciclastic-rich increments are observed. Nevertheless, this cessation of speleothem growth coincides partly with MIS 11, one of the warmest interglacials of the Pleistocene that might have had an influence on the speleothem formation.
Finally, collapse of the cave and further erosion of the sandstone filling produced the present profile. The collapse could be assigned to a prolonged sea-level high stand close to or below the cave floor that would have led to undercutting of the bedrock. Since speleothems stop developing in the cave just before the end of MIS 6 (Fig. 5), the most probable high stand that produced the final collapse is the MIS 5e sea-level high stand.
The sedimentary sequence of Crevice Cave
An isotopic speleothem sequence from ~90 to 53 ka has been published for Crevice Cave, and that paper provides full details on the U-Th and OSL ages as well as further descriptions of the cave (Supplementary Tables 1–3; Bar-Matthews et al., Reference Bar-Matthews, Marean, Jacobs, Karkanas, Fisher, Herries and Brown2010). Crevice Cave is quite shallow with its main extension parallel to the cliff face following a steeply inclined shear zone inside the quartzites of the TMS (Fig. 6).
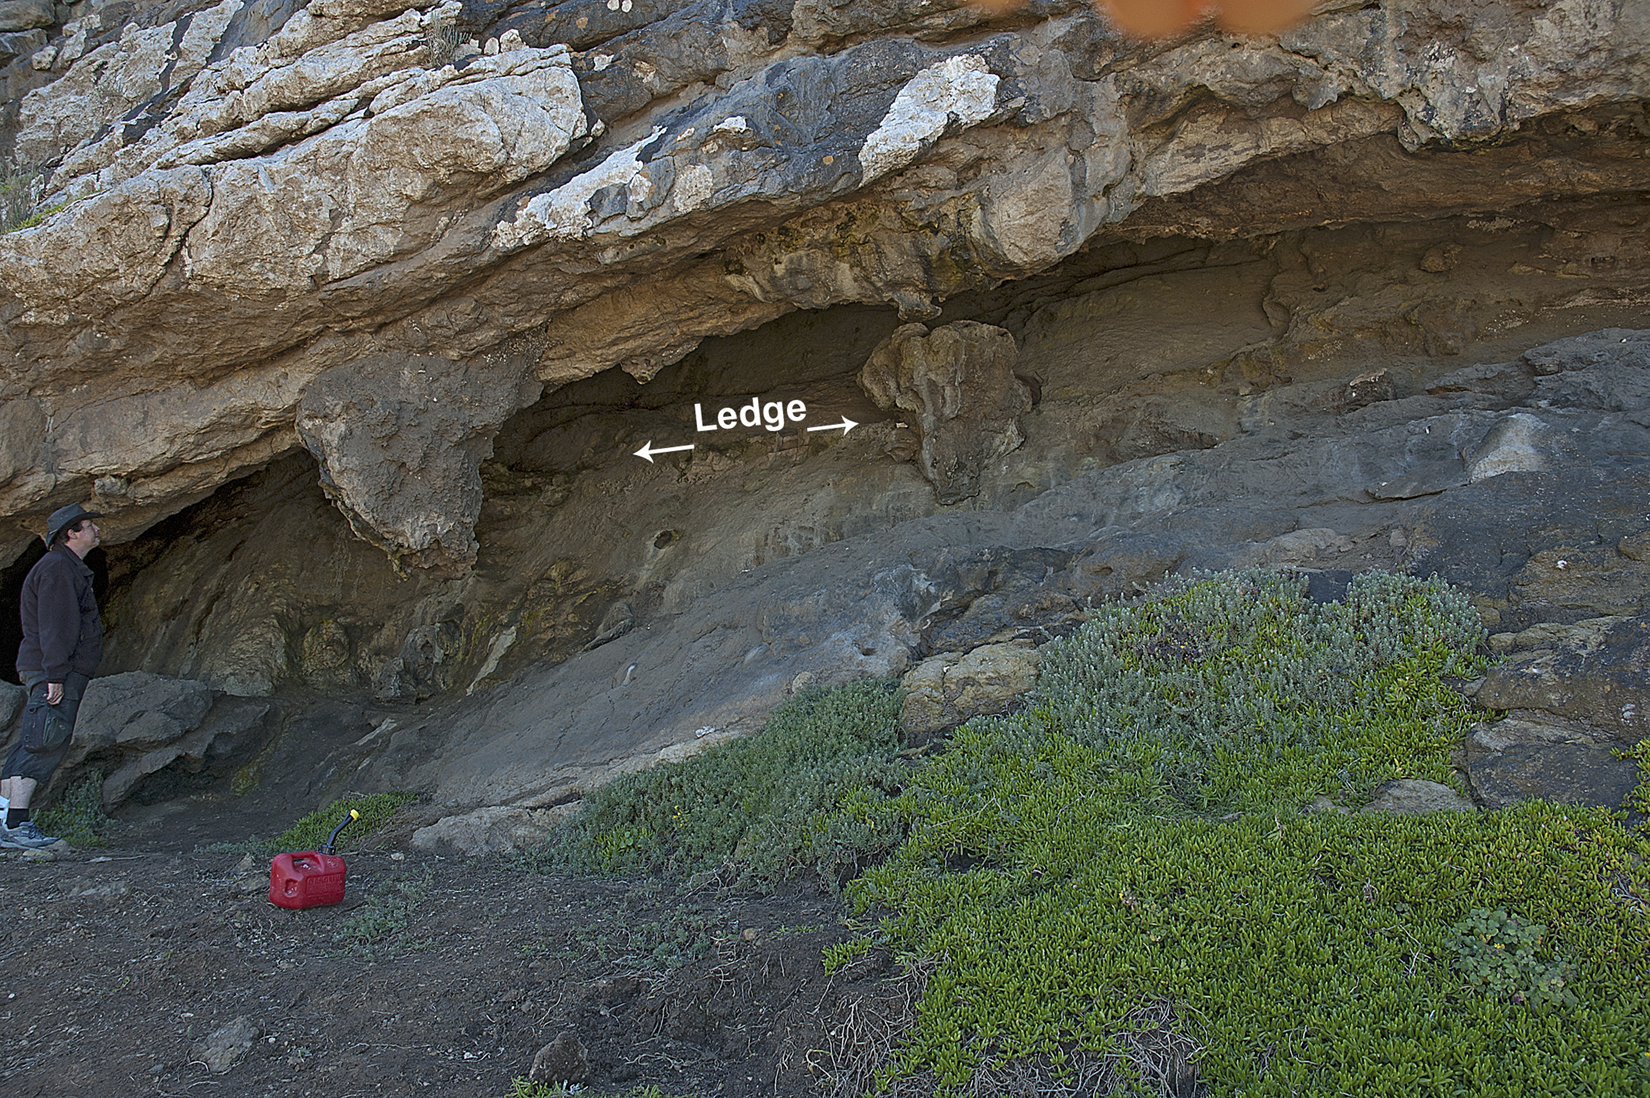
Figure 6. (color online) Crevice Cave general view, showing the ledge at the back and the hanging sandstone masses in the front.
Sandstone remnants are found along a ledge on the back of the cave and in the entrance area forming in some cases big, stalactite-like bulbs (Fig. 7). Samples from these sandstones have been studied petrographically (46608, 46617, 46618, 46621, and 50103; Fig. 7 and 8). They consist of sub-rounded, sorted, medium-coarse sand composed mainly of quartz, and quartzite grains, but also of bioclasts (10%) and some siltstone grains, heavy mineral grains, glauconite, and a few angular quartzite grains (Fig. 8e). Faint grading and steeply inclined heavy mineral laminae were observed only in the bulblike entrance sandstone (46617); these sedimentary features are related to the original deposition of the sand.

Figure 7. Sketch drawing of Crevice Cave with samples and dates.
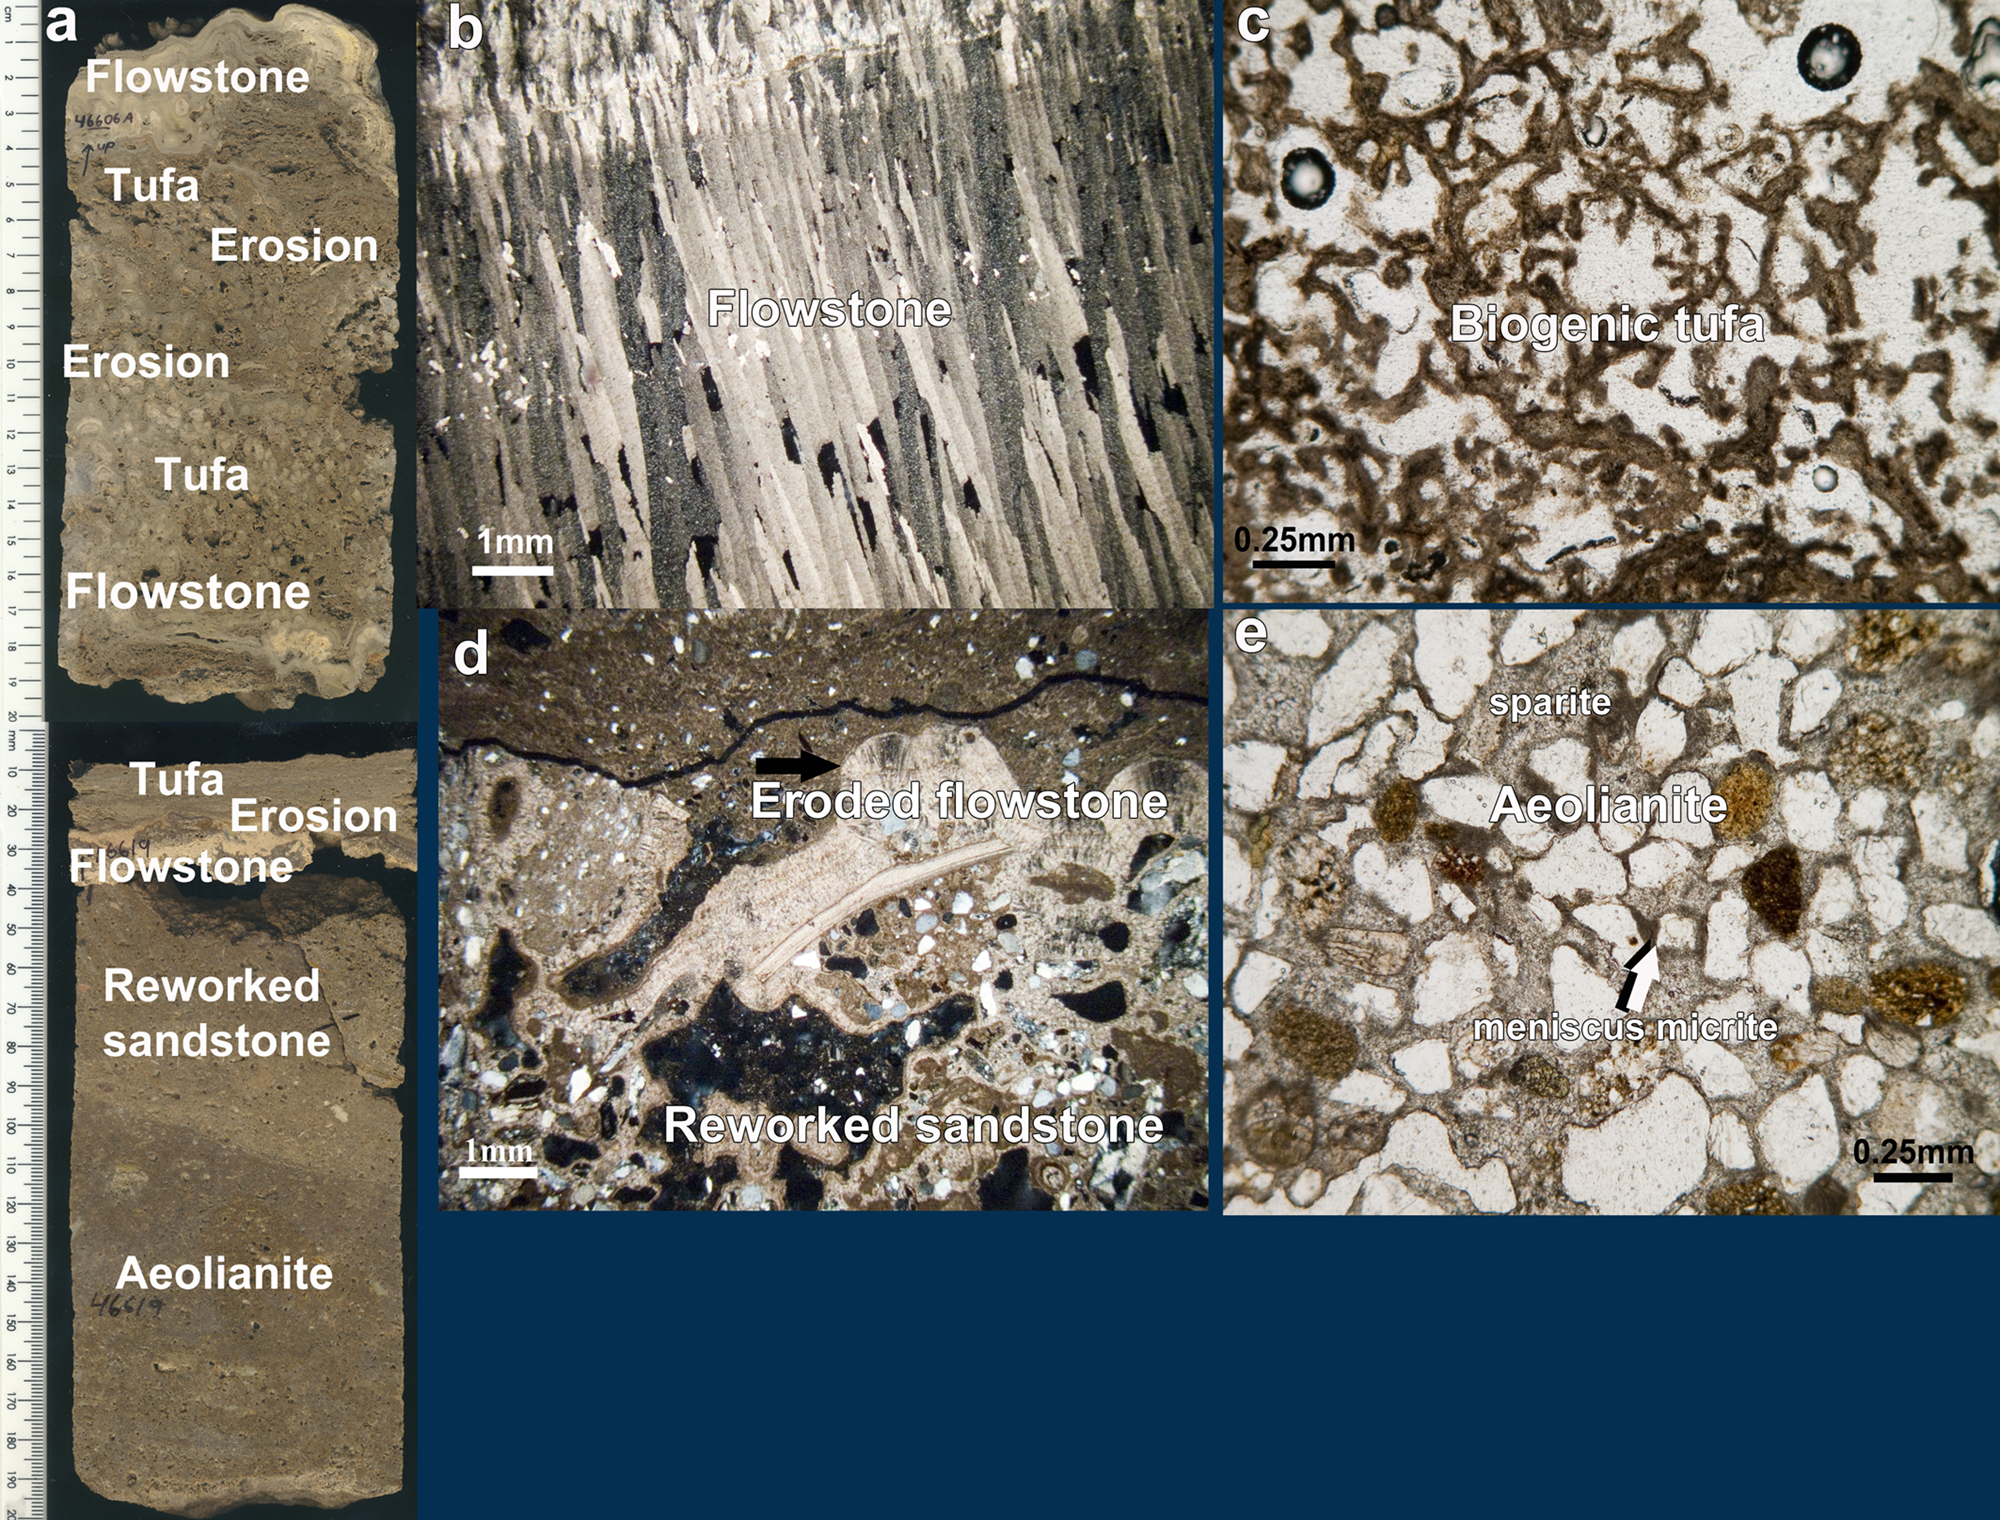
Figure 8. (color online) Crevice Cave. Polished slabs of core sample (a) and related photomicrographs (b, c, d, and e) of the different type of sedimentary rocks. See text for further details.
There are two main stages of calcite cementation: (a) micritic vadose low Mg-calcite forming pendant and meniscus fabrics and (b) blocky equant low Mg-calcitic sparite that replaces the micrite and fills the voids completely (Fig. 8e). The vadose micrite is in some cases associated with root casts (samples 46618 and 50103). The sandstone forming the ledge inside the cave is similar to the bulbous sandstone remnants at the cave entrance, but the sand is less sorted and angular roofspall grains are more common (46619B). Besides the two stages of cementation (vadose micrite followed by phreatic blocky sparite), the ledge sandstone shows large vughs filled with sand and biogenic calcite and geopetal fillings, and it is truncated sharply at the top (46619B). Geopetal fillings, flaking of the sandstone, and micrite-filled cracks are probably related to the erosion event that truncated this sandstone.
The sandstone above the erosional contact is only 2–3 cm thick and consists of unsorted sand containing both rounded grains and some angular roofspall (46619B upper), as well as reworked particles of the sandstone below the erosional contact (46606D, Fig. 8a and d). The sand is cemented by calcite filaments probably related to roots. Recrystallization to sparite has replaced most of the previous cementing features. Overlapping OSL ages suggest that this reworked sandstone is associated with sand layers found elsewhere in the cave that do not show signs of reworking (50103) and thus probably were deposited above the reworked deposits during the same event.
The reworked sandstone is covered by a thin flowstone remnant (1 mm thick) that is eroded and truncated (46606 and 46619B; Fig. 8a). This flowstone contains some well-rounded sand grains in its lower growth laminae. A tufa (~1–2 cm) caps the flowstone containing well-rounded sand grains, numerous calcareous root mats, oncolites, and stromatolitic structures (46606 and 46619A; Fig. 8a and c). The tufa is overlain by a cemented layer rich in well-rounded sand grains and a very thin laminated flowstone (~2 mm thick) of microcrystalline calcite (46606C middle and 46619A middle; Fig. 8a and b). The thin flowstone observed in samples 46606C and 46619A contains a few well-rounded sand grains and it is probably stratigraphically related to clear, fibrous flowstones without signs of sand elsewhere in the cave (sample 46607 and 50103).
The flowstone is overlain by a new porous tufa generation (~10 cm thick) with laminated corrugated fabric (stromatolitic structure), oncoidal structures, fragments of speleothems, sand grains, roofspall, clayey micritic aggregates with possible signs of phosphatization, fine bone fragments, and probably some root casts. The tufa gradually becomes denser and finely laminated towards the top but still contains a lot of well-rounded sand grains. Finally, it is capped by a thin (~4 mm thick) laminated flowstone with microcrystalline calcite and frequent lamination and bands consisting of dark, dirty micrite.
Life history of Crevice Cave
Figures 7 and 9 show the distribution of U-Th speleothem dates as well as the OSL dates of aeolian sandstone formations from Crevice Cave (Supplementary Tables 1–3). Periods of aeolian dune formation generally coincide with periods of speleothem growth whereas tufa mostly precedes and follows clean speleothem formation. The major period of speleothem growth is between ca. 90 and 50 ka. Aeolian activity is centered around 140, 120, and 90 ka (Fig. 9), a pattern recognized more broadly across the south coast (Bateman et al., Reference Bateman, Carr, Dunajko, Holmes, Roberts, McLaren, Bryant, Marker and Murray-Wallace2011; Carr et al., Reference Carr, Chase, Mackay, Jones and Stewart2016).

Figure 9. 230Th-U ages measured on samples from Crevice Cave. New dates and 2-σ errors are shown separately for individual samples (orange diamonds for clean speleothem, brown diamonds for tufa), one sample with a date in secular equilibrium is also indicated (black asterisk). Published dates are shown at the bottom of the graph (blue dots for 230Th-U dates on speleothems, light blue triangles for OSL dates on sands; Bar-Matthews et al., Reference Bar-Matthews, Marean, Jacobs, Karkanas, Fisher, Herries and Brown2010; Braun et al., Reference Braun, Bar-Matthews, Matthews, Ayalon, Cowling, Karkanas, Fisher, Dyez, Zilberman and Marean2019). Marine Oxygen Isotope Stages (MIS) are indicated at the top of the graph with grey shading showing interglacials. The main speleothem deposition happens from mid-MIS 5 to mid-MIS 3 with two additional samples depositing clean speleothem in MIS 2 and 1 (Holocene). Tufa formation is most common in MIS 6 to early MIS 5 and in MIS 2-1, but scattered tufa ages are observed in between these two time intervals. (For interpretation of the references to color in this figure legend, the reader is referred to the web version of this article.)
The cave was most likely formed during the middle Pleistocene by a lower sea-level high stand than the one that formed Staircase Cave. Due to the steep incline of the fault zone along which the cave formed, no marine sediments are preserved. The main sequence of the sandstone was deposited most likely by aeolian activity. According to the OSL results this phase is dated to ~145 ka when the sea level was low and the coast was several km away from the cave (Fisher et al., Reference Fisher, Bar-Matthews, Jerardino and Marean2010). Additional sedimentary evidence for its aeolian origin is the steeply inclined heavy mineral laminae also observed in reference petrographic thin sections from aeolianites of the area. The first cementation phase by low Mg-calcite in a vadose fresh-water environment is supporting evidence together with the presence of root casts. However, cementation changed to fresh-water phreatic type, most likely from seepage water emanating at the back of the cave along the shear zone. The previous cementation phase facilitated the formation of a temporary perched water table inside the sandstone. Perhaps during this stage the sand fill was horizontally leveled by the water flow forming the ledge still visible in the cave. Erosion of the sandstone by aggressive waters along the horizontal ledge produced the erosional surface observed in the middle of sample 46619b. A new phase of aeolian activity formed the overlying, thin, sand layer that also contains sand grains derived from the erosion of the underlying sandstone. Cementation of this phase is mainly of biogenic origin (root related; 46619b upper, 46606 lower, and 50103). According to the OSL results, this phase is dated to 125 ka, that is during the last interglacial (Fig. 7). Consequent cementation by a second generation of phreatic sparry calcite eventually led to the formation of a first generation of a thin flowstone (46606D). During this phase the cave was closed or its opening was considerably reduced producing a stable closed environment at the back. During a subsequent stage, biogenic tufa (46606D upper) formed bearing evidence of aeolian activity (well-rounded grains embedded in the tufa), suggesting opening of the cave. A second generation of flowstones is related to a gradual sealing of the cave (46606C middle, 46619A lower, 46607, and 50103 upper), which culminated in the formation of a clear thick flowstone. This phase is dated between ~88 and 50 ka. Afterwards a new generation of tufa with signs of root casts and aeolian activity suggests a re-opening of the cave probably in the late Holocene between 3000 and 2000 yr BP (46606C upper, B, and A). Finally, a third generation of dirty flowstone (46606A uppermost) suggests that the cave was rather open in the last ~1000 yr.
The sedimentary sequence of PP29
PP29 is a complex chamber having two entrances, one wider entrance facing to the west at an elevation of 15 m and the other narrower to the south-east at an elevation of 8 m (Fig. 10). The west entrance is covered by a cone, several meters thick, of roof collapse sediment. The floor of the cave is covered with rather fine colluvial material, a mixture of loose roofspall and aeolian sand. Therefore, the quartzite bedrock floor is not visible. Nevertheless, in front of the south-east entrance the bedrock appears at a height of ~6 m asl. The main development of the cave follows an east-west trending schistose zone of the quartzite.

Figure 10. (color online) Image of the cave PP29. Entrance to the south-east with the hanging dune remnant.
A hanging remnant of sandstone is found on the ceiling of the entrance following its arcuate development (Fig. 10 and 11). The sandstone is highly eroded and has a sculptured surface. Its maximum preserved thickness is about 40 cm. However, evidence of cross-bedded stratification is crudely visible in places. A fallen block of sandstone was also cored (142827). Sandstone samples consist of well-sorted and rounded coarse sand with around 10% of bioclasts. The sand was first cemented by vadose micrite and then by druse calcite. A root encrustation was observed in one of the samples (142828B).

Figure 11. Sketch drawing of PP29 Cave with samples and dates.
On the center of this arcuate sandstone remnant a horizontal ledge structure at 9.9 m similar to that of Crevice Cave is observed (sample 76744). The ledge is covered with a thin flowstone (Fig. 11). Remnants of the same sandstone formation with the flowstone cover are also found on the eastern wall of the cave at a lower elevation (9.3 m, sample 142828). The thin flowstone on the ledge (76744) consists of several couplets of clear flowstone and calcareous tufa. The lower one, which is the thickest, consists of elongated columnar calcite and grew directly on the sandstone as an upward continuation of the druse calcitic cement in the sandstone. It is separated from the second layer of columnar calcite by a tufa lens with few aeolian sand grain inclusions. The thickness of the following clear flowstone layers diminishes upwards. The same flowstone formation found at the eastern wall of the cave (sample 142828) shows a few corrosive surfaces in the lower part which consists of fibrous calcite with fan-like sweeping extinction. A corrosive surface towards the upper part is followed by fibrous calcite with straight extinction and bands of recrystallized aragonite.
Forty cm higher than the central ledge, but without a clear stratigraphic correlation, a fragment of banded flowstone formation was found floating inside the sandstone (sample 46745). The sequence of dates in this speleothem shows that it is clearly overturned (Fig. 12a). The speleothem consists of fibrous calcite with mostly fan-shaped sweeping extinction (Fig. 12b and c). In the middle a truncation horizon can be seen associated with a corrosive surface and locally overlain by a lens with aeolian sand (Fig. 12a). Several other corrosive surfaces are also observed. Some brownish bands show remnants of recrystallized fibrous aragonite. The speleothem is capped by a thin layer of banded microcrystalline calcite that is overlain by a thin layer of columnar calcite (Figure 12c).

Figure 12. (color online) Thin section scan (a) and photomicrographs (b and c) of an overturned flowstone fragment inside sandstone (sample 46745, PP29 Cave). See text for details.
A speleothem sample capping a sandstone (138862-2) collected off the floor shows some interesting features (Fig. 11). The core of the sample shows corrugated laminae with shell fragments and marine “stromatolitic” structure that are probably related to peritidal environments with fresh-water inputs (Rishworth et al., Reference Rishworth, Cawthra, Dodd and Perissinotto2020). This grades to a thin flowstone-tufa complex speleothem with some laminae of clear, fibrous, fan-shaped aragonite but also dirty micritic patches. On top, there is porous tufa layer with calcified filaments and organic remains that is capped gradually by cemented sand of aeolian origin. The sand is cemented by dirty vadose micrite and the remaining voids are completely filled by sparry calcite. Note that there are very few silt and sand grains in the tufa. The sandstone is capped by a clear flowstone with elongated columnar calcite that laterally grades to globular-shaped speleothem consisting of radial-grown fibrous calcite but also sparry and microcrystalline calcite.
Thin flowstone formations have developed along the contact of the schistose quartzite at the back wall of the cave (46748). A small speleothem column was sampled at the back of the cave on a protected hanging niche (46746). The ceiling is covered by thin, clean, columnar speleothem coatings that grade to fine draperies in places (sample 46747).
Outside the cave a thick dune formation abuts the cliffs of the small embayment where the cave is located (Fig. 11). This dune shows clearly two major phases of build-up separated by a reactivation surface (samples 142824, 142825, and 142826).
Life history of PP29
The cave was most likely formed during more than one sea-level high stand. The two entrances of the cave and its bent shape are an indication of this. Certainly, one of the high stands must be of middle Pleistocene age since there is evidence of speleothem formation before MIS 5e (sample 46747, 142 ka; Fig. 11 and 13, Supplementary Table 1 and 2). In fact, this age is well-correlated with the first stage of aeolian activity in Crevice Cave that probably has partially blocked the cave and facilitated the formation of speleothems. The MIS 5e high stand, well-documented in the area at a height of 4–6 m (Roberts et al., Reference Roberts, Karkanas, Zenobia Jacobs, Curtis, Marean and Roberts2012), has probably affected the cave and eroded part of its filling.

Figure 13. Ages measured on samples from PP29. New dates and 2σ errors are shown separately for individual samples (orange diamonds for 230Th-U ages on clean speleothem, light blue triangles for OSL ages on sand). Published speleothem dates are shown with blue dots (Braun et al., Reference Braun, Bar-Matthews, Matthews, Ayalon, Cowling, Karkanas, Fisher, Dyez, Zilberman and Marean2019). Marine Oxygen Isotope Stages (MIS) are indicated at the top of the graph with grey shading showing interglacials. The main speleothem deposition happens from mid-MIS 5 to mid-MIS 3 with two additional samples depositing clean speleothem in MIS 2 and 1 (Holocene). Tufa formation is most common in MIS 6 to early MIS 5 and in MIS 2-1, but scattered tufa ages are also observed in between these two time intervals. (For interpretation of the references to color in this figure legend, the reader is referred to the web version of this article.)
Aeolian sand blocked the cave again, probably by the end of the last interglacial as indicated by OSL ages of ~110 ka (sample 76744) and confirmed by the formation of the first generation of clean columnar flowstones and speleothems ~110 ka (Fig. 11 and 13, Supplementary Table 1). The first cementation phase of vadose calcite facilitated the formation of a temporal, perched water table inside the sandstone. Perhaps during this stage the sand fill was horizontally leveled by the water flow in a similar way as observed in Crevice Cave. It also appears that more than one leveled surface was formed in slightly different heights. Flowstones start forming on top of these ledges from ~110 to ~100 ka. At ~100 ka there is evidence of a second aeolian sand incursion, as observed in sample 138862 and inferred in sample 142828. However, the cave was only partially opened and invaded by aeolian sand since the speleothems at the back of the cave continued to grow until 74 ka (46746) and even later until ~71 ka, as the fragment of flowstone embedded in the sandstone shows (46745). The sandstone that contains the above fragment laterally overlies the ledge formation and is dated to ~42 ka (353068), most likely marking one of the last aeolian dune pulses.
Speleothem formation is observed until about 42 ka (samples 14228, 138862, 46744, 46746, and 46747; Fig. 11 and 13, Supplementary Table 1). Alternation of clean speleothem formations and tufa formations is observed close to the entrance (sample 46744) a fact that implies microbial processes (Jones, Reference Jones2010) and partial opening of the cave. After ~40 ka the sandstone that blocked the cave was eroded and the cave most likely became completely open.
DISCUSSION
The PP locality hosts a wide variety of caves and rock-shelters that vary in their relative representation of geogenic and anthropogenic input. The caves reported here have not produced any evidence of anthropogenic input so far, and thus form a geogenic baseline on the input of sediments to the caves at PP. We now provide an integrated overview of the sedimentary history at PP as revealed by the three caves described here in detail (Fig. 14 and 15). This sequence provides a clean geogenic background of the birth, life, and death of the caves to which people and sedimentary processes variably contributed at PP. Furthermore, this provides the sedimentary background to the construction of the PP Composite isotope record (Braun et al., Reference Braun, Bar-Matthews, Matthews, Ayalon, Cowling, Karkanas, Fisher, Dyez, Zilberman and Marean2019).

Figure 14. Probability density functions (PDF) of 230Th-U and OSL ages from Pinnacle Point (PP) compared with relative sea-level variations (Rohling et al., Reference Rohling, Grant, Bolshaw, Roberts, Siddall, Hemleben and Kucera2009, Reference Rohling, Braun, Grant, Kucera, Roberts, Siddall and Trommer2010). (a) PDF of tufa ages at Crevice Cave and PP29 peaks in late Marine Oxygen Isotope Stage (MIS) 6 to mid-MIS 5 and in MIS 2–1, generally overlapping with intervals of high sea levels. (b) PDFs of speleothem ages from Staircase Cave (light brown), Crevice Cave (dark brown), and PP29 (orange). Speleothem deposition occurs at a range of sea levels at the three caves. (c) PDF of OSL ages measured on sand deposits from Crevice Cave and PP29. Dune deposition appears high from late MIS 6 through MIS 3, with the highest peaks at ~110 and ~90 ka. MIS stages are indicated at the top of the graph with grey shading showing interglacials. (For interpretation of the references to color in this figure legend, the reader is referred to the web version of this article.)

Figure 15. History of caves and their phases. The caves and the age period that correspond to each phase are also shown. (A) Cave formation by a sea high stand and occasional deposition of marine sediments. (B) Retreat of sea. Blocking of cave entrance by dunes: formation of speleothems. (C) Sea high stand close to the level of the cave. Erosion of dune sediment and any other previous deposit: formation of tufa. (D) Retreat of sea. New dunes blocking partially the cave: occasional formation of new speleothems. (E) Sea high stand close to the level of the cave. Erosion and Collapse of cave roof and exposure of its sedimentary fill. Circled Phases C and D denote periods when human occupation is possible, as observed in other Pinnacle Point (PP) caves. CC, Crevice Cave; PP29, PP29 Cave; SC, Staircase Cave.
Crevice and PP29 caves provide complementary sedimentary histories for the last ca. 150 ka and the history of Staircase Cave actually ends at about this age. The Staircase Cave marine sedimentary sequence is not yet dated but is directly attributed to a former high stand, the highest so far recorded in the cliffs of PP. Its age certainly predates 500 ka since the capping speleothems are older than this age and most likely older than 1.1 Ma based on other dated caves found at similar heights (Pickering et al., Reference Pickering, Jacobs, Herries, Karkanas, Bar- Matthews, Woodhead, Kappen, Erich Fisher and Marean2013). What is of interest here is the immediate cover of the marine sequence by clean speleothem formations, something that has to be related to the blocking of the cave by aeolian sand dunes. This is in accordance to what we will see below with the other caves where aeolian activity is rather associated to the regression phases of the sea level (Karkanas et al., Reference Karkanas, Brown, Fisher, Jacobs and Marean2015). The formation of the cavities inside the cemented marine sediments started probably during an interglacial (MIS 13). It is in these cavities that clean speleothem continuously grew until almost the end of MIS 6 (Fig. 14). Stalactites (46332) formed first (~438 ka) and then transformed to candle-like formation (~335 ka) when they reached small pools. At the same time a flowstone was forming on the floor starting at ~323 ka (46326 and 46322). The abrupt stop of all speleothem formations, without the usual tufa capping observed in almost all other cases at Crevice Cave and PP29, should be attributed to the collapse of the cave rather than a gradual opening. Speleothems stop developing in the cave just before the end of MIS 6. The correlation of the collapse with the MIS 5e sea-level high stand is obvious.
In Crevice Cave, aeolian dunes were blocking the cave at ~145 ka. This event is clearly widespread, as evidence of this blocking is seen in clean speleothem formations at PP29. Direct evidence of the erosion of this dune system is found in Crevice Cave where unconformably overlying aeolian sediments are dated to ~125 ka. This aeolian event is widespread because the main dune remnant blocking PP29 is dated to about the same age. This formation apparently is placed inside the last interglacial, however the first clean speleothem formation related to this event does not commence until ~110 ka as seen in PP29 (Fig. 14). During the whole period between ~145 and ~117 ka, there was only tufa formation in Crevice Cave, apparently related to the progressive opening of the cave (Fig. 14). Present wave erosion has been observed several meters above sea level and therefore wave action associated with sea surges of the MIS 5e high stand could have stripped off any remaining evidence of the precedent dune formation. Therefore, it is more likely that the second dune incursion started after the peak height of MIS 5e during the regression stage of sea level.
At ~100 ka there is evidence of new aeolian deposition inside PP29 (138862), however this has to be an ephemeral opening event since continuous clean speleothem formation is observed in other parts of the cave. In Crevice Cave continuous speleothem formation is observed between ~90 and ~53 ka (Fig. 14; Bar-Matthews et al., Reference Bar-Matthews, Marean, Jacobs, Karkanas, Fisher, Herries and Brown2010) and this generally agrees with the pattern of speleothem formation in PP29. Therefore, it might be suggested that aeolian activity commenced at ~100 ka but actually blocked many of the caves on this side of PP at ~90 ka. In PP29 there are also indications of hiatuses somewhere between ~71 and ~61 ka. Nevertheless, not all caves were blocked at that time although there is evidence of enhanced aeolian activity in front of PP29. There is also evidence of an intensification of aeolian activity at ~50 ka in PP29. The gradual ceasing of clean speleothem formation in PP29 and Crevice Cave after ~50–40 ka should be rather related to a decrease in aeolian activity (Fig. 14). The decrease rendered the caves more vulnerable to subsequent erosion and opening. The decrease might also relate to more humid conditions, which further facilitated enhanced erosion of the dune remnants by seeping water along the cliffs.
Caves older than 1.1 Ma were formed by the 20-m sea-level high stand that could be correlated with Pliocene warm periods (Dumitru et al., Reference Dumitru, Austermann, Polyak, Fornós, Asmerom, Ginés, Ginés and Onac2019). They have almost all collapsed and only remnants of them survive (Fig. 15). The 20-m high stand was a prominent one because it is the only one with surviving remnants of marine deposits. However, it appears that ledges in larger caves that might relate to this high stand are slightly better preserved (e.g., PP9C).
The fact that clean speleothems were forming inside Staircase Cave from MIS 13 to the end of MIS 6 rather implies that the cave was blocked by cemented aeolian dunes. The blocking dunes of the cave that formed at about the MIS 13 sea-level high stand would have been eroded by subsequent lower high stands, like the one of MIS 11, however, it appears that they did not completely strip off the aeolianites as speleothems continue to grow inside the cave. The ultimate erosion of this system of dunes most likely happened during MIS 5e. This is also supported by the fact that only post-MIS 5e extensive outcrops of aeolianites survive in the area.
The dunes of the early Holocene didn't appear to affect the caves and this might have to do with the Mid-Holocene high stand that was +2.5 m and perhaps as much as +3.5 m asl (Ramsay, Reference Ramsay1995; Ramsay and Cooper, Reference Ramsay and Cooper2002) that could have eroded away most of them.
Crevice and PP29 caves show a relatively similar alternation of events, starting with dune blocking the caves and clear speleothem formations and ending with gradual erosion of the dune and tufa formations. Dune development and blocking of the caves is rather synchronous in all caves and this is a good starting point for correlating the stratigraphies of the caves (Fig. 15). They should also be correlated with hiatuses in the archaeological record of each cave, their duration being dependent on the subsequent erosional history of the blocking dunes. It appears that, although erosion probably starts at the same time in all caves, it does not progress in the same way and this should be related to the configuration of the entrance of the caves. For example, Crevice Cave has a narrow, almost horizontally developed opening and this restricts fast erosion of sediment blocking it. On the other hand, PP29 has two openings with one of them being very large and thus it is anticipated that erosion will be much faster. This difference is indeed seen in the histories of speleothem formations of the two caves where Crevice Cave is more continuous and the record of opening of the cave is less detailed than that of PP29.
Implications for the caves with human occupation
The geogenic background of the birth, life, and death of Staircase, Crevice, and PP29 caves provide a reference base for understanding human occupation in the other PP caves (Fig. 15). The oldest terrestrial clastic deposits that survive in the caves which contain anthropogenic deposits are post-MIS 11 (i.e., PP13B). The MIS 11 high stand in the area has been estimated to +13 m above modern sea level (Roberts et al., Reference Roberts, Karkanas, Zenobia Jacobs, Curtis, Marean and Roberts2012). It then seems that all caves older than this high stand and with an elevation at the mouth below ~10 m were washed out and will not preserve pre-400 ka archaeological sediment. As clearly shown in the case of Staircase Cave, most caves above ~10 m (that is for the moment the ~20 m high stand) were undercut and collapsed. This may explain why Acheulian technology is so far absent from the PP caves, but is abundant on the landscape above the cliffs (Thompson, Reference Thompson2009). More speculatively, perhaps this also explains the general lack of Acheulian stone tools in coastal sea caves in South Africa.
Cave PP13B, already published in detail elsewhere (Karkanas and Goldberg, Reference Karkanas and Goldberg2010; Marean et al., Reference Marean, Bar-Matthews, Fisher, Goldberg, Herries, Karkanas, Nilssen and Thompson2010), has strong anthropogenic input at ~ 160 ka, receives little anthropogenic input up to about 130 ka, and then has intensive but intermittent anthropogenic input until 90 ka. Other caves and rock-shelters at PP, such as PP9 (Matthews et al., Reference Matthews, Rector, Jacobs, Herries and Marean2011) and PP5-6 (Brown et al., Reference Brown, Marean, Herries, Jacobs, Tribolo, Braun, Roberts, Meyer and Bernatchez2009, Reference Brown, Marean, Jacobs, Schoville, Oestmo, Fisher, Bernatchez, Karkanas and Matthews2012; Karkanas et al., Reference Karkanas, Brown, Fisher, Jacobs and Marean2015; Smith et al., Reference Smith, Jacobs, Johnsen, Ren, Fisher, Oestmo and Wilkins2018), have intermittent anthropogenic input right up to ~48 ka. This fluctuating sedimentary pattern is also observed in Crevice and PP29 caves. Dunes were blocking these caves and clean speleothems were forming inside them at 145 ka, a situation that explains the sporadic occupation at PP13B during this time. Between 145 and 117 ka, Crevice Cave was partially opened as tufa was forming inside the cave during this period. Continuing in the same trend until 90 ka, there is a rather intermittent opening and blocking of the caves in the same way that occupation intensity at PP13b is waning and waxing. A major erosional phase related to the beginning of the MIS5e is well-documented in Crevice Cave confirming that the erosion of front indurated occupational sediment at PP13B were caused by sea surge during this high stand (Karkanas and Goldberg, Reference Karkanas and Goldberg2010). The MIS 5e sea-level high stand seems to have affected all caves, and was clearly the trigger for the collapse of several. Nevertheless, all high stands have contributed to the collapse of caves with the most effective being those that were higher than the present sea level. It also appears that more than one such high stand is needed to completely destroy the caves and actually lead to coastal cliff retreat. A possible cycle can be estimated from the case of Staircase Cave, but for the moment the details of the relationship between the heights of the high stands, their number, and the time interval until the final collapse is not obvious.
The 90–53 ka dune blocking and clean speleothem formation in Crevice Cave can be seen in the complete lack of occupational deposits in PP13B. Indeed, the ~90 ka dune event blocked many of the caves on this side of PP. In PP5-6 three phases of aeolian activity at ~90, 70, and 50 ka alternate with times of human occupation (Brown et al., Reference Brown, Marean, Jacobs, Schoville, Oestmo, Fisher, Bernatchez, Karkanas and Matthews2012; Karkanas et al., Reference Karkanas, Brown, Fisher, Jacobs and Marean2015; Smith et al., Reference Smith, Jacobs, Johnsen, Ren, Fisher, Oestmo and Wilkins2018). These three main dune- building phases are observed in all caves and seem to be the principal mechanism that define their history during this period. In some caves (e.g., Crevice Cave and PP13B) these three phases were not interrupted by serious erosional events and the caves stayed closed for the whole period of time. Other caves were not totally blocked. The hiatuses observed in PP29 somewhere between ~71 and ~61 ka has to be related to MIS 4 which at PP appears as a period of extreme climatic variability (Bar-Matthews et al., Reference Bar-Matthews, Marean, Jacobs, Karkanas, Fisher, Herries and Brown2010). At the same time, enhanced aeolian activity is observed in front of PP29 and in PP5-6 as well as elsewhere in the surrounding landscape (Jacobs, unpublished data). The intensification of aeolian activity at ~50 ka in PP5-6 can also be seen in PP29. The decrease in aeolian activity in PP29 and Crevice Cave after ~50–40 ka (Fig. 14) should be related to the opening of PP13B (Marean et al., Reference Marean, Bar-Matthews, Bernatchez, Fisher, Goldberg, Herries and Jacobs2007; Karkanas and Goldberg, Reference Karkanas and Goldberg2010; Marean et al., Reference Marean, Bar-Matthews, Fisher, Goldberg, Herries, Karkanas, Nilssen and Thompson2010).
It is obvious that environmental conditions and particularly coastal changes have affected all caves in a quite similar pattern (Fig. 15). As described in the case of the caves with purely geogenic sedimentation, the configuration of the entrance of the caves seems to define the various deviations from the general pattern. The direction into which the cave opens in relation to the coast does not seem to play an important role. PP29 and PP5-6 show a similar history where dunes were not capable of completely or continuously blocking the caves during the 90–50 ka time period. Both caves have two openings but the PP29 openings are along the east-west axis and almost perpendicular to the coastline and the PP5-6 openings are along the north-south axis and parallel to the coastline. In contrast, Crevice Cave and PP13B have one opening and they were both blocked for the entire period. Their entrances do not face the same direction in relation to the coast. Crevice Cave entrance is on the side of a small embayment facing almost landwards, whereas PP13B faces directly the open sea.
CONCLUSIONS
This paper provides the background “life history” of Staircase Cave, Crevice Cave, and PP29 at PP from combined studies of U-Th dating of secondary carbonates, OSL dating of sandstones, and petrographic analysis of geological samples all integrated through analysis of cave shape and elevation assisted with GIS analysis of 3D models of the caves. This background life history helps us contextualize both the paleoclimate and paleoenvironment records these caves have produced from isotopic and dating studies of speleothems (Bar-Matthews et al., Reference Bar-Matthews, Marean, Jacobs, Karkanas, Fisher, Herries and Brown2010; Braun et al., Reference Braun, Bar-Matthews, Matthews, Ayalon, Cowling, Karkanas, Fisher, Dyez, Zilberman and Marean2019, Reference Braun, Bar-Matthews, Matthews, Ayalon, Zilberman, Cowling, Fisher, Herries, Brink and Marean2020), and the many archaeological studies at PP. Study of these non-anthropogenic caves has helped us “raise the bar” (Goldberg, Reference Goldberg and Sullivan2008) in our knowledge of the long history of cave formation and cave death at PP. Throughout this long history of sedimentation, aeolian input dominated the sedimentary regime. This stands in contrast to the anthropogenic sequences, which alternate between roofspall dominated phases and aeolian dominated phases. We have argued elsewhere (Karkanas et al., Reference Karkanas, Brown, Fisher, Jacobs and Marean2015) that the former reflects times when the coast was nearby, and the latter when the coast was far away.
The caves are far more ancient than what we originally thought—they date back to at least 1.1 Ma (Pickering et al., Reference Pickering, Jacobs, Herries, Karkanas, Bar- Matthews, Woodhead, Kappen, Erich Fisher and Marean2013). Some caves, such as PP13G, PPOH, and the not yet published PP9, have rather extensive coastal sedimentary sequences dating this far back. But the oldest terrestrial clastic deposits that survive in the caves which contain anthropogenic deposits are post-MIS 11 (i.e., PP13B) and human occupation of the caves does not commence until ~160 ka. We know humans were around at older times since Acheulian tools are abundant on the cliffs above the caves. This implies that any caves below about +10 m will not preserve the pre-400 ka archaeological sediment and most of the caves above have collapsed and their clastic terrestrial record was eroded away. It also explains why Acheulian technology is so far absent from the PP caves, and elsewhere along the coast, but is abundant on the landscape above the cliffs. The general lack of Acheulian in coastal sea caves in South Africa might be a function of the sediments having been removed by MIS 11 (Roberts et al., Reference Roberts, Karkanas, Zenobia Jacobs, Curtis, Marean and Roberts2012) and MIS5e high sea stands.
All caves show a relatively similar alternation of events that can be used to correlate the stratigraphies of the caves. They start with dune blocking and clear speleothem formations and end with gradual erosion of the dune and tufa formations. These events should be also correlated with hiatuses in the archaeological record of each cave. The duration of these hiatuses is dependent on the subsequent erosional history of the blocking dunes. Erosion probably starts at the same time in all caves but it does not progress in the same way. The configuration of the entrance of the caves plays a significant role in their erosional history.
ACKNOWLEDGMENTS
A first version of this paper was presented in a symposium at the Society for American Archaeology, 2015, in honor of Paul Goldberg, who inspired us to “raise the bar” and think outside the archaeological box about caves, rock-shelters, and their sediments. We thank the Mossel Bay Archaeology Project: Cultural Resource Management Pty staff for their assistance, the Dias Museum for lab facilities, South African Heritage Resources Agency and Heritage Western Cape for permits, and the Geological Survey of Israel for research support. We acknowledge funding from the European Commission Seventh Framework Marie Curie People program FP7/2007–2013 through funding of the Initial Training Network “GATEWAYS” under the grant number 238512. This research was further funded by grants from the National Science Foundation (to C.W. Marean, BCS-0524087 and BCS-1138073), the Hyde Family Foundations and the Institute of Human Origin (IHO) at Arizona State University (ASU), and the John Templeton Foundation to the IHO at ASU (grant ID 48952). The opinions expressed in this publication are those of the author(s) and do not necessarily reflect the views of any of these funding organizations.
SUPPLEMENTARY MATERIAL
The supplementary material for this article can be found at https://doi.org/10.1017/qua.2020.72


