


INTRODUCTION
A previously long-held hypothesis that the North Atlantic is the driver of the tropical climate argues that climate perturbations originate in the high-latitude North Atlantic and propagate globally via various ocean-atmospheric pathways (e.g., Broecker et al., Reference Broecker, Peteet and Rind1985; Goswami et al., Reference Goswami, Venugopal, Sengupta, Madhosoodanan and Zavier2006). Another hypothesis posits natural greenhouse gas concentrations modulated by climate conditions in the tropics, including monsoonal convection, as the principal factor governing the millennial-scale global climate change. Possibly, during warmer periods, excess moisture and greenhouse gases from the tropics acted as a positive feedback mechanism (e.g., Schulz et al., Reference Schulz, von Rad and Erlenkeuser1998; Kudrass et al., Reference Kudrass, Hofmann, Doose, Emeis and Erlenkeuser2001; Ivanochko et al., Reference Ivanochko, Ganeshram, Brummer, Ganssen, Jung, Moreton and Kroon2005; Tiwari et al., Reference Tiwari, Ramesh, Somayajulu, Jull and Burr2006 and references therein). One such process that can influence greenhouse gases concentration is marine denitrification. This occurs in the oxygen minimum zones (OMZs) of the world's oceans and is an important component of the nitrogen cycle. Denitrification not only governs the bioavailable nitrogen required for oceanic productivity that sequesters atmospheric CO2 but also produces nitrous oxide (N2O), which is a powerful greenhouse gas.
OMZs are subsurface layers where oxygen concentration is less than 20 μmol L−1 and are observed between depths of 200 and 1200 m (Paulmier and Ruiz-Pino, Reference Paulmier and Ruiz-Pino2009). They are found in regions where intense biological uptake of oxygen due to bacterial respiration and remineralization occurs and are associated with low oxygen supply via oceanic circulation. The present global warming may cause expansion and strengthening of the OMZs, which will have adverse consequences for marine flora and fauna and may provide positive feedback via N2O emission through denitrification (Naqvi et al., Reference Naqvi, Jayakumar, Narvekar, Naik, Sarma, D'Souza, Joseph and George2000; Banse et al., Reference Banse, Naqvi, Narvekar, Postel and Jayakumar2014).
Denitrification occurs when the oxygen concentration in the OMZ falls below a threshold value of ~5 μmol/kg (Codispoti et al., Reference Codispoti, Brandes, Christensen, Devol, Naqvi, Paerl and Yoshinari2001). During this process, nitrate (NO3-) acts as an oxidizing agent and is finally reduced to dinitrogen (N2) gas. In oceans, denitrification occurs in organic-rich continental margin sediments and subsurface water depths within intense OMZs (200–1200 m). Of the latter, the Arabian Sea supports approximately one-third of marine water column denitrification (Howell et al., Reference Howell, Dioney, Fine and Olson1997). During this process, bacteria preferentially consume NO3- with a lighter isotope (14N) and thus enrich the residual NO3- in the heavier isotope (15N) (Brandes and Devol, Reference Brandes and Devol2002). The 15N-enriched NO3- is transported to the surface and consumed by phytoplankton, which subsequently settle down and get preserved in the sediments. Accordingly, the δ15N of sedimentary organic matter (SOM) has been widely used as a tool to track changes in water column denitrification in this region (Altabet et al., Reference Altabet, Francois, Murray and Prell1995; Ganeshram et al., Reference Ganeshram, Pedersen, Calvert and Murray1995, Reference Ganeshram, Pedersen, Calvert and McNeil2000 and references therein).
Previous research in the Arabian Sea observed strong denitrification and OMZ intensity during warm periods in the Northern Hemisphere (e.g., Dansgaard-Oeschger interstadials) and weak (or absent) intensity during cold periods (e.g., Heinrich events, Younger Dryas) (e.g. Schulz et al., Reference Schulz, von Rad and Erlenkeuser1998; Altabet et al., Reference Altabet, Higginson and Murray2002; Singh et al., Reference Singh, Jung, Darling, Ganeshram, Ivanochko and Kroon2011). However, most of the previous studies on denitrification intensity from the southeastern Arabian Sea (SEAS) show low temporal resolution. Further, past denitrification intensity is used to infer past monsoon strength on millennial and longer timescales (e.g., Tiwari et al., Reference Tiwari, Ramesh, Bhushan, Sheshshayee, Somayajulu, Jull and Burr2010; Kessarkar et al., Reference Kessarkar, Rao, Naqvi and Karapurkar2013). Consequently, higher-resolution past denitrification records from this region are needed to allow for a more detailed evaluation of the governing factors and influence of denitrification.
This study is one of the many studies we are carrying out in the eastern Arabian Sea to better understand the denitrification variability on million (Tripathi et al., Reference Tripathi, Tiwari, Lee and Khim2017), multimillennial (Tripathi et al., Reference Tripathi, Behera and Tiwari2020), and centennial (present study) timescales. We are also analyzing high-resolution denitrification data from another core (SK274-1G) from near the southern tip of India. The purpose is to explore the influence of denitrification on the global nitrogen and carbon cycles by including studies from the three major regions experiencing perennial pelagic denitrification: the eastern tropical South Pacific, the eastern tropical North Pacific, and the Arabian Sea. It may seem feasible to merge the data of the present study (core SK274-4G) with core SK274-1 G but doing so did not yield a cohesive picture, as the cores are from different locations and resolutions and have experienced dissimilar oceanographic processes. Moreover, the respective focus of the studies of the two cores is also different; merging them resulted in drastically reducing their scopes, especially of core SK274-1G, which will only be further explored once the findings from core SK274-4 G are published. The present study attempts to understand the underlying mechanisms governing the temporal variability of denitrification in SEAS at a high (centennial-scale) resolution since the last glacial period and its influence on the high-latitude climate using sediment core SK274-4 G from the continental slope of SEAS.
MODERN OCEANIC CONDITIONS IN THE EASTERN ARABIAN SEA
The Arabian Sea is characterized by a seasonal reversal of monsoon winds. Seasonal change in monsoon circulation drives significant changes in oxygen-deficient waters (Naqvi and Noronha, Reference Naqvi and Noronha1991) and surface water productivity (Bhattathiri et al., Reference Bhattathiri, Pant, Sawant, Gauns, Matondakar and Mohanraju1996; Madhupratap et al., Reference Madhupratap, Prasanna Kumar, Bhattathiri, Dileep Kumar, Raghukumar, Nair and Ramaiah1996). During the South Asian summer monsoon (SASM), the circulation is along the eastern boundary: a West Indian coastal current (WICC) flows toward the equator, a northward undercurrent carries well-oxygenated waters off the Indian margin, and moderate coastal upwelling occurs. As the monsoon winds reverse during the winter season, the WICC flows northward, causing downwelling off the west coast of India and a relatively less oxygenated water column over the shelf. Therefore, the renewal of the oxygen-deficient subsurface waters is stronger during the SASM than during the winter monsoon.
The spatial variability of upwelling along the western continental margin of India can be inferred from water column productivity. During the pre-summer monsoon season, the sea surface temperature in the eastern Arabian Sea rises, thereby developing a mini warm pool, which then dissipates prior to the onset of summer monsoon precipitation as a result of upwelling (Shenoi et al., Reference Shenoi, Shankar and Shetye1999). During the summer monsoon season, moderate to intense upwelling occurs as a result of the complex interaction between alongshore wind stress, coastally trapped Kelvin waves, and the offshore propagating Rossby waves (Lévy et al., Reference Lévy, Shankar, Andre, Shenoi, Durand and DeBoyer Montegut2007). This upwelling causes a several-fold increase in productivity (Lévy et al., Reference Lévy, Shankar, Andre, Shenoi, Durand and DeBoyer Montegut2007). Maximum chlorophyll (up to 7.8 μg/l) are observed in the northern part of the eastern Arabian Sea at this time (Banse, Reference Banse1987), whereas during the winter monsoon season, northeast winds are too weak to induce any significant offshore Ekman transport in this region (Fontugne and Duplessy, Reference Fontugne and Duplessy1986, Madhupratap et al., Reference Madhupratap, Prasanna Kumar, Bhattathiri, Dileep Kumar, Raghukumar, Nair and Ramaiah1996). The perennial OMZ in the eastern Arabian Sea is observed at depths of between ~150 and 1200 m (Naqvi and Noronha, Reference Naqvi and Noronha1991). An oxygen-deficient condition in the intermediate depth develops because of high surface water productivity and sluggish ventilation, which results in denitrification (Naqvi and Noronha, Reference Naqvi and Noronha1991; Naqvi, Reference Naqvi1994).
THE δ15N OF THE ORGANIC MATTER IN THE EASTERN ARABIAN SEA
The marine nitrogen cycle is a complex phenomenon involving several processes, such as nitrogen fixation (N-fixation), NO3- utilization, denitrification, and anammox (anaerobic ammonium oxidation), through biologically mediated reactions. The nitrogen isotopes get mostly kinetically fractionated during these various steps, and it is therefore necessary to evaluate the conditions in the eastern Arabian Sea for correctly identifying the predominant process governing the δ15N values of organic matter. Supplementary Figures 1a–d show the north–south transect of dissolved oxygen, NO3-, and nitrate deficit (N*) for the upper 2000 m (and upper 300 m for N*) in the Arabian Sea. N* is a tracer indicating deviations of the ratio of nitrogen to phosphorous from the 16:1 stoichiometric relationship (Gruber and Sarmiento, Reference Gruber, Sarmiento, Robinson, McCarthy and Rothschild2002). In the case of normal biological reactions, where the N:P ratio stays at 16:1, N* is a conservative property. But processes that use N:P in a ratio less (more) than 16:1 results in low (high) N* anomalies (Gruber and Sarmiento, Reference Gruber, Sarmiento, Robinson, McCarthy and Rothschild2002). Denitrification and N-fixation are such processes that result in low and high N* anomalies, respectively. N* can therefore be an important tool in identifying regions of denitrification and N-fixation.
N-fixation introduces new bioavailable nitrogen with low δ15N values (Capone et al., Reference Capone, Subramaniam, Montoya, Voss, Humborg, Johansen, Siefert and Carpenter1998) into the ocean, thus compensating for the loss of NO3- during denitrification. The isotope effect during this process is very small (ɛ = 0.2–3‰), and the average δ15N value of the resulting particulate organic nitrogen (PON) is -1‰. The N* variability in the near-surface water (Supplementary Fig. 1c) shows that N* exhibits low values, indicating very little N-fixation. Nevertheless, there is a slight addition of bioavailable nitrogen from north to south, as exhibited by a slight increase in N* values. This implies that the N-fixation is weak in the regions of strong denitrification. It agrees with the findings of Altabet et al. (Reference Altabet, Murray and Prell1999) and Ganeshram et al. (Reference Ganeshram, Pedersen, Calvert and McNeil2000) that the rate of N-fixation is too weak to significantly affect the δ15N of NO3- in highly productive denitrification zones.
The incomplete utilization of NO3- by phytoplankton is a part of the internal cycling of nitrogen that leads to a small fractionation (isotope effect, ɛ = ~0.2–3.0‰), resulting in a slight increase in the δ15N values (Sigman et al., Reference Sigman, Altabet, Michener, McCorkle, Fry and Holmes1997). It usually occurs where iron is the limiting factor that reduces the uptake of NO3- and thereby affects the δ15N of the ambient waters (Ganeshram et al., Reference Ganeshram, Pedersen, Calvert and McNeil2000). In the Arabian Sea, NO3- is the limiting nutrient and is completely utilized in the near-surface photic zone (Supplementary Fig. 1b), so incomplete NO3- uptake does not affect the δ15N values (Schafer and Ittekkot, Reference Schäfer and Ittekkot1993). Further, nitrogen assimilation in the form of nitrite (NO2-), NO3-, ammonium (NH4+), and urea results in isotope effects of ~1‰, ~5‰, ≤20‰, and ~1‰, respectively (Waser et al., Reference Waser, Harrison, Nielsen, Calvert and Turpin1998). These forms of nitrogen are almost completely consumed in the near-surface water and therefore produce minimal isotopic fractionation.
NO3- is removed via denitrification in oxygen-deficient zones. The largest isotopic fractionation (isotope effect, ɛ = ~30‰) takes place during denitrification in the water column (Sigman et al., Reference Sigman, Karsh, Casciotti, Steele, Turekian and Thorpe2009). The oceanic average δ15N value of NO3- is ~5‰, and after experiencing denitrification, it increases to 15‰ or higher (Brandes et al., Reference Brandes, Devol, Yoshinari, Jayakumar and Naqvi1998; Rafter et al., Reference Rafter, Bagnell, Marconi and DeVries2019). It results in high δ15N values of POM (6–8‰) and consequently higher δ15N values of SOM. It is observed that the δ15N value of SOM is more than 6‰ in sediments underlying the denitrification zones in the Arabian Sea (Gaye-Haake et al., Reference Gaye-Haake, Lahajnar, Emeis, Unger, Rixen, Suthhof and Ramaswamy2005; Tripathi et al., Reference Tripathi, Tiwari, Lee and Khim2017, Reference Tripathi, Behera and Tiwari2020). In contrast, where denitrification is not prevalent, such as in the Bay of Bengal, the δ15N value of SOM is 5–6‰ (Gaye-Haake et al., Reference Gaye-Haake, Lahajnar, Emeis, Unger, Rixen, Suthhof and Ramaswamy2005). Denitrification also occurs in the pore waters of sediments, but the isotope effect is negligible (ɛ ≤0–3‰) owing to the complete consumption of NO3- (Sigman et al., Reference Sigman, Karsh, Casciotti, Steele, Turekian and Thorpe2009). Naqvi et al. (Reference Naqvi, Noronha and Reddy1982) reported that the intensity of denitrification decreases gradually, corresponding to the dissolved oxygen's spatial distribution from the northern to the southern parts of the Arabian Sea, up to 12°N. The dissolved oxygen concentration decreases from south to north (Supplementary Fig. 1a). The N* also mimics the pattern shown by the dissolved oxygen, with low anomalies spreading beyond 12°N, implying significant denitrification (Supplementary Fig. 1d).
Another newly identified process of fixed nitrogen (i.e., biologically available nitrogen) removal is anammox, where NO2- oxidizes NH4+ to N2 gas and NO3-. The isotopic effects arising out of anammox are not well understood, but a few available studies indicate an isotope effect of 23.5–30‰ (Brunner et al., Reference Brunner, Contreras, Lehmann, Matantseva, Rollog, Kalvelage and Klockgether2013; Kobayashi et al., Reference Kobayashi, Makabe, Yano, Oshiki, Kindaichi, Casciotti and Okabe2019). Nevertheless, such studies also note that the isotope effect derived for denitrification also includes the anammox effect, which probably increases the overall isotope effect, resulting in high δ15N of PON (Brunner et al., Reference Brunner, Contreras, Lehmann, Matantseva, Rollog, Kalvelage and Klockgether2013). Thus, the δ15N value of the surface NO3- and the resulting organic matter preserved in the sediment in SEAS is predominantly governed by water column denitrification.
MATERIALS AND METHODOLOGY
Core details, chronology, and sedimentation rate
For the present study, sediment core SK274-4 G (13°59′N, 72°E; 2.60 m length) (Fig. 1), collected from the continental slope of SEAS during the 274th cruise of the ORV Sagar Kanya, is used. This core was retrieved using a gravity corer from a water depth of 1290 m within the present-day OMZ. The core was then subsampled at every 1-cm interval and freeze-dried for further analysis. The chronology of the core is based on nine radiocarbon dates obtained using two species of planktic foraminifera (Globigerinoides ruber and Globigerinoides sacculifer; size range: 250–420 μm). The dates were obtained using the accelerator mass spectrometry (AMS) technique at the National Science Foundation AMS facility at the University of Arizona. The 14C dates were calibrated using the marine dataset (Marine09) (Reimer et al., Reference Reimer, Baillie, Bard, Bayliss, Beck, Blackwell and Bronk Ramsey2009) in Calib 6.0 (Stuiver and Reimer, Reference Stuiver and Reimer1993). The reservoir age correction of 355 years determined by Butzin et al. (Reference Butzin, Prange and Lohmann2005) was used for the core. The reservoir age given by Butzin et al. (Reference Butzin, Prange and Lohmann2005) is an estimate of ocean radiocarbon reservoir ages, based on a three-dimensional global ocean circulation model, and hence are more accurate (Cao et al., Reference Cao, Fairbanks, Mortlock and Risk2007). Core SK274-4 G spans the last ~43 ka, and the its top shows an age of ~800 yr. The age-depth model for the core is shown in Figure 2. The sedimentation rate for SK274-4 G averages 6.6 cm/ka and varies from 2.7 to 13.3 cm/ka for the past 43 ka. The maximum sedimentation rate of 13.3 and 9.6 cm/ka is observed at 16.7–19.3 and 19.3–24.6 ka intervals, respectively. The average sample resolution is ~150 yr.

Figure 1. Location of core SK 274-4 G with contours showing dissolved oxygen concentration at 300 m depth. The white dashed line indicates the nitrite maximum (>0.5 μΜ/L; Naqvi and Noronha, Reference Naqvi and Noronha1991) coinciding with the lowest oxygen concentration. The pink color indicates the permanent oxygen minimum zone (O2 <20 μΜ/kg). The dark pink circle indicates the location of core SK 274-4G. (For interpretation of the references to color in this figure legend, the reader is referred to the web version of this article.)

Figure 2. (color online) Age-depth model for core SK 274-4 G based on nine radiocarbon dates from selected species of planktic foraminifera. Sedimentation rates are shown in cm/ka.
Elemental and isotopic analyses of sedimentary organic carbon and total nitrogen
Each subsample was oven-dried at 40°C and then homogenized by finely grinding it in an agate mortar. For total organic carbon (TOC) concentration and δ13Corg estimation, carbonate was removed from each subsample by treating it with 2N hydrochloric acid for 16 hours and then centrifuging it to remove carbonate. The samples were then completely rinsed by adding deionized water five times and again oven-dried at 40°C. Given the known problems of loss of nitrogen compounds from SOM on acidification of samples, resulting in a bias in nitrogen content and δ15N values (Brodie et al., Reference Brodie, Casford, Lloyd, Leng, Heaton, Kendrick and Zong2011), untreated samples were used for total nitrogen (TN) and δ15N analyses. A portion of the ground samples was wrapped in a tin capsule and combusted using an elemental analyzer coupled to an Isoprime stable isotope ratio mass spectrometer at the Marine Stable Isotope Laboratory at the National Centre for Polar and Ocean Research (NCPOR), Goa, India. Samples were run along with blank and known standards. Standards were prepared by weighing 0.4–0.6 mg of IAEA cellulose (IAEA-CH-3) of certified isotopic composition (δ13C = −24.74‰ vs. the Vienna Pee Dee Belemnite [VPDB]) for carbon and 0.5–1.0 mg of IAEA ammonium sulphate (IAEA N1) of certified isotopic composition (δ15N = 0.4‰) for nitrogen. Carbon and nitrogen isotopic data are presented in δ notation with respect to the VPDB and atmospheric nitrogen, respectively. The analytical precisions based on repeat measurements of the reference standard for isotopic composition for the core are better than 0.02‰ for carbon and 0.08‰ for nitrogen. Analytical precisions based on repeat measurements of the reference standard (Sulfanilamide) for the TOC and TN measurements are ± 0.2% and ± 0.3%, respectively. Data quality was controlled by running the reference standard after every six samples.
Micropaleontological analysis
A total of 62 samples were selected at 5-cm intervals for the Globigerina bulloides abundance study. Each sample was weighed and wet-sieved over a 63-μm sieve. The residues were dried in an oven at 60°C, weighed, dry-sieved over a 125-μm screen, and then split into several aliquots to reduce the total number of foraminifera tests. In each sample, the faunal composition of planktic foraminifera was determined based on a minimum count of 300 individuals larger than 125 μm in diameter. The number of G. bulloides and the total number of planktic foraminifera for each sample was then counted. Finally, the relative abundance of G. bulloides was calculated as a percent of the total planktic foraminifera population.
RESULTS AND DISCUSSION
Surface water productivity during the last ~43 ka
An increased abundance of G. bulloides is indicative of upwelling of cold and nutrient-rich water to the surface, resulting in increased biological productivity. The upwelling is tightly coupled to productivity in the Arabian Sea, which is well established based on several sediment traps, plankton nets, remote sensing, and sediment core studies (Nair et al., Reference Nair, Ittekkot, Manganini, Ramaswamy, Haake, Degens, Desai and Honjo1989 and references therein). Therefore, changes in the abundance of G. bulloides can be an indicator of variability in productivity (Bé and Tolderlund, Reference Bé, Tolderlund, Funnell and Riedel1971; Kroon, Reference Kroon, Brummer and Kroon1988; Conan and Brummer, Reference Conan and Brummer2000; Singh et al., Reference Singh, Jung, Darling, Ganeshram, Ivanochko and Kroon2011).
In the present study, the G. bulloides abundance varies mostly between 5 and 20%. It was low during the glacial period and shows an increase during the deglaciation, with a decline during the Holocene (Fig. 3a). During the Last Glacial Maximum (LGM) and Henrich events (H1 to H4), it was low, suggesting decreased surface water productivity in SEAS. Most of the earlier studies from the eastern Arabian Sea report high glacial productivity, which has been attributed to a strong winter monsoon season, leading to enhanced convective mixing (Anil Kumar et al., Reference Anil Kumar, Rao, Patil, Kessarkar and Thamban2005; Dahl and Oppo, Reference Dahl and Oppo2006; Singh et al., Reference Singh, Kroon and Ganeshram2006, Reference Singh, Jung, Darling, Ganeshram, Ivanochko and Kroon2011; Anand et al., Reference Anand, Kroon, Singh, Ganeshram, Ganssen and Elderfield2008). A similar mechanism is unlikely to have occurred in SEAS because a significant increase in productivity in this region is observed only during the southwest monsoon season (Lévy et al., Reference Lévy, Shankar, Andre, Shenoi, Durand and DeBoyer Montegut2007). The weaker summer monsoon winds during the glacial interval must have resulted in a diminished summer season upwelling, thereby resulting in a decrease in productivity. A repeated abrupt decrease in G. bulloides during cold intervals was also reported from the central-eastern Arabian Sea and was attributed to a reduced winter monsoon strength, resulting in the strong stratification witnessed today during the inter-monsoon months (Singh et al., Reference Singh, Jung, Darling, Ganeshram, Ivanochko and Kroon2011). In SEAS, this decline in productivity during cold intervals and the LGM is also attributed to stronger stratification. But the cause of this at this core site was likely due to a weaker summer monsoon season coupled with a continual supply of low-salinity Bay of Bengal waters (Sarkar et al., Reference Sarkar, Ramesh, Bhattacharya and Rajagopalan1990) during the last glacial period, followed by the enhanced transport of these waters throughout the LGM (Saraswat et al., Reference Saraswat, Lea, Nigam, Mackensen and Naik2013; Naik et al., Reference Naik, Saraswat, Lea, Kurtarkar and Mackensen2016). A major increase in G. bulloides abundance between 12 and 14.5 ka suggests an increase in surface water productivity similar to productivity changes estimated from other low- and mid-latitude upwelling areas (Agnihotri et al., Reference Agnihotri, Bhattacharya, Sarin and Somayajulu2003). Although we see a decline in G. bulloides abundance between 11.5 and 8.5 ka, the values were still higher than those seen after 7.5 ka. This higher abundance suggests comparatively higher productivity during the early Holocene in SEAS. It uniformly decreases during the Holocene, implying a gradual decrease in productivity, which is similar to that reported from core ODP 723A off the Oman margin (Anderson et al., Reference Anderson, Baulcomb, Duvivier and Gupta2010).
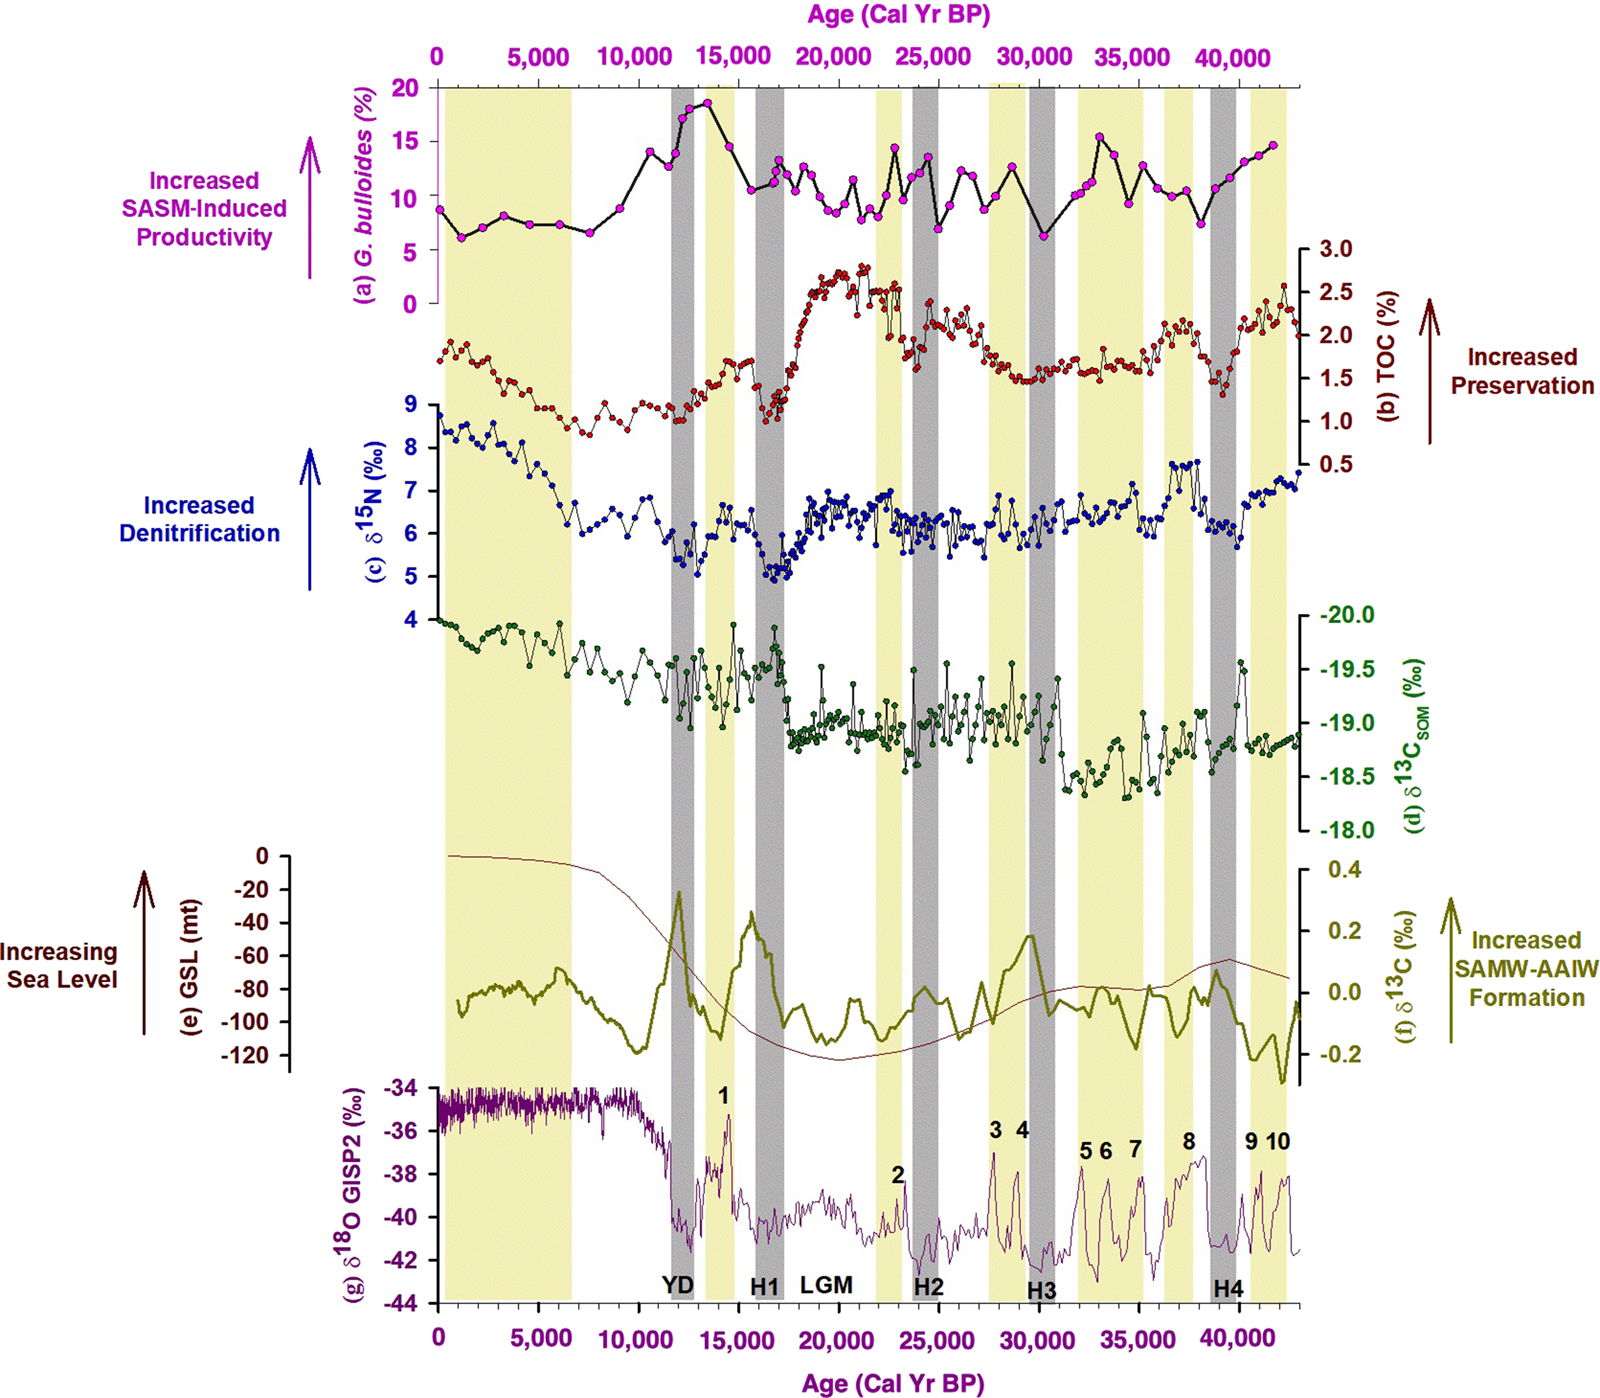
Figure 3. (color online) Downcore variation of geochemical proxies for core SK 274-4 G indicating productivity, denitrification, and provenance and its comparison with mean sea level, ventilation, and climate variability. Panels (a), (b), (c), and (d) show Globigerina bulloides abundance, total organic carbon concentration, δ15N, and δ13C of the sedimentary organic matter, respectively, from the present study. Panel (e) shows the global mean sea-level variability (Siddall et al., Reference Siddall, Rohling, Almogi-Labin, Hemleben, Meischner, Schmelzer and Smeed2003). Panel (f) shows the δ13C of benthic foraminifera, indicating millennial-scale changes in the Sub-Antarctic Mode Water-Antarctic Intermediate Water formation rate (Jung et al., Reference Jung, Kroon, Ganssen and Peeters2009). Panel (g) shows the Greenland Ice Sheet Project 2 (GISP2) δ18O record (Blunier and Brook, Reference Blunier and Brook2001).
Provenance of organic matter at the study site
It is important to ascertain the sources of organic matter at the site before using it for studying past denitrification variability. The carbon isotopes of organic matter preserved in the sediment (δ13Corg) can help in identifying its provenance. Organic matter produced by marine algae has an average δ13Corg value of ~ -21‰ (O'Leary, Reference O'Leary1988; Farquhar et al., Reference Farquhar, Ehleringer and Hubick1989). Whereas organic matter produced by land plants using the C3 pathway has an average δ13Corg value of ~ -27‰, those using the C4 pathway is ~ -14‰ (O'Leary, Reference O'Leary1988; Farquhar et al., Reference Farquhar, Ehleringer and Hubick1989). In the present study, δ13Corg varies from -20 to -18.30‰ (Fig. 3d). The δ13Corg values show a decreasing trend from 40 ka to the present, but the values stay in the range of the marine organic matter values. This implies a predominantly marine origin for the organic matter at the site.
The TOC variability
The TOC concentration varies between 0.80 and 2.84% (Fig. 3b) and exhibits a similar variability to δ15N, with a higher concentration during warmer periods and a lower concentration during colder periods. However, in SEAS, decoupling between G. bulloides abundance and TOC, as shown in the present study, points toward factors other than productivity affecting TOC accumulation in sediments. A similar trend between δ15N and TOC suggests that the accumulation of organic carbon in SEAS is mainly a response to better preservation under enhanced suboxic conditions rather than changes in primary productivity. In addition, a higher sedimentation rate can result in better preservation of organic matter, resulting in a higher TOC content (Calvert and Pedersen, Reference Calvert and Pedersen1993). Recently, Nagoji and Tiwari (Reference Nagoji and Tiwari2017) showed enhanced TOC values since the mid-Holocene, which was attributed to increased preservation caused by an increased sedimentation rate and enhanced reducing conditions in SEAS; this was also observed by Naik et al. (Reference Naik, Godad, Naidu, Tiwari and Paropkari2014) and Agnihotri et al. (Reference Agnihotri, Bhattacharya, Sarin and Somayajulu2003).
Centennial-scale denitrification variability in the eastern Arabian Sea
To determine the denitrification variability, we examined the δ15N of the organic matter preserved in the sediment. Our analysis did not show any effect of diagenetic alteration and terrestrial organic matter on δ15N values (see Supplementary Materials for more details). The δ15N values vary between 8.74 and 4.91‰ (Fig. 3c). The present study finds higher δ15N values during warmer periods (Marine Oxygen Isotope Stages [MIS] 1 and 3), indicating stronger denitrification and lower values, which in turn indicates weaker denitrification during the colder period (MIS 2). On shorter timescales, this high-resolution (centennial-scale) data show that the δ15N values are high during the warm interstadials (Dansgaard-Oeschger events and since the mid-Holocene; shown by yellow bands in Fig. 3), indicating stronger denitrification. The δ15N values are low during the cold stadials (Henrich events and Younger Dryas; shown by gray bands in Fig. 3), indicating weaker denitrification. We also observed moderately strong denitrification during the LGM.
The continuous wavelet transform (CWT) and the squared wavelet coherence (SWC), including phase analysis, was carried out to check if the visually perceived coherence between denitrification and climate is statistically significant (Fig. 4a and b), following Torrence and Campo (Reference Torrence and Compo1998) and Grinsted et al. (Reference Grinsted, Moore and Jevrejeva2004). Figure 4a represents the CWT for δ15N in SEAS. It shows high “power” in the periodicities between 1500 and 2000 years and between 3000 and 4000 years. These are very near to the well-known quasiperiodic variations of 1500 and 3000 years (Dansgaard-Oeschger events and Bond cycles) in various climate records. This suggests a strong coupling between denitrification and millennial-scale climate variability. The SWC also shows that denitrification intensity (δ15N values) and climate variability (Greenland Ice Sheet Project 2 [GISP2] δ18O; Blunier and Brook, Reference Blunier and Brook2001) are statistically significantly coherent (5% significance level; Fig. 4b). The phase difference is represented by the vector; arrows pointing to the right indicate in-phase, which confirms the visual observations that whenever the δ15N of organic matter is high (stronger denitrification in the Arabian Sea), the GISP2 δ18O is also high (warmer climate).

Figure 4. (color online) Spectral analyses, including the continuous wavelet transform (CWT) and the squared wavelet coherence (SWC). Panel (a) shows the CWT power spectrum for the denitrification variability (δ15N of core SK 274-4G). Panel (b) shows the SWC between denitrification and climate (δ15N and GISP2 δ18O). Panel (c) shows the SWC between denitrification and ventilation (δ15N and δ13C). Panel (d) shows the SWC between denitrification and N2O abundance (δ15N and N2O). The colors represents the “power,” which is proportional to the amplitude of a wave of a given period. Phase arrows pointing to the right = in-phase, left-pointing arrows = antiphase, down-pointing arrows = δ15N leading by 90°, and up-pointing arrows = δ15N lagging by 90°. The 5% significance level against red noise is shown as a thick contour. The lighter shades depict the cone of influence. The x-axis spans the last 40,000 years as shown by ×104.
One crucial limitation in assigning clear causes of denitrification changes in the OMZ is the lack of definite proxies for oxygen demand or supply. It has been noted that denitrification is most intense in the northeastern Arabian Sea (Naqvi, Reference Naqvi1987). By itself, this would suggest corresponding geographical gradients in the sediment δ15N signature. The water column data, in contrast, indicate a regional homogenization of the δ15N signal that reaches the euphotic zone (e.g., Altabet et al., Reference Altabet, Higginson and Murray2002). This regional homogeneity in the δ15N signal in the Arabian Sea suggests two things. First, an effective horizontal mixing of thermocline water leads to homogenization of the δ15N signals on the glacial-interglacial timescale. And second, local decoupling of productivity and denitrification exists and is probably due to effective ventilation of the thermocline. Pichevin et al (Reference Pichevin, Bard, Martinez and Billy2007) compared the long-term, high-resolution sedimentary δ15N record on the glacial-interglacial timescale from the Arabian Sea and reported a spatial and temporal heterogeneity in denitrification, thus ruling out the first possibility. Therefore, the second possibility of local decoupling of productivity and denitrification is examined below.
Decoupling of surface ocean productivity and denitrification in SEAS during the LGM and the Holocene
The productivity variability is not always accompanied by similar denitrification variability in SEAS (Fig. 3a and c). This decoupling is more prominent during the LGM and since the early Holocene. The increase in surface water productivity and the associated oxygen demand for the degradation of organic matter produced is regarded as the main control of water column denitrification (Ganeshram et al., Reference Ganeshram, Pedersen, Calvert and McNeil2000; Ivanochko et al., Reference Ivanochko, Ganeshram, Brummer, Ganssen, Jung, Moreton and Kroon2005). Studies have proposed that ventilation of the thermocline by intermediate water masses also controls the denitrification intensity by modulating the oxygen supply (Sarma, Reference Sarma2002; Pichevin et al., Reference Pichevin, Bard, Martinez and Billy2007). Model studies have also shown that past changes in the ventilation rate at intermediate depth by the Antarctic Intermediate Water (AAIW) can modulate denitrification in the OMZ (Galbraith et al., Reference Galbraith, Kienast, Pedersen and Calvert2004; Meissner et al., Reference Meissner, Galbraith and Volker2005; Schmittner et al., Reference Schmittner, Galbraith, Hostetler, Pedersen and Zhang2007), such as in the Arabian Sea. Given the decoupling between denitrification and productivity during the LGM and since the mid-Holocene in SEAS, we explore the impact of ventilation on the intensity of denitrification in this region below.
The cooling of high-latitude surface ocean waters and enhanced ventilation rates during the glacials could result in suppressing suboxic conditions and thus reduce water column denitrification (Meissner et al., Reference Meissner, Galbraith and Volker2005). In the western and northeastern Arabian Sea, studies have concluded that higher oxygen was related to an increased production of intermediate waters and its northward expansion (i.e., Sub-Antarctic Mode Water [SAMW]-AAIW) during North Atlantic Heinrich events (Pichevin et al., Reference Pichevin, Bard, Martinez and Billy2007). Therefore, to further investigate the influence of this southern-sourced, oxygen-rich intermediate-depth water mass in SEAS, we compared our δ15N record with the carbon isotopes of the epibenthic foraminifera record from core NIOP 905, off the Somali coast (Fig. 3f) (Jung et al., Reference Jung, Kroon, Ganssen and Peeters2009). The δ13C value of epibenthic foraminifera serves as a proxy for ageing the water mass along its flow path, (i.e., the ventilation state of the ocean) (Pahnke and Zahn, Reference Pahnke and Zahn2005). The AAIW has a high δ13C value of the dissolved inorganic carbon in the modern Indian and Pacific Oceans and was probably also high in the past (Charles and Fairbanks, Reference Charles and Fairbanks1992). The higher δ13C values thus represent an increased SAMW-AAIW formation.
The comparison between low and high peaks in δ13C values, suggesting decreased and increased SAMW-AAIW formation, and the δ15N record of the present study reveals that during the last glacial-interglacial cycle, the high/low peaks in the δ15N record are concurrent with episodes of decreased/increased SAMW-AAIW formation. Interestingly, the higher values observed in the δ15N record during the LGM coincide with the major decline in the inflow of the SAMW-AAIW into the Arabian Sea, as evidenced by the low δ13C value of epibenthic foraminifera. The lower δ15N values were observed during Heinrich Event 1; during the Younger Dryas, they coincide with an enhanced inflow of the oxygen-rich water mass. However, beyond the early Holocene (after ~8 ka, in the Northgrippian), the observed relationship between the SAMW-AAIW flux and δ15N weakens. This could be due to the presence of Indonesian intermediate, Red Sea, and Persian Gulf water masses, which were reduced during the last glacial period owing to an overall lower sea level (Kuhnt et al., Reference Kuhnt, Holbourn, Hall, Zuleva, Kase, Clift, Kuhnt, Wang and Hayes2004). During the last glacial period, when the sea level was 120 m lower than it is today (Fig. 3e), the Red Sea outflow (separated from the open ocean by shallow and narrow sills of 137 m) and the Persian Gulf outflow (separated from the open ocean by shallow and narrow sills of <100 m) was reduced by 85% (Rohling and Zachariasse, Reference Rohling and Zachariasse1996). It reached 50% at 10 ka and increased progressively with sea-level rise thereafter until it reached its present state at ~6 ka (Fig. 3e) (Rohling and Zachariasse, Reference Rohling and Zachariasse1996). So, during the last glacial-interglacial cycle, the intensity of denitrification at the core site was controlled by both the SASM-induced productivity and the southern-sourced oxygen-rich intermediate-depth water mass, with the latter dominating during the LGM. However, with the rise in sea level, the oxygen-poor Red Sea and Persian Gulf waters further prevented the southern-sourced water (SAMW-AAIW) from ventilating the Arabian Sea. It enabled a continuous buildup of oxygen deficiency and intensification of the OMZ and denitrification in the intermediate depth of SEAS. It also implies that the denitrification increase during the Holocene, which is often interpreted as strengthening the SASM, is in fact because of enhanced inflow of oxygen-poor water at intermediate depth. During the Holocene and the LGM, denitrification does not reflect the SASM-induced productivity.
The wavelet coherency analysis and the phase analysis were carried out to check if the visually perceived coherence between denitrification and the SAMW-AAIW formation is statistically significant (Fig. 4c), following Grinsted et al. (Reference Grinsted, Moore and Jevrejeva2004) and Torrence and Campo (Reference Torrence and Compo1998). We find that the denitrification intensity is statistically significantly coherent (5% significance level), with the SAMW-AAIW formation over a periodicity band of ~1000, 2000, 4000, and 8000 years during the different parts of the time series as shown in Figure 4c. The vector represents the phase difference; the arrows pointing to the left indicate antiphase, which confirms the visual observations; i.e., higher denitrification (high δ15N) during reduced SAMW-AAIW inflow (low benthic foraminifera δ13C).
Teleconnection among denitrification, high-latitude climate, and global monsoon: a probable mechanism
Denitrification generates nitrous oxide (N2O), an important greenhouse gas (Naqvi et. al., Reference Naqvi, Naik, Pratihary, D'Souza, Narvekar, Jayakumar, Devol, Yoshinari and Saino2006). Today, the oceans are one of the most important natural sources of N2O, supplying up to an estimated 5.4 Tg N/yr of which upwelling is a significant contributor (United States Environmental Protection Agency, 2010). For example, SASM-induced upwelling in the northwestern Arabian Sea, covering only 0.43% of the global oceans, contributes up to 18% of the total oceanic flux of N2O (Law and Owens, Reference Law and Owens1990). We find that higher and lower denitrification intensity observed in the present study matches with higher and lower N2O concentrations, respectively, in the central Greenland ice cores (GISP2; Sowers et al., Reference Sowers, Alley and Jubenville2003) within the constraints of the different resolutions (Fig. 5a and b). The high-resolution N2O data from these ice cores (from the Greenland Ice Core Project and the North Greenland Ice Core Project; Flückiger et al., Reference Flückiger, Blunier, Stauffer, Chappellaz, Spahni, Kawamura, Schwander, Stocker and Dahl-Jensen2004) also show a close correspondence with the denitrification variability during MIS 3 within the chronological uncertainties. This appears to break down during the Holocene. Possibly, denitrification is so intense (evident from the very high δ15N values) that a relatively larger proportion of N2O is further reduced to N2 gas.

Figure 5. Comparison of denitrification in the Arabian Sea with atmospheric N2O abundance, as reflected in the central Greenland ice cores record and the global summer monsoon convection and precipitation. The yellow and gray vertical bands show warmer and colder periods, respectively. Panel (a) shows denitrification in the southeastern Arabian Sea (present study). Panel (b) shows N2O variability of the central Greenland ice cores (Sowers et al., Reference Sowers, Alley and Jubenville2003; Flückiger et al., Reference Flückiger, Blunier, Stauffer, Chappellaz, Spahni, Kawamura, Schwander, Stocker and Dahl-Jensen2004). Panel (c) shows the stalagmite δ18O records from Dongge cave (Cheng et al., Reference Cheng, Edwards, Sinha, Spötl, Yi, Chen and Kelly2016). Panel (d) shows the stalagmite δ18O records from Hulu cave (Wang et al., Reference Wang, Liu, Cui and Abrahamsen2001) and Sanbao cave (SB26 = sky blue, SB10 = red) (Wang et al., Reference Wang, Cheng, Edwards, Kong, Shao, Chen, Wu, Jiang, Wang and An2008). Panel (e) shows the elemental ratio of zirconium to aluminum (Zr/Al) from the northern Arabian Sea, reflecting grain size, source aridity, and wind strength (Deplazes et al., Reference Deplazes, Lückge, Stuut, Pätzold, Kuhlmann, Husson, Fant and Haug2014), and indicating the intensity of the Asian summer monsoon. Panel (f) shows the elemental ratio of iron to potassium (Fe/K) in core GeoB9508 off the coast of Senegal, tracing Sahel aridity (Mulitza et al., Reference Mulitza, Prange, Stuut, Zabel, von Dobeneck, Itambi, Nizou, Schulz and Wefer2008). Panel (g) shows the sea surface salinity record from the Gulf of Guinea, suggesting relative changes in the outflow of the Niger and Sanaga Rivers (Weldeab et al., Reference Weldeab, Lea, Schneider and Andersen2007) and reflecting the intensity of the African summer monsoon. Panel (h) shows downcore color reflectance measurements from the Cariaco Basin (Peterson et al., Reference Peterson, Haug, Hughen and Röhl2000). Panel (i) shows the magnetic susceptibility in Lake Péten Itzá, Guatemala (Hodell et al., Reference Hodell, Anselmetti, Ariztegui, Brenner, Curtis, Gilli and Grzesik2008), reflecting the intensity of the American summer monsoon. Panel (j) shows the GISP2 δ18O records (Blunier and Brook, Reference Blunier and Brook2001). (For interpretation of the references to color in this figure legend, the reader is referred to the web version of this article.)
The visual similarity between N2O (Sowers et al., Reference Sowers, Alley and Jubenville2003) and the denitrification variability (present study) is further statistically confirmed by wavelet coherency analysis and phase analysis (Fig. 4d). We find that the denitrification intensity and N2O record are statistically significantly coherent (5% significance level) over a periodicity band of ~4000 and 8000 years. The vector represents the phase difference; the arrows pointing to the right indicate in-phase, which confirms the visual observations. This coupling between high and low denitrification and high and low N2O abundance is observed during warm and cold periods, respectively, and is identified through the δ18O record of the GISP2 ice core (Fig. 5j). It implies that a part of global warmth due to higher greenhouse gases abundance can be ascribed to the tropical denitrification variability.
We further compared our δ15N record with a set of key paleomonsoon records located at the northern rim of the boreal summer Intertropical Convergence Zone (ITCZ) monsoonal rain belt for the past 40 ka (Fig. 5). All of them show increased intensity during warm interstadials and decreased intensity during cold stadials. Similar variability during warm and cold periods in a well-dated, high-resolution record from a stalagmite from Dongge cave (Cheng et al., Reference Cheng, Edwards, Sinha, Spötl, Yi, Chen and Kelly2016) and another from Hulu and Sanbao caves (Wang et al., Reference Wang, Liu, Cui and Abrahamsen2001, Reference Wang, Cheng, Edwards, Kong, Shao, Chen, Wu, Jiang, Wang and An2008) (Fig. 5c and d), along with one from the northern Arabian Sea (Fig. 5e) (Deplazes et al. Reference Deplazes, Lückge, Stuut, Pätzold, Kuhlmann, Husson, Fant and Haug2014), suggests that millennial-scale changes in the intensity of the Asian monsoon occurred synchronously with changes in the North Atlantic. Based on the relative contributions of atmospheric dust and fluvial suspension in marine sediments using the elemental ratio of iron to potassium (Fe/K) (Fig. 5f), Mulitza et al. (Reference Mulitza, Prange, Stuut, Zabel, von Dobeneck, Itambi, Nizou, Schulz and Wefer2008) suggested abrupt onsets of arid conditions in the West African Sahel during the time of Henrich events. Further, the precipitation record from the marine sediment core in the Gulf of Guinea (MD03-270), an indicator of relative changes in the outflow of the Niger and Sanaga Rivers, shows a decline during cold stadials and from the mid-Holocene to the present (Weldeab et al., Reference Weldeab, Lea, Schneider and Andersen2007) (Fig. 5g). In the Cariaco Basin, at the northern extent of the South American ITCZ seasonal migration, Peterson et al., (Reference Peterson, Haug, Hughen and Röhl2000) noted downcore color reflectance measurements (ODP site 1002C) (Fig. 5h) that register millennial-scale variation in the ITCZ position. They also observed deposition of dark, generally laminated, sediments during warm interstadial intervals, whereas deposition of light-colored bioturbated sediments was restricted to colder stadial intervals of the last glacial. Hodell et al. (Reference Hodell, Anselmetti, Ariztegui, Brenner, Curtis, Gilli and Grzesik2008) examined magnetic susceptibility, reflecting wet-dry cycles (Fig. 5i). The most arid conditions were observed during Heinrich events, which accords with the results from the Cariaco Basin (Peterson et al., Reference Peterson, Haug, Hughen and Röhl2000). Thus, the above comparisons reveal that the major periods of increased global monsoon intensity covaried and were accompanied by enhanced denitrification/N2O emission. Additionally, tropical precipitation leads to larger wetlands, the most important source of methane. Present-day estimates suggest that natural wetlands contribute 170 Tg CH4/yr (United States Environmental Protection Agency, 2010). Thus, enhanced tropical monsoon convection appears to increase the production of greenhouse gases. Further, studies from the western Arabian Sea have shown that the denitrification variability may affect the atmospheric CO2 via modulation of the biological pump through changes in the marine nitrogen inventory (Altabet et al., Reference Altabet, Higginson and Murray2002; Ganeshram et al., Reference Ganeshram, Pederson, Calvert and Francois2002). Hence, the synchronicity between the high-latitude climate, denitrification, and the global monsoon system (South American, African, and Asian monsoons) at the millennial timescale indicates that variations in tropical monsoonal convection possibly affect the atmospheric moisture content and emission of greenhouse gases, which in turn influence the high-latitude climate.
CONCLUSIONS
This study presents the centennial-scale denitrification variability from SEAS since the last glacial period. It finds a close correspondence between millennial-scale climate change and denitrification. Stronger denitrification is observed during warm periods and Dansgaard-Oeschger events. Weaker denitrification is found during cold periods (except the LGM) like Heinrich events and the Younger Dryas. It demonstrates that both the ventilation of the SAMW-AAIW and the SASM-induced productivity played a crucial role in modulating denitrification intensity in SEAS. During the Holocene and the LGM, denitrification increased (higher δ15N) despite reduced monsoon-induced productivity in SEAS. During the LGM, this increased intensity is related to reduced thermocline ventilation as a result of weakened thermohaline circulation. Conversely, during the Holocene, the decoupling between denitrification and productivity is caused by the sluggish inflow of oxygen-depleted Red Sea and Persian Gulf waters into the intermediate depth of SEAS owing to rising sea level. Thus, increasing denitrification during the Holocene does not reflect higher productivity and hence does not suggest strengthening SASM. Finally, this study shows that tropical convection and denitrification influenced the high-latitude climate on the millennial timescale through significant greenhouse gas production.
ACKNOWLEDGMENTS
We thank the director of the NCPOR for support and encouragement. Tiwari also thanks the Ministry of Earth Sciences, the Government of India, and the Research Council of Norway for support through the Ind-Nor program (MoES/Ind-Nor/PS-8/2015 and grant no. 248793). We thank M. Tariq of NCPOR for help in spectral analysis and C. Torrence, G.P. Compo, A. Grinsted, J.C. Moore, and S. Jevrejeva for MATLAB codes. We thank the two anonymous reviewers, and editors D. Booth and L. Bradtmiller, for constructive comments.The data for this paper can be accessed through the supporting information or by direct request to the corresponding author. This is NCPOR contribution no. J-79/2020-21.
SUPPLEMENTARY MATERIAL
The supplementary material for this article can be found at https://doi.org/10.1017/qua.2020.118


