


Introduction
Most paleoproductivity reconstructions have mainly focused on upwelling areas due to their unique characteristics as major productive ecosystems, contributing to about 25% of the world’s fisheries landings (Jennings et al., Reference Jennings, Kaiser and Reynolds2001). Nevertheless, these regions constitute only a small part of the ocean (roughly 5%). Past estimates for the nutrient-depleted subtropical North Pacific Ocean, typically considered the ocean’s desert, suggest that this extensive region significantly contributes to the carbon sequestered from the surface ocean by the ocean biological carbon pump (Emerson et al., Reference Emerson, Quay, Karl, Winn, Tupas and Landry1997; Sarmiento and Gruber, Reference Sarmiento and Gruber2002). If illustrative of other subtropical regions, such as the North Atlantic Subtropical Gyre, these large nutrient-depleted areas may be responsible for up to half of the biological pump of carbon to the deep ocean (Emerson et al., Reference Emerson, Quay, Karl, Winn, Tupas and Landry1997; Oschlies, Reference Oschlies2002). Moreover, studies based on the mid-latitude North Atlantic (Gil et al., Reference Gil, Keigwin and Abrantes2009; Schwab et al., Reference Schwab, Kinkel, Weinelt and Repschläger2012) suggest the importance of addressing offshore (oligotrophic) productivity changes over glacial-interglacial cycles. These changes likely account for central mechanisms in the past global carbon cycle (Emerson et al., Reference Emerson, Quay, Karl, Winn, Tupas and Landry1997; Oschlies and Garcon, Reference Oschlies and Garcon1998; Williams and Follows, Reference Williams and Follows1998). It is thus essential to understand the processes behind the organic-carbon export in these oligotrophic areas in order to improve comprehensive earth system models that allow predicting future climate changes more accurately.
The Iberian margin is a key region for paleoceanographic studies (e.g., Shackleton et al., Reference Shackleton, Hall and Vincent2000). It is represented by the North Atlantic Eastern Boundary Upwelling System, which has been widely targeted for paleoproductivity reconstructions over different periods based on nearshore cores (e.g., Abrantes, Reference Abrantes1991; Cayre et al., Reference Cayre, Lancelot, Vincent and Hall1999; Incarbona et al., Reference Incarbona, Martrat, Stefano, Grimalt, Pelosi, Patti and Tranchida2010; Salgueiro et al., Reference Salgueiro, Voelker, de Abreu, Abrantes, Meggers and Wefer2010). In contrast, past changes in productivity within the adjacent offshore region have received very little attention and have only been studied at low temporal resolution (Lebreiro et al., Reference Lebreiro, Moreno, Abrantes and Pflaumann1997; Marino et al., Reference Marino, Maiorano, Tarantino, Voelker, Capotondi, Girone, Lirer, Flores and Naafs2014; Martins et al. Reference Martins, Rey, Pereira, Plaza-Morlote, Salgueiro, Moreno and Duleba2017).
Presently, subtropical regions can no longer be considered barren deserts, as they account for important productive areas due to mesoscale eddy activity (Oschlies and Garcon, Reference Oschlies and Garcon1998; Pelegri et al., Reference Pelegri, Aristegui, Cana, Gonzalez-Davila, Hernandez-Guerra, Hernandez-Leon, Marrero-Diaz, Montero, Sangra and Santana-Casiano2005; Dufois et al., Reference Dufois, Hardman-Mountford, Greenwood, Richardson, Feng and Matear2016). Here, we emphasize the importance of phytoplankton biomass generated by means of sub-mesoscale eddy-driven vertical nutrient fluxes (Lévy, Reference Lévy2003; Dufois et al., Reference Dufois, Hardman-Mountford, Greenwood, Richardson, Feng and Matear2016), due to upper-ocean mesoscale activity (Supplementary Figure 1) over glacial-interglacial timescales.
We report on a multi-proxy high-resolution study of a sedimentary sequence taken at an open ocean site off Portugal (core MD01-2446; Tore Seamount). The area is part of the eastern boundary of the North Atlantic Subtropical Gyre. The core site is located about 300 km from the coast within a transitional/oligotrophic setting and is ideally positioned to investigate the role of oceanic primary production in surface waters linked to upper-ocean mesoscale activity in comparison to onshore productivity driven by variable upwelling (e.g., Abrantes, Reference Abrantes1991; Pailler and Bard, Reference Pailler and Bard2002). The combination of several parameters (reflecting oceanic productivity, bottom-water flow speed, surface- and deep-water masses properties and terrestrial input) enables us to fully characterize the evolution of offshore conditions at the Iberian margin over the period of 140–60 ka, where climate was as warm or warmer than today (Kukla et al., Reference Kukla, Bender, de Beaulieu, Bond, Broecker, Cleveringa and Gavin2002) and the response of Atlantic Meridional Overturning Circulation (AMOC) enhanced around the transitions from warm to cold sub-stages (Guihou et al., Reference Guihou, Pichat, Govin, Nave, Michel, Duplessy, Telouk and Labeyrie2011).
Core location and modern hydrographic setting
Core MD01-2446 (39°03’N, 12°37’W) is a Calypso Piston Core, 26.60 m in length, taken within the Pole-Ocean-Pole project in 2001 during the MD123 Geosciences cruise on board the RV Marion Dufresne. It was retrieved from the eastern external slope rim of the Tore Seamount, a crater-like feature about 100 km in diameter that rises ~2800 m above the adjacent basin (Fig. 1). The sediment core was recovered at 3547 meter water depth (mwd). Its location and depth on the external rim of the seamount guarantees negligible influence from lateral downslope sediment transport from the Iberian continental shelf. The far distance to the coast enables monitoring the past local (though transitional/oligotrophic) oceanic productivity changes (Behrenfeld et al., Reference Behrenfeld, O/‘Malley, Siegel, McClain, Sarmiento, Feldman, Milligan, Falkowski, Letelier and Boss2006).
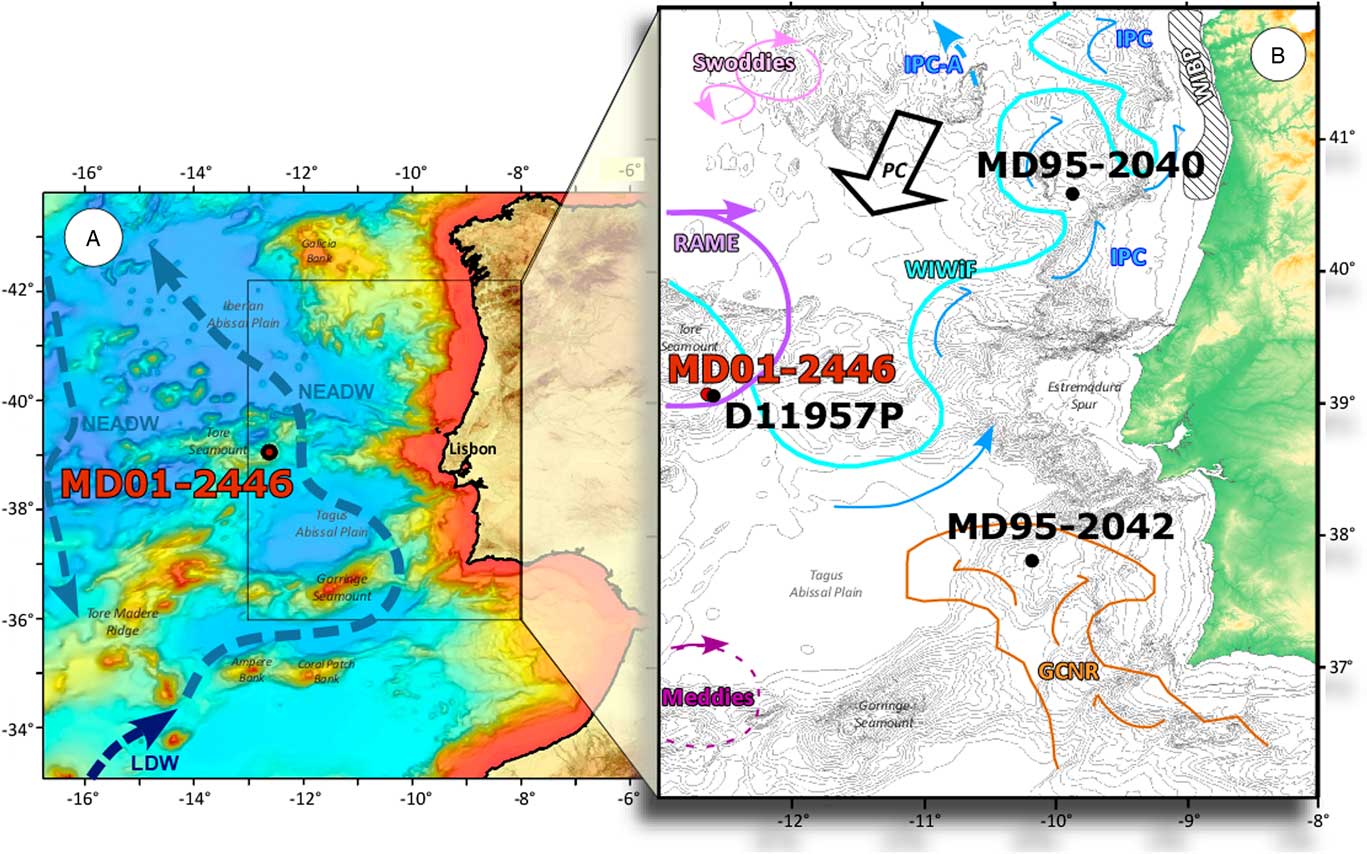
Figure 1 (color online) Position of cores MD01-2446 (39.06°N, 12.62°W, 3547 m), D11957P (39.05°N, 12.58°W, 3585 m), MD95-2042 (37.8°N, 10.17°W, 3146 m), and MD95-2040 (40.58°N, 9.86°W, 2465 m). (A) Digital elevation model from Farr et al. (Reference Farr, Rosen, Caro, Crippen, Duren, Hensley and Kobrick2007), bathymetry from IOC, IHO, and BODC, 2003. Blue dashed arrows indicate the main deep-water mass off the Iberian margin, adapted from van Aken (Reference van Aken2000). NEADW, Northeast Atlantic Deep Water; LDW, Lower Deep Water; AABW, southern-sourced water mass derived from Antarctic Bottom Water. (B) Upper ocean winter-time circulation (adapted from Peliz et al., Reference Peliz, Dubert, Santos, Oliveira and Cann2005). WIWiF, Western Iberia Winter Front; IPC, Iberian Poleward Current; IPC-A, Alternative path of the Iberian Poleward Current; PC, Portugal Current; GCNR, Gulf of Cadiz Northern Recirculation; RAME, Recurrent Anticyclonic meander/eddy; Swoddies, Slope Water Oceanic Eddies; Meddies, Mediterranean eddies; WIBP, Western Iberia Buoyant Plume. (For interpretation of the references to color in this figure legend, the reader is referred to the web version of this article.)
The Iberian margin is bathed at the surface by the southward branch of the North Atlantic Drift off Iberia (named Portugal Current) and by the northward Portugal coastal counter-current (Fig. 1; Fiúza, Reference Fiúza1984; Peliz et al., Reference Peliz, Dubert, Santos, Oliveira and Cann2005). During spring/summer seasons, Iberian coastal surface waters are sourced in the Eastern North Atlantic Central Water that upwells (forming cold and relatively more nutrient-rich surface waters) due to the influence of the trade winds, typically of the Eastern Boundary Upwelling Systems (Fiúza, Reference Fiúza1984). The offshore extent of these upwelled cold waters is about 50 km wide (Fiúza, Reference Fiúza1983). Present-day offshore influence of upwelled water-related filaments and plumes, formed in the vicinity of capes, does not usually exceed 150–200 km into the open ocean (Sousa and Bricaud, Reference Sousa and Bricaud1992). In contrast, during the winter season the poleward slope current, described as a narrow-slope trapped flow structure, has a turbulent character with an associated mesoscale eddy field (Oliveira et al., Reference Oliveira, Peliz, Dubert, Rosa and Santos2004; Peliz et al., Reference Peliz, Dubert, Santos, Oliveira and Cann2005). The long-lived anticyclones formed during the separation of a poleward slope current at prominent capes are observed off northern Iberia, extending down to water depths >1000 m, migrating off-slope and into the deep ocean (Fig. 1; Peliz et al., Reference Peliz, Dubert, Santos, Oliveira and Cann2005).
Deep-water circulation in the vicinity of the Tore Seamount is influenced by the lower North Eastern Atlantic Deep Water (NEADW), characterized by high oxygen and low nutrient contents, and the Southern Source Bottom Water with high nutrients and lower oxygen contents (van Aken, Reference van Aken2000). At present, the NEADW is a mixture of the Iceland Scotland Overflow Water (23%), Labrador Sea Water (27%), and (47%) Antarctic Bottom Water (AABW; van Aken, Reference van Aken2000).
Core MD01-2446 is in the range of the North Atlantic Deep Water (NADW) during interglacials and the Southern-sourced Ocean Water (SOW) during glacials, allowing reconstruction of past deep oceanic circulation (Adkins et al., Reference Adkins, Ingersoll and Pasquero2005).
Methods
Stable carbon and oxygen isotopes
In our study, surface- and deep-water records of carbon and oxygen isotopic composition were based on the planktonic foraminifera G. bulloides and benthic foraminifera C. wuellerstorfi, respectively. A total number of 186 raw samples (2-cm resolution of sampling interval) were freeze-dried, later washed with distilled water, sieved at 63 and 150 μm, and then dried in paper filters for 48 hours in an oven at 40°C. Specimens of G. bulloides were picked from the 250–315 μm fraction and C. wuellerstorfi from the fraction greater than 250 μm. The δ18O and δ13C of G. bulloides (3–4 specimen per analysis) and C. wuellerstorfi (1–2 specimens per analysis) were measured at the Laboratoire des Sciences du Climat et de l’Environnement (LSCE) in Gif-sur-Yvette, on a Finnegan DELTA plus XP and GV OPTIMA and IsoPrime mass spectrometers. Data is expressed in ‰ versus Vienna Pee-Dee Belemnite (VPDB). VPDB is defined with respect to NBS19 calcite standard (Coplen, Reference Coplen1988). The mean external reproducibility (1σ) of carbonate standards is ±0.05‰ and ±0.03‰ for δ18O and δ13C, respectively; measured NBS18 δ18O is -23.2 ± 0.2‰ VPDB. The pooled standard deviation replicate measurements for the studied period is 0.31‰ and 0.26‰ for δ18O and δ13C for G. bulloides and 0.17‰ and 0.24‰ for C. wuellerstorfi. Oxygen isotope values for C. wuellerstorfi were corrected to the ambient seawater equilibrium by 0.64‰ (Shackleton and Opdyke, Reference Shackleton and Opdyke1973).
Analyses of bulk δ18O were performed in about 50 mg of crushed sediment, treated with 100% phosphoric acid in a Kiel-carbonate device type and loaded into a Finnigan MAT 251 mass spectrometer at MARUM (University of Bremen, Germany). The precision of the equipment is ±0.07‰ for standard repeated measurements.
Grain-size analyses
A volume of 8–25 cm3 of sediment sample was freeze-dried. When necessary, sample material was disaggregated in a 0.033-mol sodium hexametaphosphate (Calgon) solution, then washed, and sieved over a 63-μm mesh size. In the <63-μm fraction, organic matter was removed with hydrogen peroxide, excess reagent released in a 60°C warm water bath, and the samples washed with distilled water through diatom ceramic candles. Each sample was then homogenised by stirring and immediately measured in a Micrometrics Sedigraph 5100 at the LNEG laboratory. A set of samples was treated with C2H4O2 and C2H7NO2 to eliminate carbonates, stirred, and re-run in the Sedigraph.
Both bulk (189) and carbonate-free (117) samples were analysed. The error of replicated samples is ±0.12 µm for bulk and ± 0.35 µm for carbonate-free analysis. Statistics were calculated for the grain-size distribution interval of 0–63 µm. The data is presented as two parameters: percentage of sortable silt (SS%), i.e., % (10–63 µm)/<63 µm (McCave et al., Reference McCave, Manighetti and Robinson1995; McCave and Hall, Reference McCave and Hall2006), and mean carbonate-free <63 µm. We have used mean carbonate-free <63 µm, rather than mean sortable silt (S̅S̅, mean grain size of the carbonate-free non-cohesive 10–63 µm interval) because samples of MD01-2446 contain <12% of %SS. Supplementary Figure 2, however, illustrates a good cross-correlation between %SS and carb-free <63% of R2=0.68, therefore achieving the purpose of tracing strength of bottom currents.
Magnetic analyses
To reconstruct past changes in the average magnetic grain size, ARM (Anhysteretic Remanent Magnetization), IRM (Isothermal Remanent Magnetization), κ (volume low-field magnetic susceptibility) data, and hysteresis parameters have been used.
The low-field magnetic susceptibility has been measured on u-channels with a 45-mm diameter MS2-C Bartington coil at LSCE. The data were generated every 2 cm with a resolution close to 4 cm and then normalised by volume to get the volume susceptibility (κ). ARM was also acquired on u-channels using a 50µT DC field with a superimposed 0.1T AF peak field along the axis of the u-channel. The translation speed during acquisition was 1 cm/s to secure the full acquisition of ARM (Brachfeld et al., Reference Brachfeld, Kissel, Laj and Mazaud2004). The κ ARM parameter was obtained by dividing the value of ARM by that of the DC field. Saturated IRM (SIRM) was then acquired, also along the vertical geographical axis at 1 T using a 2G 1.6-m-long pulsed solenoid. The measurements of ARM and IRM were made using cryogenic 755-R 2G magnetometers equipped with high-resolution pick-up coils (Weeks et al., Reference Weeks, Laj, Endignoux, Fuller, Roberts, Manganne, Blanchard and Goree1993) and placed in the µ-metal shielded room at LSCE. As for κ, the measurements were made every 2 cm with a spatial resolution of about 4 cm.
Both ratios κ ARM /κ and ARM/IRM are used as proxies for magnetic grain-size changes as they are smaller (greater) for coarse (fine) populations of magnetic particles (King et al., Reference King, Banerjee, Marvin and Özdemir1982). The above ratios are only empirically related to the magnetic grain size. Therefore, we also performed magnetic hysteresis measurements using an AGM 2900 from Princeton Measurements Corporation every 5 cm. The hysteresis loops were made between +1 and -1 T. After adjustment of the high field slope, the saturation magnetization (Ms), the remanent saturation magnetization (Mrs), and the coercitive field (Hc) were calculated. The remnant coercitive field (Hcr) was then determined by a remnant curve starting by saturation at 1T followed by a stepwise decreasing field, opposed to the saturating one. The Mr/Ms and Hcr/Hc ratio are both related to the domain-state of the magnetic grains, in turn related to the magnetic grain size. These data, although at slightly lower resolution, were used to compare with the continuously acquired κ ARM /κ and ARM/IRM ratios.
Bulk geochemistry
The biogenic opal content in each sample was measured at LNEG laboratory following the reduction colorimetric technique by molybdate-blue spectrophotometry (Mortlock and Froelich, Reference Mortlock and Froelich1989). All the samples, standards, and blanks were duplicated and therefore opal data was plotted for each depth as the average value between sample and replicate. The long-term average of the standard deviation of all the pairs of samples/replicates is ±0.03 wt %.
The siliceous fraction is prone to dissolution in the North Atlantic, and therefore the determination of biogenic opal in pelagic regions, where typically siliceous productivity is low, is known to be limited (Mortlock and Froelich, Reference Mortlock and Froelich1989). For this reason, we have used an additional (and independent) proxy for productivity, organic carbon (Corg), allowing for comparison with opal data. Even though dependent on bottom-water redox conditions, the Corg record generally shows a positive correlation between surface water productivity and organic-carbon accumulation in the sediments (Stein, Reference Stein1990; Nave et al., Reference Nave, Freitas and Abrantes2001; Lebreiro et al., Reference Lebreiro, Francés, Abrantes, Diz, Bartels-Jónsdóttir, Stroynowski and Gil2006; Romero et al., Reference Romero, Kim and Donner2008).
The total carbon content was determined in three replicates of 2 mg of freeze-dried, ground, and homogenised bulk sediment sample per level, using CHNS-932 LECO elemental equipment at LNEG laboratory. For each replicate, total carbon was analysed, then organic carbon combusted at 400°C temperature (4 steps of 100°C/h plus 3h at 400°C), and analysed for inorganic carbon content (CaCO3). Organic carbon was calculated, for each level, as the difference between total carbon and inorganic carbon (CaCO3) in weight percentage (wt %).
Sedimentary fluxes of productivity data (opal, organic carbon) were determined by using 230Th normalisation, as it provides a means to achieve more accurate vertical mass-accumulation rates (François et al., Reference François, Frank, van der Loeff and Bacon2004). Indeed, vertical mass-accumulation rates, when corrected to 230Th normalised flux, avoids misinterpretations of sediment mass-accumulation rates due to sediment focusing on the seafloor by bottom currents (François et al., Reference François, Frank, van der Loeff and Bacon2004). Thus, all productivity data was corrected to 230Th normalised flux (Guihou et al., Reference Guihou, Pichat, Nave, Govin, Labeyrie, Michel and Waelbroeck2010; Guihou et al., Reference Guihou, Pichat, Govin, Nave, Michel, Duplessy, Telouk and Labeyrie2011), instead of using the sediment mass-accumulation rates.
X-ray analyses
Bulk sediment samples were freeze-dried overnight and hand crushed in an opal mortar. The mineralogical characterization of sediment samples by X-ray diffraction was carried out using a Philips PW 1710 powder diffractometer with Bragg-Brentano geometry, equipped with a large anode copper tube and a graphite single crystal monochromator. These assays were performed at the X-ray laboratory installed in the Unit of Mineral Resources and Geophysics of LNEG.
Six elements were selected for X-ray fluorescence (XRF) spectrometry tests due to their relevance in marine sediment records: Ca, Sr, Al, Fe, Ti, K, and Ba. Powdered samples (approximately 200 mg) were irradiated using an automated wavelength dispersive spectrometer Philips PW 1400 equipped with a rhodium tube to collect five successive counting (30-s fixed counting time) at the diagnosis emission line of each one of these elements (Lα for Ba and Kα for the others) and at the corresponding spectral background using suitable analysing crystals. After subtracting the background from the peak counts, selected counting ratios were calculated: Ca, Sr, and Ba versus Al, and K, Fe, and Ti versus Ca.
Because such quick XRF tests have essentially a semi-quantitative character, comparison with 11 discrete samples that were analysed by ICP-AES at an external certified laboratory (Aveiro University) allowed to validate the geochemical data obtained at the local X-ray laboratory. Due to funding, only a limited number of samples (11 samples) and elements (Ba as proxy for productivity) could be analysed and we chose Al and Ba, which yielded average RSD (%) of 2.4% and 1.7%, respectively.
Chronology
In order to achieve a precise chronological framework to define sub-stages (millennial-scale precision) we compared cores located in a narrow region instead of using a global benthic stack (Lisiecki and Raymo, Reference Lisiecki and Raymo2005). Indeed, it has been shown that there might be significant differences in large glacial-interglacial transitions of the benthic δ18O records of different depth/water masses/ocean basins (Waelbroeck et al., Reference Waelbroeck, Skinner, Labeyrie, Duplessy, Michel, Vazquez Riveiros, Gherardi and Dewilde2011).
Over the period 140–60 ka, four tie-points have been defined between the G. bulloides oxygen isotopic records of each core (MD95-2040 and MD01-2446) and the G. bulloides oxygen isotopic record of core MD95-2042 (Supplementary Figure 3). MD95-2040 and MD01-2446 indicate a mean sedimentation rate of 5cm/ka over stage MIS 5.
At present, and likely during the time span of the record, the Tore Seamount location is within the same water masses as core MD95-2042, which has a well-established and precise chronology. Thus, we have used the revisited MD95-2042 age model (Govin et al., Reference Govin, Chiessi, Zabel, Sawakuchi, Heslop, Hörner, Zhang and Mulitza2014) based on the AICC2012 ice core chronology (Bazin et al., Reference Bazin, Landais, Lemieux-Dudon, Toyé Mahamadou Kele, Veres, Parrenin and Martinerie2013; Veres et al., Reference Veres, Bazin, Landais, Toyé Mahamadou Kele, Lemieux-Dudon, Parrenin and Martinerie2013), as the reference to build the MD01-2446 chronology, by direct relationship between the planktonic δ18O records of both cores. Ages between the age-control points were calculated by linear interpolation using Analyseries software (Paillard et al., Reference Paillard, Labeyrie and Yiou1996). Errors for the current correlation range between 0.5 to 1.5 ka on the age scale. Assuming that rapid transitions are synchronous, the error is smaller near rapid transitions (and the tie-points) and larger in between.
Results
Results of the analysed core, MD01-2446, are presented in comparison with previously published data of coastal sites (cores MD95-2040: 40°34.91’N, 9°51.67’W, 2465 m water depth; and MD95-2042: 37°47.99’N, 10°9.99’W, 3146 m) and a nearby offshore core (D11957: 39°03’N, 12°35’W, 3585 mwd; Table 1).
Table 1 Cores considered in this study (data used from each core and respective reference of data source).

Coastal versus offshore surface water masses
Comparison between nearshore and offshore areas of the Iberian margin (Table 1) was based on changes in δ18O of planktonic foraminifer G. bulloides (Fig. 2A). Over the 140–60 ka interval, oxygen isotopic values from core MD01-2446 vary approximately between 1 and 3‰. Typical glacial-interglacial isotopic changes are well-recorded, with heavier δ18O values at MIS 6 and 4 and the onset of MIS 5a and lighter values standing equally for MIS 5e and 5c, and relatively heavier for MIS 5a (Fig. 2A).
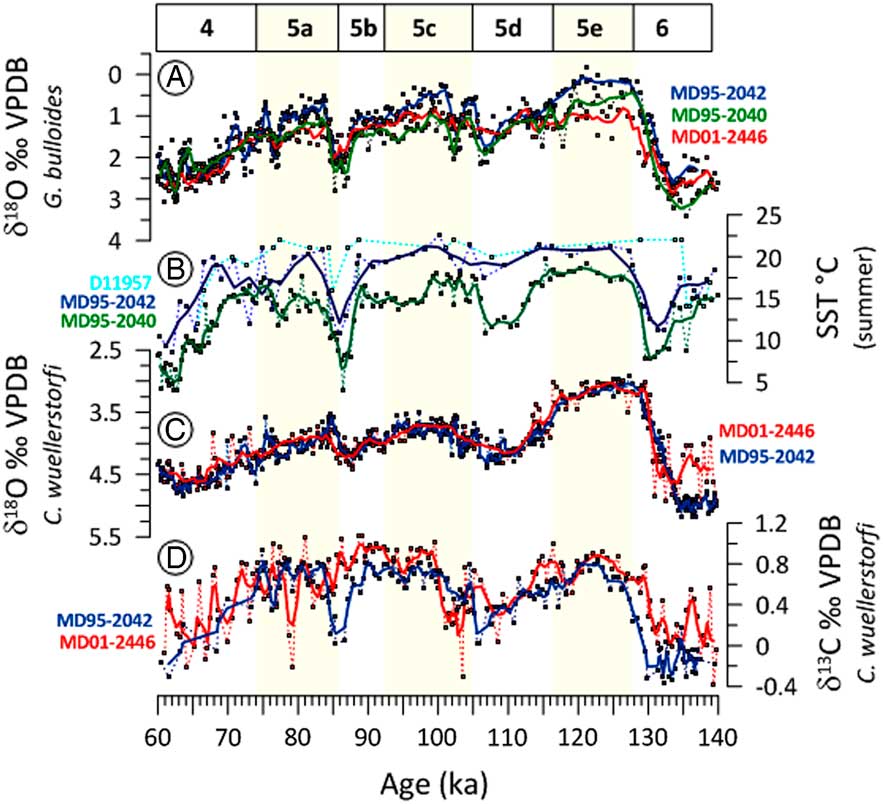
Figure 2 (color online) Surface and deep-water masses: offshore (MD01-2446 in red and D11957 in cyan) versus nearshore (MD95-2042 in blue and MD95-2040 in green) of the Iberian margin. (A) Planktonic δ18O (‰) VPDB (G. bulloides) from MD01-2446 (this study), MD95-2042 (Cayre et al., Reference Cayre, Lancelot, Vincent and Hall1999), and MD95-2042 (Abreu et al., Reference Abreu, Shackleton, Schönfeld, Hall and Chapman2003). (B) SST °C (summer) based on foraminifera Simmax Transfer Function of cores D11957 (Lebreiro et al., Reference Lebreiro, Moreno, Abrantes and Pflaumann1997), MD95-2042 (Cayre et al., Reference Cayre, Lancelot, Vincent and Hall1999), and MD95-2040 (Salgueiro et al., Reference Salgueiro, Voelker, de Abreu, Abrantes, Meggers and Wefer2010). (C) Benthic δ18O (‰) VPDB of cores MD01-2446 (red, this study) and MD95-2042 (blue, Shackleton et al., Reference Shackleton, Hall and Vincent2000). (D) Benthic δ13C (‰) VPDB record of cores MD01-2446 (red, this study) and MD95-2042 (blue; Shackleton et al., Reference Shackleton, Hall and Vincent2000). Bold lines for each curve indicate 3-point average smoothing. (For interpretation of the references to color in this figure legend, the reader is referred to the web version of this article.)
During warm phases (well-marked during MIS 5e), isotopic values are heavier offshore (D11957) than nearshore (MD95-2040 and MD95-2042; Fig. 2A). Oxygen isotopic differences between sites (north-south and east-west) are nearly negligible during glacial MIS 4, and sub-glacial stages MIS 5b and 5d (Fig. 2A).
Sea Surface Temperatures (SST) based on foraminifera (Table 1) show warmer temperatures offshore (D11957) than at the northern nearshore site MD95-2040 and more similar to the southern nearshore site MD95-2042 (Fig. 2B).
Deep-water masses
The benthic oxygen isotopic record (δ18O C. wuellerstorfi) from core MD01-2446 varies between 3 and 5‰ over the studied time interval, showing the typical glacial-interglacial variability (Fig. 2C). Compared to the previously published MD95-2042, benthic δ18O record (Table 1) values are very similar along MIS 5 but with marked lighter values during MIS 6 (Fig. 2C).
The comparison of benthic δ13C (an indirect indicator of deep-water ventilation; Curry and Oppo, Reference Curry and Oppo2005) between MD01-2446 and nearshore core MD95-2042, points to heavier δ13C values (nutrient-depleted) offshore, except during the short time intervals of 106–101 ka and 83–77 ka (Fig. 2D). This observation is reinforced by the similarity of the benthic δ13C with the 231Pa/230Th record, a proxy for AMOC export variability (Guihou et al., Reference Guihou, Pichat, Nave, Govin, Labeyrie, Michel and Waelbroeck2010), both obtained from core MD01-2446 (Fig. 3A–C, Table 1).
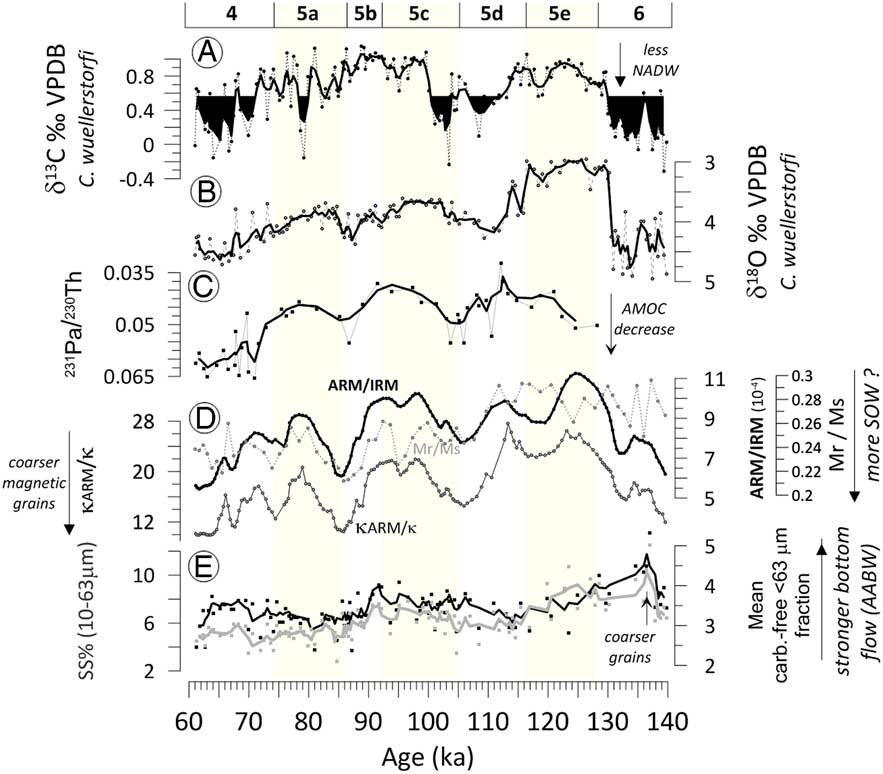
Figure 3 (color online) Core MD01-2446: (A) benthic δ13C record; (B) benthic δ18O record; (C) decay corrected excess sedimentary (231Pa/230Th) activity ratio (Guihou et al., Reference Guihou, Pichat, Nave, Govin, Labeyrie, Michel and Waelbroeck2010); bold line indicates 3-point average smoothing; (D) paleomagnetic data ARM/IRM, κARM/κ and Mr/Ms; (E) mean of the carbonate-free <63μm) is black colour (at right-axis), and SS% (percentage of sortable silt, i.e., % (10-63 μm) / <63 μm) is grey colour (at left-axis).
The ARM/IRM, κARM /κ and Mrs/Ms ratios, used to reconstruct past changes in the average magnetic grain size, indicate relatively coarser magnetic grains coincident with periods of depleted δ13C at MD01-2446 (Fig. 3D). The SS% and mean carb-free <63 μm, proxies for sorting and speed of bottom water (Supplementary Figure 2), show an enhanced and well-sorted deep current during MIS 6, MIS 4, and MIS 5b, but slower flow during MIS 5d and 5a and intermediate MIS 5e (Fig. 3E).
Continental input
Oxygen isotope ratios of bulk carbonate have been used as an efficient proxy for land transported detrital carbonate to the seafloor during periods of low sea-level stands (Lebreiro et al., Reference Lebreiro, Voelker, Vizcaino, Abrantes, Alt-Epping, Jung, Thouveny and Gràcia2009). Bulk oxygen isotopes of MD01-2446 show a long-term trend toward heavier values through MIS 5 consistent with the relative sea-level curve (Waelbroeck et al., Reference Waelbroeck, Labeyrie, Michel, Duplessy, McManus, Lambeck, Balbon and Labracherie2002), although the sub-stages of MIS 5 are not clearly defined (Fig. 4A and B).
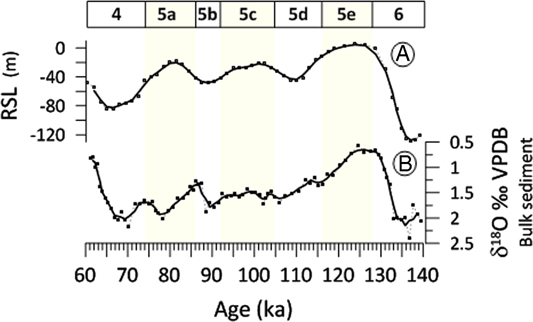
Figure 4 (color online) (A) Relative Sea Level Variation (RSL [m]) from Waelbroeck et al. (Reference Waelbroeck, Labeyrie, Michel, Duplessy, McManus, Lambeck, Balbon and Labracherie2002). (B) δ18O bulk sediment from core MD01-2446.
Paleoproductivity records
Paleoproductivity variations were estimated using several independent proxies like biogenic opal content, δ13C difference (G. bulloides-C. wuellerstorfi) , and organic carbon (Corg; Fig. 5A–D).
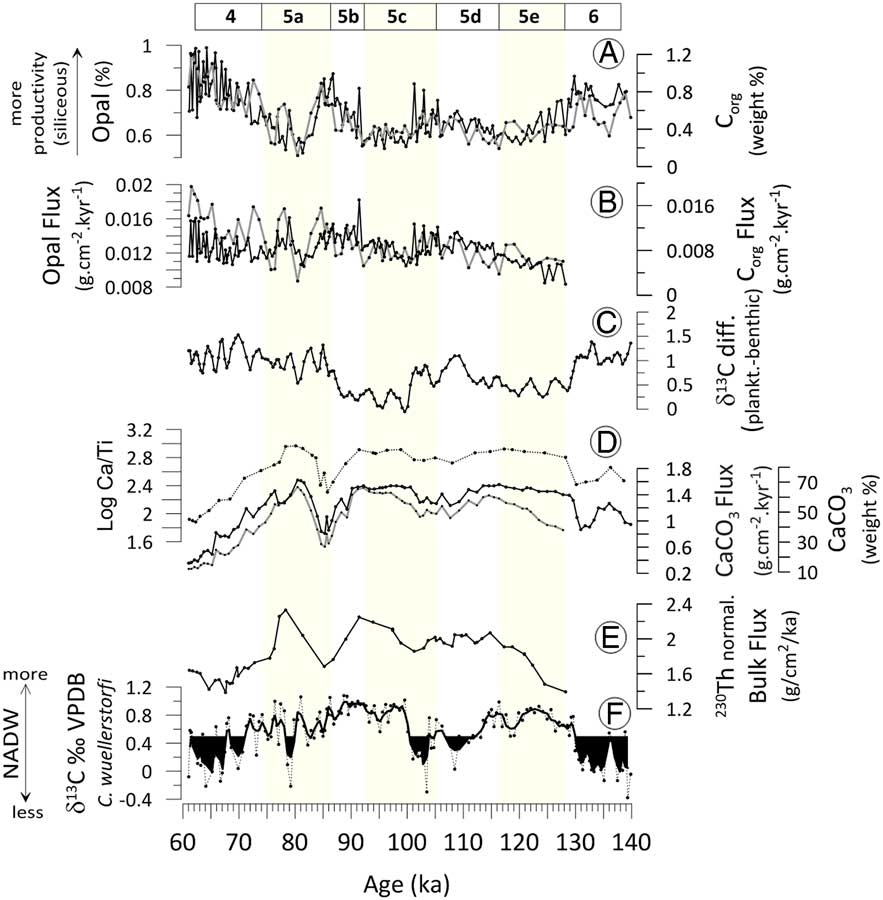
Figure 5 (color online) Productivity proxies from core MD01-2446. (A) Opal content (weight %). Right-side axes are the same parameter 230Th normalized flux (g.cm-2ka-1; bold line). (B) δ13C difference (G. bulloides - C. wuellerstorfi). (C) Organic carbon (weight %). (D) CaCO3 (weight %). Right-side axes are the same parameter 230Th normalized flux (g.cm-2ka-1; bold line). (E) 230Th normalized bulk flux (g.cm-2ka-1; Guihou et al., Reference Guihou, Pichat, Nave, Govin, Labeyrie, Michel and Waelbroeck2010). (F) Benthic δ13C record.
The opal content (%) from core MD01-2446 follows a glacial-interglacial and sub-millennial (transitions in sub-stages) variability, showing highest siliceous primary productivity mainly during cold periods, MIS 4 and 6, and during transitions MIS 5d to 5c and 5b to 5a (Fig. 5A).
In order to avoid biased interpretations of the opal % record commonly associated with sediment focusing, however, the 230Th-normalised opal fluxes (hereafter referred as opal flux) was also used. The opal flux undergoes a similar trend as the opal content (wt %), with larger differences at MIS 4 where, despite the increased opal %, enhancement of opal flux is not observed (Fig. 5A and B).
The difference between δ13C recorded in planktonic and benthic foraminifera has been long used as a useful indicator of deep-ocean carbon storage, and its variations may be explained by changes in the relative strength of export production (Broecker, Reference Broecker1982b; Shackleton et al., Reference Shackleton, Hall, Line and Cang1983; Olivier et al., Reference Oliver, Hoogakker, Crowhurst, Henderson, Rickaby, Edwards and Elderfield2010). δ13C difference (planktonic - benthic) from MD01-2446 presents general similar trend to opal % record (higher values during MIS 4 and 6, and during MIS 5d to 5c and 5b to 5a transitions; Fig. 5C). Moreover, the organic-carbon variability is also generally consistent with the opal content, albeit with higher variability, mainly from MIS 5b to 4 (Fig. 5A and B).
Log (Ca/Ti), which reflects relative changes of biogenic carbonate and detrital sediment (Hodell et al., 2015), resembles CaCO3 flux (Fig. 5D), presenting an inverse trend in comparison to paleoproductivity proxies (opal, Corg, and δ13C difference (planktonic - benthic)).
The correlation between productivity and δ13C was assessed by statistical analysis. The 230Th-normalised opal is not available for the last δ13C negative anomaly (MIS 6; Fig. 3 and 5), since bulk flux was not determined down the 621 cm core depth (age model ≥128 ka). For this reason, the correlation between opal (wt %) and δ13C was used (Supplementary Figure 4), after confirming that the correlation between opal and opal flux are statistically significant (Supplementary Figure 5).
The relationship between opal (wt %) and δ13C (Supplementary Figure 4), estimated through the Pearson correlation coefficient r for 152 samples, is moderate negative (r=0.52) and statistically significant (with a P value clearly below a significance level of α=0.001). This negative correlation confirms higher productivity coeval lower δ13C values (i.e., coeval with stronger influence of Southern Ocean waters).
The relationship between opal (wt %) and 230Th-normalised opal flux (Supplementary Figure 5), estimated through the Pearson correlation coefficient r for 144 samples, is moderate positive (r=0.55) and statistically significant (with a P value clearly below a significance level of α=0.001). Thus, mean to high values of 230Th-normalised opal flux are expected to coincide with the last observed δ13C negative anomaly (MIS 6; Fig. 3 and 5).
Note that opal and δ13C were generally analysed in different support samples (odd and even cm depths, respectively), coinciding for nine depth-samples only; this number of samples is generally not enough to measure the strength of a relationship, namely a trustful value for the Pearson correlation coefficient. The remaining opal values used to assess the relationship between opal and δ13C (152 - 9=143) have been estimated, with each value corresponding to the opal average of the previous and the following centimeter samples. This is likely to cause an underestimation of the actual Pearson correlation coefficient.
Discussion
Open ocean versus nearshore hydrographic conditions off Iberia
According to modern conditions in the North Atlantic, the classic temperature gradients of latitudinal sea surface migrate north-south on a seasonal basis and tilt northeast-southwest during summer and autumn (Supplementary Figure 4). This is reflected by summer SSTs that indicate similar temperatures in core MD95-2042 and MD01-2446 (Supplementary Figure 6). By contrast, during winters there is an increase in temperature gradients along an north-south transect but, in absence of upwelling, no east-west, i.e., nearshore-offshore, strong temperature gradient occurs (Supplementary Figure 6).
The δ18O G. bulloides record (Fig. 2A) is more representative of the spring conditions, as this is the dominant species during spring in this area (Lombard et al., Reference Lombard, Labeyrie, Michel, Bopp, Cortijo, Retailleau, Howa and Jorissen2011). In modern spring, the temperature and salinity differences between sites MD01-2446 and MD95-2040 have opposite effects on the calcite δ18O (Supplementary Figure 6). Since δ18O G. bulloides is similar at both sites during most of stage 5, it indicates that similar temperature and salinity gradients have prevailed on the long-term. On a shorter time-scale, the nearshore record (MD95-2040) indicates higher oxygen isotopic values than the offshore record at the end of MIS 5c, 5d–5c, and 5b–5a transitions. This could be due to the transient, southward migration of the polar front system, before it reaches a position south of the three sites, during stage MIS 5b and 4. This assumption is supported by the highest summer surface temperature at southern cores during those periods. Even though the Tore Seamount location is currently a subtropical region, the presence of polar (foraminifera) fauna during glacial stages 4 and 6 and during the 85 ka cold MIS 5b sub-stage (Fig. 6E) also confirms that this area is episodically part of the subpolar region (Lebreiro et al., Reference Lebreiro, Moreno, Abrantes and Pflaumann1997; Cayre et al., Reference Cayre, Lancelot, Vincent and Hall1999; Abreu et al., Reference Abreu, Shackleton, Schönfeld, Hall and Chapman2003) due to the southward migration of the polar frontal system. During most of stage 5e, the nearshore record of core MD95-2040 exhibits lighter oxygen isotopic values than the offshore MD01-2446 record, while summer SSTs are still lower nearshore than offshore. Unless a large change in seasonal temperature evolution had occurred, this particular trend may result from a salinity decrease at the nearshore site. This could be related to the increased annual precipitation in Northwest Iberia and its possible influence on the shelf area by river runoff (Sánchez Goñi et al., Reference Sanchez Goni, Loutre, Crucifix, Peyron, Santos, Duprat, Malaize, Turon and Peypouquet2005).
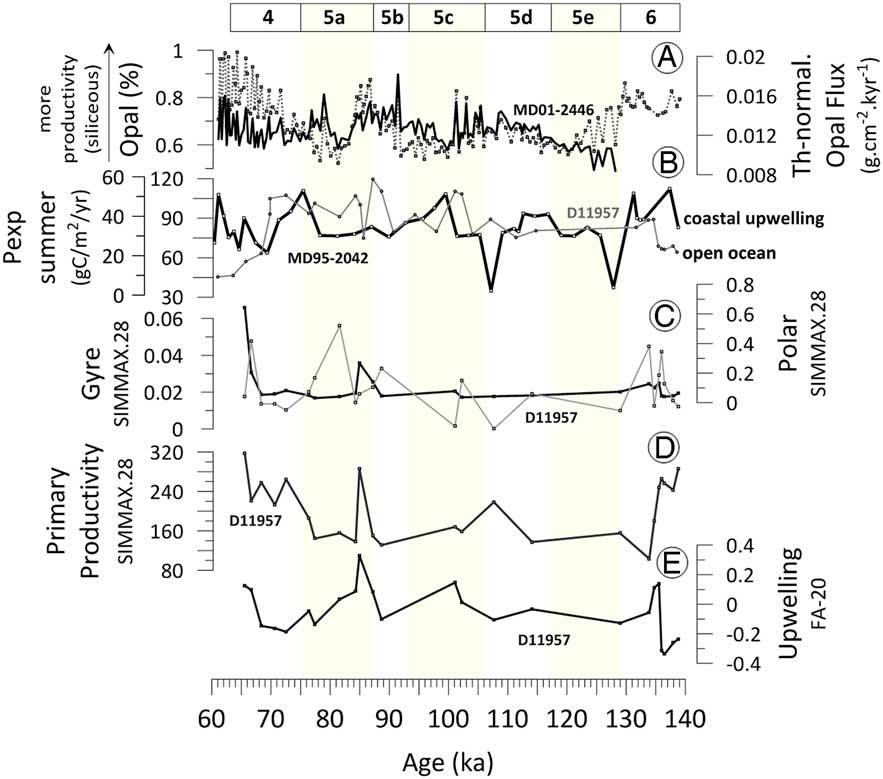
Figure 6 (color online) Open ocean eddy-pumping versus coastal upwelling productivity. (A) Opal content (weight %) and opal 230Th normalized flux (g.cm-2ka-1; thick line) from core MD01-2446. (B) Export Production (gC.m-2.yr-1) from core MD95-2042 (thick black line; Salgueiro et al., Reference Salgueiro, Voelker, de Abreu, Abrantes, Meggers and Wefer2010) and from core D11957 (grey thin line; Lebreiro et al., Reference Lebreiro, Moreno, Abrantes and Pflaumann1997). (C) Core D11957 (Lebreiro et al., Reference Lebreiro, Moreno, Abrantes and Pflaumann1997): Polar and Gyre (SIMMAX.28 Transfer Function). (D) Core D11957: Primary Productivity SIMMAX.28. (E) Core D11957 (Lebreiro et al., Reference Lebreiro, Moreno, Abrantes and Pflaumann1997): Upwelling (SIMMAX.28). SST, Sea Surface Temperatures; PP, Paleoproductivity; FA20, factors (polar, gyre, and upwelling) were estimated through the transfer function SIMMAX28, based on modern analogues (Modern Analogue Technique using a similarity index). For more details see Pflaumann et al. (Reference Pflaumann, Duprat, Pujol and Labeyrie1996, Reference Pflaumann, Sarnthein, Chapman, d’Abreu, Funnell, Huels and Kiefer2003) and Lebreiro et al. (Reference Lebreiro, Moreno, Abrantes and Pflaumann1997).
The oxygen isotopic planktonic difference between the south nearshore MD95-2042 site and offshore site during sub-stage MIS 5e, as well 5c and 5a (Fig. 2B), is larger than expected from the present spring temperature and salinity differences between the two sites (Supplementary Figure 7). It therefore implies a larger winter and spring temperature gradient between the two sites, potentially corresponding to a northward placement of the Azores front compared to its modern spring position.
Concerning the deep ocean, grain-size trends are the result of sediment transport and deposition processes. At depth, variations of the grain size in the sortable silt range have been used to infer the dynamic of near-bottom paleo-current strength (McCave et al., Reference McCave, Manighetti and Robinson1995; Bianchi et al., Reference Bianchi, Hall, McCave and Joseph1999; Hall and McCave, Reference Hall and McCave2000; McCave and Hall, Reference McCave and Hall2006; McCave et al., Reference McCave, Thornalley and Hall2017).
We observe a trend of higher mean carbonate-free <63 μm grain size and %SS in MD01-2446 indicating stronger deep-water currents during MIS 6 and 4 and sub-stadial 5b, together with early interstadial 5e (Fig. 3E). Hall and McCave (Reference Hall and McCave2000) reported high sortable silt (S̅S̅) at ~2465 m in MD95-2040 on the Portuguese margin during warmer sub-stages of MIS 5, as a result of faster southern flow of the NEADW paleo-current. The apparently opposed dominant speed during glacials in MD01-2446 can only be explained if the grain-size parameters are recording a northward bottom (~3500 m) flow at the Tore slope, which we link with AABW (Adkins et al., Reference Adkins, Ingersoll and Pasquero2005). This scenario is coherent with the observed variation of depleted δ13C benthic traces of the AABW (Fig. 3A and E).
On the other hand, the magnetic grain-size parameters suggest efficient transport of detrital magnetite by bottom-water flow (corresponding to coarser magnetic grains) during periods of low benthic δ13C (mainly MIS 4 and MIS 6, but also at warming transition 5d–c; Fig. 3A–D). As it has been widely reported for the North Atlantic, NADW production was weaker and slower during these periods, (e.g., Michel et al., Reference Michel, Labeyrie, Duplessy, Gorfti, Labracherie and Turon1995; Shackleton et al., Reference Shackleton, Hall and Vincent2000; Kissel, Reference Kissel2005) despite increased production above 2000 m depth of Glacial North Atlantic intermediate waters (Michel et al., Reference Michel, Labeyrie, Duplessy, Gorfti, Labracherie and Turon1995; Shackleton et al., Reference Shackleton, Hall and Vincent2000; Guihou et al., Reference Guihou, Pichat, Govin, Nave, Michel, Duplessy, Telouk and Labeyrie2011). As a result, the magnetic data appear to selectively illustrate (sub)orbital variability associated with a southern bottom water at 3500 mwd in the Eastern Atlantic Margin, seen at MD01-2446. The volcanic Canary Islands and/or Cape Verde Islands might be the source of these magnetic grains, commonly Fe-Ti in oxides and silicates.
Channell et al. (Reference Channell, Hodell, Margari, Skinner, Tzedakis and Kesler2013) report bacterial magnetite on two cores onshore at the southwest Iberian margin (MD01-2443 and MD01-2444) varying on stadial-interstadial timescales, similarly to our data. The detrital/biogenic magnetite ratio increased with hematite concentration together with coarser magnetites during stadials and glacial isotopic stages. The cores from Channell et al. (Reference Channell, Hodell, Margari, Skinner, Tzedakis and Kesler2013), however, are located at the Iberian margin at 2600-2900 mwd, where a lot of detrital carbonate could have originated from the continental margin (Lebreiro et al., Reference Lebreiro, Voelker, Vizcaino, Abrantes, Alt-Epping, Jung, Thouveny and Gràcia2009), whereas core MD01-2446 is a deeper core (3547 mwd) and out of the Iberian margin influence.
Another hypothesis supporting the magnetic signal of this region was recently raised by Yamazaki and Ikehara (Reference Yamazaki and Ikehara2012), in which the resemblance of the pattern of the SUSAS stack in the subtropical Atlantic with dust records from Antarctic ice cores (Schmieder et al., Reference Schmieder, von Dobeneck and Bleil2000) would be explained by the redistribution to the subtropical Atlantic of biogenic magnetites produced in circum-Antarctic Ocean sediments under iron fertilization by bottom-water currents (Yamazaki and Ikehara, Reference Yamazaki and Ikehara2012).
Whatever the source of the magnetite particles, the two grain-size data sets converge if the mineralogical components of coarse magnetic size are contained in the silt grain-size fractions transported a long way, northward by bottom currents.
Taking into account the multi-proxy approach presented in our study, our preferred interpretation is that the coarse magnetic grain size at site MD01-2446 likely records the northward SOW bottom current during colder periods (more SOW influence at these latitudes), also coinciding with periods of lighter δ13C (less contribution of NADW) and lower 231Pa/230Th values. In fact, our record reveals that warmer periods of weaker influence of SOW correspond to southward intensification of NEADW.
In any case, further investigations are needed to test the potential of magnetic grain size as a proxy for northwards SOW deep current in the Eastern North Atlantic as far from the coast as the Tore Seamount.
Source of nutrients sustaining paleoproductivity in oligotrophic areas
A paleoproductivity signal consistent with glacial-interglacial climate variability is observed at orbital timescales in the Tore Seamount region. The main question to be addressed is the origin of the nutrients supporting this oceanic productivity.
Given the geographic location and water depth (about 3500 m) of the studied core, we do not expect any contribution from sediments transported across the Tagus abyssal plain upslope to the Tore Seamount by bottom currents (Fig. 1).
Two main alternative sources are therefore possible: (1) sinking material from coastal advection by means of offshore extension of filaments associated with coastal upwelling, similar to what has been observed in nearby southward regions (Arístegui et al., Reference Arístegui, Álvarez-Salgado, Barton, Figueiras, Hernández-León, Roy and Santos2004); and (2) local offshore productivity generated by mesoscale eddy activity at the North Atlantic Subtropical Gyre. The relative changes in the contribution of both sources may also constitute an additional and possible scenario.
Lighter δ18O values of bulk sediment in the nearshore Iberian margin, core MD03-2698 (Lebreiro et al., Reference Lebreiro, Voelker, Vizcaino, Abrantes, Alt-Epping, Jung, Thouveny and Gràcia2009), are associated with enhanced continental carbonate input during periods of low sea level (colder periods). These inputs should also imply a greater nutrient transport from continental-sourced material (Broecker, Reference Broecker1982; Filippelli et al., Reference Filippelli, Latimer, Murray and Flores2007) by lateral advection of surface waters to the ocean realm. Interestingly, the offshore bulk δ18O copies the planktonic foraminifera δ18O with lighter values during warm periods (Fig. 4), as opposed to coastal core MD03-2698 (Lebreiro et al., Reference Lebreiro, Voelker, Vizcaino, Abrantes, Alt-Epping, Jung, Thouveny and Gràcia2009). This suggests that the bulk δ18O is a proxy limited to continental input at nearshore regions, and that the Tore Seamount record is out of major continental influence.
Enhanced diatom production in regions such as the tropical Atlantic has been attributed to be driven by enhanced wind-driven upwelling or density-driven vertical mixing, or by elevated thermocline concentrations of silicic acid supplied to the surface at a constant rate (e.g., Bradtmiller et al. Reference Bradtmiller, McGee, Awalt, Evers, Yerxa, Kinsley and deMenocal2016; Hendry et al., Reference Hendry, Gong, Knorr, Pike and Hall2016).
The location of core MD01-2446 is beyond the 50 km extension of coastal upwelling influence (Fiúza, Reference Fiúza1983), where current seasonal filaments rarely extends 150–200 km offshore (Sousa and Bricaud, Reference Sousa and Bricaud1992). Considering that, during cold phases of MIS 5 and during MIS 4 and MIS 6, the sea level was lower than today (-40 m during cold phases of MIS 5, and about -80 and -120 m during MIS 4 and MIS 6, respectively), the seasonal filaments would reach further offshore during the low-stand sea level than at present scenario. Considering the position of the isobath of -120 m, the filaments could reach about 30 km further offshore but, still, that would put the site out of the reach of the filaments. Although it has been suggested that filament activity is likely intensified by stronger trade winds during cold glacial periods (Lebreiro et al., Reference Lebreiro, Moreno, Abrantes and Pflaumann1997), considering a far reach of 200 km offshore, during a sea level stand of -120m, their contribution to the studied site would not be significant. Therefore, seasonal filaments do not support, by itself, the overall offshore productivity.
Consequently, to explain the overall productivity at the offshore site we propose local sources of nutrients generated by the upper-ocean mesoscale eddy activity (Supplementary Figure 1; Lévy, Reference Lévy2003; Dufois et al., Reference Dufois, Hardman-Mountford, Greenwood, Richardson, Feng and Matear2016). This is consistent with the growing body of evidences accumulated over the last decade pointing toward a significant primary productivity in oligotrophic areas (McGillicuddy et al., Reference McGillicuddy, Robinson, Siegel, Jannasch, Johnson, Dickey, McNeil, Michaels and Knap1998; Oschlies and Garcon, Reference Oschlies and Garcon1998; Williams and Follows, Reference Williams and Follows1998; Oschlies, Reference Oschlies2002; McGillicuddy et al., Reference McGillicuddy, Anderson, Bates, Bibby, Buesseler, Carlson and Davis2007; Incarbona et al., Reference Incarbona, Martrat, Stefano, Grimalt, Pelosi, Patti and Tranchida2010; Williams, Reference Williams2011).
Though mesoscale eddies have been shown to be sites of higher nutrient levels and/or biological productivity in the mixed layer compared with the surrounding waters in the ocean, our multi-proxy study, integrating time and space, is strong evidence that oceanic paleoproductivity variation (likely related to sub-mesoscale driven vertical nutrient fluxes) echoes that of glacial-interglacial climate variability, in strong agreement particularly with the benthic δ13C and 231Pa/230Th records (Fig. 5A and C).
The higher contribution of nutrient-rich Antarctic Intermediate Water (AAIW) type southern-sourced waters and the state of a deeper upper-mixed layer during cold periods would enrich the nutrient supply to the photic zone, favouring enhanced productivity in the Tore Seamount region.
As recently documented, biogenic opal export at low latitudes is likely to rely on silicate from the underlying thermocline, the concentration of which is related with the circulation of the ocean interior (Meckler et al., Reference Meckler, Sigman, Gibson, Francois, Martinez-Garcia, Jaccard, Rohl, Peterson, Tiedemann and Haug2013). Pronounced opal maxima during each glacial termination over the past 550,000 years were reported off northwest Africa (Meckler et al., Reference Meckler, Sigman, Gibson, Francois, Martinez-Garcia, Jaccard, Rohl, Peterson, Tiedemann and Haug2013), during times of a consistent strong deglacial reduction in the formation of silicate-poor glacial North Atlantic intermediate water (GNAIW). Even though Meckler et al. (Reference Meckler, Sigman, Gibson, Francois, Martinez-Garcia, Jaccard, Rohl, Peterson, Tiedemann and Haug2013) focus on a coastal upwelling system, where productivity is dependent of nutrients reaching the surface due to upwelled waters related to trade winds intensification, the concentration of silicate at ocean interior would be favourable to increased productivity also at oligothrophic regions if sub-mesoscale driven vertical nutrient fluxes occur. This enhanced productivity at glacial terminations was documented reaching latitudes at the Iberian margin, northwards of Tore Seamount position, as evidenced by the diatom and barium records from core MD95-2039 (Thomson et al., Reference Thomson, Nixon, Summerhayes, Rohling, Schönfeld, Zahn, Zahn, Abrantes, Gaspar and Vaqueiro2000).
Enhanced northward advection of AAIW during periods of reduced North Atlantic overturning circulation has also been recently documented (Rickaby and Elderfield, Reference Rickaby and Elderfield2005; Pahnke et al., Reference Pahnke, Goldstein and Hemming2008). Increased nutrient supply via intermediate water masses feeding into the thermocline has been suggested to explain the observed opal changes in the Eastern Atlantic (Meckler et al., Reference Meckler, Sigman, Gibson, Francois, Martinez-Garcia, Jaccard, Rohl, Peterson, Tiedemann and Haug2013), which are consistent with Si isotope distribution patterns from several Atlantic sediment cores (Hendry et al., Reference Hendry, Gong, Knorr, Pike and Hall2016).
In parallel, our data reveals that, at the eastern North Atlantic, periods of weakened NADW formation (lighter benthic δ13C) are coeval with higher productivity, suggesting a close relationship between oceanic productivity and resumption of Southern Ocean waters (Fig. 5; Supplementary Figure 4).
This relationship was previously suggested through simulations with a coupled climate-ecosystem model of intermediate complexity, revealing that global ocean productivity is sensitive to changes in the AMOC (Schmittner, Reference Schmittner2005) during periods of abrupt climatic changes (at millennial timescales).
In the context of our dataset, the coupling between δ13C and productivity records could be compromised by a circular issue effect, given that the δ13C spreading of dissolved inorganic carbon is primarily dependent on the interaction of biological uptake at the sea surface. As confirmed for the Canary Islands region, however, the benthic foraminifera mean δ13C values of C. wuellerstorfi are not influenced by sustained high organic-matter fluxes, validating this species as a reliable recorder of bottom-water δ13C (Eberwein and Mackensen, Reference Eberwein and Mackensen2006). A factual affiliation between oceanic productivity changes and AMOC can thus be assumed.
We therefore suggest that, besides the upwelling intensity, the presence of southern sourced silica-rich waters plays a major role in the low-latitude biological productivity record as an important source of nutrients. The deep NADW is slightly reduced during cold sub-stages of MIS 5 but the intermediate water formation (down to 2000 m depth) is greatly enhanced during cold sub-stages (Guihou et al., Reference Guihou, Pichat, Govin, Nave, Michel, Duplessy, Telouk and Labeyrie2011).
The 85 ka and 105 ka productivity events: oceanic nutrient supply
The benthic δ13C record show lower values during millennial warming transitions MIS 5d to 5c and, to a lesser extent, MIS 5b to 5a (Fig. 3A). These nutrient-enriched periods are mostly coeval with higher 231Pa/230Th values, illustrating weakening of the AMOC export at MIS 5d to 5c and at MIS 5b to 5a transitions (Guihou et al., Reference Guihou, Pichat, Nave, Govin, Labeyrie, Michel and Waelbroeck2010; Guihou et al., Reference Guihou, Pichat, Govin, Nave, Michel, Duplessy, Telouk and Labeyrie2011). Intensification of offshore productivity is well-marked by different proxies, such as high opal content, δ13C difference (planktonic-benthic), and organic-carbon content at the same periods (Fig. 5A–D). It is also supported by the productivity foraminifera-based SIMMAX.28 (Fig. 6B–E), pointing to rapid and significant environmental changes.
Primary productivity (Fig. 6D), reflected in export production at the open ocean site, is different from that at the nearshore sites (Fig. 6B). This disparity illustrates the development of high nutrient levels in coastal zone waters compared to the offshore (oceanic) areas, where its direct influence decreases. Similar records in both sites would imply an influence from terrestrial input or erosion from sea level lowering toward an echo paleoproductivity but with much lower magnitude at the open ocean environment (Thomson et al., Reference Thomson, Nixon, Summerhayes, Rohling, Schönfeld, Zahn, Zahn, Abrantes, Gaspar and Vaqueiro2000). The disparity between the two sites, therefore, sustains productivity originating from the open ocean.
As shown in a more detailed view of the time sequences of events off Iberia over the last climate cycle, cold SST episodes after relatively warm and largely ice-free periods occurred when the predominance changed from northern deep waters (NADW) to southern (AABW; Martrat et al., Reference Martrat, Grimalt, Shackleton, de Abreu, Hutterli and Stocker2007). The different origin of bottom waters is likely to be reflected on the surface record, not only on SST but also on productivity, as is suggested by the coeval times of 85 and 105 ka productivity events and GS-22 and GS-24 (Martrat et al., Reference Martrat, Grimalt, Shackleton, de Abreu, Hutterli and Stocker2007). The similar pattern of the various proxies responding to hydrography and productivity variations is very consistent for the analysed period. Therefore, the harmony of the records reflecting the ocean dynamics and underlying biomass seems to point to a coupling between oceanic productivity and the SOW.
Conclusions
Interglacial conditions of MIS 5 are compared to glacial stages MIS 4 and MIS 6 of higher productivity, in areas under the potential influence of a coastal upwelling regime (Pailler and Bard, Reference Pailler and Bard2002; Salgueiro et al., Reference Salgueiro, Voelker, de Abreu, Abrantes, Meggers and Wefer2010). Site MD01-2446 shows higher nutrient supply during Termination II, MIS 4, MIS 6, and warming transitions of the MIS 5 sub-stages. The highest nutrient content (higher productivity) is in phase with tracers of deep-water ventilation variations (benthic δ13C and 231Pa/230Th), and therefore establishes evidence of the coupling between productivity variations and the SOW.
The paleoproductivity record explained mainly by the variability of the sub-mesoscale driven vertical nutrient fluxes is in agreement with benthic δ13C and 231Pa/230Th. Periods of low benthic δ13C and high 231Pa/230Th (less NADW formation, more GNAIW, and potentially AAIW and/or mode waters formation) during warming transitions of MIS 5 sub-stages, which are coeval with higher productivity, suggest a link between oceanic productivity changes and the AMOC.
If such a link exists, as suggested by the data, it highlights the potential role of the subtropical Atlantic Ocean in the ocean biological carbon pump, over (sub-) glacial-interglacial time scales.
Changes of coarse magnetic grain size in the sediment, combined with enhanced mean carb-free <63 μm and SS%, suggests a distinct source of bottom flow. Coarse magnetic grains are concentrated in silt grain size, and Ti, Fe, and K are mainly adsorbed into clays, thus probably recording the long-distance transport and deposition of sediments during colder periods by the northward SOW current. Both parameters are signs of the dynamics of the bottom current flow and its pathway.
From the Tore Seamount comparison to Iberian nearshore environments (cores MD95-2042 and MD95-2040), a relationship between offshore and overturning circulation is proposed, raising the need of increasing the number of studies on paleoproductivity variations in oligotrophic areas in future research.
ACKNOWLEDGMENTS
This research was funded by AMOCINT project (ESF-EUROCORES programme, 06-EuroMARC-FP-008, through FCT EUROMARC/0002/2007). The British Ocean Sediment Core Repository (BOSCOR) is acknowledged for supplying the sediment samples, through G. Rothwell, and sampling help of L. de Abreu and B. Alker. F. Dewilde is acknowledged for performing the stable oxygen and carbon isotopic analyses and C. Wandres for helping with the measurements of the magnetic parameters. Laboratory technical assistance in the LNEG was done by L. Matos (opal), C. Monteiro and D. Ferreira (CHNS), and W. Soares (Sedigraph). R. Mortlock is acknowledged for the support in establishing the methodology for biogenic opal determination at LNEG laboratory and E. Salgueiro for the calculations of export production (gC.m-2.yr-1) on core D11957. We thank Dr. L. Bradtmiller, Prof. L. Owen, and two anonymous reviewers for their valuable contributions, which greatly improved the quality of the manuscript.
SUPPLEMENTARY MATERIAL
To view supplementary material for this article, please visit https://doi.org/10.1017/qua.2018.88


