


INTRODUCTION
Skeletal remains recovered from the regurgitated pellets of avian predators have long been used to reconstruct the composition of past and present small mammal communities (e.g., Andrews and Cook, Reference Andrews and Cook1990; Hadly, Reference Hadly1999; Avery, Reference Avery2002; de la Peña et al., Reference de la Peña, Butet, Delettre, Paillat, Morant, Le Du and Burel2003; Lyman and Lyman, Reference Lyman and Lyman2003; Torre et al., Reference Torre, Arrizabalaga and Flaquer2004; Terry, Reference Terry2010a, Reference Terryb; Heisler et al., Reference Heisler, Somers and Poulin2016; Stegner, Reference Stegner2016). A vast richness of Quaternary fossil data has been extracted from paleontological sites where long-term pellet accumulation was the primary means of bone deposition, as in many cave localities (e.g., Andrews and Cook, Reference Andrews and Cook1990; Hadly, Reference Hadly1996, Reference Hadly1999; Avery, Reference Avery2002; Terry, Reference Terry2010a, Reference Terryb). The small mammal records from these sites have been invaluable in assessing environmental and ecological change over time (e.g., Hadly, Reference Hadly1999). Neontologists also use raptor pellets to non-invasively and efficiently sample modern small mammal diversity (e.g., de la Peña et al., Reference de la Peña, Butet, Delettre, Paillat, Morant, Le Du and Burel2003; Lyman and Lyman, Reference Lyman and Lyman2003; Torre et al., Reference Torre, Arrizabalaga and Flaquer2004; Heisler et al., Reference Heisler, Somers and Poulin2016). At the core of both of these methods is the assumption that raptors eat and regurgitate small mammals in proportion to their local abundances.
However, bones from pellets are also used to study raptor dietary preference (e.g., Errington, Reference Errington1930; Marti, Reference Marti1974; Andrews and Cook, Reference Andrews and Cook1990; Salamolard et al., Reference Salamolard, Butet, Leroux and Bretagnolle2000; Granjon and Traoré, Reference Granjon and Traoré2007). While small mammal bones from raptor pellets must be at least partially reflective of both local small mammal community composition and raptor dietary preference, it is unclear which plays a larger role. This has implications for the long-held tradition of using Quaternary pellet accumulations to reconstruct past communities. If raptors show strong dietary preference towards particular small mammal species, fossil sites may be affected by biased sampling and thus may not well represent local habitats.
Do small mammal remains in raptor pellets more closely reflect the dietary preference of the raptor accumulator or the local small mammal community? Previous studies have assessed individual or pairs of raptor species for their utility in small mammal studies (Yom-Tov and Wool, Reference Yom-Tov and Wool1997; Balčiauskienė, Reference Balčiauskienė2005; Granjon and Traoré, Reference Granjon and Traoré2007; Scheibler and Christoff, Reference Scheibler and Christoff2007; Matos et al., Reference Matos, Alves, Pereira, Torres, Marques and Fonseca2015; Heisler et al., Reference Heisler, Somers and Poulin2016). For example, previous work has shown that barn owls (Tyto alba) sample small mammals in proportion to their true abundances in the landscape, and their pellets are therefore appropriate targets for small mammal community studies (Yom-Tov and Wool, Reference Yom-Tov and Wool1997; Granjon and Traoré, Reference Granjon and Traoré2007). However, there are two issues with targeting single raptor species in such studies. First, without testing the fidelity of other raptor species, we cannot confidently use their pellets for community reconstruction, which vastly limits the localities that can be studied. Second, relying on particular raptor species necessitates positively identifying the pellet producer before incorporating pellet data into a study, which is especially difficult for older, weathered pellets. This is a problem for neontologists because it is not uncommon for multiple raptors to use the same roost in open areas where roost choice is limited. For paleontologists, whose sites may have been deposited by multiple raptor species, either simultaneously or with turnover through time, determining accumulator identity is particularly challenging. If the identification of the pellet producers is not important, however, reconstruction of habitat using pellets (both at modern communal roosts and in fossil assemblages) can be interpreted with greater confidence.
Previous evaluations of raptor sampling fidelity have been conducted by comparing bones from raptor pellets to live-trapping data, yet live-trapping is itself a biased collection method (O'Farrell et al., Reference O'Farrell, Clark, Emmerson, Juarez, Kay, O'Farrell and Goodlett1994; Hadly, Reference Hadly1999; Torre et al., Reference Torre, Arrizabalaga and Flaquer2004). Here, we instead test whether the small mammal communities reconstructed from pellets are more similar across different sites within raptor species, or within the same foraging area across multiple raptor species. Our study assesses whether raptors in the same locality consume similar small mammal species in similar abundances, or whether they more closely represent the dietary preference of a given raptor species.
Using skeletal elements identified from pellets across multiple sites in the same ecosystem, we address the question: Do accumulations of raptor pellets tell us more about the raptor or its environment? If the included raptors have strong dietary preferences, we expect to find similar diets within the same raptor species across different sites. If instead they eat what is locally abundant, different raptor species at the same site should have similar diets, and diets should differ between sites regardless of raptor identity.
MATERIALS AND METHODS
Pellets were collected in 1998–1999 from four study sites in, or just outside of, Yellowstone National Park (YNP), Wyoming, USA (Craighead, Reference Craighead2000). We analyzed pellets from multiple nocturnal and diurnal avian predator species: great horned owls (Bubo virginianus), short-eared owls (Asio flammeus), long-eared owls (Asio otus), red-tailed hawks (Buteo jamaicensis), Swainson's hawks (Buteo swainsoni), and common ravens (Corvus corax). Although ravens are not raptors, in this study we grouped them with raptors (and use the term inclusively) because they also eat vertebrate prey and regurgitate bones in pellets.
Study area
Yellowstone National Park (YNP) is located in the northern Rocky Mountains, spanning 8,892 km2 of Wyoming, Idaho, and Montana. Habitats include sagebrush steppe, aspen woodland, thermal flats, willow-sedge riparian, meadow, alpine tundra, and forest, with varying dominant tree species, including Douglas fir (Pseudotsuga menziesii), lodgepole pine (Pinus contorta), whitebark pine (P. albicaulis), and spruce-fir (Picea engelmannii and Abies lasiocarpa) (Streubel, Reference Streubel1989). Four study sites (Gardiner, Lamar, Hayden Valley, and Old Faithful) were selected representing differences in habitat type, annual precipitation, and mean elevation (Fig. 1; Table 1). The species pool of small mammals is similar at each study site since they are all within the Greater Yellowstone Ecosystem (GYE). However, the sites differ in terms of the various environmental variables (precipitation, elevation, etc.) that control habitat differences at a finer spatial scale (Fig. 1; Table 1), and we therefore expect the proportional abundances of small mammal species to differ between sites. We evaluated the expected taxa of the four study sites using the GYE species pool and characteristic species for each habitat type. Small mammal habitat associations in the GYE were identified using Streubel (Reference Streubel1989).
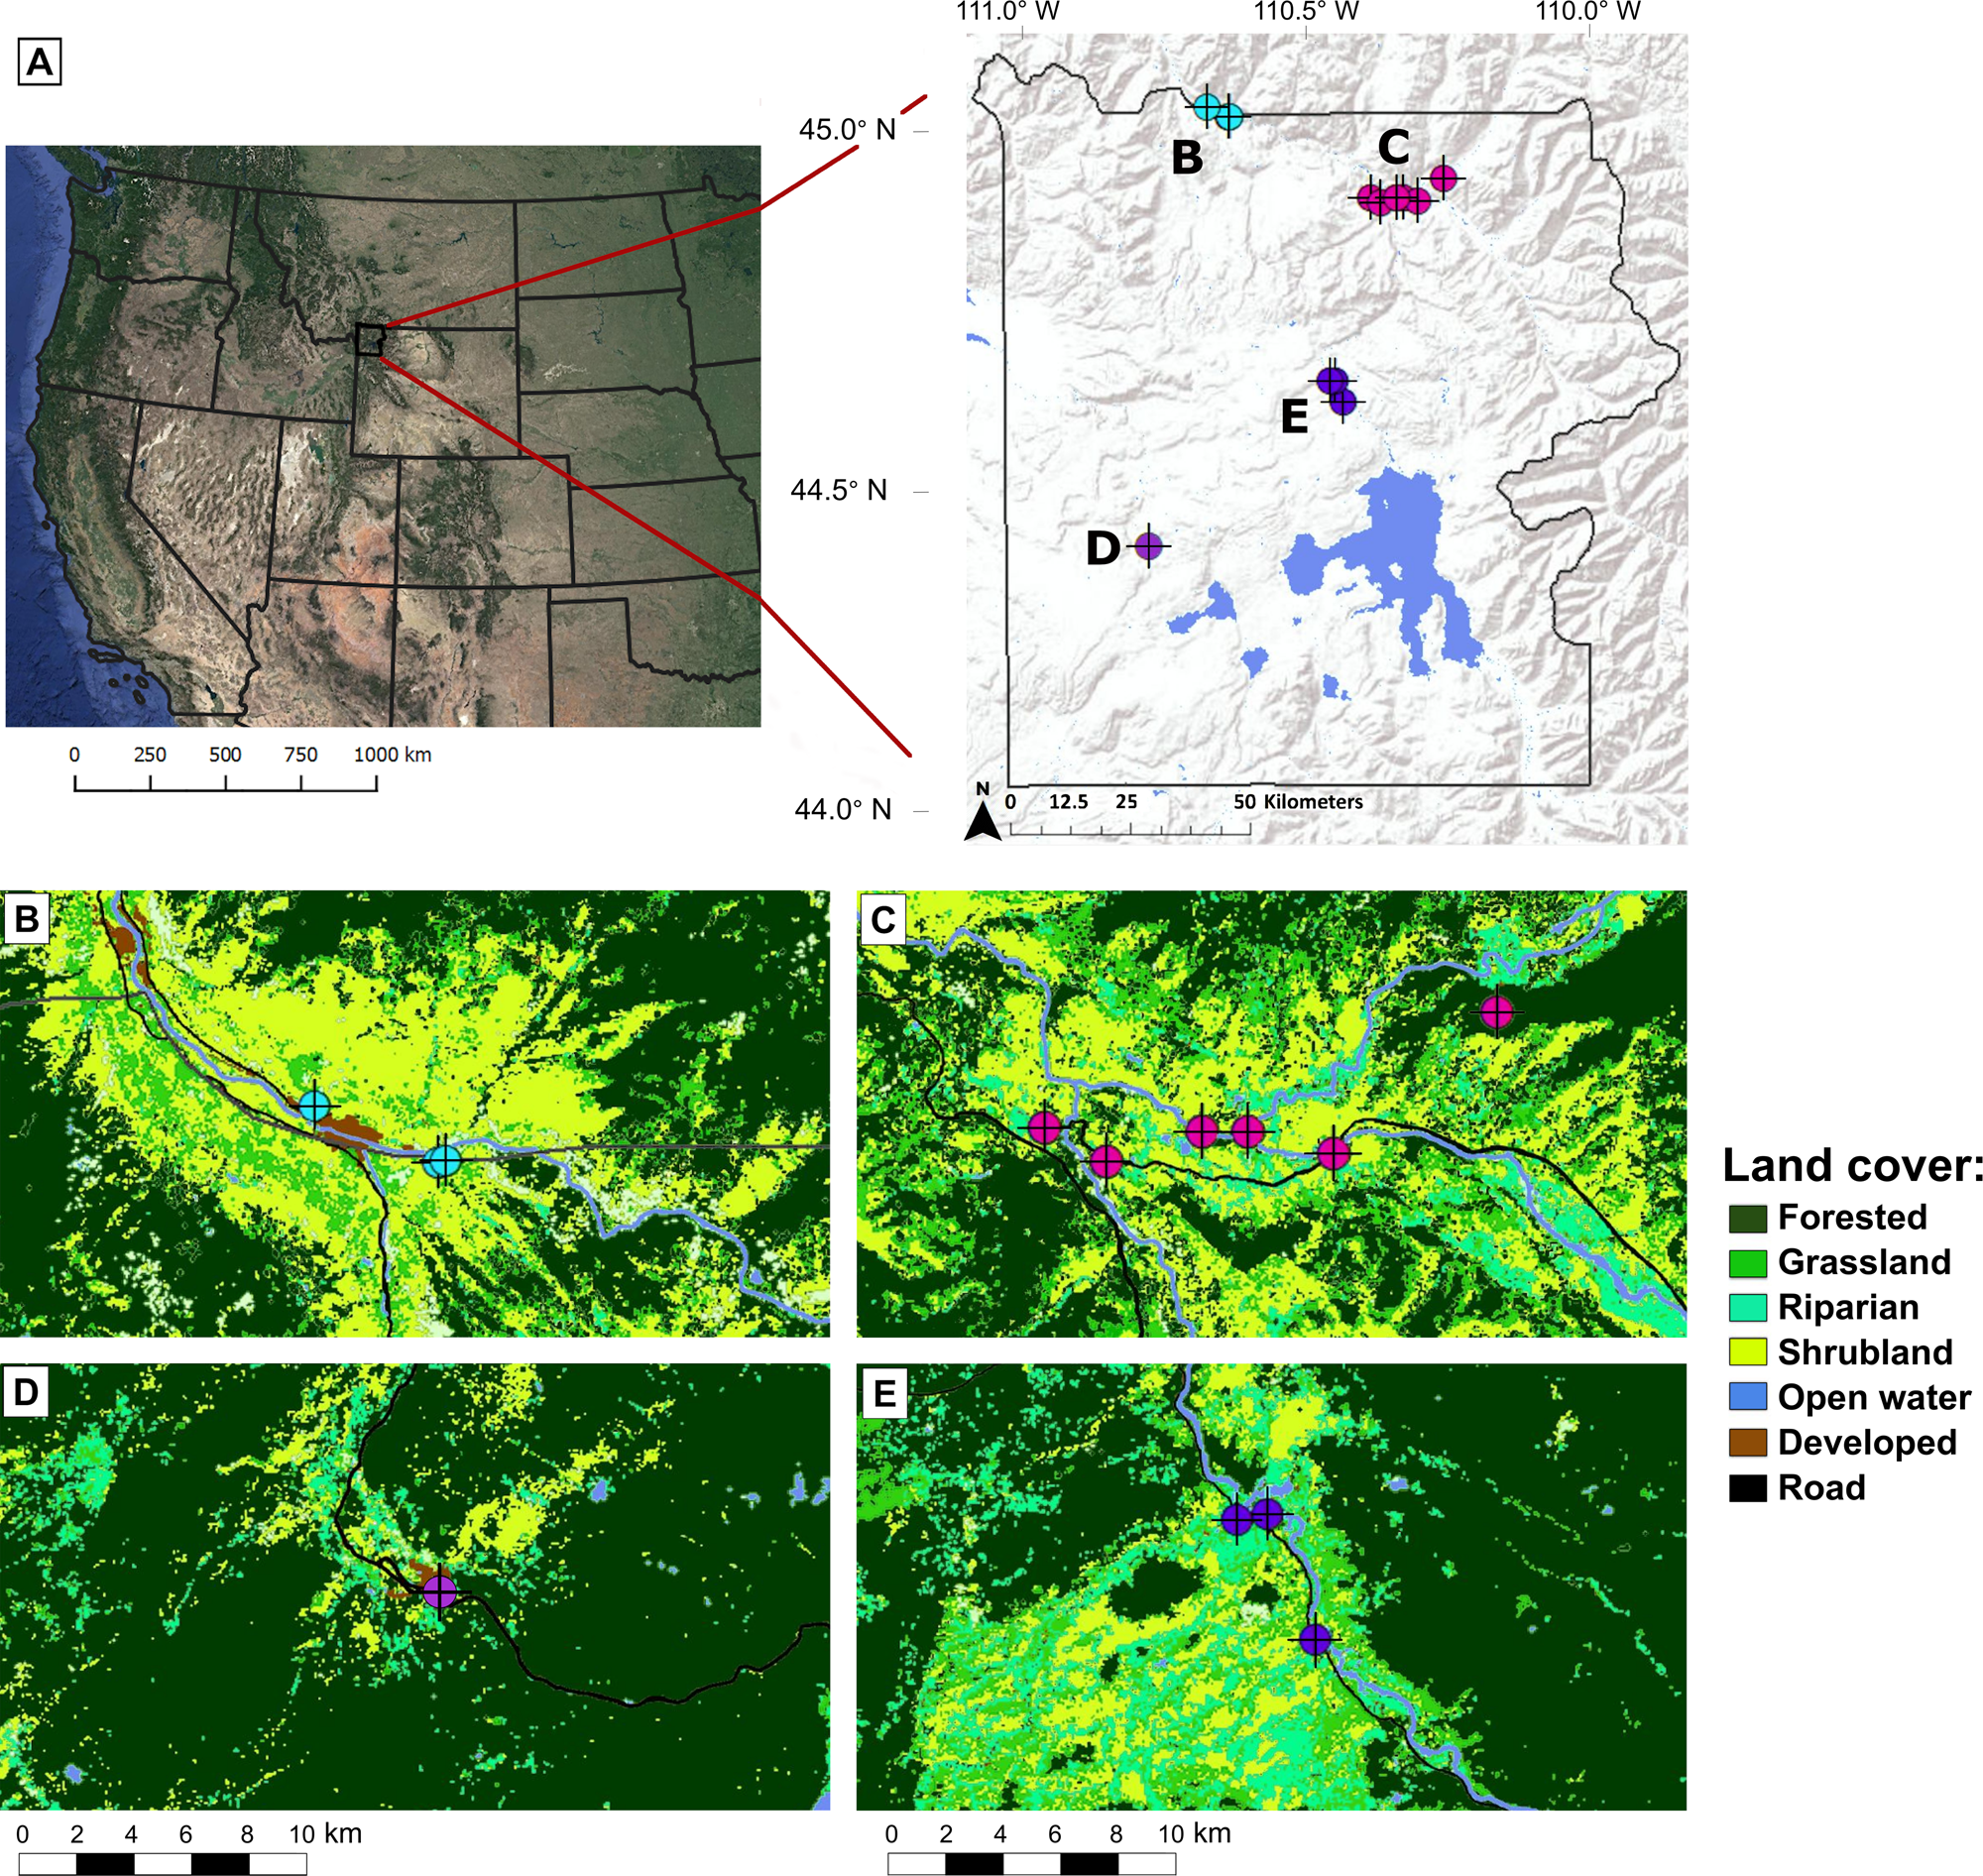
Figure 1. (A) Maps showing the position of Yellowstone National Park within the Western United States and the locations of pellet collection sites included in the study. (B–E) Land cover maps of the Gardiner (B), Lamar (C), Old Faithful (D), and Hayden Valley (E) study sites showing pellet collection localities (LANDFIRE, 2014). All maps created using ArcMap 10.7.1.
Table 1. Study site location, precipitation, and habitat type information. *Datum used: WGS 84; **estimated from Western Regional Climate Center (2021).

Samples from the Gardiner site were collected at the northern extreme of YNP and across the park boundary in the town of Gardiner, Montana. Gardiner is the most arid of the four study sites, being primarily a dry shrubland with Wyoming big sagebrush (Artemisia tridentata wyomingensis) that increasingly is dominated by invasive grasses and forbs (Fig. 1; Craighead, Reference Craighead2000; Sikkink, Reference Sikkink2011). Dry shrublands in the GYE are associated with both desert cottontails (Sylvilagus audubonii) and mountain cottontails (Sylvilagus nuttallii) (Streubel, Reference Streubel1989). Additionally, one of the Gardiner sampling localities is in a developed area (Fig. 1), where more human-commensal and disturbance-tolerant small mammal species would be expected. The Lamar site is located in the northeast of the park, near the confluence of Slough Creek and the Lamar River (Craighead, Reference Craighead2000). Lamar is primarily a sagebrush grassland, although with a complexity of microhabitats, including patches of mesic grasses and Douglas fir (Fig. 1; Craighead, Reference Craighead2000). Previous analysis of owl pellets and carnivore scat in the Lamar area identified the most abundant taxa as the Uinta ground squirrel (Urocitellus armatus), northern pocket gopher (Thomomys talpoides), and montane vole (Microtus cf. M. montanus) (Hadly, Reference Hadly1999). Urocitellus armatus in particular is indicative of xeric, open patches of sagebrush grassland (Streubel, Reference Streubel1989; Barnosky, Reference Barnosky1994). While the Hayden Valley study site is also primarily a grassland, it gets ~200 mm more rainfall than Lamar annually, and is therefore more mesic (Fig. 1; Table 1). The habitats near the Hayden Valley sampling localities include sagebrush grasslands, wet meadows, and riparian areas with sedges (Fig. 1; Craighead, Reference Craighead2000). Nearby, there is also forest with both lodgepole pine and subalpine fir (Fig. 1; Craighead, Reference Craighead2000). Small mammal taxa characteristic of mesic grasslands and wet meadows in YNP include Sorex spp., M. montanus, and M. pennsylvanicus (Steubel, 1989). Old Faithful, the study site with the highest annual precipitation (Table 1), is dominated by lodgepole pine, but includes highly riparian wet meadows and geyser basins with large thermal flats (Fig. 1; Craighead, Reference Craighead2000). Red squirrels (Tamiasciurus hudsonicus) and red-backed voles (Myodes gapperi) are associated with lodgepole pine forests, voles (Microtus spp.) are especially abundant in wet meadows, deer mice (Peromyscus maniculatus) are the only small mammals found near thermal flats, and water voles (M. richardsoni) are characteristic of riparian zones (Streubel, Reference Streubel1989).
Raptors tend to regurgitate one or two pellets per day, and each pellet typically represents one to three meals, depending on the size of the bird and the prey as well as the frequency of regurgitation (Duke et al., Reference Duke, Evanson and Jegers1976). A previous study in YNP found that small mammal bones deposited in a Holocene cave by raptors and mammalian predators were transported a maximum distance of ~8 km from their source (Feranec et al., Reference Feranec, Hadly and Paytan2007). The two most proximate study sites in this study (Gardiner and Lamar) are over 23 km apart—well beyond this foraging radius. We therefore do not expect that the raptors in our study are systematically hunting in one study site and regurgitating pellets in another. However, we do expect that our pellet assemblages include some spatial-averaging within each study site.
Raptor pellet collection and skeletal element identification
Raptor pellets (N = 1,246) were collected during the summers of 1998 and 1999 and accessioned in the Hadly Lab at Stanford University (Craighead, Reference Craighead2000). The pellets were found in each site by systematically searching underneath raptor roosts and nests (Craighead, Reference Craighead2000). To ensure that all pellets could be reliably paired with the raptor species that regurgitated them, only roosts and nests with visually identified raptor species were included (Craighead, Reference Craighead2000). Eight hundred fifty pellets were dissected, of which 787 yielded identifiable skeletal elements. Small mammals represented the majority of specimens dissected from the YNP pellets, comprising 83.6% of vertebrate remains. Reptile, amphibian, bird, and insect remains found in the pellets are not included in this study.
All small mammal specimens were identified morphologically to the most specific taxonomic unit possible based on craniodental material (crania, mandibles, and cheek teeth). Craniodental elements were chosen for identification because they are relatively robust to raptor digestion and are usually diagnostic for many small mammal taxa, enabling identification to genus or species (Terry, Reference Terry2007). These elements are also the most likely to be preserved in the fossil record, making direct comparisons between modern and paleontological collections tractable. The minimum number of individuals (MNI) was calculated for each small mammal taxon per pellet. This was done by identifying the craniodental material within each pellet by taxon, element, and side (left or right), and subsequently determining the most abundant element. Small mammal MNIs from each pellet were then pooled by study site and raptor species, such that each grouping represents all pellets from one raptor species at one site (e.g., all great horned owl pellets from the Gardiner site). Raptor and study site groupings with fewer specimens than the total number of small mammal taxa considered across sites (N = 16) were not included in subsequent analyses (Table 2).
Table 2. Abundances and diversity analyses for each site-predator cohort. *GHOW = great horned owl, SEOW = short-eared owl, LEOW = long-eared owl, RTH = red-tailed hawk, SWH = Swainson's hawk

In our analysis, we included two categories of Microtus: Microtus spp. and M. richardsoni. The smaller genera of Microtus present in YNP (M. montanus, M. longicaudus, and M. pennsylvanicus) were pooled because they are difficult to distinguish unless specific elements (e.g., the first molar) are retained. In addition, M. montanus, M. longicaudus, and M. pennsylvanicus occupy roughly the same environments (moist meadows), therefore pooling their abundances retains habitat-specific information (Streubel, Reference Streubel1989). Microtus richardsoni, on the other hand, is morphologically distinct from the other local Microtus species and occupies a more specific mesic niche, being found exclusively in riparian zones dominated by sedges and willows (Streubel, Reference Streubel1989). Therefore, it is both tractable and informative to separate this species from the rest of Microtus spp.
All specimens of Lepus and Sylvilagus were designated as Leporidae due to the difficulty of morphologically distinguishing their craniodental remains.
Diversity analyses
For each raptor species at each study site (jointly referred to as a “site-predator cohort” or simply “cohort” henceforth), we calculated standardized species richness using shareholder quorum subsampling (SQS) with a quorum level of 0.8 (Alroy, Reference Alroy2010). It is necessary to standardize species richness in order to remove the effect of the different sample sizes of each site-predator cohort. While traditional rarefaction standardizes richness through uniform sampling, this can underestimate the richness of the most diverse samples. SQS fixes coverage rather than sample size such that a site that has double the SQS richness value as another site is in fact twice as diverse (Alroy, Reference Alroy2010).
We then calculated taxon evenness using probability of interspecific encounter (PIE) using Goodman's simultaneous confidence intervals for each cohort (Table 2), following the methods of Davis (Reference Davis2005) and Stegner (Reference Stegner2016). Unlike other diversity indices, such as Simpson and Shannon, PIE is independent of sample size and therefore does not require resampling in order to estimate uncertainty. We evaluated confidence interval overlap to assess whether small mammal evenness was significantly different between site-predator cohorts.
Testing the role of site versus raptor species
We standardized community data from each site-predator cohort by using relative abundances (Fig. 2). We then ran a permutational multivariate analysis of variance (PERMANOVA) to assess whether there are significant differences in the small mammal pellet assemblage across raptor species or across sites. PERMANOVA tests whether the centroids of our clusters are different between our “treatments” (here, different raptor species or different study sites). We also ran a PERMANOVA assessing whether there were significant differences between the diets of the nocturnal and diurnal raptor species. We did this to test whether raptor diet is biased by the time of day they are active. For each PERMANOVA, we verified the homogeneity of dispersion among groups using the betadisper function in vegan. In cases where PERMANOVA yielded significant results and the homogeneity of dispersion assumption was met, we ran a pairwise PERMANOVA to determine which groups were significantly different.
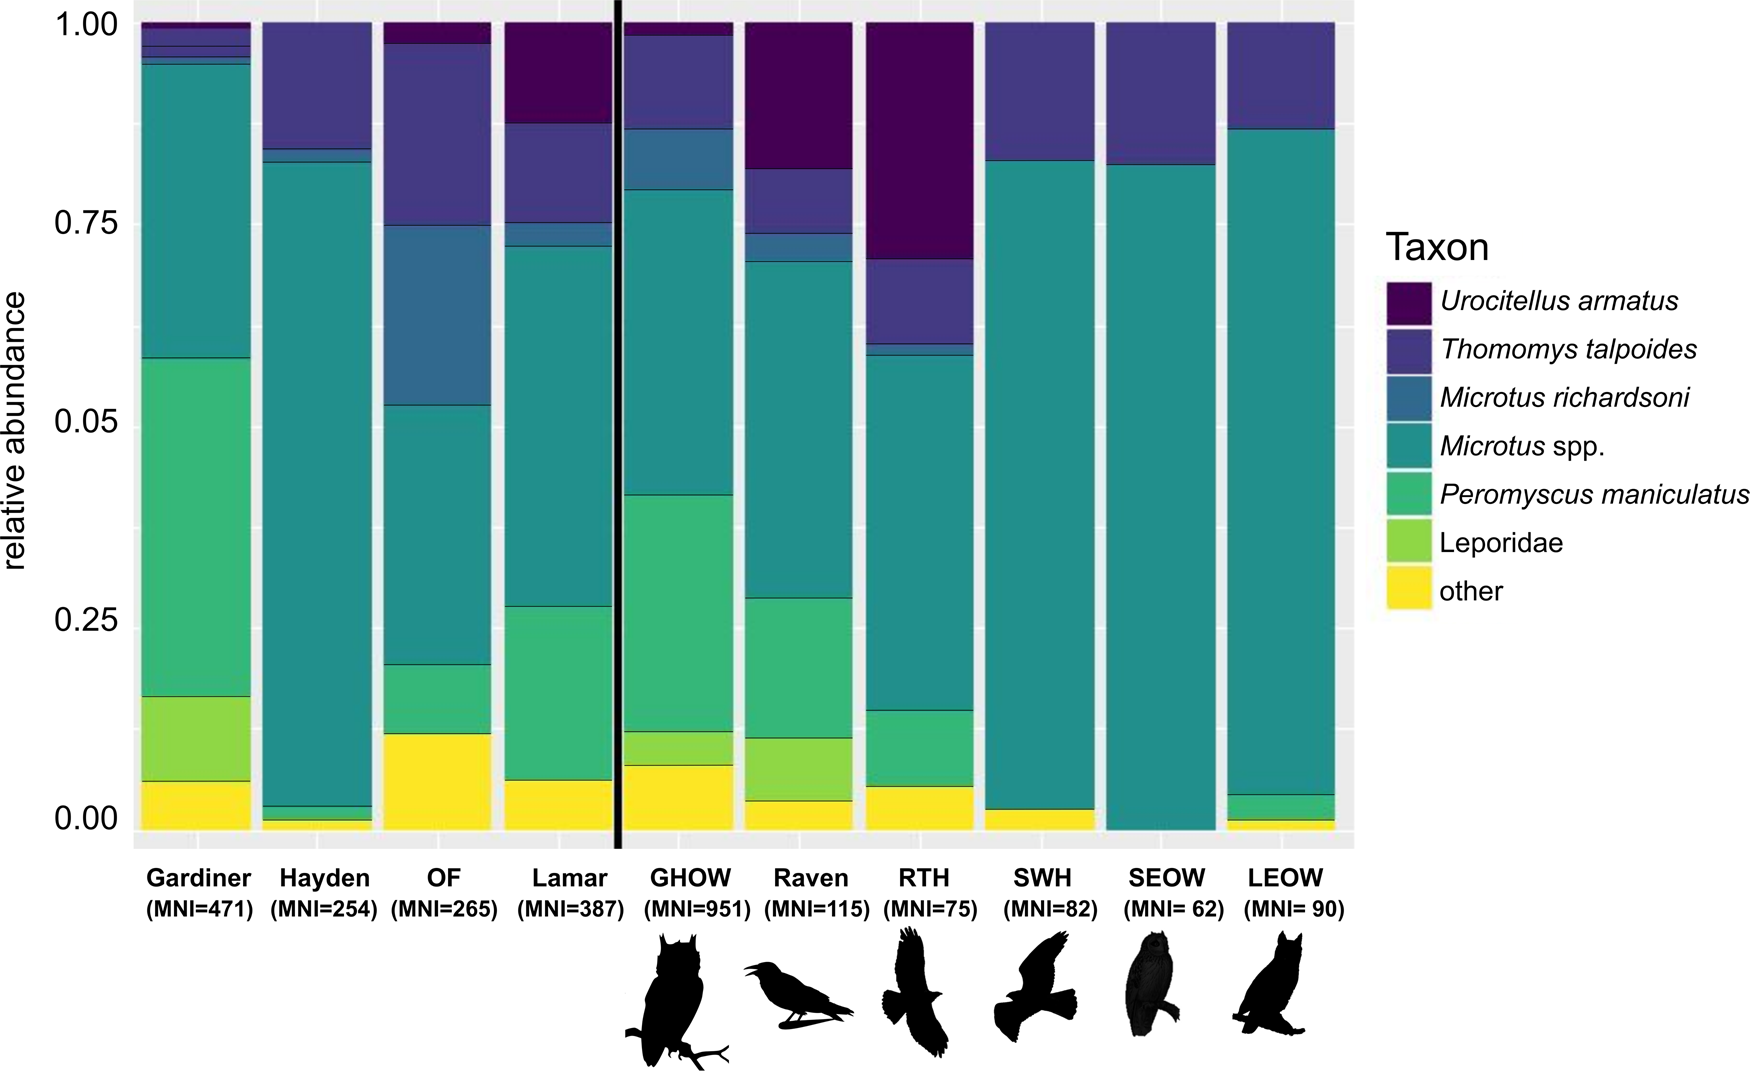
Figure 2. Relative abundances of the most common small mammal taxa found in raptor pellets from the Gardiner, Hayden Valley, Old Faithful (OF), and Lamar study sites, as well as great horned owl (GHOW), raven, red-tailed hawk (RTH), Swainson's hawk (SWH), short-eared owl (SEOW), and long-eared owl (LEOW) avian predators (values in Table 2).
We compared community composition between each site-predator cohort (beta diversity) using a Bray-Curtis dissimilarity matrix. From the Bray-Curtis dissimilarity matrix, we calculated hierarchical clustering using the complete-linkage method, which we present as a dendrogram (Fig. 3). We tested the significance of each split using a broken stick test.

Figure 3. Cluster dendrogram with complete linkage showing hierarchical relationships between cohorts. The dendrogram shows the best way to allocate the cohorts into clusters based on their Bray-Curtis dissimilarities, with shorter split heights indicating more similar cohorts. Significant splits (clusters) were found using a broken stick test and labeled on the dendrogram with asterisks. GHOW = great horned owl; RTH = red-tailed hawk; SWH = Swainson's hawk; SEOW = short-eared owl; LEOW = and long-eared owl.
We further calculated the intra-raptor and intra-site area Bray-Curtis dissimilarities to assess if the reconstructed small mammal communities were more similar on the basis of collection area or raptor species. We visualized this using box plots by pooling dissimilarities that (1) represented comparisons of a single species of raptor across multiple sites, and (2) represented within-site comparisons across multiple raptor species (Fig. 4). Any raptor species that was not represented in more than one study site was not included in the across-site raptor analysis. Likewise, the Old Faithful study site was not incorporated into the within-study site comparison because only one raptor species is represented there.

Figure 4. Box plot of pooled intra-study site and intra-raptor species Bray-Curtis dissimilarities with significance at the 0.05 level marked by double asterisks (Wilcox test, p-value = 0.003). The box plot shows that the dissimilarities between small mammal assemblages produced by different raptor species but collected at the same study sites are significantly less than the dissimilarities between the diet of the same raptor species at different study sites.
Lastly, we conducted a SIMPER analysis to determine the contribution of each small mammal taxon to the pairwise dissimilarities between sites (Fig. 5). If the small mammal associations are in line with the expectations of local small mammal community composition within each study site, this will suggest that the included raptors are sampling the small mammals in proportion to their local abundances.

Figure 5. SIMPER values showing the proportions of Bray-Curtis dissimilarities between study sites explained by small mammal taxa. These values show the relative contribution of different small mammals in differentiating study sites from each other.
All analysis and visualization were completed in the R program for statistical computing (version 3.6.1) using the vegan, stats, ggsignif, ggplot2, EcolUtils, and viridis packages (Wickham, Reference Wickham2016; Garnier, Reference Garnier2018; Ahlmann-Eltze, Reference Ahlmann-Eltze2019; Oksanen et al., Reference Oksanen, Blanchet, Friendly, Kindt, Legendre, McGlinn, Minchin, O'Hara, Simpson and Solymos2019; R Core Team, 2019; Salazar, Reference Salazar2020).
RESULTS
We identified a total of 1375 MNI from 16 small mammal taxa: Sorex spp., Myotis spp., Mustela spp., Urocitellus armatus, Tamias spp., Tamiasciurus hudsonicus, Thomomys talpoides, Zapus princeps, Myodes gapperi, Microtus spp. (including M. montanus, M. longicaudus, and M. pennsylvanicus), Microtus richardsoni, Ondatra zibethicus, Phenacomys intermedius, Neotoma cinerea, Peromyscus maniculatus, and Leporidae (Table 2; Fig. 2).
The standardized richness (SQS) for each site-predator cohort was similar, ranging from 2.250–2.468 (Table 2). Evenness (PIE), however, was variable across study sites and raptor species. The majority of samples were fairly even (PIE >0.5) for all cohorts, with the exception of three of the four Hayden Valley raptors: Swainson's hawk, short-eared owl, and long-eared owl (Table 2). Hayden Valley cohorts also had the lowest raw richness. Pellets from ravens had the highest evenness across all study sites (Table 2).
Reconstructed small mammal communities were significantly different when grouped by study site (R2 = 0.77, p-value = 0.001) but not by raptor identity (R2 = 0.52, p-value = 0.603). We also found a non-significant PERMANOVA result when grouping nocturnal versus diurnal species (R2 = 0.07, p-value = 0.680). In all cases, the homogeneity of dispersion assumption was met, validating our findings. Pairwise PERMANOVA revealed significant differences between the Hayden Valley and Lamar study sites (p-value = 0.032), although this was not significant with a Holm p-value correction.
In our cluster dendrogram, however, cohorts from the same study site cluster together, regardless of raptor species (Fig. 3). The two Gardiner site-predator cohorts form a clade cluster separate from all others, Hayden Valley clusters apart from Lamar and Old Faithful, and the Old Faithful cohort falls outside of the three Lamar cohorts. All three of these splits are significant based on a broken stick test.
The intra-raptor Bray-Curtis dissimilarities were significantly higher than the intra-study site dissimilarities (Fig. 4, p-value = 0.003). Therefore, the reconstructed small mammal communities were more similar within study sites, regardless of raptor species, than were raptor diets across study sites.
The most important species that discriminate between sites are: Leporidae, P. maniculatus, M. richardsoni, and T. talpoides for Gardiner and Old Faithful; Leporidae, P. maniculatus, and Microtus spp. for Gardiner and Hayden; Leporidae, P. maniculatus, and U. armatus for Gardiner and Lamar; Microtus spp., M. richardsoni, T. talpoides, and U. armatus for Lamar and Old Faithful; and Microtus spp. and M. richardsoni for Old Faithful and Hayden Valley (Fig. 5).
DISCUSSION
Our results show that the small mammal communities reconstructed from our pellet assemblages are significantly different between study sites, but are not significant between raptor species. While the pairwise PERMANOVA only significantly differentiates Hayden Valley from Lamar, our cluster analysis (with broken stick test) confirms the significant splits of all four study sites. In addition, we found that pellet collections are more similar within the same study site, regardless of raptor identity, than within the same raptor species across different study sites (Fig. 4). Therefore, the collection site better explains the small mammal community composition in raptor pellets than does the identity of the raptor species.
While ideally we would compare our pellet data to known small mammal abundances from each study site, we did not conduct this study for a variety of reasons. All small mammal sampling methods (camera-trapping, live-trapping, carnivore scat, etc.) are biased in some way (Torre et al., Reference Torre, Arrizabalaga and Flaquer2004; Foster and Harmsen, Reference Foster and Harmsen2012; Stephens and Anderson, Reference Stephens and Anderson2014). For example, specific taxa may be favored or excluded depending on trap type, trap attraction, or type of bait used (Stephens and Anderson, Reference Stephens and Anderson2014). Above-ground live-trapping is highly biased in that it excludes some common species (i.e., pocket gophers), while favoring others (i.e., deer mice), despite often being the preferred method for surveying small mammal communities. A small mammal survey in the Lamar area using live-trapping, owl pellets, and carnivore scats showed that live-trapping did not support the rank order abundances of the prey species found in carnivore or raptor diets, or indeed a century or so of small mammal remains from a subfossil accumulation in the same area (Hadly, Reference Hadly1999). Torre et al. (Reference Torre, Arrizabalaga and Flaquer2004) and Heisler et al. (Reference Heisler, Somers and Poulin2016) also found that owls sample a greater diversity of small mammals than live-trapping. Therefore, an independent evaluation using live-trapping would not be informative.
Thus, we identified the expected small mammal taxa based on the dominant habitats in each study site using Streubel (Reference Streubel1989) and matched these with the taxa that discriminated the pellet assemblages of each study site. While we cannot be certain that the pellets represent the exact relative abundances of small mammals within their local environments, we believe that if there is bias, it is relatively small. Importantly, our results show that any possible bias present must be consistent across the different raptor species included in this study, regardless of species identity or whether they are nocturnal or diurnal. For Quaternary cave sites, it is most important to prove that differences in small mammal communities over time are not just an artifact of raptor community turnover. As long as the bias from raptor accumulators is consistent across species, environmental signal is retained.
However, the small mammal taxa that differentiate each study site suggest that the raptors are sampling small mammals according to their local abundances, rather than preferentially selecting specific taxa, because they are concordant with the habitats represented in the vicinity of the raptor pellet accumulations. For example, all four raptor species sampled in Hayden Valley produced similar small mammal assemblages (low Bray-Curtis dissimilarities) which were distinct from the other study sites due to the abundance of Microtus spp. (Fig. 5). The high relative abundance of Microtus spp. in the Hayden Valley pellets also drove the low evenness and raw richness in these cohorts (Table 2). The included Microtus species (M. montanus, M. longicaudus, and M. pennsylvanicus) are wet-meadow and grassland specialists (Streubel, Reference Streubel1989), consistent with the high proportion of these habitat types where the pellets were collected along the Yellowstone River.
The Lamar site-predator cohorts are also quite similar in terms of small mammal community composition, which is driven by the prevalence of Urocitellus armatus in these cohorts and not elsewhere (Figs. 2, 5). This is consistent with the sagebrush grassland habitat of the Lamar site because U. armatus is a characteristic species of this vegetation community (Hadly, Reference Hadly1996, Reference Hadly1999; Craighead, Reference Craighead2000). Similarly, the Old Faithful study site is separated out by the abundance of the water-associated M. richardsoni (Figs. 2, 5), likely due to the abundance of moist meadows and freestanding water offered by the numerous thermal ponds and year-round riparian vegetation along the Firehole River. All other expected taxa (T. hudsonicus, M. gapperi, P. maniculatus, and Microtus spp.) are also present at the Old Faithful study site, although they are apparently less informative than M. richardsoni in discriminating this site from the others.
While the Gardiner raptors (great horned owl and common raven) grouped together in the cluster dendrogram, they consumed only moderately similar prey (Bray-Curtis value = 0.44). The moderate overlap may in part be due to a difference in degree of human disturbance between the Gardiner collection localities. Gardiner is at the very northern end of YNP and falls within a high-latitude desert with xeric vegetation similar to the Great Basin (Despain, Reference Despain1973). The Gardiner site-predator cohorts are characterized by a high prevalence of leporids, which is consistent with the dry shrubland habitat (Figs. 2, 5; Streubel, Reference Streubel1989; Craighead, Reference Craighead2000). No other localities contained leporid remains despite both avian accumulators (great horned owls and ravens) being represented in other study sites (Fig. 2). Additionally, Peromyscus maniculatus, a “weedy” disturbance-tolerant species (Blois et al., Reference Blois, McGuire and Hadly2010; Stegner, Reference Stegner2015; Shonfield and Bayne, Reference Shonfield and Bayne2019), is an important species in explaining the dissimilarity between Gardiner and the other study sites (Fig. 5). This may represent the urban influence on small mammal community composition since one of the Gardiner collection sites was near the town of Gardiner, Montana, and the environs are more heavily affected by human disturbance and invasive plant and animal species.
Interestingly, there was no significant difference between the diets of the diurnal avian predators included (ravens, red-tailed hawks, and Swainson's hawks) and those of the nocturnal ones (owls). This result was unexpected because nocturnal and diurnal raptors should have a different selection of species available to them since small mammals are characteristically active at different times of the day. This is possibly explained by the more flexible active schedules of small mammal species, many of which do not fit neatly into the nocturnal versus diurnal categories, and instead are more crepuscular. These results imply that unlike small mammal live-trapping, which necessitates trapping both during the day and night to capture a representative selection of taxa, raptor pellets, regardless of the identity of their producer, are less biased in this respect.
Spatial partitioning between sympatric raptors may in part account for their dietary overlap in the same study sites. A study of two sympatric hawk species showed that in times of prey decline neither hawk specialized in their diets (resource partitioning), but instead invested in aggressive territory guarding (Gerstell and Bednarz, Reference Gerstell and Bednarz1999). This suggests that in study sites with multiple diurnal raptors (who have overlapping hunting times), the birds may have foraged close to their roosts in non-overlapping areas. However, if there were abundant prey resources, spatial partitioning between sympatric raptors may have been less stark.
Something that we did not test in this study is whether the body size of raptors influences their diets. We did not include a sufficient range of raptor body sizes to test whether this was a factor, but intuitively bone assemblages produced only by very small raptors or very large raptors may be biased in respectively excluding or including larger-bodied small mammals. For example, very small raptors (e.g., falcons and kestrels) are unlikely to be able to consume a regular diet of large rabbits or squirrels simply by virtue of physical limitations. Very large raptors, such as golden eagles (Aquila chrysaetos), on the other hand, regularly eat leporids and sciurids in addition to smaller mammals (Bedrosian et al., Reference Bedrosian, Watson, Steenhof, Kochert, Preston, Woodbridge, Williams, Keller and Crandall2017). Our study could be expanded to test the effect of body size on raptor diet by the inclusion of raptors with a wider size range. For example, both golden eagles and American kestrels (Falco sparverius) are present in YNP and could be added to the study to represent the upper and lower range of raptor body sizes.
Our results show that if raptors are biased in their preference of small mammal species, the bias is consistent and is not so strong that the signal of their collection area is obscured. However, there do seem to be some differences between raptor species in terms of both evenness and raw richness of their small mammal diets. Ravens, which are scavengers as well as predators, sample the local diversity more evenly than the other avian predators we sampled. Great horned owls consistently have the highest raw species richness in their diet, but this difference is not evident after standardization.
CONCLUSIONS
Our analysis shows that the small mammal component of raptor diet is best explained by the location of the pellet accumulation site rather than raptor species identity. The small mammal taxa that discriminate the sites align with differences in the local environments. This suggests that raptor communities faithfully sample local small mammal diversity, more closely exhibiting optimal foraging than dietary specialization. Our findings imply that ornithologists who use pellets to construct raptor dietary profiles should sample multiple localities in order to capture their true dietary breadth. On the other hand, our results are encouraging for neontologists who use raptor pellets to non-invasively survey small mammal communities because they can now confidently rely on their results without first determining the identity of the raptor species that regurgitated the pellets. In addition, paleoecologists working in raptor-accumulated sites can more confidently assess environmental change over time without first testing whether small mammal community turnover is simply an artifact of shifting raptor community composition. In conclusion, analysis of raptor pellets remains a promising method for accurately and non-invasively sampling past and modern small mammal communities.
Acknowledgments
We thank April Craighead for her invaluable contributions to this project including field work and data collection, the National Park Service for providing research access and logistical support, and the National Science Foundation (DGE-1656518) for providing funding. We would also like to thank Associate Editor Jeff Pigati and an anonymous reviewer for particularly useful review comments as well as Edward Davis for his kind feedback. Finally, we would like to thank the members of the Hadly lab, Katie Solari, and Lucas Pavan for their helpful advice and support.


