Introduction
Tephra deposits in lake and peat bog environments are often well preserved because of anoxic, reducing chemical conditions, coupled with effectively continuous accumulation of organic sediments over long time periods. Such preservation is of great value for reconstructing the explosive eruption history of nearby long-lived volcanoes. Such records provide insight into eruption frequency, magnitude, and style (e.g., Lowe, Reference Lowe1988a; Shane and Hoverd, Reference Shane and Hoverd2002; Shane, Reference Shane2005; Molloy et al., Reference Molloy, Shane and Augustinus2009) and offer the opportunity to determine the time-varying behavior of complex magmatic systems (e.g., Gamble et al., Reference Gamble, Wood, Price, Smith, Stewart and Waight1999; Price et al., Reference Price, Stewart, Woodhead and Smith1999; Gertisser and Keller, Reference Gertisser and Keller2003; Turner et al., Reference Turner, Cronin, Bebbington, Smith and Stewart2011b). However, in order to create reliable volcanic histories, the vagaries of tephra deposition and preservation must be overcome. For instance, changes in the depositional environment, eruption dynamics, and/or variation in direction and intensity of syndepositional winds can result in variable accumulation and preservation of tephra over time at any one site (Molloy et al., Reference Molloy, Shane and Augustinus2009; Green et al., Reference Green, Bebbington, Cronin and Jones2014). To overcome these issues, cores need to be collected at a number of sites around a source, covering as completely as possible the potential variations in tephra dispersal direction. Ideally, a closely spaced arc of sites around a volcano will best capture narrow tephra depositional lobes. Building a robust multiple-site tephra record provides a better understanding of the time-varying magmatic, volcanic, and environmental processes, leading to more reliable hazard forecasts.
Mt. Taranaki, a 2518 m high andesitic stratovolcano located in the Taranaki region, North Island, New Zealand, has erupted multiple times over the past ~130 ka (Alloway et al., Reference Alloway, McComb, Neall, Vucetich, Gibb, Sherburn and Stirling2005), distributing ash across the surrounding landscape and at least as far north as the city of Auckland (~270 km; Sandiford et al., Reference Sandiford, Alloway and Shane2001; Shane, Reference Shane2005). It is positioned in the middle of an economically significant region of New Zealand, hosting the only producing oil and gas fields, as well as ~25% of the country’s dairy farming industry. Thus, Mt. Taranaki poses a considerable threat to New Zealand economically. It also has been dormant for more than a century (Platz et al., Reference Platz, Cronin, Cashman, Stewart and Smith2007), which contributes to an even higher vulnerability because most people are unaware of the potential devastation of reawakening volcanoes (Gaillard, Reference Gaillard2006).
Lake and peat sediment records preserving tephra layers from Mt. Taranaki have been collected during a number of previous studies at single or multiple sites (e.g., Newnham, Reference Newnham1990; Lees and Neall, Reference Lees and Neall1993; McGlone and Neall, Reference McGlone and Neall1994; Turner et al., Reference Turner, Cronin, Bebbington and Platz2008a, Reference Turner, Bebbington, Cronin and Stewart2009, Reference Turner, Cronin, Bebbington, Smith and Stewart2011a). Of these, Turner et al. (Reference Turner, Cronin, Bebbington and Platz2008a, Reference Turner, Bebbington, Cronin and Stewart2009, Reference Turner, Cronin, Bebbington, Smith and Stewart2011a) focused on obtaining high-resolution tephra records. These studies combined tephra records from Lake Umutekai, north–northeast (NNE) of the volcano, and Lake Rotokare, east–southeast (ESE) of the volcano, together with on-cone stratigraphy to identify 138 eruptions spanning the last 14C ka BP (Turner et al., Reference Turner, Cronin, Bebbington, Smith and Stewart2011a). Here we expand on past work by adding data from four newly cored sites located in an NNE to ESE arc downwind of the prevailing wind directions of Mt. Taranaki (Drost et al., Reference Drost, Renwick, Bhaskaran, Oliver and McGregor2007). This new combined record provides a much more comprehensive coverage of the most likely tephra dispersal directions and doubles the length of the existing high-resolution tephrostratigraphy of this region, through generating a sequence covering the last ~30,000 cal yr BP. Geochemical and chronostratigraphic analysis was subsequently used to classify the eruption record into six individual tephra sequences, which allow the subdivision of the eruptive history of Taranaki volcano into distinct separate phases.
The use of analyses of accessory minerals, such as titanomagnetite phenocrysts, to discriminate and correlate tephras has been successful in several previous studies (e.g., Kohn, Reference Kohn1970; Cronin et al., Reference Cronin, Wallace and Neall1996; Shane, Reference Shane1998, Reference Shane2005; Turner et al., Reference Turner, Cronin, Smith, Bebbington and Stewart2008b, Reference Turner, Bebbington, Cronin and Stewart2009, Reference Turner, Cronin, Bebbington, Smith and Stewart2011a; Marcaida et al., Reference Marcaida, Mangan, Vazquez, Bursik and Lidzbarski2014). Not only are these mineral phases common in andesitic tephras of Mt. Taranaki (Kohn and Neall, Reference Kohn and Neall1973), but they are also highly resistant to postdepositional weathering (Aomine and Wada, Reference Aomine and Wada1962) and are easily extractable from very small volumes of tephra by simple magnetic separation. Titanomagnetite compositions usually reflect individual magmatic conditions (Buddington and Lindsley, Reference Buddington and Lindsley1964; Hill and Roeder, Reference Hill and Roeder1974; Frost and Lindsley, Reference Frost and Lindsley1991; Toplis and Carroll, Reference Toplis and Carroll1995) and thus can be used in a similar way to compositional fingerprinting of glass. The amount of Ti4+ substitution in the iron-oxide spinel structure and to a lesser extent Mg2+, Al3+, and Mn2+ (Ghiorso and Sack, Reference Ghiorso and Sack1991) allows geochemical discrimination between titanomagnetites from different magmas. Here we present 12 individual titanomagnetite compositional groups identified in the tephra record established during this study.
Furthermore, whole tephra sequences and/or individual tephra layers were linked to the known distal and proximal record, although precise correlation was often not achievable because of a lack of compositional data from proximal deposits and imprecision regarding chronology. Notably, as a result of excellent preservation conditions at many of the core sites, this new record reveals several tephra units that have not previously been recognized in exposed soil and cover-bed sequences or in proximal on-cone sequences.
Study sites
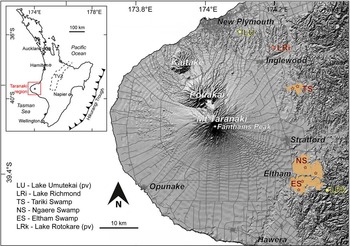
Peatlands and lakes occur in several areas on the lower portions of the volcanic ring plain of Mt. Taranaki, where large debris avalanches and lahar deposits lap up against the deeply dissected and uplifted Tertiary sediments of the hill country to the east (Fig. 1). Rapid sediment deposition events from volcanic mass flows have altered or blocked existing stream systems, forming lakes and peatlands. One lake and three peat sites, located 20 to 30 km from Mt. Taranaki’s summit, were selected because of their potential for preserving deep sequences of organic deposits and their positions within the known dispersal axis of mapped tephra falls (Alloway et al., Reference Alloway, Neall and Vucetich1995). From north to south, the study sites are Lake Richmond, Tariki Swamp, Ngaere Swamp, and Eltham Swamp (Fig. 1). Data from cores at Lake Umutekai and Lake Rotokare, obtained by Turner (Reference Turner2008), were reexamined in the present study.

Figure 1 Location map of the North Island, New Zealand, and the Taranaki region showing the lakes and peatlands that were examined during this study (highlighted in orange; stars indicate coring site) and previous (pv) studies of Turner (Reference Turner2008) (highlighted in yellow). Note the changes in physiography reflecting the contrast between the smooth volcanic ring plain to the west and the dissected mudstone hill country to the east. For references to color in the figure, please see the online version of this article.
Lake Umutekai lies 25 km NNE of Mt. Taranaki’s summit. It is a 0.02 km2, shallow (<2 m) closed depression on a gently undulating volcaniclastic surface that is ≥170 ka old (Neall, Reference Neall1979). The surrounding landscape was densely forested throughout the Holocene (McGlone and Neall, Reference McGlone and Neall1994). Lake Umutekai has been cored previously for a pollen-based vegetation and climate survey (Newnham, Reference Newnham1990) and more recently by Turner et al. (Reference Turner, Cronin, Bebbington and Platz2008a, Reference Turner, Bebbington, Cronin and Stewart2009, Reference Turner, Cronin, Bebbington, Smith and Stewart2011a) who identified 104 tephra layers deposited between ca. 1.5 and 10.5 cal ka BP.
Lake Richmond is located 25 km northeast (NE) of Mt. Taranaki’s summit. The lake, which lies within a valley oriented north–south, is interpreted here to have been formed by landslide damming. It is drained to the northeast by the Mangaonaia Stream and fed by two unnamed streams from the south. The 0.03 km2 lake, which has not been cored before, has a maximum water depth of 4 m.
Tariki Swamp is located 22 km east–northeast (ENE) of Mt. Taranaki’s summit. It is bordered by the Manganui River to the west and the anthropogenic Lake Ratapiko to the east. This small, peat-filled basin is abutted to the north by a massive debris avalanche deposit (Okawa Formation, 105 ka BP; Neall and Alloway, Reference Neall and Alloway2004). Alteration of drainage by the emplacement of this deposit is interpreted as the cause of peat formation. This peatland has not been successfully cored before and contains many fallen trees within parts of the sequence.
Eltham Swamp and Ngaere Swamp are large, broad wetlands, which lie 28 km ESE of Mt. Taranaki’s summit and are separated from each other by a low, east–west trending ridge of Tertiary mudstone. At 220 m, Ngaere Swamp is 10 m higher than Eltham Swamp. Both are peat-filled basins about 6 km long and 2 km wide. The Eltham Swamp is drained by the Mangimangi Stream to the south and by the Mangawhero Stream to the west. The Ngaere Swamp is drained to the north by the Ngaere Stream, a tributary of the Patea River. These peatlands formed in response to a series of lahar and debris avalanche deposits emplaced between 23 and 50 14C ka BP (McGlone and Neall, Reference McGlone and Neall1994; Neall and Alloway, Reference Neall and Alloway2004; Zernack et al., Reference Zernack, Cronin, Neall and Procter2011). These deposits altered the local topography, provided shallow aquitards, and partially blocked the tributary valleys of the eastern hill country, leading to peat accumulation. The Eltham Swamp has been investigated previously by McGlone and Neall (Reference McGlone and Neall1994) and Tinkler (Reference Tinkler2013), who undertook pollen-based paleovegetation investigations. Pollen analyses of peat cores from this peatland indicate that ca. 13 14C ka BP ago, the region was mainly open grassland. Shortly after (ca. 12.5 14C ka BP), there was a rapid transition to a forest-dominated landscape. Today, these peat sites are cleared of their original forest, drained and developed into pasture, which has caused the peatland to subside at least 3 m (McGlone and Neall, Reference McGlone and Neall1994).
Lake Rotokare lies approximately 34 km ESE of Mt. Taranaki’s summit. This Y-shaped lake was formed by damming of an antecedent valley drainage system following a Holocene landslide (Taranaki Catchment Commission, 1980). It has an area of 0.25 km2 and a maximum water depth of 12 m. Turner et al. (Reference Turner, Bebbington, Cronin and Stewart2009) identified 42 tephra layers dated between ca. 0.5 and 7 cal ka BP within sediments of this lake.
Methods
Field sampling and core processing
Sediment cores were collected using a hydraulic percussion coring system (peat sites) and a hand-operated Livingston piston corer operated from a raft (lake site). At each site, two to three closely spaced cores were collected to check for local depositional variability and to provide an overall higher-resolution record through combining the individual core records to form a “composite” core for each site. All cores were split longitudinally into archived and working halves. The latter were examined visually and imaged using a large-format X-ray density camera at the Institute of Veterinary Animal and Biomedical Sciences, Massey University. The radiographs allowed identification of tephra units <0.1 mm in thickness and horizons of dispersed tephra particles, which were otherwise difficult to detect by the naked eye. Once located, tephra layers were sampled, treated with hydrogen peroxide to remove organic material, and subsequently sieved and examined microscopically. Most of the mineral layers identified were confirmed to be primary tephras by optical microscopy (well-sorted and angular grain-size characteristics, abundance of detrital material) and subsequent geochemical analyses (degree of geochemical homogeneity). A small number of tephras were determined to be “reworked,” as they occur dispersed within nonvolcanoclastic horizons (i.e., soil, mud) and/or have diverse physical and geochemical characteristics. Tephra samples that yielded sufficient material were subsampled for chemical analysis. The nomenclature of individual tephra layers is based on the coring site and tephra number in stratigraphic/age order. For example, N1-5 indicates Ngaere Swamp core 1, fifth tephra layer from the top of the core. Tephra nomenclature for composite cores excludes the core number (i.e., N-5).
Radiocarbon dating
Samples for radiocarbon age determination comprised slices of bulk sediment up to 1 cm thick, which were collected at roughly regular intervals throughout the cores. Locations immediately below prominent tephra layers or horizons where distinct lithological changes occurred were targeted for sampling. Samples were submitted to the Waikato Radiocarbon Dating Laboratory, Hamilton, New Zealand, for accelerator mass spectrometry radiocarbon dating. All radiocarbon ages are shown in Supplementary Table 1 and are here reported as calibrated ages (cal yr BP) with 2σ errors. Calibration was performed using OxCal version 4.2 (Bronk Ramsey, Reference Bronk Ramsey2013) and the Southern Hemisphere SHCal13 atmospheric calibration curve (Hogg et al., Reference Hogg, Hua, Blackwell, Niu, Buck, Guilderson and Heaton2013).
Grain-size and geochemistry
Individual tephra samples were wet sieved through a 63 μm sieve to separate the silt and clay fractions from the sands. The <63 μm fraction was analyzed using a Horiba Partica LA 950V2 laser particle analyzer (LPA) at Massey University. The >63 μm fraction was dry sieved at half-phi intervals. Samples were weighed for each half-phi unit and plotted with the LPA data as a weight percent (wt%) of the total sample using GRADISTAT version 8.0 (Blott, Reference Blott2010). Supplementary Table 2 shows the bulk grain size of tephra layers within the composite records.
Major and minor element analysis of single glass shards and titanomagnetite phenocrysts was carried out using a JEOL JXA-840a electron microprobe equipped with a Princeton Gamma Tech Prism 2000 Si(Li) EDS X-ray detector at Massey University. An accelerating voltage of 15 kV, an 800 pA beam current, and a 100 s live time count were applied. These conditions along with a 10–20 µm defocused beam were used for glass shard analyses to minimize Na migration. Syn- and posteruption crystallization of nanolitic Fe-oxides and microlitic plagioclase can often lead to fine-scale heterogeneity of the glass (Best, Reference Best2003). These are often difficult to avoid using a large diameter electron beam required for glass analysis. To minimize this effect, backscatter electron imaging and the removal of hybrid data points using the technique of Platz et al. (Reference Platz, Cronin, Cashman, Stewart and Smith2007) were applied. A 2 µm diameter focused beam was used for titanomagnetite analyses. Titanomagnetite grains analyzed ranged in size from 500 to <250 µm and are mainly observed as individual phenocrysts and/or glomerocrysts with clinopyroxene and plagioclase. Exsolved titanomagnetite grains (exhibiting trellises of ilmenite and magnetite) show naturally heterogeneous compositions and were thus avoided by backscatter electron imaging. The analytical conditions were regularly calibrated using a range of Astimex standards appropriate to the compositions of phases analyzed. At least 10 analyses of both glass and titanomagnetite were obtained for each tephra. Data points that show obvious contamination were excluded. Major elements are expressed as oxides and reported in wt%. Glass shard data were normalized to 100%, and titanomagnetite data corrected for iron following the procedure of Carmichael (Reference Carmichael1967).
Depth information
Only a handful of studies address the issue of sediment disturbance during core sampling, and therefore, most do not question how well the core reflects in situ sediment conditions. This is potentially important for subsequent depth-related analyses, including depth profiles and accumulation rate calculations. Overall, the main feature observed in all cores recovered during this study was that the collected sediments were often shorter than the sediment length penetrated by the core tube. This deficit can be attributed to sediment shortening, a combined result of sediment thinning, compaction, and bypassing, which are common processes during any type of sediment extraction (e.g., Lebel et al., Reference Lebel, Silverberg and Sundby1982; Blomqvist, Reference Blomqvist1985, Reference Blomqvist1991; Crusius and Anderson, Reference Crusius and Anderson1991; Skinner and McCave, Reference Skinner and McCave2003). According to Parker and Sills (Reference Parker and Sills1990) and Morton and White (Reference Morton and White1997), core shortening is not uniformly distributed throughout the depth of penetration. It is highly likely that a mixed pattern of core shortening occurs, especially if there are variations in sediment strength/coherence down the sequence. In the present study, individual core lengths show total percentages of shortening varying between <10% and 60%. Hence, adjusting for the entire core lengths by applying a linear correction factor is unsuitable and may lead to erroneous results. In the course of this study, no correction factor was applied, and depths are given as shortened depth (s.depth), as this is compatible with the spline-fitting approach to dating and the construction of composite cores described subsequently.
Results
Age-depth models
Age-depth models for each sediment core (Fig. 2) were created using the calibrated radiocarbon age distributions as a function of s.depth (Supplementary Table 1) and a piecewise cubic Hermite interpolating polynomial fit (Fritsch and Carlson, Reference Fritsch and Carlson1980). The polynomial fitting automatically corrects for the compaction. The tephra layers were subtracted before fitting the polynomial because it is assumed that each tephra was deposited instantaneously on such geological time scales. The core-depth function can be used to assess accumulation rates for each of the core sites and to estimate calendar ages for each tephra represented in the cores (Supplementary Table 2).

Figure 2 Age-depth models for lake and peat sediment cores, produced using a piecewise cubic Hermite interpolating polynomial fit (Fritsch and Carlson, Reference Fritsch and Carlson1980). Individual 14C ages are shown as calibrated median probability ages with 2σ errors output by OxCal version 4.2 (Bronk Ramsey, Reference Bronk Ramsey2013) (Supplementary Table 1). The shortened depths (s.depths) are shown as sediment depths with tephra thicknesses being subtracted. Sediment accumulation rates are given as millimeters per year. Brief lithologies are also shown. The red star indicates an accumulation increase ca. 5–5.5 cal ka BP within Lake Richmond (LRi) and Lake Umutekai (LU). Three Taupo volcano tephra layers are recognized and dated: (1) Stent Tephra (mean age from LRi: 4279±47 cal yr BP; age from LU: 4296±92 cal yr BP; age from Lake Rotokare: abnormal), (2) Kawakawa Tephra (age from Eltham Swamp (ES): 25,447±125 cal yr BP), and (3) Okaia Tephra (age from ES: 28,735±143 cal yr BP). For references to color in the figure, please see the online version of this article.
Core descriptions
Lake Richmond
Three almost identical sediment cores from Lake Richmond were used to assemble a 7.4 m long composite core, based on stratigraphic position and physical appearances of prominent tephra layers, repetition of obvious tephra sequences, and distinct lithological changes (Fig. 3). From ca. 15.5 to 12.7 cal ka BP (7.4 to 5.6 m), the sediments mainly consist of horizontally bedded coarse dark peat, interpreted as a peat bog as a precursor of the open-water lake forming at ~12.7 cal ka BP ago (Fig. 3). From ca. 15.4 to 14.5 cal ka BP (7.2 to 6.7 m), the peat is interrupted by a distinct pale-yellow soil horizon containing dispersed lapilli-sized tephra at the bottom (Ri-130; Fig. 3, Supplementary Table 2) and a gradational contact into peat at the top. From ca. 12.7 cal ka BP (5.6 m) to the top of the composite core, sediments are mainly composed of finely laminated, organic-rich, gray lake mud. Between ca. 12.7 and 5.5 cal ka BP (5.6 to 3.7 m), lake sediments are firmer and denser, and tephras are evident as lenses. Above 3.7 m (<5.5 cal ka BP), the accumulation rate increases from ~0.2 to 0.5 mm/yr (Fig. 2), and sediments are more water saturated and soft. The Lake Richmond record shows the best preservation of very thin tephra layers (<1 mm) of all the new cores collected during this study. A total of 132 andesitic tephra layers from Mt. Taranaki were distinguished (Fig. 3, Supplementary Table 2). The core also contains a 2 cm thick, pale-gray rhyolitic tephra layer at 2.87 m (mean age 4279±47 cal yr BP; Fig. 2), which is here correlated to the widespread, Taupo volcanic center–sourced Stent Tephra (also known as unit Q, 4322±112 cal yr BP; Alloway et al., Reference Alloway, Lowe, Chan, Eden and Froggatt1994; Lowe et al., Reference Lowe, Blaauw, Hogg and Newnham2013) based on similar age and chemical glass composition.

Figure 3 Lake Richmond (LRi) sediment cores recovered during this study (R1–R3) and the composite record. Images show prominent tephra layers and their juvenile clast assemblages. Key correlations are marked with dotted red lines (physical/age characteristics). Reworked tephras are abbreviated as “rew.” Ages are shown as calibrated ages with 2σ errors (Supplementary Table 1). For references to color in the figure, please see the online version of this article.
Tariki Swamp
Two sediment cores were correlated based on lithology, radiocarbon ages, and geochemical and physical characteristics of prominent tephra layers to form a 9.3 m long composite core (Fig. 4). The bottom of the composite core consists of dense, dark-gray mud with scattered oxidized vivianite crystals. From ca. 17 to 16 cal ka BP (7.8 to 6.6 m), a bedded sequence of alternating medium sand to organic-rich silt/clay layers occurs, capped by a 10 cm thick, pale-yellow soil horizon (Fig. 4). This sequence is interpreted as fluvial/alluvial deposits. From ca. 16 to 3.4 cal ka BP (6.6 to 2.5 m), the core is mainly composed of dark fibric peat, interrupted by another distinct pale-yellow soil horizon at ca. 11 to 4 cal ka BP (4.1 to 2.7 m), in which thick roots and root channels, as well as occasional large wood fragments, occur. Tephra within the soil horizon occurs only as grains dispersed throughout mainly fine-grained alluvial material (indicated as “reworked” in Fig. 4). At ca. 3.4 cal ka BP (2.5 m), the peat accumulation is interrupted by a pale-gray silt to clay bedded unit (Fig. 4). This prominent fine-grained horizon contains abundant chironomid head capsules, which indicate standing water. This unit grades into peat at ca. 2.7 cal ka BP (1.3 m; Fig. 4). The peat of the upper part of the core consists of coarse, horizontally bedded plant remains (mostly monocotyledonous) and remains of woody vegetation, including conifers and leaves. Such diverse lithologies suggest considerable variation in depositional conditions at this site, which likely have implications for preservation of tephra. Despite this limitation, the Tariki Swamp record preserves tephra sequences that are not recognized in any of the other sites. A total of 64 Taranaki-derived tephra layers were distinguished within the Tariki Swamp (Fig. 4, Supplementary Table 2).

Figure 4 Tariki Swamp (TS) sediment cores recovered during this study (T1–T2) and the composite record. Images show prominent tephra layers and their juvenile clast assemblages. Key correlations are marked with dotted red lines (physical/age characteristics) and dotted purple lines (physical and geochemical characteristics). Reworked tephras are abbreviated as “rew.” Ages are shown as calibrated ages with 2σ errors (Supplementary Table 1). For references to color in the figure, please see the online version of this article.
Ngaere Swamp
A 9.6 m long composite record from Ngaere Swamp was produced by combining the complete Ngaere Swamp core 1 (N1) with the top 1.27 m of Ngaere Swamp core 2 (N2) because the latter preserves more tephra layers <4 cal ka BP (Fig. 5). The bottom part of the composite core consists of several bedded units of medium sand grading to silt/clay. These units are interpreted to be fluvial sediments and are capped by individual pale-yellow soil horizons containing abundant small roots. At ~8.7 m, a thin peat horizon grades into another, ~40 cm thick, soil. The remainder of the core consists entirely of horizontally bedded fibric peat. Apparent accumulation rates between ca. 13.5 and 7 cal ka BP (8 to 3 m; Fig. 5) were roughly constant at 0.6±0.1 mm/yr (Fig. 2). The post–7 cal ka BP accumulation rate was difficult to estimate because of the presence of water-filled voids and large pieces of wood in the peat sequence. Tephra in this part of the sequence appears displaced and/or dispersed within the peat. The uppermost meter of N2, however, is composed of peat with no obvious disconformities, and tephra layers are intact. The composite Ngaere Swamp record includes a total of 68 tephra layers from Mt. Taranaki (Fig. 5, Supplementary Table 2).

Figure 5 Ngaere Swamp (NS) sediment cores recovered during this study (N1–N2) and the composite record. Images show prominent tephra layers and their juvenile clast assemblages. Key correlations are marked with dotted red lines (physical/age characteristics) and dotted purple lines (physical and geochemical characteristics). Reworked tephras are abbreviated as “rew.” Ages are shown as calibrated ages with 2σ errors (Supplementary Table 1). For references to color in the figure, please see the online version of this article.
Eltham Swamp
A 10.95 m long composite record from Eltham Swamp was produced by combining the whole Eltham Swamp core 2 (E2) with the top 1.40 m of Eltham Swamp core 1 (E1), as the latter preserves more tephra layers <4 cal ka BP (Fig. 6). From 30 to 23.5 cal ka BP (10.9 to 7.9 m), the record mainly consists of fibric peat, which is interbedded with horizons of yellow to pale-brown fine-grained material interpreted as volcanic loess. Volcanic loess was common during the cold and dry climate conditions of the last glacial maximum in the North Island of New Zealand (Pillans, Reference Pillans1988; Alloway et al., Reference Alloway, Stewart, Neall and Vucetich1992; Lowe et al., Reference Lowe, Tonkin, Palmer, Lanigan and Palmer2015). The peat is topped with a 10 cm thick horizon of dark-gray mud, followed by a meter of missing sediment. This missing section could be interpreted as a void in the coring record caused by a core logging error and/or as an indicator of the presence of thixotropic muddy sands, which could not be captured in the core barrel. Both explanations still remain a matter of debate. At ca. 15.3 cal ka BP (7 to 6.8 m), the composite core comprises mud gradually grading upward into peat. A hiatus of ~8000 cal yr BP occurs between the mud at 8 and 7 m, spanning the missing sediment section (Fig. 2). This apparently marks a period of erosion and redeposition of fluvial sediment at this site. Above 15.1 cal ka BP (6.8 m), peat composes the remainder of the core (Fig. 6). The Eltham Swamp composite core preserves the oldest tephra layers recorded in this study (30–23.5 cal ka BP; Supplementary Table 2). A total of 80 Taranaki tephra layers were distinguished (Fig. 6). Two distinct rhyolitic tephra layers from the Taupo volcanic center were also recognized, based on geochemical correlation using glass major element composition and similar age: A 2.5 cm thick, pale-white fine ash layer at 8.5 m (25,447±125 cal yr BP), which correlates to the prominent Kawakawa Tephra (25,360±160 cal ka BP; Vandergoes et al., Reference Vandergoes, Hogg, Lowe, Newnham, Denton, Southon and Barrell2013), and a 3 cm thick, yellow coarse ash to fine lapilli tephra layer at 10.3 m (28,735±143 cal yr BP), which correlates to the Okaia Tephra (28,621±1428 cal yr BP; Lowe et al., Reference Lowe, Blaauw, Hogg and Newnham2013).

Figure 6 Eltham Swamp (ES) sediment cores recovered during this study (E1–E2) and the composite record. Images show prominent tephra layers and their juvenile clast assemblages. Key correlations are marked with dotted red lines (physical/age characteristics) and dotted purple lines (physical and geochemical characteristics). Reworked tephras are abbreviated as “rew.” Ages are shown as calibrated ages with 2σ errors (Supplementary Table 1). For references to color in the figure, please see the online version of this article.
Titanomagnetite groups
We analyzed titanomagnetite phenocrysts from approximately 200 tephra layers present within the nine newly studied cores and reviewed the titanomagnetite data from two previous cores analyzed by Turner (Reference Turner2008). All analyses are presented as bivariate plots of TiO2 versus Al2O3+MgO, TiO2 versus Fe3+, Al2O3 versus MgO, and Fe2+ versus Fe3+, which illustrate the 12 individual titanomagnetite groups at Mt. Taranaki (Fig. 7, Table 1). The boundaries between the groups were established based on consistent differences in the major element concentrations, which vary between 0.5 and 1.0 wt% for TiO2 and Al2O3+MgO and <0.1 cation proportion for Fe2+ and Fe3+. Although most of the tephra layers have homogenous titanomagnetite compositions, some show a distinct bimodality (represented as filled triangles in Fig. 7). A few tephra layers have diverse titanomagnetite compositions and therefore cannot be classified into any specific titanomagnetite group (i.e., U-39, Ri-65, Rk-39, N-32, U-83, and U-87; represented as empty diamonds in Fig. 7).

Figure 7 Compositions of titanomagnetite phenocrysts recognized in lake and peat deposits of Mt. Taranaki. Each point is the average +1 standard deviation for each tephra layer (left) and for each titanomagnetite group (right). Twelve individual titanomagnetite groups are represented by colors, with empty diamonds indicating variable titanomagnetite compositions that could not be classified to any group. Bimodal titanomagnetite compositions are represented as filled triangles. Analyses in weight percent (wt%) and cation proportion (cat. prop.) calculated on the basis of four oxygen atoms as in Carmichael (Reference Carmichael1967). Major and minor element compositions of each titanomagnetite group are summarized in Table 1. For explanation of colored symbols, please see the online version of this article.
Table 1 Composition of 12 individual titanomagnetite groups recognized in tephra layers from lake and peat sediment cores recovered during this study. Refer also to Figure 7.

Notes: Titanomagnetite (Tm) compositions of individual groups are given as average (Avg.) with 1 standard deviation (±SD). n-tephra = number of tephra layers that have been analyzed and classified within the representative group. The complete compositional datasheet with titanomagnetite composition of each tephra layer is available from the author. FeO, Fe2O3, cation proportions, and Usp (mole fraction ulvöspinel) calculated as in Carmichael (Reference Carmichael1967).
a Additional analysis of gray lapilli tephra layer within the Eltham Swamp core recovered by McGlone and Neall (Reference McGlone and Neall1994).
In general, titanomagnetite TiO2 contents range from >10 wt% (titanomagnetite group 1) to <7 wt% (titanomagnetite groups 11 and 12) (Fig. 7, Table 1). Within the entire suite, TiO2 varies inversely with FeOtotal or, more precisely, with Fe3+. There is only a minor variability in Fe2+, with titanomagnetite group 11 having the lowest Fe2+ contents (<1 cation proportion; Fig. 7). Al2O3+MgO contents range from <4 wt% in titanomagnetite group 10 to >11 wt% in group 11 (Fig. 7). The data display two compositional trends from high-TiO2 and high-Al2O3+MgO contents to low-TiO2 and low-Al2O3+MgO concentrations, represented by titanomagnetite groups 1 to 10 and groups 11 to 12 (Fig. 7).
Glass chemistry
Volcanic glass shards from a total of 89 tephra layers present in the cores were analyzed (Supplementary Table 3), along with the glass shard data from previous cores analyzed by Turner (Reference Turner2008). Glasses in Mt. Taranaki tephras have a large compositional range, from basalt-andesitic to trachytic and rhyolitic compositions (Figs. 8 and 9). This wide range has been observed before, with andesitic whole-rock compositions often having dacitic to rhyolitic glass (Price et al., Reference Price, Gamble, Smith, Stewart, Eggins and Wright2005). K2O contents of the glasses measured here are mainly >4 wt% with the exception of the Manganui Tephra(s), erupted from the parasitic Fanthams Peak vent at ca. 3 cal yr BP (Fig. 8). The lower-alkali glass shard chemistry of the Taupo-derived tephra layers present within the studied cores is also shown for comparison and contrast (Fig. 9).

Figure 8 Glass major element compositions of Tephra Sequences A–F defined in lake and peat sediment cores from Mt. Taranaki (Supplementary Table 3). Normalized analyses are plotted as total alkalis versus silica with compositional fields of basalt-andesitic (bA), basalt-trachyandesitic (bTA), trachyandesitic (TA), trachydacitic (TD), and rhyolitic (R). Colors represent the dominant titanomagnetite group of each tephra sequence (refer to Figs. 7 and 10). wt%, weight percent. For explanation of colored symbols, please see the online version of this article.

Figure 9 All glass compositional data from Tephra Sequence A-F summarized on plots of total alkali, FeOtotal, CaO vs SiO2. The Taupo volcano-tephras (i.e., Stent, Kawakawa, Okaia) are also shown. Colors represent the dominant titanomagnetite group of each tephra sequences (refer to Figs. 7 and 10). For explanation of colored symbols, please see the online version of this article. bA, basalt-andesitic; bTA, basalt-trachyandesitic; R, rhyolitic; TA, trachyandesitic; TD, trachydacitic; wt%, weight percent.
Discrimination of tephra sequences
Within the records produced in this study, stratigraphically adjacent tephra layers typically have similar titanomagnetite compositions, which, in conjunction with precise age determination of the tephra layers, enable us to subdivide the whole eruption sequence into six geochemically and stratigraphically distinct tephra sequences (sequences A–F; Fig. 10). The tephra sequences are characterized by their dominant titanomagnetite group (e.g., Tephra Sequence E has titanomagnetite group 1 compositions), but there are a few intercalated tephra layers with aberrant titanomagnetite compositions. Some titanomagnetite compositional groups occur repeatedly through time and therefore occur within several tephra sequences. The suite of the six tephra sequences creates a time-constrained geochemical pattern that is traceable through all sediment cores and therefore enables sequence correlation, even though correlation cannot be extended to the individual tephra bed level (Fig. 10). Defined tephra sequences are described in detail subsequently, including their dominant (and subordinate) titanomagnetite compositional groups, glass chemistry, and physical appearance. A summary of the physical, mineralogical, and chemical properties, as well as ages, of all tephra layers within each composite core is given in the Supplementary Table 2.

Figure 10 Summary of sediment cores taken during this study and previous studies of Turner (Reference Turner2008) showing individual tephra layers (thickness and depth of tephra indicated by horizontal bars; titanomagnetite group of each analyzed tephra indicated by colored bars [refer to Fig. 7, Table 1]; reworked tephras are abbreviated as “rew.”) and radiocarbon dating points (given in calibrated ages; Supplementary Table 1). The nomenclature of individual tephra layers is based on their stratigraphic order within the composite core (refer also to Figs. 3–6). Tephra Sequences A–F are indicated by colored shaded fields. Correlation of individual members and/or groups of members is indicated by black dashed lines and/or described in the text. Tephra layers characterized by a bimodal titanomagnetite composition are denoted with an asterisk (refer also to Fig. 7). Tephra layers characterized by variable titanomagnetite compositions are denoted with parentheses (refer also to Fig. 7). For explanation of colored symbols, please see the online version of this article.
Tephra Sequence F (30–23.5 cal ka BP)
Tephra Sequence F is only represented in the Eltham Swamp record and comprises at least 39 Taranaki tephra layers, which mainly have a group 1 titanomagnetite composition (Figs. 7 and 10, Table 1). Most tephra layers of Tephra Sequence F have trachyandesitic to trachydacitic glass compositions, with SiO2 <65 wt% and FeOtotal mainly ~4.5 wt% (Figs. 8 and 9). The 9 cm thick unit E-79 (29,855±274 cal yr BP) is a prominent tephra in this sequence. It comprises bedded, pale-gray to gray, vesicular pumice fragments and gray to reddish-brown lithics (Fig. 6). This tephra also stands out as compositionally more evolved, with ~69 wt% SiO2 (Fig. 8) and, together with E-78 and E-77, has distinctively lower Al2O3+MgO and TiO2 titanomagnetite compositions (titanomagnetite group 8; Figs. 7 and 10, Table 1) compared with the dominant titanomagnetite population of the suite. A sequence of tephra layers deposited in paleolake sediments in the Auckland region, 270 km NNE of Mt. Taranaki (Eg28.9 to Eg23.5; Shane, Reference Shane2005), is geochemically similar to tephras of Tephra Sequence F described here. In particular, the tephra Eg28.9 recognized in the Pukaki Lagoon sediments (Shane, Reference Shane2005) is a likely distal correlative of E-79 because of its distinctive evolved glass composition underlying a mainly trachyandesitic/dacitic tephra sequence. The occurrence of the Kawakawa Tephra (25,360±160 cal yr BP; Vandergoes et al., Reference Vandergoes, Hogg, Lowe, Newnham, Denton, Southon and Barrell2013) within Tephra Sequence F allows correlation to the Poto Tephra Formation described by Alloway et al. (Reference Alloway, Neall and Vucetich1995), whereas tephra layers surrounding the Okaia Tephra (28,621±1428 cal yr BP; Lowe et al., Reference Lowe, Blaauw, Hogg and Newnham2013) are correlated to the Tuikonga and Koru Tephra Formations (Alloway et al., Reference Alloway, Neall and Vucetich1995), although correlation at the individual bed level is not possible at present.
Tephra Sequence E (17.5–14 cal ka BP)
Tephra Sequence E is stratigraphically separated from Tephra Sequence F by a hiatus of ca. 8000 cal yr BP (Fig. 10). Tephra Sequence E is best represented in the Tariki Swamp record and comprises at least 35 Taranaki-derived tephra layers, which all have a group 1 titanomagnetite composition (Figs. 7 and 10, Table 1). Tephra Sequence E is mainly characterized by dark-gray, medium ash to lapilli, occasionally graded tephra layers (Fig. 4, Supplementary Table 2), which have trachyandesitic to trachydacitic glass compositions (59–62 wt% SiO2) and high FeOtotal glass contents (>4 wt%; Figs. 8 and 9). The most prominent tephra within this sequence is the 3 cm thick T-64 (17,397±96 cal yr BP), which is composed of dark-brown to black, scoriaceous, banded medium pumice lapilli, along with common dark-gray altered lithics (Fig. 4). Similar physically distinctive tephra layers include a medium ash T-51 (15,960±106 cal yr BP) and a normally graded, lithic-rich, coarse ash T-45 (15,642±123 cal yr BP). Tephra Sequence E is likely correlated to the Kaihouri and Paetahi Tephra Formations (>15 cal ka BP; Alloway et al., Reference Alloway, Neall and Vucetich1995). Tephra layers of similar age and composition occur in Auckland’s Pukaki Crater (AT203, T19, and AT206; ~15.8 to 17.7 cal ka BP; Sandiford et al., Reference Sandiford, Alloway and Shane2001) and the Waikato lakes (Eg13 and Eg14; ~17.5 cal ka BP; Lowe, Reference Lowe1988b).
Tephra Sequence D (14–9.5 cal ka BP)
Tephra Sequence D is preserved in most cores but is best represented in the Ngaere Swamp record, which comprises at least 37 Taranaki-derived tephra layers. It is dominated by tephra layers having a group 2 titanomagnetite composition (Figs. 7 and 10, Table 1) and mainly trachydacitic glass shard compositions (Figs. 8 and 9). In general, Tephra Sequence D is characterized by sets of closely spaced tephra layers indicating eruption within periods of ~50–150 yr. The majority of tephras are pale-gray to gray, coarsely vesicular coarse ash to medium pumice lapilli (Figs. 3–6, Supplementary Table 2). The pumice contains abundant large phenocrysts of mainly clinopyroxene (augite), hornblende, plagioclase, and titanomagnetite. Some tephra layers and/or groups of tephras have titanomagnetite compositions that vary from the dominant suite with group 2 compositions, which enables their discrimination and correlation across the sediment cores taken (Figs. 7 and 10), as described subsequently.
At the base of Tephra Sequence D, tephras N-68 and N-67 (correlative to E-41-38 and T-29-27; >13 cal ka BP; Fig. 10) are mainly composed of white to pale-gray, pumiceous and crystal-rich coarse ash to fine lapilli (Supplementary Table 2). Their glass compositions are mainly trachydacitic with silica contents of about 68 wt%, except for tephras T-27 and T-28, which have variable glass compositions reaching rhyolitic compositions up to 70 wt% SiO2 (Fig. 8). Titanomagnetite compositions are distinctively lower in Al2O3+MgO contents (<6 wt%, titanomagnetite group 3; Fig. 7, Table 1) compared with the dominant titanomagnetite population of Tephra Sequence D. This aberrant tephra group may correlate to two tephra layers recognized in the Pukaki crater lake, Auckland region (T7 and AT193; Sandiford et al., Reference Sandiford, Alloway and Shane2001), based on similar high-silica glass compositions, and may also represent the Mahoe Tephra Formation (~13 cal ka BP) described by Alloway et al. (Reference Alloway, Neall and Vucetich1995) based on a similar age range.
The original informally named “Mahoe tephra” (Franks et al., Reference Franks, Neall and Pollock1991) is not related to the later-defined Mahoe Tephra Formation of Alloway et al. (Reference Alloway, Neall and Vucetich1995), as shown by physical and compositional differences (latter undertaken by Wallace, Reference Wallace1987). Here it is considered that the original Mahoe tephra of Franks et al. (Reference Franks, Neall and Pollock1991) is more likely to represent a tephra within the Konini Tephra Formation of Alloway et al. (Reference Alloway, Neall and Vucetich1995).
Tephra layers N-63 to N-58 (correlative to E-34-32, and T-25-23; <13 cal ka BP; Fig. 10) have trachyandesitic to trachydacitic glass compositions with low silica contents <66 wt% and high FeOtotal values ~4 wt% (Figs. 8 and 9), distinctively different from the preceding tephra group described previously. Titanomagnetites have high Al2O3+MgO and TiO2 contents (titanomagnetite group 1; Fig. 7, Table 1). Prominent tephra N-58 (12,370±104 cal yr BP) is a 6 cm thick, well-bedded, coarse ash to medium lapilli layer composed of gray to dark-gray (yellow-coated), vesicular, and banded pumice fragments, with up to 50% gray to black and rare reddish dense lithics (Fig. 5). Tephra layers N-63 to N-58 thus may correlate to the Konini Tephra Formation (~12 cal ka BP; Alloway et al., Reference Alloway, Neall and Vucetich1995), which was previously correlated by Alloway et al. (Reference Alloway, Neall and Vucetich1995) to a gray lapilli layer dated at ~11,683±207 cal yr BP in the Eltham Swamp record (McGlone and Neall, Reference McGlone and Neall1994). In the course of this study, this gray lapilli layer was shown to have consistent group 1 titanomagnetite compositions (Table 1). A tephra in the Kaipo bog, 260 km ENE of Mt. Taranaki (anal. 19a; Lowe et al., Reference Lowe, Newnham and Ward1999, Reference Lowe, Shane, Alloway and Newnham2008); two tephra layers in the Onepoto Basin, Auckland (Eg12.3 and Eg11.7; Shane, Reference Shane2005); and a tephra in the Pukaki crater lake, Auckland (AT191; Sandiford et al., Reference Sandiford, Alloway and Shane2001), have similar glass compositions and are therefore likely correlatives to tephra layers N-63 to N-58 within Tephra Sequence D. Alloway et al. (Reference Alloway, Neall and Vucetich1995) tentatively correlated one of their Konini tephras (Konini.b) to a tephra layer preserved within sediments of the Waikato lakes (Eg11; Lowe, 1988b), but geochemistry does not support this correlation, because Eg11 has a distinctively more evolved glass composition than Konini correlatives N-63 to N-58. The Konini.b tephra was defined as a regional chronostratigraphic marker horizon for the Pleistocene-Holocene boundary (Lowe et al., Reference Lowe, Blaauw, Hogg and Newnham2013).
Younger tephra layers N-54 to N-52 (correlative to E-28, parts of Ri-118, and U-103), N-51 to N-47 (correlative to E-26 and parts of Ri-117), N-46 to N-45 (correlative to Ri-113), and N-42 (correlative to parts of E-23) (Fig. 10) show distinctively lower TiO2 contents (<9 wt%; titanomagnetite groups 7, 5, and 4; Fig. 7, Table 1). A tephra layer within sediments of the Waikato lakes (Eg9; Lowe, 1988b) has a titanomagnetite composition similar to N-46 and N-45 (~10.6 cal ka BP) and is therefore correlated to Tephra Sequence D. Eg9 and Eg10 have been previously correlated to the Kaponga Tephra Formation (~10 cal ka BP; Alloway et al., Reference Alloway, Neall and Vucetich1995). Tephra N-32 (9519±36 cal yr BP) is a prominent 5 cm thick, pale-gray microvesicular pumiceous coarse ash (Fig. 5). Its titanomagnetite composition is distinctively broad, similar to tephra units U-87 and U-83. These units are representative of the transition between Tephra Sequences D and C. Although correlation of most of these tephra layers/groups can be made between the different cores, correlation to individual beds at medial sites remains extremely challenging as a result of many tephra layers having similar characteristics and compositions within the general age range of the Kaponga Tephra Formation (Alloway et al., Reference Alloway, Neall and Vucetich1995).
Tephra Sequence C (9.5–4 cal ka BP)
Tephra Sequence C is present in all cores including those previously studied by Turner (Reference Turner2008). It is best represented within the Lake Umutekai record, where it includes up to 60 Taranaki tephra layers (Fig. 10). Tephra Sequence C features the thickest and coarsest tephras encountered in this study (Supplementary Table 2). They have predominantly a group 8 titanomagnetite composition, characterized by low Al2O3+MgO and TiO2 contents (5–6 wt% and 8–9 wt%, respectively; Fig. 7, Table 1). Glass compositions are mainly trachydacitic to rhyolitic, with silica contents >65 wt% (Figs. 8 and 9). A few tephra layers in the lower part of this tephra sequence have higher TiO2 concentrations (9–10 wt%, titanomagnetite group 3; Fig. 7, Table 1) and/or a distinct bimodal composition (i.e., titanomagnetite groups 3 and 11; Fig. 7, Table 1). This sequence of tephras allows discrimination between the lower and upper part of Tephra Sequence C.
The lower part of Tephra Sequence C (9.5 to ca. 6.8 cal ka BP) includes several lithic-rich and microvesicular pumice layers, such as N-21 to N-24 (~7.2 cal ka BP). The 2 cm thick N-27 (8090±46 cal yr BP) is mainly composed of fine to medium, pale-gray to gray dense and microvesicular lithic lapilli, some of which are color banded (Fig. 5, Supplementary Table 2). Some of these tephra units (i.e., N-26, N-22 to N-24, U-67, U-60, E-15) have a distinct bimodal titanomagnetite composition (Fig. 7, Table 1). Their glass composition is mainly trachydacitic (~68 wt% SiO2), with some showing a broad variation (Fig. 8). Based on similar compositional characteristics, tephra Eg7, recognized in sediments of the Waikato lakes (~6.6 cal ka BP; Lowe, Reference Lowe1988b) is here correlated to the lower part of Tephra Sequence C.
The upper part of Tephra Sequence C (ca. 6.8 to 4 cal ka BP) includes a distinctive 7 cm thick tephra, Ri-70 (5534±48 cal yr BP), composed of pale-gray, vesicular, banded coarse to fine pumice lapilli and rare gray dense lithic lapilli (Fig. 3). Its titanomagnetite composition is slightly lower in Al2O3+MgO (titanomagnetite group 9; Fig. 7, Table 1) than the dominant titanomagnetite population of Tephra Sequence C. Furthermore, its glass composition is high in silica content (~69 wt%; Fig. 8) and correspondingly low in FeOtotal and CaO (Supplementary Table 3). Tephra layers N-19 (6862±53 cal yr BP), E-13 (6366±44 cal yr BP), and Rk-35 (6218±81 cal yr BP) have similar compositional characteristics (Figs. 7, 8, and 10). Younger tephras Ri-60 and Ri-58 (4878±46 and 4801±49 cal ka BP, respectively) within the upper part of Tephra Sequence C have homogenous glass compositions with silica contents ~67 wt% (Fig. 8). Ri-60 is a 5 cm thick, pale-gray, highly vesicular pumice lapilli layer with rare altered lithics. Ri-58 is a 3 cm thick, pale-gray, pumiceous medium ash with rare gray lithics and common free crystals (Fig. 3). These tephras correlate across sites to U-34 and U-33 (4884±58 and 4839±55 cal yr BP, respectively) based on similar physical and geochemical characteristics. One of the youngest tephra units within the upper part of Tephra Sequence C is Ri-51 (4328±51 cal yr BP), which underlies the Stent Tephra (mean age of 4279±47 cal yr BP; Fig. 2). It is an 8.5 cm thick, well-sorted, pale-gray, pumiceous medium ash with abundant free crystals and minor lithics (Fig. 5). Its glass contains ~68 wt% SiO2 (Fig. 8). Based on similar composition and stratigraphic position, distal tephra layers Eg6, Eg5, and Eg4 in the Waikato lake sequence (~6 to 4.3 cal ka BP; Lowe, Reference Lowe1988b) are here correlated to the upper part of Tephra Sequence C.
Unfortunately, correlation of individual tephra layers of Tephra Sequence C to any proximal/medial site was not possible, because of age discrepancies in the existing stratigraphic reconstructions of Neall (Reference Neall1972, Reference Neall1979), Franks et al. (Reference Franks, Neall and Pollock1991), and Alloway et al. (Reference Alloway, Neall and Vucetich1995).
Tephra Sequence B (4–3 cal ka BP)
Tephra Sequence B is preserved in all of the cores but is most prominent with at least 17 Taranaki-derived tephra layers in the Lake Richmond and Lake Umutekai records (Fig. 10). All tephra layers contain titanomagnetite group 10 composition (Fig. 7, Table 1). Glass shards have high SiO2 contents (>69 wt%; Fig. 9), with a general trend of increasing silica and potassium concentrations with decreasing age of the tephra units (Fig. 8). The oldest tephra layers within Tephra Sequence B include the prominent Ri-47 (3893±46 cal yr BP; Fig. 3), an 8 cm thick, pale-gray to yellow, vesicular, banded medium ash to pumice lapilli with gray, dense, and minor red lithic lapilli. The upper 2 cm of this tephra is composed of finely laminated ash (Fig. 3). Its stratigraphic position suggests correlation with tephra layers U-25 and Rk-23/Rk-21. However, the physical appearance of the latter tephras (Turner, Reference Turner2008) suggests closer affinity to younger tephras within Tephra Sequence B, described subsequently. At present, no proximal counterpart has been identified for tephra Ri-47.
The following tephra layers within Tephra Sequence B are composed of pale-gray fine ash, which may host white coarse pumice lapilli (i.e., Ri-40, 3510±45 cal yr BP; Figs. 3 and 10). Pumice clasts have a distinctive finely vesicular texture and high silica contents (70–72 wt%; Fig. 8), with low CaO and FeOtotal contents (Supplementary Table 3). Similar compositions and physical characteristics are reported for tephra units U-20 (3674±61 cal yr BP), E-8 (3593±43 cal yr BP), and N-9/N-8 (3365±65 and 3216±67 cal yr BP, respectively) (Figs. 7, 8, and 10; Supplementary Table 2). These tephra layers, as well Rk-23/Rk-21, are correlated to the prominent Inglewood Tephra Formation (~4–3.8 cal ka BP; Alloway et al., Reference Alloway, Neall and Vucetich1995). Lapilli tephra N-8 is distinct in that it has a higher lithic content (up to 50%) compared with older tephra N-9, which contains only a few lithics, and both are therefore correlated with Inglewood-b and Inglewood-a, respectively (Alloway et al., Reference Alloway, Neall and Vucetich1995). The same was observed for correlatives Rk-21 and Rk-23, respectively. Tephra layers T-15 and T-14 appear to be mixtures of Ri-47 and Ri-40 and are therefore considered to be reworked tephra material rather than in situ fall units (Fig. 10). Alloway et al. (Reference Alloway, Neall and Vucetich1995) correlated the Inglewood Tephras to two tephra layers preserved within sediments of the Waikato lakes (Eg2 and Eg3; Lowe, 1988b). However, geochemical evidence obtained in this study does not support this correlation, because Eg2 has a titanomagnetite composition similar to tephra layers recognized in the older Tephra Sequence C.
The youngest tephra layers within Tephra Sequence B (<3.3 cal ka BP) are only found in the Lake Richmond and Lake Umutekai records (Fig. 10) and include several thin (<1 cm), pale-gray, fine ash layers, commonly with orange-stained upper contacts (Fig. 3). They have high silica contents ~72–74 wt% (Fig. 8). No proximal/medial counterpart could be distinguished, but these tephra units could be associated with block-and-ash flow events, as past studies have shown that these may travel beyond 15 km from their source at Mt. Taranaki (Platz et al., Reference Platz, Cronin, Cashman, Stewart and Smith2007; Procter et al., Reference Procter, Cronin, Platz, Patra, Dalbey, Sheridan and Neall2010).
Tephra Sequence A (3–0.5 cal ka BP)
Tephra Sequence A is preserved in all of the cores but is most prominent in the Lake Richmond record, where it includes up to 32 Taranaki-derived tephra layers (Fig. 10). Tephra sequence A features two physically and compositionally different types of intercalating tephra layers (types I and II), as described subsequently.
Type I tephras are characterized by a group 11 titanomagnetite composition, having the highest Al2O3+MgO contents (up to 11 wt%, Fig. 7, Table 1) seen in this study, as well as low FeOtotal and MnO contents (<78 wt% and ~0.6 wt%, respectively, Table 1). Type I tephras have basalt-trachyandesitic to trachyandesitic glass compositions (Figs. 8 and 9) with high FeOtotal (>5 wt%), CaO (>4 wt%), and MgO (>2 wt%) contents (Supplementary Table 3). Physically, type I tephras feature black to dark-gray microvesicular dense-scoriaceous lapilli to coarse ash, brown microvesicular dense-scoriaceous lapilli to coarse ash with a distinct porphyritic texture, and/or pale-gray to gray microvesicular pumice lapilli to coarse ash with large hornblende phenocrysts and prominent red to purple scoriaceous lapilli (Figs. 3–6, Supplementary Table 2). Most of these tephra layers are repetitively graded and are several centimeters in thickness. The unique morphology, compositions, and stratigraphic position indicate that these tephras are correlatives of the prominent Manganui Tephra Formation (~3 cal ka BP; Alloway et al., Reference Alloway, Neall and Vucetich1995), although single-bed correlation was not possible. However, based on similar physical and compositional characteristics, it is possible to correlate some of these tephra layers across the sediment cores taken (specifically N-6 to E-5 to Rk-18, N-7 to E-6, Ri-26/25 to T-10, and, tentatively, E-7 to Rk-19; Fig. 10).
Type II tephras are characterized by a group 12 titanomagnetite composition, having low and variable Al2O3+MgO contents (4–7 wt%) along with constant low TiO2 contents (<7 wt%; Fig. 7, Table 1). Type II tephras have trachydacitic glass compositions (Figs. 8 and 9) and are mainly composed of pale-gray to gray pumiceous lapilli (Fig. 4, Supplementary Table 2). The inversely graded tephra Ri-20 (2122±37 cal ka BP), along with T-8 and T-7 (2170±29 and 2118±28 cal ka BP, respectively), correlate to the Maketawa Tephra Formation (Alloway et al., Reference Alloway, Neall and Vucetich1995), whereas tephras above prominent Manganui tephra T-4 may correlate to the Curtis Ridge Lapilli (<1.8 ka BP; Turner et al., Reference Turner, Cronin, Smith, Stewart and Neall2008c). Tephra layers younger than <1 cal ka BP are characterized by several thin (<1 cm) and fine ash beds, from which Ri-2 (517±10 cal yr BP) has a bimodal titanomagnetite composition similar to titanomagnetite groups 11 and 12 (Figs. 7 and 10, Table 1).
Within Tephra Sequence A, a prominent tephra in the southeastern cores (N-2, E-1, and Rk-10) has anomalously high TiO2 contents (>9 wt%, titanomagnetite group 2; Fig. 7, Table 1). Glass shard compositions are trachydacitic with high FeOtotal contents (>4 wt%, Fig. 8, Supplementary Table 3). Further, a second unusual tephra (Ri-10 and U-4) was recognized with a titanomagnetite group 6 composition (Figs. 7 and 10, Table 1). This unit has likewise a trachydacitic glass composition with a high FeOtotal content (>4 wt%, Supplementary Table 3). As yet, no proximal counterparts for these tephra layers have been identified.
Discussion
Correlation using defined tephra sequences
Previous studies at Mt. Taranaki have shown that because of similarities in appearance and bulk composition, as well as ambiguously defined tephra formations that often comprise multiple units, correlation between individual andesitic tephra layers is a challenging task (e.g., Neall, Reference Neall1972; Alloway et al., Reference Alloway, Neall and Vucetich1995; Cronin et al., Reference Cronin, Wallace and Neall1996; Platz et al., Reference Platz, Cronin, Cashman, Stewart and Smith2007, Reference Platz, Cronin, Procter, Neall and Foley2012; Turner et al., Reference Turner, Bebbington, Cronin and Stewart2009, Reference Turner, Cronin, Bebbington, Smith and Stewart2011a). Correlation was further complicated by the fact that the sequences studied were incomplete, study sites were far apart, and the degree of chronological control was relatively poor. The new highly detailed tephra record developed in this study has shed new light on andesitic tephra correlations in the Taranaki region. For the first time, packages of physically and geochemically similar tephra layers can be identified as characteristic of specific tephra sequences. This, in turn, facilitates more robust correlation between different sites to derive a composite record encompassing at least 228 tephra layers spanning the last 30 cal ka BP (Fig. 11). Although the overall tephra total of 228 is possibly underestimated because only the best-preserved and most complete tephra sequences from single sites and some temporal distinct tephra groups could be considered for merging, this tephra record is one of the most detailed and continuous ever constructed for an andesitic stratovolcano.

Figure 11 Lake and peat composite tephra record encompassing at least 228 tephra layers from Mt. Taranaki spanning the last 30 cal ka BP. The composite record has been constructed using the best-preserved and most complete tephra sequences from single sites (TS, Tephra Sequence presented as color; refer also to Figs. 7 and 10) and temporal distinct tephra groups, which could be linked to the main sequence. For explanation of colored symbols, please see the online version of this article.
Correlation to single subaerial (i.e., cover-bed sequences) and on-flank localities is still a challenging task because little geochemical data from these sites are available at present, and proximal sequences at Taranaki are very complex, reflecting long and variable eruption sequences (Torres-Orozco et al., in press). Previously reported proximal tephra correlations are based solely on physical appearance and stratigraphic position and have been shown in this study to be unreliable. As a consequence of poor age control and incomplete preservation, unit-to-unit correlations that are resolved within only hundreds of years from site to site may indeed have several tens of potential correlatives. The data set obtained in this study has already revealed the vast extent of possible eruptive events at Mt. Taranaki, and it can be already used to link distal deposits in other key New Zealand Quaternary tephra records to the newly built stratigraphic framework.
Tephra deposition/preservation
The primary controls on tephra deposition at any of the studied sites are the eruption behavior along with wind direction and speed. Although the prevailing winds in the North Island were southwesterly to westerly over at least the past 20 ka BP (e.g., Salinger, Reference Salinger1984; Stewart and Neall, Reference Stewart and Neall1984; Drost et al., Reference Drost, Renwick, Bhaskaran, Oliver and McGregor2007; Turner et al., Reference Turner, Moore, Pardo, Kereszturi, Uddstrom, Hurst and Cronin2014), any small-scale transient wind variations, vertical stratification of the wind profile, and/or fluctuations in the eruption column height may lead to tephra being deposited in narrow bands, and thus only in isolated sites. A good example is the prominent Manganui tephra T-4, which was only recognized in the Tariki site (Fig. 10). The 7.5 cm thick, coarse ash to fine lapilli layer shows shower bedding, which suggests a long, pulsating eruption under strong westerly wind conditions. A compositionally distinct tephra layer (N-2, E-1, Rk-10) within the upper part of Tephra Sequence A has been documented only in the southeasterly records, suggesting a restricted tephra dispersal of this unknown eruption to the southeast. Furthermore, Inglewood Tephra correlatives Ri-40, N-8, and E-8 are diverse in their bed and grain-size characteristics. Layer Ri-40 consists of a 1 cm thick bimodal tephra bed composed of fine ash encompassing few fine pumice lapilli (up to 1 cm diameter) in the northeast, and 2.5 to 4 cm thick tephras N-8 and E-8 comprise only very fine pumice lapilli (<8 mm diameter) in the southeast (Supplementary Table 2). Distribution and grain-size variations suggest that the direction of the plume may have changed from northeast to southeast because of transitioned westerly winds. This is in agreement with recent plume reconstructions of Torres-Orozco et al. (in press). Overall, it is critical that comprehensive eruption records are built up from multiple records, ideally in a close arc around a volcano, to understand possible ash-fall dispersal patterns and eruption style changes.
Regarding the deposition site conditions, this study concentrated on wetland areas, which are known to be particularly good preservation sites for tephra falls. Lacustrine sediments were by far the best for continuous and complete preservation of tephra, with <1 mm layers being well preserved (e.g., see references to taphonomy in Payne and Gehrels, Reference Payne and Gehrels2010; Lowe, Reference Lowe2011; Watson et al., Reference Watson, Swindles, Lawson and Savov2016). By contrast, tephra layers at the millimeter scale are often dispersed within fibrous peat deposits, and thus, original thicknesses are difficult to estimate. Paludal environments (mainly fens and bogs) have vigorously growing surface vegetation and often deep root systems. These are frequently exposed to surface bioturbation and other common surface processes (e.g., flooding and drying) which strongly influence tephra preservation. Variability of these processes and subtle differences in drainage and vegetation across a large peatland also lead to differences between peat cores taken only 400 m apart (i.e., Tariki Swamp cores; Fig. 4). Irregular or diffuse contact of tephra with peat (Supplementary Table 2) reflects deposition on and between vegetation, along with root bioturbation once buried. Slow peat accumulation rates mean that tephras from several closely timed eruptions are often intermixed. Furthermore, localized variations in sedimentation (e.g., alongside ephemeral streambeds or at the base of alluvial slopes; Jenny, Reference Jenny1994) and climate-induced sedimentation changes (e.g., increased fluvial activity during wetter interglacial/interstadial periods or loess/eolian deposition during cool/dry periods) also play a crucial part in tephra preservation at any site. In all the sites studied, the basal parts of most sediment cores contain an increased nonvolcanogenic clastic component, consistent with periglacial processes prevalent during the last glacial to interglacial transition period in New Zealand (~18–12 cal ka BP; Barrell et al., Reference Barrell, Almond, Vandergoes, Lowe and Newnham2013). For all of these reasons, it is important to obtain at least two sediment cores per peatland site to track possible tephra preservation issues and build the most complete composite core possible.
The lacustrine sediment cores recovered during this study show little evidence for bioturbation, mixing of tephras, and nonvolcanogenic clastic sediments, except for Lake Rotokare, which had periodic influxes of muddy sediment from the steep surrounding Tertiary hill country (Turner et al., Reference Turner, Cronin, Bebbington, Smith and Stewart2011a). However, in such sites, a tephra can be reworked by bottom currents and/or wave action, as well as washed or blown in from the catchment area (e.g., Fisher and Schmincke, Reference Fisher and Schmincke1984; Green and Lowe, Reference Green and Lowe1985; deFontaine et al., Reference deFontaine, Kaufman, Anderson, Werner, Waythomas and Brown2007; Watson et al., Reference Watson, Swindles, Lawson and Savov2016). Apart from a few possibly reworked units, tephra layers in all three sediment cores taken from Lake Richmond were effectively identical. Furthermore, a similar tephrostratigraphy at Lake Umutekai compared to Lake Richmond suggests that the tephra deposition rate in both lakes is reasonably steady (Fig. 2). In contrast, the variable sedimentation regime at Lake Rotokare has a possible influence on tephra preservation and subsequent age determinations, which should be considered with caution. A distinct doubling of the sedimentation rate at ca. 5.5 cal ka BP (Fig. 2) was recognized in both the Lake Richmond and Lake Umutekai records. This apparent change in the sedimentation rate potentially reflects either lower compaction and/or diagenesis of the upper sediments or a genuine increase in the sedimentation rate in response to increasing rates of organic material supply to the lake in the late Holocene (McGlone et al., Reference McGlone, Howorth and Pullar1984; McGlone and Neall, Reference McGlone and Neall1994). Some tephra layers in the lower sequence of the Lake Richmond were preserved as pockets of tephra (i.e., lenses) rather than discrete tephra layers. Such a mode of preservation could imply greater water currents caused by higher winds and/or lake-level lowering during dry and cold climate conditions, common during frequent climate fluctuations of the late Holocene (Newnham et al., Reference Newnham, Lowe and Green1989; Mayewski et al., Reference Mayewski, Rohling, Stager, Karlén, Maasch, Meeker and Meyerson2004; Brook et al., Reference Brook, Neall, Stewart, Dykes and Birks2011).
Preliminary implications for Mt. Taranaki’s magmatic system
Compositional variations in the titanomagnetite phenocrysts and the glass shards follow two distinct evolutionary trends over time. The first is a change from trachyandesitic glass of Tephra Sequence E to rhyolitic glass of Tephra Sequence B (Fig. 9). Correspondingly, titanomagnetite compositions show decreasing Al2O3+MgO and TiO2 abundances and higher FeOtotal, along with higher Fe3+/Fe2+ ratios (Fig. 7, Table 1). High FeOtotal contents in glass are associated with lower FeOtotal contents in the corresponding titanomagnetites. As noted from whole-rock and mineral chemical studies at Mt. Taranaki (Stewart et al., Reference Stewart, Price and Smith1996; Price et al., Reference Price, Stewart, Woodhead and Smith1999), the glass compositional evolution is likely related to fractionation of clinopyroxene, hornblende,±plagioclase, which are common mineral phases in this pyroclastic suite. Changes in storage, rise-rate, and fractionation affect titanomagnetite compositions in a similar way (Hill and Roeder Reference Hill and Roeder1974; Tomiya and Takahashi, Reference Tomiya and Takahashi2005), reducing Al2O3 and MgO contents. Variation in the TiO2 content of titanomagnetites, however, is more complex and may relate to a number of processes, both deep and shallow, including (1) temperature and oxygen fugacity variations of magmas (e.g., Buddington and Lindsley, Reference Buddington and Lindsley1964; Hill and Roeder, Reference Hill and Roeder1974; Jackson et al., Reference Jackson, Cheadle and Atherton2003; Annen et al., Reference Annen, Blundy and Sparks2006); (2) variations in the primary magma source, as suggested by previous studies to be at the lower crust (e.g., Stewart et al., Reference Stewart, Price and Smith1996; Price et al, Reference Price, Stewart, Woodhead and Smith1999; Zernack et al., Reference Zernack, Price, Smith, Cronin and Stewart2012); and/or (3) a greater compatibility of Ti during early stages of fractional crystallization.
Some tephra layers that depart from the overall evolutionary trend described previously show distinctly higher or lower TiO2 contents in their titanomagnetites, a bimodal titanomagnetite composition, and/or a large range in their glass composition. Such variations probably reflect the polybaric magmatic system of Mt. Taranaki (cf. Zernack et al., Reference Zernack, Price, Smith, Cronin and Stewart2012), where different magmas are produced by a combination of fractional crystallization, crustal melting, and assimilation, as well as by magma mixing and/or mingling in a complex mantle-crustal storage system. The lower part of Tephra Sequence C, for example, is composed of two distinct titanomagnetite groups with greatly varying TiO2 contents, reflecting different oxygen fugacity levels and likely different magma storage levels (Fig. 7). Some of these layers include traces of Al2O3+MgO-rich titanomagnetites (i.e., titanomagnetite group 11) similar to the more mafic Manganui tephras. This distinct bimodality suggests a period of magma recharge, where less evolved magma entered the storage system (e.g., Clynne, Reference Clynne1999; Devine et al., Reference Devine, Rutherford, Norton and Young2003; Tomiya and Takahashi, Reference Tomiya and Takahashi2005). Another type of bimodality is observed within unit T-23 of Tephra Formation D, where titanomagnetite compositions are spread over titanomagnetite groups 1 and 2 (Table 1). Such compositional bimodality suggests magma mingling/mixing just shortly prior to or during the eruption, which is consistent with banded pumice and a broad range in glass shard compositions of this unit (Figs. 4 and 8, Supplementary Table 3). In contrast, some tephra layers (i.e., T-5, Ri-117, Ri-118, E-23, U-7, U-9; Fig. 10) are characterized by a bimodal composition that is more likely caused by contamination rather than any magmatic process. In particular, entrainment of material from conduit/vent walls during explosive eruptions or intermixing of closely spaced tephra layers within the sediment column is most likely.
After eruption of Tephra Sequence B, with the most silicic glass composition (including the prominent Inglewood Tephra), a distinct chemical change occurred to more mafic compositions of Tephra Sequence A (Figs. 8 and 10) represented by type I tephras (Manganui correlatives, titanomagnetite group 11; Fig. 7). This change may indicate the beginning of a possible second geochemical trend. Type I tephras are intercalated with type II tephras, which are more evolved but show similar low TiO2 titanomagnetite concentrations (Fig. 7). This affinity of both tephra types could suggest a shared identity where type II magmas may result from the evolution of type I magmas and/or may be a product of mixing type I with older, more evolved magmas.
Conclusions
The 30,000 yr long tephrostratigraphic record constructed in this study is one of the most detailed and continuous for an andesitic stratovolcano. The collection of several sediment cores in a closely spaced arc around the volcano provided the opportunity to sample narrow tephra lobes (deposited under high-wind conditions) and overcome preservation/erosion issues that may be associated with single sites.
This approach enabled the building of a continuous composite tephra record, including at least 228 tephra layers, which provides a more complete insight into the explosive eruption history of Mt. Taranaki.
Through sampling at a range of locations, this study also records the physical differences in tephra deposition in lacustrine versus paludal environments and highlights the influence of physiographic and sedimentary conditions on tephra preservation.
Titanomagnetite phenocrysts in combination with glass analyses, as well as detailed physical observations of the tephra layers and radiocarbon dating, provide a robust basis for tephra differentiation and correlation. Packages of physically and compositionally similar tephra layers within a tight chronological framework were used to define six individual tephra sequences (Tephra Sequence A–F) at Mt. Taranaki. These showed two general patterns of evolution over time at this volcano: (1) Tephra Sequence E to B (17.5–3 cal ka BP) and (2) Tephra Sequence A (3–0.5 cal ka BP). Additional complex geochemical variations within these broad evolutional trends point to a polybaric magmatic system where fractional crystallization, crustal melting/assimilation, and magma mingling/mixing take place in a complex storage and plumbing system beneath the volcano.
Despite the high-resolution record, correlation of individual beds is not always simple, and correlation to on-cone sites is challenging because of poor preservation of proximal deposits and limited compositional data.
Acknowledgments
M. Damaschke acknowledges the financial support of a Massey Doctoral Scholarship and the George Mason Trust. All authors benefitted from financial support of the Natural Hazards Research Platform, “Living with volcanic risk” program, funded by the Ministry for Business, Innovation and Employment. We thank David Feek and Dr. Alan Palmer for assisting in core extraction and Steve Styger, Gary Comarer, Trevor Jane, John Newsome, Jack Newsome, Raymond Foster, Brian Rowlands, Alison Rumball, and the Tamblin family for allowing access to their land for sampling. Dr. Anja Moebis and Mr. Peter Lewis are thanked for their help with electron microprobe and other analytical analyses. We thank Prof. Vince Neall for kindly providing samples from previous studies and Prof. Clel Wallace, Prof. Bob Stewart, and colleague Rafael Torres-Orozco for their helpful discussions. We gratefully acknowledge the helpful review of Prof. David Lowe and an anonymous reviewer.
Supplementary materials
To view supplementary material for this article, please visit https://doi.org/10.1017/qua.2016.11