INTRODUCTION
In recent decades, a consistent picture of climate change has emerged for equatorial East Africa over the past 25,000 yr. Although most studies focus on wetter/drier cycles, a recent study found a strong, if not dominant, role of temperature in moisture availability (Chevalier and Chase, Reference Chevalier and Chase2016), indicating a more complicated relationship than previously understood. The last glacial maximum (LGM) was cooler (2.5°C–3°C) and at least as arid as today (Barker et al., Reference Barker, Talbot, Street-Perrott, Marret, Scourse and Odada2004; Nash and Meadows, Reference Nash and Meadows2012). This combination resulted in low stands for many lakes, including Lake Tanganyika (Haberyan and Hecky, Reference Haberyan and Hecky1987; Scholz et al., Reference Scholz, King, Ellis, Swart, Stager and Colman2003; Tierney et al., Reference Tierney, Russell and Huang2010; Burnett et al., Reference Burnett, Soreghan, Scholz and Brown2011), Lake Rukwa (Vincens et al., Reference Vincens, Buchet, Williamson and Taieb2005), and many others (Gasse et al., Reference Gasse, Chalié, Vincens, Williams and Williamson2008; Tierney et al., Reference Tierney, Russell, Sinninghe Damsté, Huang and Verschuren2011). At these sites, as well as at Lake Cheshi (Stager, Reference Stager1988), the LGM arid phase was followed by a wetter transition that apparently began first in the south, for example at Lakes Masoko (Barker et al., Reference Barker, Williamson, Gasse and Gibert2003; Garcin et al., Reference Garcin, Williamson, Taieb, Vincens, Mathé and Majule2006) and Malawi (Castañeda et al., Reference Castañeda, Werne and Johnson2007). The Younger Dryas was drier at most sites, giving way in the early Holocene to the African Humid Period (AHP), which was moister throughout. A drier period around 4.2–4.0 cal ka BP has been observed in some locations, but with much regional variation (Barker et al., Reference Barker, Talbot, Street-Perrott, Marret, Scourse and Odada2004; Nash and Meadows, Reference Nash and Meadows2012; references given previously).
In contrast, the paleoclimate of the region to the southwest, in interior southern Africa, is less well known, largely because of a scarcity of appropriate sites; furthermore, available information is often inconsistent. A third impediment is the recent doubt about the suitability of dune systems for paleoclimatic research (Chase, Reference Chase2009; Telfer and Hesse, Reference Telfer and Hess2013), a field that had provided much early information.
A recent synthesis concluded that overall the LGM seems to have been 5°C–6°C cooler than today (Nash and Meadows, Reference Nash and Meadows2012). The Kalahari was wetter around 19 cal ka BP (Brook et al., Reference Brook, Cowart and Brandt1998; Burrough et al., Reference Burrough, Thomas and Bailey2009). However, there is much variation—for example, when the Kalahari was wet, Etosha was dry (Thomas et al., Reference Thomas, Brook, Shaw, Bateman, Haberyan, Appleton, Nash, McLaren and Davies2003; Brook et al., Reference Brook, Marais, Srivatava and Jordan2007). Inconsistencies are also apparent in the latest Pleistocene: Lake Ngami and Drotsky’s Cave (Robbins et al., Reference Robbins, Murphy, Stevens, Brook, Ivester, Haberyan and Klein1996) indicate wetter conditions around 11–13 cal ka BP, at a time when Makgadikgadi and Mabebe basins were apparently drier. Finally, evidence of wetter phases is widespread for the early Holocene (around 8–9 cal ka BP) but is variable thereafter (Burrough and Thomas, Reference Burrough and Thomas2013, and references therein). Thus, the record of climate here is especially variable and difficult to interpret, and a coherent chronology remains elusive (Nash and Meadows, Reference Nash and Meadows2012).
Difficulties in understanding paleoclimate in southern Africa arise, in part, from the complexity of its modern climate and the difficulties in comparing records based on different proxies (Thomas and Burrough, Reference Thomas and Burrough2012). A full review is beyond the scope of this report, but thorough treatments have recently been compiled (Chase and Meadows, Reference Chase and Meadows2007; Tierney et al., Reference Tierney, Russell, Sinninghe Damsté, Huang and Verschuren2011; Chevalier and Chase, Reference Chevalier and Chase2015). On a continental scale, the climate of tropical Africa is strongly influenced by the Intertropical Convergence Zone (ITCZ), where moist surface winds converge, and the Congo Air Boundary (CAB), where Congo winds meet the moisture-bearing Indian Ocean trade winds. These convergences migrate seasonally and are responsible for the pronounced rainy seasons throughout the continent.
SITE DESCRIPTION
In northeastern Zambia, the ITCZ meets the CAB in January (Tierney et al., Reference Tierney, Russell, Sinninghe Damsté, Huang and Verschuren2011); the rainy season lasts from November to about March. This season provides virtually all of the annual precipitation (about 1100 mm/yr) at Mpika, some 70 km southwest of the study site, where monthly average temperatures range from about 10°C in June to about 30°C in October. Winds are highly seasonal, almost always coming from the east (ranging from east-northeast to east-southeast), and are strongest in the dry season, especially its latter half (August to November; https://www.meteoblue.com/en/weather/forecast/modelclimate/mpika_zambia_905846 [accessed January 3, 2017]). Thus, the positions of the ITCZ and the CAB are related to both precipitation and wind. Their intersection may have been as far east as Lake Chala in Kenya during the LGM and AHP (Tierney et al., Reference Tierney, Russell, Sinninghe Damsté, Huang and Verschuren2011), and such a displacement should cause dramatic changes to the climate of Zambia.
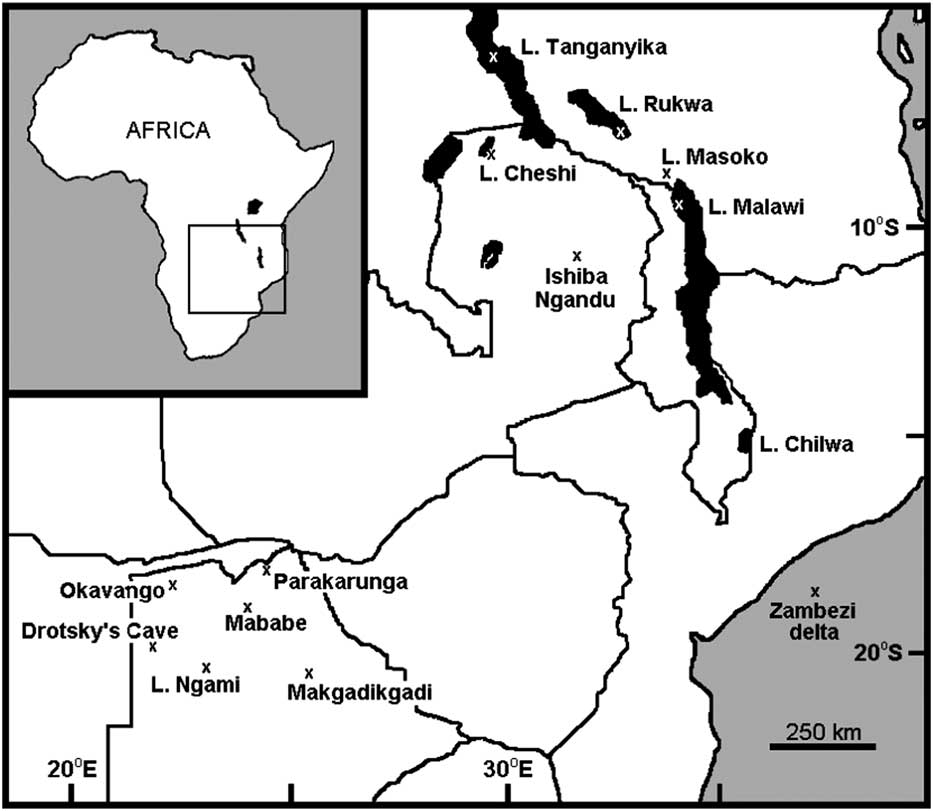
Ishiba Ngandu is a lake in northeastern Zambia at 11°14.10’S, 31°44.46’E, at an elevation of about 1454 m (Fig. 1). It has also been known as Mapampa, Chimbwé, Lake Young, Shiwa Ngandu, and even Chitané’s Water (Waller, Reference Waller1874); in fact, Ishiba Ngandu translates from Bemba as “the Lake of the Royal Crocodiles” (Bigland, Reference Bigland1939). The first European to visit was the explorer David Livingstone who, on January 12, 1867, encountered soft peaty mud and hippopotamus (Hippopotamus amphibius, a bioturbator) there (Waller, Reference Waller1874). The natural vegetation around the lake is classified as wetter miombo woodland (http://vegetationmap4africa.org [accessed December 11, 2016]) with a closed canopy of Brachystegia, although sufficient light reaches the ground for grasses to grow (http://www.fao.org/ag/agp/agpc/doc/counprof/zambia/zambia.htm [accessed January 3, 2017]). The lake supports a varied aquatic flora that includes papyrus, but the vast majority of its surface is open water. In historical times, a variety of agricultural plants have been grown at the adjacent Shiwa Estates (Livingstone, Reference Livingstone1971).

Figure 1 Geographic setting of Ishiba Ngandu and other localities discussed in text. National borders are shown as solid lines; specific localities are indicated by “x.”
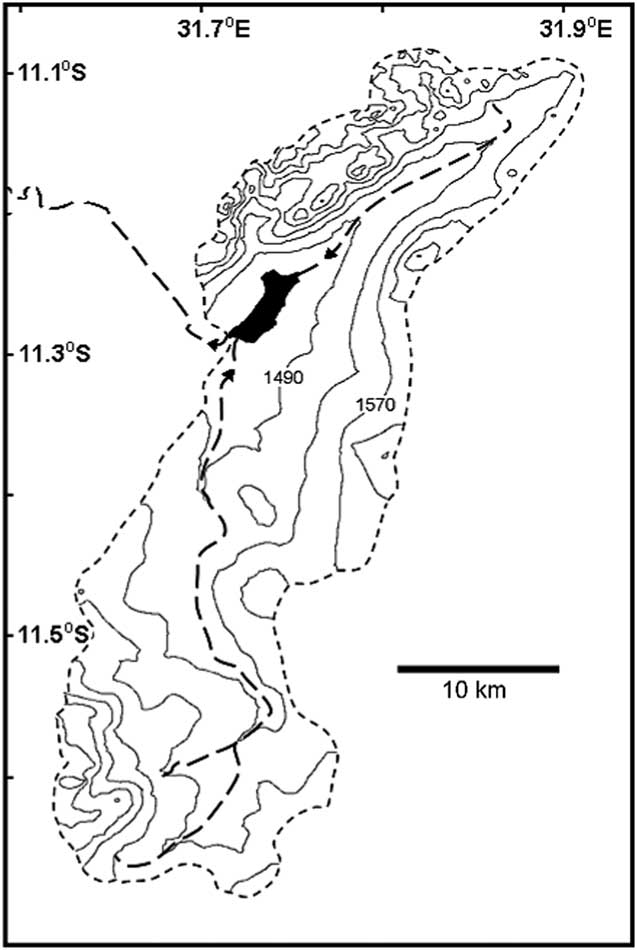
Ishiba Ngandu occupies a basin formed by gentle downwarping (Livingstone, Reference Livingstone1971); the lake has a length of about 6 km, an area of about 7 km2, and a depth of about 7 m. The catchment of the lake is about 670 km2 in area (as measured in Google Earth; Fig. 2), with deposits that belong to the Manshya River Group, a metasedimentary formation composed of three pelite units and two quartzite units (De Waele et al., Reference De Waele, Kampunzu, Mapani and Tembo2006); stromatolites have been reported near the lake (Ayers, Reference Ayers1974, cited in De Waele et al., Reference De Waele, Kampunzu, Mapani and Tembo2006). The two main rivers that feed the lake flow year-round and are fed in part by at least eight springs. The outflow from the lake also flows year-round (Harvey, J., personal communication, 2016) and eventually enters Lakes Bangweulu and Mweru before joining the Congo River and draining into the Atlantic Ocean.

Figure 2 Ishiba Ngandu and its watershed. Contours generated by 3DField software (http://3dfmaps.com [downloaded in 2014]) based on elevations from Google Earth (http://www.google.com/earth [accessed December 11, 2016]), which were extracted using the method given by Geo-spatial Tutorials (https://www.youtube.com/watch?v=237pVwC3fNk [accessed December 11, 2016]). Short-dashed perimeter line indicates the limit of the watershed; long-dashed interior lines indicate streams of second and third order, according to Federal Department of Trigonometrical and Topographical Surveys (1962). Arrows near the lake indicate the direction of flow.
Very little limnological information is available for the lake. When visited in early 1937, its waters contained about 10 mg/L of total dissolved solids, with a total alkalinity of 1.7 mg/L (as carbonate) and 2.9 mg/L silica (Ricardo, Reference Ricardo1939). Richardson (Reference Richardson1968) visited the lake in 1960 or 1961 and described it as dilute with low primary productivity and a Secchi depth of 2.5 m. He also reported that the diatom assemblage in the surficial sediments was 86% Aulacoseira (then known as Melosira).
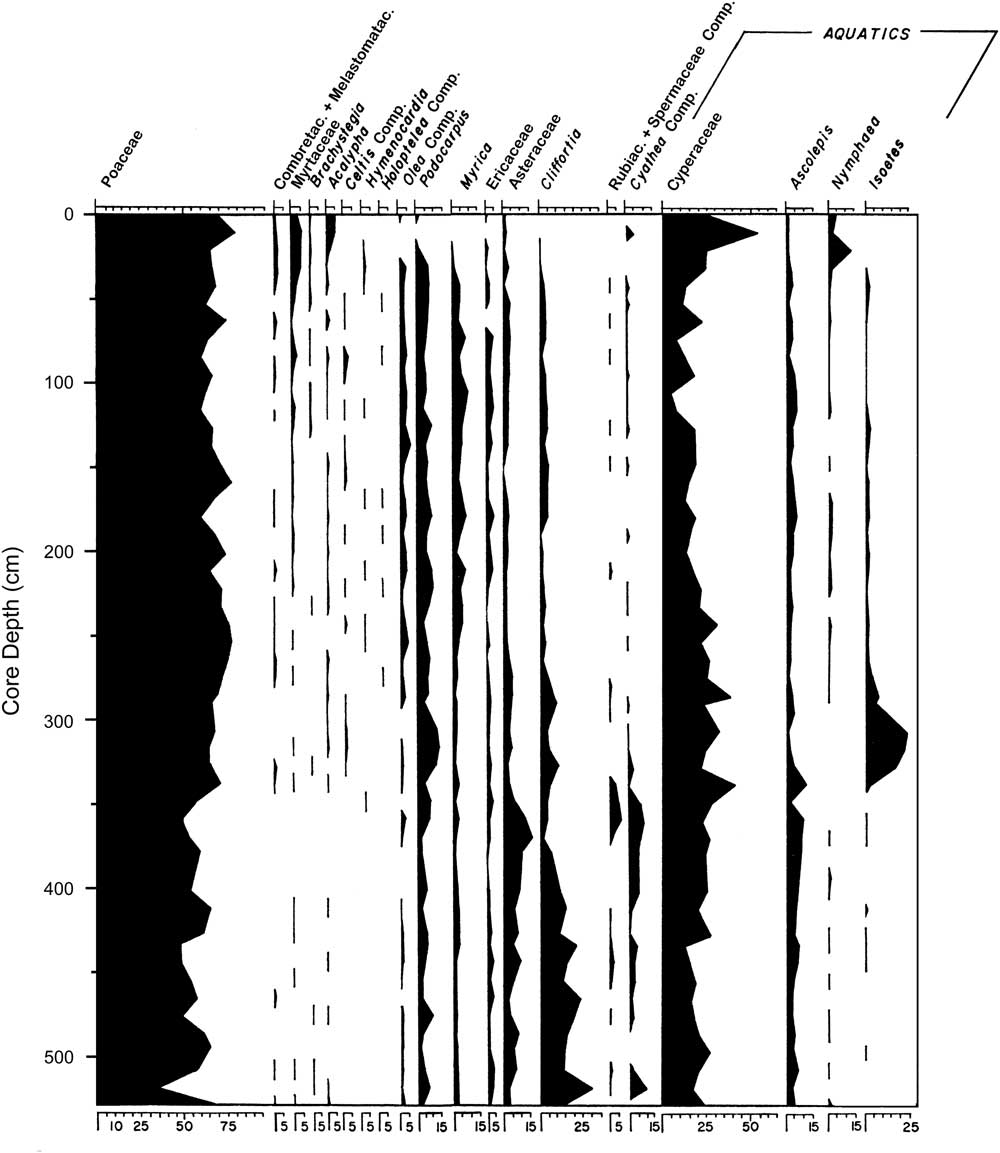
Livingstone (Reference Livingstone1971) analyzed this core for leachable mud cations, which showed that the lake has never been much more concentrated than at present; sediment loss on ignition was less than 5% in the sandy unit below 350 cm and 12%–20% above it (Livingstone, Reference Livingstone1971). In addition, palynology suggested a remarkably stable local flora in which Poaceae (grass) and Cyperaceae (sedges) were always the most common palynomorphs (Fig. 3), while the third most common palynomorph was either Nymphaea (water lilies), Podocarpus (an evergreen conifer), Isoetes (quillworts), Asteraceae (a large and diverse family), or Cliffortia (a shrub in the rose family). Above the 50 cm level, pollen from moist to dry evergreen forest taxa declined from low to very low abundances, and total absolute pollen abundance declined suddenly; these changes were tentatively linked to human activity that seems to have begun around 3000 cal yr BP (Livingstone, Reference Livingstone1971).

Figure 3 Stratigraphy of selected pollen taxa in the Ishiba Ngandu core; only taxa that were discussed in text by Livingstone (Reference Livingstone1971) are presented. Poaceae and Compositae were originally given as Graminae and Compositae, respectively. Reproduced with modification from Livingstone (Reference Livingstone1971), with permission from John Wiley and Sons.
Livingstone’s (Reference Livingstone1971) core was examined for diatoms to provide further information on the history of the lake and the paleoclimate of this area to detect eastward displacement of the CAB and to determine if the well-established climatic history of East Africa extended into northeastern Zambia.
MATERIALS AND METHODS
The Ishiba Ngandu core was collected from the northeastern part of the lake where the water depth was 6.5 m, using a 3.9 cm piston sampler (Livingstone, Reference Livingstone1971) by Dan Livingstone and Jonathan Richardson, likely in 1960 or 1961. Unfortunately, many field and laboratory notes are no longer available, including the exact location of the core; this lack of information is worsened by the recent passing of both of the primary researchers.
The core was sampled for diatoms at least every 20 cm during a postdoctoral fellowship in Livingstone’s lab in 1988. These samples were placed in centrifuge tubes with 30% H2O2 and then heated in a 70°C water bath until all organic matter had been oxidized. After three rinses in distilled water and mixing with a vortex mixer, subsamples were withdrawn by automatic pipette and dried on coverslips, followed by heating on a hot plate set at its highest setting (500 W) for 15 minutes. Coverslips were inverted onto a drop of warm Hyrax on a microscope slide.
Diatoms were identified at 1000× and counted at 400× on an Olympus CH-2 microscope. For each slide, random coordinates were generated based on the microscope’s stage coordinate system; successive fields of view were examined until at least 300 valves had been tallied. When diatoms were sparse, counts were made with continuous sweeps near the middle of the coverslip. Identification was based on Patrick and Reimer (Reference Patrick and Reimer1966, Reference Patrick and Reimer1975), Gasse (Reference Gasse1986), and Krammer and Lange-Bertalot (Reference Krammer and Lange-Bertalot1991); these, plus Bahls (Reference Bahls2006), provided ecological information. Ecological preferences of Anomoeoneis serians var. brachysira include those of Brachysira serians var. brachysira and B. brebissonii because these are synonymous according to AlgaeBase (http://www.algaebase.org [accessed August 21, 2016]).
Delineation of diatom zones was based on k-means cluster analysis, as compiled by the Real Statistics add-on for Microsoft Excel (http://real-statistics.com [accessed December 27, 2016]). Principle components analysis (PCA) was carried out with C2 (https://www.staff.ncl.ac.uk/stephen.juggins/software/C2Home.htm [accessed August 2016]) using square root–transformed data. Radiocarbon dating was carried out on bulk sediment samples using conventional methods (i.e., not by accelerator mass spectrometry) by the Yale lab in 1964 and by the Hamburg lab in the mid-1990s; although no records exist, these samples were probably 30 cm half-sections of the core. Dates were converted to calibrated years before present using the SHCal13 data set (Blaauw and Christen, Reference Blaauw and Christen2011; Hogg et al., Reference Hogg, Hua, Blackwell, Niu, Buck, Guilderson and Heaton2013) and rounded to the nearest thousand years (cal ka BP).
RESULTS AND INTERPRETATION
Of the five radiocarbon dates, the first one (obtained in 1964) was substantially older (Y 1415, about 25,900 ± 420 cal yr BP) than a deeper date (Table 1). This date implies a sedimentation rate (0.02 mm/yr) that is vastly different from the remarkably stable rates in the other intervals (>0.15 mm/yr; Fig. 4). Thus, the Y 1415 date seems to be anomalously old (as recognized by Livingstone himself: Livingstone, D.A., personal communication, 2000) and is not considered further.
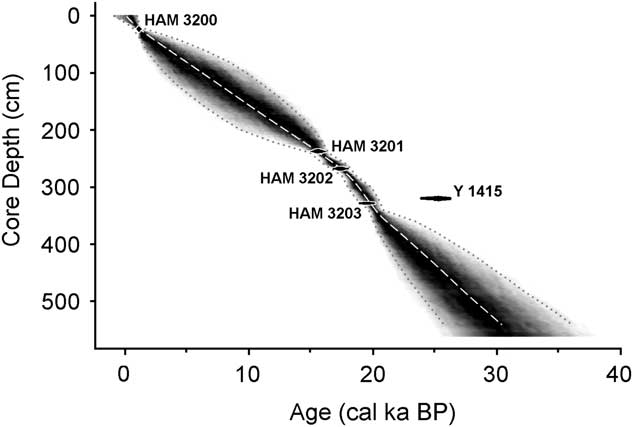
Figure 4 Sediment accumulation rates of the core, based on the calibrated dates in Table 1. Radiocarbon dates are represented by black ovals whose horizontal extents represent±1δ deviation. HAM, Hamburg, Germany; Y, Yale University.
Table 1 Radiocarbon dates for the Ishiba Ngandu core. The core depth indicates the midpoint of the depth interval. Calibration based on CALIB 7.0 (http://calib.org [accessed December 30, 2016]) using the SHCal13.14c data set (Stuiver and Reimer, Reference Stuiver and Reimer1993; Hogg et al., Reference Hogg, Hua, Blackwell, Niu, Buck, Guilderson and Heaton2013). HAM, Hamburg, Germany; Y, Yale University.

The core was composed of 10 sedimentological units (Table 2). The four units above 317.7 cm were organic lake mud that varied in color, banding, and sandiness; these lay above a 26.8 cm layer of discolored sand, which in turn lay on a 28 cm gyttja unit. Below this, the core was composed largely of sand, occasionally with organic pieces or fine organic layers.
Table 2 Stratigraphy of the Ishiba Ngandu core. Sediment composition is based on Livingstone’s lab notes when the core was opened. Common diatoms are the three most common genera that also exceed an average of 10%, listed in order of abundance. Only the third most common palynomorph is listed, because Poaceae and Cyperaceae were the most common in all samples (Livingstone, Reference Livingstone1971). Poaceae and Asteraceae were given as Graminae and Compositae in Livingstone (Reference Livingstone1971).

The PCA of diatom genera revealed three distinct directions, corresponding to Aulacoseira, Achnanthidium, and Anomoeoneis+Frustulia. These trends were reflected in the k-means cluster analysis, which revealed three diatom assemblages in four zones. Full counts are available in Supplementary Tables 1 and 2.
The lowest diatom zone, zone D, had an upper boundary at 344.5 cm (around 20 cal ka BP; Fig. 5); it was a sandy unit with occasional thin organic layers. Overall, the most common diatom was Aulacoseira (zonal average 26%; primarily A. granulata), but in individual samples, it was often surpassed by other genera. Aulacoseira has a clear preference for turbulent, nutrient-rich water (Kilham, Reference Kilham1990; using the former genus name Melosira). Other common diatoms were species of Eunotia (19%; primarily E. cf. bilunaris and E. tenella), a genus well known as an indicator of dilute, low-pH waters (Gasse, Reference Gasse1986; Krammer and Lange-Bertalot, Reference Krammer and Lange-Bertalot1991). Similarly, Anomoeoneis serians var. brachysira (15%) also prefers dilute, low-pH waters (Gasse, Reference Gasse1986; Bahls, Reference Bahls2006), as does Frustulia rhomboides (15%) (Krammer and Lange-Bertalot, Reference Krammer and Lange-Bertalot1991). Other diatom genera did not average more than 10% in this zone. In addition, diatoms in two of the deepest samples (460 and 480 cm) showed signs of dissolution, but not an unusual amount of fragmentation.
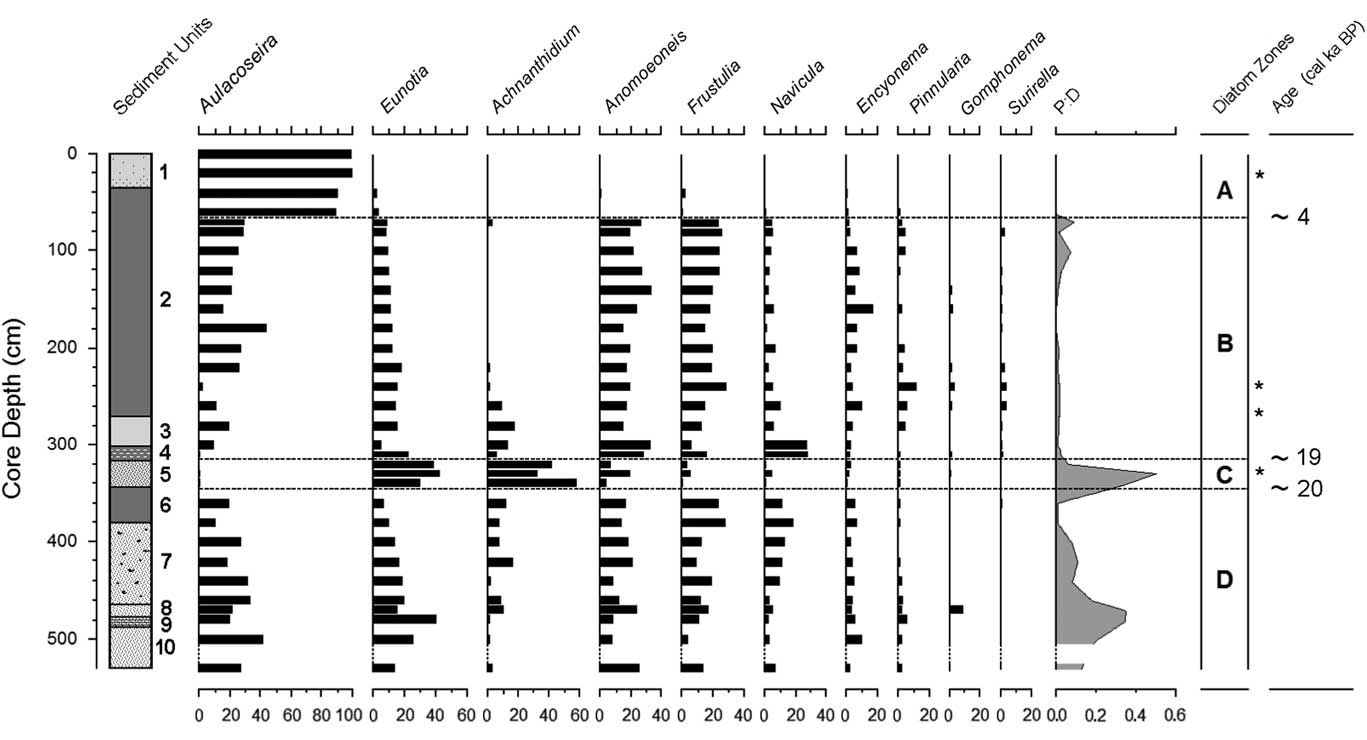
Figure 5 Diatom stratigraphy of the Ishiba Ngandu core, expressed as percent of all diatoms; other genera never total more than 1.7% in any sample. Sedimentary units as in Table 2. Ages rounded to the nearest millennium. Dashed intervals of the vertical axes indicate sections with too few diatoms for enumeration; asterisks indicate the levels of the HAM radiocarbon dates in Table 1. HAM, Hamburg, Germany; P:D, ratio of phytoliths to diatoms.
The species of Eunotia, Frustulia, and Anomoeoneis observed here suggest low conductivity waters with a pH below 6; this, in turn, indicates that the waters were not concentrated in any season, confirming Livingstone’s (Reference Livingstone1971) conclusion based on leachable cations. This sandy section of the core was interpreted as a stream deposit that was laid down prior to the uplift that initially blocked the stream (Livingstone, Reference Livingstone1971). However, the abundance of the planktonic diatom Aulacoseira suggests the presence of a lake, at least seasonally; it is robust evidence that a stream alone was not responsible for these deposits, although floodwater pulses may have contributed. Fine organic layers, if produced, were dispersed by bioturbation (e.g., by hippopotamus) or by water turbulence, except in unit 9. Although other mechanisms such as seasonal flooding probably contributed, it seems clear that a nutrient-rich lake was often present here. Alternatively, it is possible that the coring site was near the shore of a deeper lake, but this seems unlikely because the core was collected near the deepest part of the basin (Livingstone, Reference Livingstone1971).
Given the low-relief topography here and the abundance of sand, the lake was probably a shallow floodplain lake, perhaps receiving sand during seasonal floods. Shallow lakes often evaporate seasonally, but both the diatom record and the leachable ions show no indication of evaporative concentration. Thus, it appears that water was supplied year-round, probably as rainfall supplemented by spring discharge, which maintained the lake through the dry season (as they do in modern times); the watershed of the lake currently supports eight perennial springs (Harvey, J., personal communication, 2016). Springwater discharge through the dry season suggests at least moderate rainfall, perhaps comparable with that of modern times (1100 mm/yr; https://www.meteoblue.com/en/weather/forecast/modelclimate/mpika_zambia_905846 [accessed January 3, 2017]). In addition, the lake may have remained fresh because its outlet flowed year-round (or nearly did so). Indeed, frequent discharge is required to avoid seasonal concentration of even spring-fed lakes because discharge removes concentrated waters as fresher waters arrive. If the lake did indeed discharge often, then the dam was likely lower at the time; that is, downwarping had only been minor prior to that time.
Although diatom subzones were not distinguished, the lowest 66 cm of the core (units 8–10) varied from other sediments in three ways. First, diatom dissolution was more extensive, especially among Anomoeoneis; samples from 510 and 520 cm contained too few diatoms to enumerate, and the sparse diatom remains were strongly affected by dissolution. However, valves of Eunotia were dissolved little, suggesting either seasonal freshening of the lake or import of Eunotia from nearby freshwater habitats. A second difference with overlying sediments was the composition of the diatom assemblage, which included up to 6% Navicula schroeteri, a species that was found nowhere else in the core; in Africa, this species is both epiphytic and planktonic in freshwater and prefers a pH that is slightly above neutral (Gasse, Reference Gasse1986). Finally, the deepest sediments of this zone displayed an elevated ratio of grass phytoliths to diatom valves (P:D; up to 0.35, an average here of 0.12). The waters at this time seem to have been concentrated seasonally and quite shallow, but the presence of Aulacoseira indicates at least some standing water during the year.
There were other noticeable changes in the sediments of zone D. The organic “chunks” of unit 7 may represent bioturbation or reworking of dry mud deposits, either in situ or on a nearby mudflat. In contrast, the upper unit of diatom zone D was unit 6, a gyttja layer that seems to indicate a deeper, perennial lake; the lack of sand suggests little or no seasonal flooding. The onset of unit 6 may correspond to sudden uplift of the dam or perhaps to vegetative obstruction of the outlet. Although the lake was deeper, the diatom assemblage in unit 6 was indistinguishable from that of lower units, indicating that water conditions (e.g., chemistry and physics) were little changed from preceding times.
Diatom zone C corresponds with sediment unit 5, which extended from 344.5 cm to 317.7 cm (approximately 20–19 cal ka BP). Sediments were a rather uniform layer of discolored sandy mud. The most common diatoms in this zone were Achnanthidium minutissimum (38%), Eunotia (25%), and Anomoeoneis serians var. brachysira (15%). Aulacoseira and Frustulia rhomboides were much less common (<4%) than previously. Many diatoms at 340 cm were fragmented and were somewhat dissolved. In addition, P:D was elevated in this zone, suggesting enhanced terrestrial input and shallower water.
In this interval of the core, Livingstone (Reference Livingstone1971) found a discrete pulse of Isoetes spores from 300 to 330 cm (Fig. 3). This genus was taken to be aquatic, and indeed three of the four Zambian species of Isoetes are submerged or semiaquatic (http://zambiaflora.com/speciesdata/genus.php?genus_id=6 [accessed January 2, 2017]). It seems likely that the epiphytic diatom here (Achnanthidium minutissimum) was largely growing on submerged Isoetes. The presence of acidophilous diatoms (Eunotia) suggests low-pH waters, but neither the sandiness nor the diatoms nor the Isoetes can definitively distinguish flowing water from standing water. However, the virtual absence of planktonic taxa like Aulacoseira lends circumstantial support to the flowing-water scenario, as does the elevated level of diatom fragmentation. In addition, the preference of Achnanthidium minutissimum for well-oxygenated waters (Gasse, Reference Gasse1986) is suggestive of nearshore or flowing waters. Zone C was clearly deposited in shallow water, perhaps a stream, yet it lies atop unit 6, which was interpreted as a year-round lake. Shallowing from unit 6 to unit 5 may have been caused by basin infilling or perhaps by downcutting of the dam by the outlet stream.
Zone B extended from 317.7 cm upward to 77.0 cm (approximately 19–4 cal ka BP) and was composed of organic mud with occasional light bands. Aulacoseira, Anomoeoneis, and Frustulia reached comparable abundances (average 19%–22%). Decreased abundance of Eunotia (12%) and the P:D ratio (0.016:1) was also observed. The diatom assemblage of zone B was indistinguishable from that of zone D, indicating that the lake’s state was similar to that in zone D (e.g., pH below 6 and low conductivity). In particular, the gyttja of zone B was much like that at the top of zone D (i.e., unit 6), suggesting increased water depth; this may have been caused by another episode of tectonic uplift of the dam around 19 cal ka BP. The lack of sand in zone B also suggests little or no floodwater input of sand.
Zone A formed the uppermost 77.0 cm of the core and seems to represent approximately the last 4 cal ka of the lake’s history. An increase in sandiness near the middle of this zone may indicate shallowing of the lake around 2 cal ka BP. The diatom assemblage here was clearly dominated by Aulacoseira (89.2% to 99.7%), which indicates turbulent and nutrient-rich lake water (Lund, Reference Lund1954; Kilham, Reference Kilham1990). The dramatic increase in Aulacoseira indicates conditions that are consistent with wind-induced lake mixing, suggesting that windiness (duration and/or intensity) in the area increased to modern levels about 4 k cal yr ago.
DISCUSSION
Overall, the history of the lake included an initial phase (zone D, until about 20 cal ka BP) that began with a shallow lake that was fresh year-round, perhaps experiencing seasonal floods. The very oldest sediments contained some evidence of seasonal concentration. Deposition of gyttja late in zone D suggested deepening around 22 cal ka BP, but the diatom assemblage remained unchanged. The sands that compose zone C (ca. 20–19 cal ka BP) indicated shallowing, and diatoms suggested standing or perhaps flowing water. This phase was followed by a return to deeper water and the deposition of gyttja, which persisted until present; around 4 cal ka BP a substantial increase in Aulacoseira indicated an increase in lake turbulence and in nutrient supply, likely because of increased windiness.
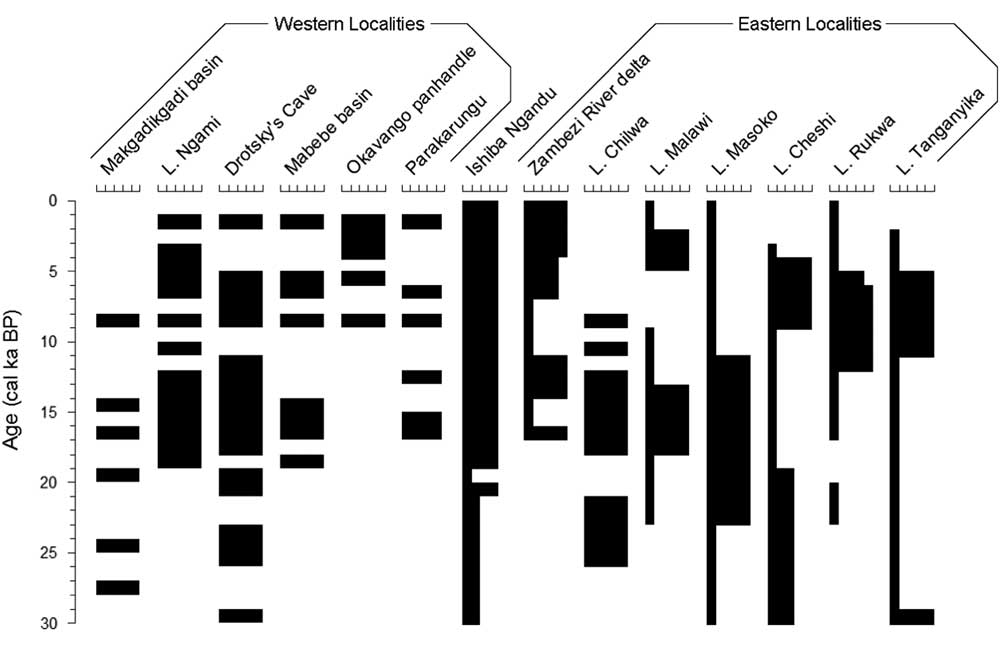
This inferred increase in windiness suggests that the modern climate was established around 4 cal ka BP. Currently, winds come almost always from the east and are strongest late in the dry season, when the CAB is distant (Tierney et al., Reference Tierney, Russell, Sinninghe Damsté, Huang and Verschuren2011); once the CAB arrives in November, it brings moisture and very little wind (https://www.meteoblue.com/en/weather/forecast/modelclimate/mpika_zambia_905846 [accessed January 3, 2017]). Around 4 cal ka BP, the Okavango panhandle sustained a lake (Nash et al., Reference Nash, Meadows and Gulliver2006), but Lake Cheshi became shallower (Stager, Reference Stager1988; Fig. 6). Shallowing occurred slightly earlier at Lakes Rukwa (Haberyan, Reference Haberyan1987; Vincens et al., Reference Vincens, Buchet, Williamson and Taieb2005) and Tanganyika (Scholz et al., Reference Scholz, King, Ellis, Swart, Stager and Colman2003; Tierney et al., Reference Tierney, Russell and Huang2010), whereas Lake Malawi deepened (Castañeda et al., Reference Castañeda, Werne and Johnson2007). These events suggest that, around 4–5 cal ka BP, the CAB shifted toward the east, providing moisture to southern and western sites (the Okavango, Lake Malawi, and Ishiba Ngandu), whereas the ITCZ no longer provided moisture to the northern sites (Lakes Cheshi, Rukwa, and Tanganyika). Although windiness increased at Ishiba Ngandu around 4 cal ka BP, this was well after the end of an early Holocene windy phase at Lake Tanganyika, about 11–6 cal ka BP (Haberyan and Hecky, Reference Haberyan and Hecky1987).

Figure 6 Paleoclimatic variations for localities in Figure 1, simplified to millennia. Within each set, localities are presented from southernmost to northernmost. For western localities, black intervals represent high lake stands; for eastern localities, the width of black bars indicates relative wetness. Adapted and expanded from Burrough and Thomas (Reference Burrough and Thomas2013) and references therein. Intervals without black bars have no reported data.
Ishiba Ngandu seems to have been a substantial, perennial lake for a very long period (i.e., 19 cal ka BP to present). Following the LGM, several eastern lakes were low until about 11 cal ka BP (e.g., Lakes Rukwa and Tanganyika: Haberyan and Hecky, Reference Haberyan and Hecky1987; Vincens et al., Reference Vincens, Buchet, Williamson and Taieb2005; Tierney et al., Reference Tierney, Russell and Huang2010), and other lake levels fell around that time (e.g., Lake Masoko: Garcin et al., Reference Garcin, Williamson, Taieb, Vincens, Mathé and Majule2006). At Ishiba Ngandu, prior to about 4 cal ka BP, winds were much less prominent (in intensity, in duration, or in both) than in modern times, as evidenced by the lower abundance of Aulacoseira in zone B. This reduced windiness suggests that the CAB was nearby for a longer period every year and thus probably caused an extended rainy season compared with the current climate. This inference is consistent with a southeastern displacement of the CAB and the ITCZ, as has been deduced for much of southeast Africa in the early Holocene (Tierney et al., Reference Tierney, Russell, Sinninghe Damsté, Huang and Verschuren2011; Burrough and Thomas, Reference Burrough and Thomas2013). Ishiba Ngandu sediments are suggestive of a deeper, perennial lake, but the record is complicated by the tectonic downwarp that evidently occurred through much of the lake’s history. Whatever the cause, the lake seems to have been deeper since the LGM.
Ample water has apparently been available to sustain a substantial perennial lake at Ishiba Ngandu since about 19 cal ka BP (zones A and B). This is an extended period that experienced much climatic change in the region, both east and west of the lake. Given that climate was wetter following the LGM at the western localities (i.e., northern Botswana), at Ishiba Ngandu, and at Lake Chilwa (Thomas et al., Reference Thomas, Bailey, Shaw, Duncan and Singarayer2009), it seems that all of these areas responded to the same atmospheric phenomenon (i.e., a persistent CAB nearby until 11 cal ka BP); indeed, the CAB may have been as far east as Mount Kilimanjaro (Sinninghe Damsté et al., Reference Sinninghe Damsté, Verschuren, Ossebaar, Blokker, van Houten, van deer Meer, Plessen and Shouten2011). At that time, the western localities became drier; in contrast, the climate of Ishiba Ngandu remained wet, more like the climate of the eastern sites, which became wetter around that time (Gasse et al., Reference Gasse, Chalié, Vincens, Williams and Williamson2008; Burrough and Thomas, Reference Burrough and Thomas2013). If so, then Ishiba Ngandu occupies a unique location because it avoided the late Pleistocene aridity to the east and the Holocene aridity to the west. This outcome supports a paleoclimate interpretation for Lake Malawi at about the same time (Johnson et al., Reference Johnson, Brown, McManus, Barker and Gasse2002; Castañeda et al. Reference Castañeda, Werne and Johnson2007). Indeed, the long-term availability of precipitation at Ishiba Ngandu is supported by the consistency of the pollen record (Livingstone, Reference Livingstone1971).
The low water level of the lake during zone C times suggests that a period of aridity occurred between about 20 and 19 cal ka BP, perhaps accompanied by seasonal flooding. There are few available records of this period from the western localities, but the few that are available indicate wetter conditions, such as high lake stands in the Makgadikgadi basin and wetter conditions at Drotsky’s Cave (Robbins et al., Reference Robbins, Murphy, Stevens, Brook, Ivester, Haberyan and Klein1996; Fig. 6). In the east, only Lake Masoko was wetter (Garcin et al., Reference Garcin, Williamson, Taieb, Vincens, Mathé and Majule2006), whereas other sites seem to have been drier (Barker et al., Reference Barker, Talbot, Street-Perrott, Marret, Scourse and Odada2004). In this regard, the zone C sediments (19–20 cal ka BP) of Ishiba Ngandu suggest climatic similarity with eastern records rather than with the western ones—that is, a drier LGM. At Ishiba Ngandu today, the rains occur when the CAB is nearby; thus, the low water levels suggest a reduction in rain, which in turn implies that the CAB had retreated to the north or west at the LGM. However, because the western localities indicate rather wet conditions, the CAB may have typically ended its southeasterly migration somewhere between Ishiba Ngandu and northern Botswana.
Although the bottom of the Ishiba Ngandu core seems, by extrapolation, to date to about 30 cal ka BP, such extrapolation must be made cautiously because the deposition rate may well have been quite different from the overlying sediments. Although tectonic processes may confound sedimentation, it seems clear that lake level was low when the oldest sediments of the core were deposited, but lake level rose thereafter: from shallow corrosive conditions (unit 10) to fresher conditions (units 7–9) to deeper conditions (unit 6). If these changes were indeed attributable to climate, then the climate of Ishiba Ngandu prior to the LGM seems to match that of Lakes Tanganyika and Malawi, and perhaps that of Masoko and Rukwa (Haberyan, Reference Haberyan1987; Scholz et al., Reference Scholz, King, Ellis, Swart, Stager and Colman2003; Vincens et al., Reference Vincens, Buchet, Williamson and Taieb2005; Garcin et al., Reference Garcin, Williamson, Taieb, Vincens, Mathé and Majule2006).
The stability of the diatom assemblage in Ishiba Ngandu suggests that the site was rather insensitive to climate change, as suggested by Livingstone (Reference Livingstone1971). It seems likely that springs in the watershed may have prevented evaporative concentration during some of the lake’s history, at least seasonally. Extended arid phases, however, cause springs to dry because they are fed by groundwater. This suggests that precipitation has been steady enough to support a substantial lake here, at least since 19 cal ka BP, confirming long-term stability of the miombo woodland. Thus, the lack of change in the pollen here may relate more to climate stability than to site insensitivity.
In the case of Ishiba Ngandu, tectonics and springs have complicated efforts in climatic reconstruction. The climatic chronology of this general region continues to be challenging, in particular because of the scarcity of suitable sites. Although beach deposits are informative, additional information is sorely needed for the western localities, for example from drilling or pit excavations. Such studies are essential to better understand climate changes since the last interglacial period, especially those that occurred between Ishiba Ngandu and the localities to its west.
ACKNOWLEDGMENTS
I am especially grateful to the reviewers of this manuscript, who provided much guidance that was both thorough and supportive, especially regarding age models. I also thank Karl Friedrich Weiss, who obtained the four additional radiocarbon dates from Hamburg, and Jo Harvey (owner of Shiwa Estates), who kindly provided information on the rivers and springs near the lake. Steve Juggins produced the plotting program (C2) that was used for PCA and diatom stratigraphy. I am deeply indebted to Dan Livingstone, not only for collecting the core, but also for his kind, yet rigorous, guidance. As my graduate and undergraduate advisor, he was a peerless mentor, colleague, field companion, role model, and inspiration.
Supplementary Material
To view supplementary material for this article, please visit https://doi.org/10.1017/qua.2017.31