


1. Introduction
Interstellar dust grains within galaxies can significantly alter their observed spectral energy distributions (SEDs) by acting to obscure light from ultraviolet (UV) to near-infrared (near-IR) wavelengths and reemitting this energy at infrared (IR) wavelengths (Galliano, Galametz, & Jones Reference Galliano, Galametz and Jones2018). Accurately characterising the wavelength dependence of dust attenuation curves and their variation (Salim & Narayanan Reference Salim and Narayanan2020) is important because the assumed shape of dust curves has a strong impact on derived physical properties of galaxies from SED modelling (Conroy Reference Conroy2013) and can also affect the accuracy of photometric distance (photo-z) estimates (Salvato, Ilbert, & Hoyle Reference Salvato, Ilbert and Hoyle2019; Battisti et al. Reference Battisti2019). The latter is particularly important for upcoming precision dark energy studies with the Euclid (Euclid Collaboration et al. Reference Collaboration2024) and Roman (Wang et al. Reference Wang2022b) space telescopes, where galaxies are used to trace the large-scale structure of the Universe.
A common characteristic of dust extinction and attenuationFootnote a curves is that the strongest extinction/attenuation typically occurs at bluer wavelengths and it decreases towards redder wavelengths in a gradual, continuous manner, except for the possible presence of a broad absorption feature centred at 2175Å (referred to as the 2175Å feature or bump) and weaker features at longer wavelengths (Draine Reference Draine2003): optical (e.g. Fitzpatrick et al. Reference Fitzpatrick, Massa, Gordon, Bohlin and Clayton2019), near-IR (e.g. Decleir et al. Reference Decleir2022), and mid-IR (e.g. Gordon et al. Reference Gordon2021; Hensley & Draine Reference Hensley and Draine2021). The overall shape of a dust extinction curve is primarily a consequence of the grain size distribution in the interstellar medium (ISM; e.g. Weingartner & Draine Reference Weingartner and Draine2001; Hensley & Draine Reference Hensley and Draine2023). The origin of the 2175Å feature remains unclear but is postulated to arise from small carbonaceous dust grains (e.g. Draine Reference Draine2003; Bradley et al. Reference Bradley2005; Papoular & Papoular Reference Papoular and Papoular2009), with polycyclic aromatic hydrocarbons (PAHs) being the favoured carrier (e.g. Li & Draine Reference Li and Draine2001; Lin, Yang, & Li Reference Lin, Yang and Li2023), although silicate carriers have also been proposed (e.g. Bradley et al. Reference Bradley2005). Understanding when the 2175Å feature is present in dust attenuation curves of galaxies is important, particularly when limited rest-frame UV filters are available, because it can introduce variation of
 $\sim$
25% in the value of dust corrections at UV wavelengths (affecting UV-based SFRs; Kennicutt & Evans Reference Kennicutt and Evans2012) and also introduce a bias of
$\sim$
25% in the value of dust corrections at UV wavelengths (affecting UV-based SFRs; Kennicutt & Evans Reference Kennicutt and Evans2012) and also introduce a bias of
 $\sim$
10% on photo-z estimates (e.g. Battisti et al. Reference Battisti2019).
$\sim$
10% on photo-z estimates (e.g. Battisti et al. Reference Battisti2019).
The 2175Å feature is observed in extinction curves measured using individual stars for many sightlines of the Milky Way (MW; e.g. Cardelli et al. Reference Cardelli, Clayton and Mathis1989; Fitzpatrick Reference Fitzpatrick1999; Valencic, Clayton, & Gordon Reference Valencic, Clayton and Gordon2004; Gordon, Cartledge, & Clayton Reference Gordon, Cartledge and Clayton2009; Fitzpatrick et al. Reference Fitzpatrick, Massa, Gordon, Bohlin and Clayton2019), the Large Magellanic Cloud (LMC; e.g. Gordon et al. Reference Gordon, Clayton, Misselt, Landolt and Wolff2003), and the Andromeda galaxy (M31; e.g. Bianchi et al. Reference Bianchi, Clayton, Bohlin, Hutchings and Massey1996; Clayton et al. Reference Clayton2015). The feature is usually weak or absent in the Small Magellanic Cloud (SMC; e.g. Gordon et al. Reference Gordon, Clayton, Misselt, Landolt and Wolff2003), although exceptions to this have recently been reported (Gordon et al. Reference Gordon2024). Beyond the local group, it has been observed in a small subset of extinction curves for quasars absorption systems (e.g. Ma et al. Reference Ma2017) and gamma-ray bursts (GRBs; e.g. Zafar et al. Reference Zafar2011; Zafar et al. Reference Zafar2012). However, it is often absent in a majority of quasar hosts (e.g. Hopkins et al. Reference Hopkins2004; Gallerani et al. Reference Gallerani2010), quasar absorption systems (e.g. York et al. Reference York2006), and GRBs (e.g. Schady et al. Reference Schady2012; Zafar et al. Reference Zafar2018). However, it is worth noting that these distant sources are likely probing more extreme environments than the typical ISM in star forming galaxies. For extinction curves, the absence of the feature can be directly attributed to an absence of the carrier along the line of sight.
Measuring the 2175Å feature in attenuation curves is more complicated. Theoretical studies have shown that the apparent strength of the 2175Å feature in attenuation curves, relative to the intrinsic extinction curve, can be considerably reduced (but not removed) due to the additional geometric and scattering effects at play (e.g. Gordon, Calzetti, & Witt Reference Gordon, Calzetti and Witt1997; Witt & Gordon Reference Witt and Gordon2000; Seon & Draine Reference Seon and Draine2016). Observational studies have found large variation in the strength of the 2175Å feature. Calzetti et al. (Reference Calzetti, Kinney and Storchi-Bergmann1994) found that starburst galaxies (strongly star-forming galaxies; SFGs) lack the feature in their attenuation curves, whereas studies of local ‘normal’ SFGs can have a weak feature (relative to the MW; e.g. Conroy, Schiminovich, & Blanton Reference Conroy, Schiminovich and Blanton2010; Wild et al. Reference Wild2011; Battisti et al. Reference Battisti, Calzetti and Chary2017), although large individual variation is evident (e.g. Salim, Boquien, & Lee Reference Salim, Boquien and Lee2018; Belles et al. 2023). Large variation is also evident at higher redshifts, with some studies favouring the inclusion of a weak feature (e.g. Noll et al. Reference Noll2009; Buat et al. Reference Buat2011; Buat et al. Reference Buat2012; Kriek & Conroy Reference Kriek and Conroy2013; Scoville et al. Reference Scoville2015; Shivaei et al. Reference Shivaei2020; Battisti et al. Reference Battisti, da Cunha, Shivaei and Calzetti2020; Kashino et al. Reference Kashino2021; Shivaei et al. Reference Shivaei2022; Witstok et al. Reference Witstok2023; Markov et al. Reference Markov2024) and others suggesting a feature does not need to be included (e.g. Reddy et al. Reference Reddy2015; Zeimann et al. Reference Zeimann2015; Salmon et al. Reference Salmon2016). These results indicate that there is no consensus regarding the importance of the 2175Å feature in galaxy attenuation curves.
Previous studies have attempted to link the 2175Å feature to PAHs by comparing the strength of the 2175Å absorption relative to the abundance of PAHs. Ideally, the most straightforward manner to test this would be to compare features in extinction. However, the extreme difference in the degree of extinction between UV wavelengths (requiring stars with
 $A_V\lesssim6$
; e.g. Clayton et al. Reference Clayton2003) and mid-IR wavelengths (requiring stars with
$A_V\lesssim6$
; e.g. Clayton et al. Reference Clayton2003) and mid-IR wavelengths (requiring stars with
 $A_V\gtrsim10$
; e.g. Hensley & Draine Reference Hensley and Draine2020) makes direct comparison difficult with current facilities, although it is possible that this situation may change with new observations from JWST. Instead, PAH abundance can also be inferred from PAH emission in the mid-IR (e.g. Draine & Li Reference Draine and Li2007; Draine et al. Reference Draine2021). The strongest PAH emission features occur at rest-frame 3.3, 6.2, 7.7, 8.6, 11.3, 12.7, and 16.4
$A_V\gtrsim10$
; e.g. Hensley & Draine Reference Hensley and Draine2020) makes direct comparison difficult with current facilities, although it is possible that this situation may change with new observations from JWST. Instead, PAH abundance can also be inferred from PAH emission in the mid-IR (e.g. Draine & Li Reference Draine and Li2007; Draine et al. Reference Draine2021). The strongest PAH emission features occur at rest-frame 3.3, 6.2, 7.7, 8.6, 11.3, 12.7, and 16.4
 $\mu$
m (Tielens Reference Tielens2008; Li Reference Li2020). If PAHs are the carrier, we might expect a correlation to exist between the 2175Å absorption and PAH abundance based on emission. However, care needs to be taken to account for the fact that extinction/attenuation measures path-length(s) between stars and the observer whereas emission will arise from the entire path-length along the line-of-sight. Massa et al. (Reference Massa, Gordon and Fitzpatrick2022) used a carefully selected sample of MW stars with UV and IR spectroscopy and found a strong correlation between the 2175Å feature and the 8.6 and 11.3
$\mu$
m (Tielens Reference Tielens2008; Li Reference Li2020). If PAHs are the carrier, we might expect a correlation to exist between the 2175Å absorption and PAH abundance based on emission. However, care needs to be taken to account for the fact that extinction/attenuation measures path-length(s) between stars and the observer whereas emission will arise from the entire path-length along the line-of-sight. Massa et al. (Reference Massa, Gordon and Fitzpatrick2022) used a carefully selected sample of MW stars with UV and IR spectroscopy and found a strong correlation between the 2175Å feature and the 8.6 and 11.3
 $\mu$
m PAH emission features, a moderate correlation with the 7.7
$\mu$
m PAH emission features, a moderate correlation with the 7.7
 $\mu$
m feature, and no correlation with the 6.2
$\mu$
m feature, and no correlation with the 6.2
 $\mu$
m feature. Recently, Gordon et al. (Reference Gordon2024) performed a comparable analysis for the SMC and LMC and also found a moderate correlation between the 2175Å bump area and the abundance of PAHs (via emission). Studies attempting to look at the link between the 2175Å feature and PAH emission in external galaxies have had mixed findings; Decleir et al. (Reference Decleir2019) combined Swift/UVOT and Spitzer/IRAC data for NGC 0628 and found no significant trend between the bump strength and a proxy for PAH abundance for regions within the galaxy. Shivaei et al. (Reference Shivaei2022) combined MUSE and Spitzer/MIPS data for integrated
$\mu$
m feature. Recently, Gordon et al. (Reference Gordon2024) performed a comparable analysis for the SMC and LMC and also found a moderate correlation between the 2175Å bump area and the abundance of PAHs (via emission). Studies attempting to look at the link between the 2175Å feature and PAH emission in external galaxies have had mixed findings; Decleir et al. (Reference Decleir2019) combined Swift/UVOT and Spitzer/IRAC data for NGC 0628 and found no significant trend between the bump strength and a proxy for PAH abundance for regions within the galaxy. Shivaei et al. (Reference Shivaei2022) combined MUSE and Spitzer/MIPS data for integrated
 $z\sim2$
galaxies and found a moderate trend between these quantities. However, in both studies the accuracy of the PAH measurements are limited by the Spitzer data (in terms of mid-IR filter coverage and sensitivity). With the availability of JWST/MIRI data for nearby galaxies, which has more mid-IR filters and better sensitivity than Spitzer, it is now possible to revisit this comparison from a new perspective.
$z\sim2$
galaxies and found a moderate trend between these quantities. However, in both studies the accuracy of the PAH measurements are limited by the Spitzer data (in terms of mid-IR filter coverage and sensitivity). With the availability of JWST/MIRI data for nearby galaxies, which has more mid-IR filters and better sensitivity than Spitzer, it is now possible to revisit this comparison from a new perspective.
In this work, we use a sample of 15 nearby galaxies with excellent UV, optical, and IR data for characterising the presence of the 2175Å feature and the PAH abundance in a spatially-resolved manner, and to examine their relationship to each other and to the properties of the ISM. This paper is organised as follows: Section 2 describes the observational data and sample, Section 3 describes our methodology for deriving the various quantities used in our analysis, Section 4 shows our results, Section 5 is our discussion, and Section 6 summarises our main conclusions.
2. Data and sample
Our sample consists of 15 (out of 19) PHANGS-JWST galaxies that have UV data from Swift/UVOT (Section 2.1). These galaxies represent a subset of the PHANGS-JWST (Lee et al. Reference Lee2023) sample, which coincide exactly with the PHANGS-MUSE (Emsellem et al. Reference Emsellem2022) sample (Section 2.2). Therefore all galaxies in this sample have both mid-IR data from JWST/MIRI and optical integral field spectroscopic (IFS) data from VLT/MUSE. We also use Spitzer/IRAC data for each galaxy from the Spitzer Survey of Stellar Structure in Galaxies (S4G; Sheth et al. Reference Sheth2010) (except NGC2835, see Section 2.3). The UVOT and MIRI data provide constraints on the 2175Å absorption feature and PAH features, respectively. The MUSE data provide constraints on various ISM properties and the IRAC data are used for correcting the MIRI data for stellar continuum and to derive stellar mass maps. A gallery of the data for each galaxy is shown in Fig. 1. A list of the galaxies and their properties is shown in Table 1. All photometry and emission line measurements are corrected for foreground MW dust extinction by using the Galactic dust reddening mapsFootnote b and assuming the average MW extinction curve from Fitzpatrick et al. (Reference Fitzpatrick, Massa, Gordon, Bohlin and Clayton2019).

Figure 1. Gallery of data used in our study. For each galaxy we show a 10
 ${^\prime}\times10{^\prime}$
postage stamp of the Swift/UVOT RGB composite, JWST/MIRI RGB composite, VLT/MUSE
${^\prime}\times10{^\prime}$
postage stamp of the Swift/UVOT RGB composite, JWST/MIRI RGB composite, VLT/MUSE
 $\mathrm{H}\alpha$
, and Spitzer/IRAC 3.6
$\mathrm{H}\alpha$
, and Spitzer/IRAC 3.6
 $\mu$
m (dust-corrected), and the area of mutual overlap (limited by MIRI and MUSE data). All images are log-scale. Our main analysis is restricted to the region of overlap between the datasets. (figure continues on the next page)
$\mu$
m (dust-corrected), and the area of mutual overlap (limited by MIRI and MUSE data). All images are log-scale. Our main analysis is restricted to the region of overlap between the datasets. (figure continues on the next page)
2.1 Swift/UVOT
The Neil Gehrels Swift Observatory (Gehrels et al. Reference Gehrels2004) can observe gamma-ray, X-ray, UV, and optical wavebands, but our focus will be to use UV data from its UVOT instrument (Roming et al. Reference Roming2005). UVOT has a field of view of 17
 ${^\prime}\times17^\prime$
, a spatial resolution of
${^\prime}\times17^\prime$
, a spatial resolution of
 $2.5{^{\prime\prime}}$
, and provides UV observations in three filters, UVW2 (
$2.5{^{\prime\prime}}$
, and provides UV observations in three filters, UVW2 (
 $\lambda_\mathrm{eff}=0.1991\,\mu$
m;
$\lambda_\mathrm{eff}=0.1991\,\mu$
m;
 $\mathrm{FWHM}=0.0657\,\mu$
m), UVM2 (
$\mathrm{FWHM}=0.0657\,\mu$
m), UVM2 (
 $\lambda_\mathrm{eff}=0.2221\,\mu$
m;
$\lambda_\mathrm{eff}=0.2221\,\mu$
m;
 $\mathrm{FWHM}=0.0498\,\mu$
m), and UVW1 (
$\mathrm{FWHM}=0.0498\,\mu$
m), and UVW1 (
 $\lambda_\mathrm{eff}=0.2486\,\mu$
m;
$\lambda_\mathrm{eff}=0.2486\,\mu$
m;
 $\mathrm{FWHM}=0.0693\,\mu$
m) (Poole et al. Reference Poole2008; Decleir et al. Reference Decleir2019). These three filters are ideally suited to study the 2175Å feature in the local universe because the two ‘wide’ filters (UVW2 and UVW1) lie off the feature and the medium filter (UVM2) lies on top of the feature. The UVOT filters have been used for the purpose of measuring the 2175Å feature by numerous studies (e.g. Hoversten et al. Reference Hoversten2011; Hagen et al. Reference Hagen2017; Decleir et al. Reference Decleir2019; Decleir Reference Decleir2019; Ferreras et al. Reference Ferreras2021; Wang et al. Reference Wang, Gao, Ren and Chen2022a; Zhou et al. Reference Zhou2023; Belles et al. 2023). We retrieve all Swift/UVOT data from the NASA High Energy Astrophysics Science Archive Research Center (HEASARC) service.Footnote c Swift has a large focus on transient science (e.g. gamma ray bursts, supernovae), and many of these galaxies were observed during supernovae events. We exclude all observations of galaxies that coincide within three months after a supernovae event.
$\mathrm{FWHM}=0.0693\,\mu$
m) (Poole et al. Reference Poole2008; Decleir et al. Reference Decleir2019). These three filters are ideally suited to study the 2175Å feature in the local universe because the two ‘wide’ filters (UVW2 and UVW1) lie off the feature and the medium filter (UVM2) lies on top of the feature. The UVOT filters have been used for the purpose of measuring the 2175Å feature by numerous studies (e.g. Hoversten et al. Reference Hoversten2011; Hagen et al. Reference Hagen2017; Decleir et al. Reference Decleir2019; Decleir Reference Decleir2019; Ferreras et al. Reference Ferreras2021; Wang et al. Reference Wang, Gao, Ren and Chen2022a; Zhou et al. Reference Zhou2023; Belles et al. 2023). We retrieve all Swift/UVOT data from the NASA High Energy Astrophysics Science Archive Research Center (HEASARC) service.Footnote c Swift has a large focus on transient science (e.g. gamma ray bursts, supernovae), and many of these galaxies were observed during supernovae events. We exclude all observations of galaxies that coincide within three months after a supernovae event.
Data were reduced and mosaiced using the publicly available DRESSCode Footnote d (Data Reduction of Extended Swift Sources Code – Decleir et al. in preparation). DRESSCode is an automated pipeline that executes the different steps of the data reduction to all UVOT images. The code uses several tasks from the HEASoft softwareFootnote e and has been optimised for extended sources. The first version of this pipeline is described in detail in Decleir et al. (Reference Decleir2019), where it was used to reduce UVOT images of NGC 628. An updated version of the pipeline is explained and demonstrated in detail in chapter 2 of Decleir (Reference Decleir2019). Since then, additional updates have been made, mostly to enhance the efficiency and flexibility of the pipeline. The latest version of the code will be described in a dedicated paper by Decleir et al. (in preparation). Here, we summarise the different steps of the current version of the pipeline as it was used to reduce the images of our sample.
Raw data and calibration files were retrieved from the HEASARC Archive. First, the DRESSCode converts the raw data into ‘sky’ images, adding World Coordinate System (WCS) coordinates to the images. Then, aspect corrections are calculated and applied to the images to enhance the accuracy of the astrometry. Subsequently, the pipeline performs flux corrections to account for: (1) coincidence loss, (2) large-scale sensitivity variations, and (3) time-dependent sensitivity loss. Once these corrections have been applied to all individual frames, they are co-added (summed) per UVOT filter. Finally, the combined images are converted to flux density units (Jy) using the appropriate calibration factors, and an (inverse) aperture correction is applied to account for the fact that these calibration factors were determined for apertures with a
 $5{^{\prime\prime}}$
radius. We refer the reader to Decleir et al. (Reference Decleir2019) and Decleir (Reference Decleir2019) for more details.
$5{^{\prime\prime}}$
radius. We refer the reader to Decleir et al. (Reference Decleir2019) and Decleir (Reference Decleir2019) for more details.
We manually crop the final reduced images to remove the outer edges with low exposure time where the noise is significantly higher. This provides us with more reliable sky regions to estimate the background level for subtraction and error estimation. A list of the total exposure times for the UVOT data for each galaxy are shown in Table 2.
2.2 PHANGS-JWST and PHANGS-MUSE
The Physics at High Angular resolution in Nearby GalaxieS (PHANGS)–JWST survey (Lee et al. Reference Lee2023) is a Cycle 1 JWST Large Treasury Program (GO 2107) to obtain NIRCam and MIRI imaging of 19 nearby galaxies from the PHANGS-MUSE survey (detailed below). For this project we use only the MIRI data from F770W (
 $\lambda_\mathrm{eff}=7.528\,\mu$
m), F1130W (
$\lambda_\mathrm{eff}=7.528\,\mu$
m), F1130W (
 $\lambda_\mathrm{eff}=11.298\,\mu$
m), and F2100W (
$\lambda_\mathrm{eff}=11.298\,\mu$
m), and F2100W (
 $\lambda_\mathrm{eff}=20.563\,\mu$
m). These three filters are ideally suited to study the strong PAH features at 7.7 and 11.3
$\lambda_\mathrm{eff}=20.563\,\mu$
m). These three filters are ideally suited to study the strong PAH features at 7.7 and 11.3
 $\mu$
m because the F770W and F1130W filters lie on these features and the F2100W filter provides the baseline for the warm dust continuum emission (e.g. Chastenet et al. Reference Chastenet2023; Sutter et al. Reference Sutter2024). We use the publicly available reduced MIRI data from the PHANGS team,Footnote f which is stored by the Canadian Advanced Network for Astronomical Research (CANFAR).Footnote g
$\mu$
m because the F770W and F1130W filters lie on these features and the F2100W filter provides the baseline for the warm dust continuum emission (e.g. Chastenet et al. Reference Chastenet2023; Sutter et al. Reference Sutter2024). We use the publicly available reduced MIRI data from the PHANGS team,Footnote f which is stored by the Canadian Advanced Network for Astronomical Research (CANFAR).Footnote g
PHANGS-MUSE is a Large Program using the VLT/MUSE that obtained optical IFS data, spanning 470–935 nm (
 $R\sim$
1 800–3 600), for 19 nearby galaxies. We also use the publicly available MUSE line maps produced by the PHANGS team,Footnote h which are described in Emsellem et al. (Reference Emsellem2022). These provide the following emission line maps:
$R\sim$
1 800–3 600), for 19 nearby galaxies. We also use the publicly available MUSE line maps produced by the PHANGS team,Footnote h which are described in Emsellem et al. (Reference Emsellem2022). These provide the following emission line maps:
 $\mathrm{H}\beta$
, [OIII]
$\mathrm{H}\beta$
, [OIII]
 $\lambda$
4959, [OIII]
$\lambda$
4959, [OIII]
 $\lambda$
5007, [NII]
$\lambda$
5007, [NII]
 $\lambda$
6548,
$\lambda$
6548,
 $\mathrm{H}\alpha$
, [NII]
$\mathrm{H}\alpha$
, [NII]
 $\lambda$
6584, [SII]
$\lambda$
6584, [SII]
 $\lambda$
6717, and [SII]
$\lambda$
6717, and [SII]
 $\lambda$
6731.
$\lambda$
6731.
Our analysis will focus on the region of overlap between the PHANGS-JWST and PHANGS-MUSE data, where the former was designed to maximise overlap with the latter while also allowing flexibility for scheduling (see Figure 1 from Lee et al. Reference Lee2023). The area of overlap is shown in Fig. 1, and typically covers a
 $\sim3-4{^\prime}$
wide region in the centre of each galaxy.
$\sim3-4{^\prime}$
wide region in the centre of each galaxy.
2.3 Spitzer/IRAC
The reduced Spitzer/IRAC ch1 (
 $\lambda_\mathrm{eff}=3.550\,\mu$
m) and ch2 (
$\lambda_\mathrm{eff}=3.550\,\mu$
m) and ch2 (
 $\lambda_\mathrm{eff}=4.493\,\mu$
m) mosaics were produced by the S4G survey (Sheth et al. Reference Sheth2010) and retrieved from the NASA/IPAC Extragalactic Database,Footnote i with the exception of NGC2835 which was taken as part of pid 14033 (PI: J.C. Muñoz-Mateos). Reduced mosaics for NGC2835 were provided by M. Querejeta (priv comm.) and were observed and reduced using a similar strategy to S4G (Querejeta et al. Reference Querejeta2021).
$\lambda_\mathrm{eff}=4.493\,\mu$
m) mosaics were produced by the S4G survey (Sheth et al. Reference Sheth2010) and retrieved from the NASA/IPAC Extragalactic Database,Footnote i with the exception of NGC2835 which was taken as part of pid 14033 (PI: J.C. Muñoz-Mateos). Reduced mosaics for NGC2835 were provided by M. Querejeta (priv comm.) and were observed and reduced using a similar strategy to S4G (Querejeta et al. Reference Querejeta2021).
2.4 Foreground milky way star masks
We construct masks of foreground Milky Way (MW) stars based on the Swift UVW1 images. These are constructed using the PTS-7/8 software (Verstocken et al. Reference Verstocken2020), the Python Toolkit for SKIRT, the radiative transfer code (Camps & Baes Reference Camps and Baes2015 and 2020). Initially, the software retrieves the source catalogue from the 2MASS all-sky catalogue of point sources (Cutri et al. Reference Cutri2003). It then subtracts the background level of a small patch surrounding each point. PTS identifies a local peak as a foreground star and creates masks around it if it satisfies two conditions: (1) the local peak within the small patch is three times brighter than the background and (2) its coordinate matches that of a 2MASS point source (see Clark et al. Reference Clark2018, Decleir et al. Reference Decleir2019, and Decleir Reference Decleir2019).
2.5 Image resampling
In order to make self-consistent comparisons between the different datasets, the data are convolved and resampled to the Swift/UVOT point-spread function (PSF) because it has the lowest resolution among the datasets. This is done in two steps for each image and line map (i.e. MUSE data). First the data are convolved to match the Swift/UVOT resolution, which is approximated as a
 $2.5{^{\prime\prime}}$
Gaussian kernel,Footnote j using the techniques and kernels available from Aniano et al. (Reference Aniano, Draine, Gordon and Sandstrom2011). Second, the data are resampled to 2.5
$2.5{^{\prime\prime}}$
Gaussian kernel,Footnote j using the techniques and kernels available from Aniano et al. (Reference Aniano, Draine, Gordon and Sandstrom2011). Second, the data are resampled to 2.5
 $^{\prime\prime}$
pixels, using the SWarp software (Bertin Reference Bertin2010) and adopting RESAMPLING_TYPE=LANCZOS3. Using a resampled pixel size equal to the convolved PSF ensures that the regions can be considered independent. A visual representation of this workflow is shown in Fig. 2. For reference, the physical size of 2.5
$^{\prime\prime}$
pixels, using the SWarp software (Bertin Reference Bertin2010) and adopting RESAMPLING_TYPE=LANCZOS3. Using a resampled pixel size equal to the convolved PSF ensures that the regions can be considered independent. A visual representation of this workflow is shown in Fig. 2. For reference, the physical size of 2.5
 $^{\prime\prime}$
ranges from 60–240 pc for the distance of our sample.
$^{\prime\prime}$
ranges from 60–240 pc for the distance of our sample.
Table 1. Galaxy sample with Swift/UVOT, VLT/MUSE, and JWST/MIRI data.

Values in the first six columns are from Emsellem et al. (Reference Emsellem2022) (based on Leroy et al. Reference Leroy2021 and Lang et al. Reference Lang2020).
 $E(B-V)_\mathrm{MW}$
are from NASA/IPAC IRSA Galactic dust reddening maps.
$E(B-V)_\mathrm{MW}$
are from NASA/IPAC IRSA Galactic dust reddening maps.
 $\langle E(B-V)_{\mathrm{gas}}\rangle$
are the median gas reddening (derived from the Balmer decrement; see Section 3.2) in star forming regions (see Section 3.9 criteria (1)–(3)). Hubble Type/Morphology are from the NASA/IPAC Extragalactic Database.
$\langle E(B-V)_{\mathrm{gas}}\rangle$
are the median gas reddening (derived from the Balmer decrement; see Section 3.2) in star forming regions (see Section 3.9 criteria (1)–(3)). Hubble Type/Morphology are from the NASA/IPAC Extragalactic Database.
Table 2. Swift/UVOT exposure times.

Each exposure time corresponds to the maximum co-added depth, which typically covers the entire galaxy (FoV=
 $17{^\prime}\times17{^\prime}$
).
$17{^\prime}\times17{^\prime}$
).
3. Methodology
In this Section we describe the methods for quantifying the various physical properties of interest in this study. Examples of the property maps are shown in Fig. 3.
3.1 2175Å absorption feature strength –
 $\textbf{A}$
bump
$\textbf{A}$
bump

The 2175Å feature is quantified using a simple analytic combination of the three Swift/UVOT filters in three steps. First, the UV continuum slope,
 $\beta$
, is measured from the two (off-feature) wide filters under the assumption that the UV flux density follows a power-law shape over the range
$\beta$
, is measured from the two (off-feature) wide filters under the assumption that the UV flux density follows a power-law shape over the range
 $1\,250\le\lambda\le 2\,600$
Å (e.g. Calzetti et al. Reference Calzetti, Kinney and Storchi-Bergmann1994),
$1\,250\le\lambda\le 2\,600$
Å (e.g. Calzetti et al. Reference Calzetti, Kinney and Storchi-Bergmann1994),
 \begin{equation}\begin{aligned}\log f_\lambda(\lambda)= C + \beta \times \log \lambda \,,\end{aligned}\end{equation}
where
 $f_\lambda(\lambda)$
is the flux density, in units of erg s
$f_\lambda(\lambda)$
is the flux density, in units of erg s
 $^{-1}$
cm
$^{-1}$
cm
 $^{-2}$
Å
$^{-2}$
Å
 $^{-1}$
,
$^{-1}$
,
 $\lambda$
is the wavelength in Å, and C is a constant normalisation term. Using the Swift filters for the UV slope,
$\lambda$
is the wavelength in Å, and C is a constant normalisation term. Using the Swift filters for the UV slope,
 $\beta_{\mathrm{Swift}}$
,
$\beta_{\mathrm{Swift}}$
,
 \begin{equation}\begin{aligned}\beta_{\mathrm{Swift}} = \frac{\log[f_\lambda(\mathrm{UVW2})/f_\lambda(\mathrm{UVW1})]}{\log[\lambda_{\mathrm{UVW2}}/\lambda_{\mathrm{UVW1}}]} \,.\end{aligned}\end{equation}
Second, we estimate the expected flux density for the UVM2 filter assuming this UV continuum slope, and corresponding to the expected value in the absence of a 2175Å feature,
 \begin{equation}\begin{aligned}\log f_{\lambda}(\mathrm{UVM2},0) = C + \beta \times \log \lambda_{\mathrm{eff,UVM2}} \,.\end{aligned}\end{equation}
Third, the 2175Å feature strength,
 $A_\mathrm{bump}$
, is estimated from the ratio of the observed flux density in the UVM2 filter relative to the value derived from the UV slope,
$A_\mathrm{bump}$
, is estimated from the ratio of the observed flux density in the UVM2 filter relative to the value derived from the UV slope,
 \begin{equation}\begin{aligned}A_{\mathrm{bump}} = -2.5 \log (f_{\lambda}(\mathrm{UVM2})/f_{\lambda}(\mathrm{UVM2},0)) \,,\end{aligned}\end{equation}
where
 $A_\mathrm{bump}$
has units of magnitudes. An example of these steps for an example pixel in our sample is shown in Fig. 4. This formalism is effectively the same as that used in Zhou et al. (Reference Zhou2023) for estimating the bump strength from the three Swift filters (see their Section 3.2). The uncertainty on
$A_\mathrm{bump}$
has units of magnitudes. An example of these steps for an example pixel in our sample is shown in Fig. 4. This formalism is effectively the same as that used in Zhou et al. (Reference Zhou2023) for estimating the bump strength from the three Swift filters (see their Section 3.2). The uncertainty on
 $A_\mathrm{bump}$
is a combination of the uncertainty from the UV-slope and normalisation and the uncertainty of the observation at UVM2 (see Fig. 4).
$A_\mathrm{bump}$
is a combination of the uncertainty from the UV-slope and normalisation and the uncertainty of the observation at UVM2 (see Fig. 4).
The apparent strength of the 2175Å feature (i.e.
 $A_\mathrm{bump}$
) will scale with the total amount of dust attenuation, with dustier regions exhibiting larger absorption features. Therefore, to characterise the intrinsic bump strength, it is necessary to normalise
$A_\mathrm{bump}$
) will scale with the total amount of dust attenuation, with dustier regions exhibiting larger absorption features. Therefore, to characterise the intrinsic bump strength, it is necessary to normalise
 $A_\mathrm{bump}$
with respect to the total attenuation in a given band (e.g.
$A_\mathrm{bump}$
with respect to the total attenuation in a given band (e.g.
 $A_V$
is commonly used) or with respect to the reddening
$A_V$
is commonly used) or with respect to the reddening
 $E(B-V)$
. For the purpose of this paper we normalise with respect to the reddening to get the intrinsic bump strength,
$E(B-V)$
. For the purpose of this paper we normalise with respect to the reddening to get the intrinsic bump strength,
 $k_\mathrm{bump}$
,
$k_\mathrm{bump}$
,
 \begin{equation}\begin{aligned}k_{\mathrm{bump}} = A_{\mathrm{bump}}/E(B-V) \,.\end{aligned}\end{equation}
The method for characterising the reddening is described in the next section. For reference, the MW extinction curve has an average
 $k_{\mathrm{bump}}\sim 3.3$
(Fitzpatrick Reference Fitzpatrick1999; Salim & Narayanan Reference Salim and Narayanan2020).
$k_{\mathrm{bump}}\sim 3.3$
(Fitzpatrick Reference Fitzpatrick1999; Salim & Narayanan Reference Salim and Narayanan2020).

Figure 2. The data processing workflow to enable consistent photometric and spectroscopic comparison. ((a)
 $\Rightarrow$
(b)) We start with a fully-reduced and calibrated image or line map at its native resolution and convolve it with a 2.5
$\Rightarrow$
(b)) We start with a fully-reduced and calibrated image or line map at its native resolution and convolve it with a 2.5
 $^{\prime\prime}$
Gaussian kernel (Swift/UVOT PSF), which is the largest PSF among the data, using the techniques and kernels available from Aniano et al. (Reference Aniano, Draine, Gordon and Sandstrom2011). ((b)
$^{\prime\prime}$
Gaussian kernel (Swift/UVOT PSF), which is the largest PSF among the data, using the techniques and kernels available from Aniano et al. (Reference Aniano, Draine, Gordon and Sandstrom2011). ((b)
 $\Rightarrow$
(c)) Next, the convolved images are resampled to a pixel size of 2.5
$\Rightarrow$
(c)) Next, the convolved images are resampled to a pixel size of 2.5
 $^{\prime\prime}$
using the SWarp software (Bertin Reference Bertin2010). The panels show this process for MIRI/F770W data of NGC 4321. All data from Swift, JWST, VLT, and Spitzer were convolved and resampled to the same 2.5
$^{\prime\prime}$
using the SWarp software (Bertin Reference Bertin2010). The panels show this process for MIRI/F770W data of NGC 4321. All data from Swift, JWST, VLT, and Spitzer were convolved and resampled to the same 2.5
 ${^{\prime\prime}}$
grid.
${^{\prime\prime}}$
grid.

Figure 3. Example of derived property maps for NGC 4321. From left to right, the 2175Å strength
 $A_\mathrm{bump}$
, ionised gas reddening
$A_\mathrm{bump}$
, ionised gas reddening
 $E(B-V)_{\mathrm{gas}}$
, PAH abundance
$E(B-V)_{\mathrm{gas}}$
, PAH abundance
 $R_\mathrm{PAH}$
, log(SFR), log(
$R_\mathrm{PAH}$
, log(SFR), log(
 $M_\star$
), BPT classifications, and gas-phase metallicity (using Scal). The methods used to derive each property are described in Section 3. The holes of missing data in
$M_\star$
), BPT classifications, and gas-phase metallicity (using Scal). The methods used to derive each property are described in Section 3. The holes of missing data in
 $A_\mathrm{bump}$
correspond to regions masked due to foreground MW stars.
$A_\mathrm{bump}$
correspond to regions masked due to foreground MW stars.
Finally, we note that the values of
 $A_\mathrm{bump}$
(and
$A_\mathrm{bump}$
(and
 $k_\mathrm{bump}$
) based on the UVOT filters will typically be an underestimate of the true values that would be inferred based on a spectroscopic method. This occurs for two reasons: (1) the width of the UVM2 filter will suppress the peak amplitude of the feature and (2) the UVW2 and UVW1 filters have tails that extend into the 2175Å feature such that they do not provide a completely clean baseline for the UV continuum. However, the UVW2 and UVW1 filters also have extended red tails (see Fig. A1) such that the measured UV continuum baseline can be higher than the true value for very red SEDs (e.g. old stellar populations). This second effect is not seen to significantly impact the measurements of the continuum baseline in our sample, based on SED modelling (e.g. see moderately reddened SED fit for an example region of NGC 4321 in Fig. B1), and therefore we do not correct for this. This is likely because our selection criteria (Section 3.9) tend to restrict our analysis to star-forming regions with younger average stellar populations. We detail the reliability of the Swift/UVOT filters to measure the UV slopes and 2175Å feature in Appendix A.
$k_\mathrm{bump}$
) based on the UVOT filters will typically be an underestimate of the true values that would be inferred based on a spectroscopic method. This occurs for two reasons: (1) the width of the UVM2 filter will suppress the peak amplitude of the feature and (2) the UVW2 and UVW1 filters have tails that extend into the 2175Å feature such that they do not provide a completely clean baseline for the UV continuum. However, the UVW2 and UVW1 filters also have extended red tails (see Fig. A1) such that the measured UV continuum baseline can be higher than the true value for very red SEDs (e.g. old stellar populations). This second effect is not seen to significantly impact the measurements of the continuum baseline in our sample, based on SED modelling (e.g. see moderately reddened SED fit for an example region of NGC 4321 in Fig. B1), and therefore we do not correct for this. This is likely because our selection criteria (Section 3.9) tend to restrict our analysis to star-forming regions with younger average stellar populations. We detail the reliability of the Swift/UVOT filters to measure the UV slopes and 2175Å feature in Appendix A.
In summary, the true bump amplitude is expected to scale linearly with the value inferred from the UVOT filters such that the correlations observed and presented in this work should be robust but that the exact parameters of our fits should be treated with caution.
3.2 Ionised gas reddening –
$\textbf{E}(\textbf{B}-\textbf{V})$
gas

The 2175Å absorption feature is measured relative to the stellar continuum, hence its strength is expected to be linked to the reddening on the stellar continuum,
 $E(B-V)_{\mathrm{star}}$
. However, accurately measuring the reddening on the stellar continuum is non-trivial due to the degeneracy in SED colour with stellar population age and typically requires full SED coverage from UV to IR to break this degeneracy via an energy balance assumption or through spectral modelling of the stellar continuum and absorption features. Performing such modelling is computationally expensive and also prone to uncertainty at the scales of our resampled pixels (
$E(B-V)_{\mathrm{star}}$
. However, accurately measuring the reddening on the stellar continuum is non-trivial due to the degeneracy in SED colour with stellar population age and typically requires full SED coverage from UV to IR to break this degeneracy via an energy balance assumption or through spectral modelling of the stellar continuum and absorption features. Performing such modelling is computationally expensive and also prone to uncertainty at the scales of our resampled pixels (
 $\sim$
60–240 pc). This is due to the energy balance assumption beginning to break down on scales
$\sim$
60–240 pc). This is due to the energy balance assumption beginning to break down on scales
 $\lesssim$
1 kpc (e.g. Smith & Hayward Reference Smith and Hayward2018).
$\lesssim$
1 kpc (e.g. Smith & Hayward Reference Smith and Hayward2018).
Another reddening diagnostic is the amount of reddening on the ionised gas,
 $E(B-V)_{\mathrm{gas}}$
, based on the Balmer decrement, F(
$E(B-V)_{\mathrm{gas}}$
, based on the Balmer decrement, F(
 $\mathrm{H}\alpha$
)/F(
$\mathrm{H}\alpha$
)/F(
 $\mathrm{H}\beta$
), and available from the VLT/MUSE data,
$\mathrm{H}\beta$
), and available from the VLT/MUSE data,
 \begin{equation}\begin{aligned}E(B-V)_{\mathrm{gas}} = \frac{\log((F(\mathrm{H}\alpha)/F(\mathrm{H}\beta))/2.86)}{0.4(k(\mathrm{H}\beta)-k(\mathrm{H}\alpha))} \,,\end{aligned}\end{equation}
where 2.86 is the theoretical value expected for the unreddened ratio of
 $F(\mathrm{H}\alpha)/F(\mathrm{H}\beta)$
undergoing Case B recombination with
$F(\mathrm{H}\alpha)/F(\mathrm{H}\beta)$
undergoing Case B recombination with
 $T_{\mathrm{e}}=10^4$
K and
$T_{\mathrm{e}}=10^4$
K and
 $n_{\mathrm{e}}=100$
cm
$n_{\mathrm{e}}=100$
cm
 $^{-3}$
(Osterbrock Reference Osterbrock1989; Osterbrock & Ferland Reference Osterbrock and Ferland2006), and we assume an average MW extinction curve,
$^{-3}$
(Osterbrock Reference Osterbrock1989; Osterbrock & Ferland Reference Osterbrock and Ferland2006), and we assume an average MW extinction curve,
 $k(\lambda)$
, at the wavelengths of
$k(\lambda)$
, at the wavelengths of
 $\mathrm{H}\beta$
and
$\mathrm{H}\beta$
and
 $\mathrm{H}\alpha$
, with
$\mathrm{H}\alpha$
, with
 $k(\mathrm{H}\beta)-k(\mathrm{H}\alpha)=1.160$
(Fitzpatrick et al. Reference Fitzpatrick, Massa, Gordon, Bohlin and Clayton2019).
$k(\mathrm{H}\beta)-k(\mathrm{H}\alpha)=1.160$
(Fitzpatrick et al. Reference Fitzpatrick, Massa, Gordon, Bohlin and Clayton2019).
In nearby galaxies it is generally found that the stellar continuum experiences roughly half the amount of reddening relative to the ionised gas on average, (
 $\langle E(B-V)_{\mathrm{star}}\rangle/\langle E(B-V)_{\mathrm{gas}}\rangle\ \sim0.5$
; e.g. Calzetti et al. Reference Calzetti, Kinney and Storchi-Bergmann1994; Kreckel et al. Reference Kreckel2013; Battisti, Calzetti, & Chary Reference Battisti, Calzetti and Chary2016; Emsellem et al. Reference Emsellem2022). We measure this relationship for galaxies in our sample and found a similar trend (see Appendix B), indicating that using either
$\langle E(B-V)_{\mathrm{star}}\rangle/\langle E(B-V)_{\mathrm{gas}}\rangle\ \sim0.5$
; e.g. Calzetti et al. Reference Calzetti, Kinney and Storchi-Bergmann1994; Kreckel et al. Reference Kreckel2013; Battisti, Calzetti, & Chary Reference Battisti, Calzetti and Chary2016; Emsellem et al. Reference Emsellem2022). We measure this relationship for galaxies in our sample and found a similar trend (see Appendix B), indicating that using either
 $E(B-V)_{\mathrm{gas}}$
or
$E(B-V)_{\mathrm{gas}}$
or
 $E(B-V)_{\mathrm{star}}$
is reasonable to trace reddening in a region.
$E(B-V)_{\mathrm{star}}$
is reasonable to trace reddening in a region.
For our analysis, we will normalise the bump strength using the amount of reddening from the ionised gas,
 $E(B-V)_{\mathrm{gas}}$
, because it is empirical and (mostly) independent of assumptions (Case B recombination), which helps to avoid circularity issues. While this method relies on an assumed dust extinction curve for the ionised gas reddening, our choice of the MW curve should be reasonable given that the PHANGS sample consists primarily of massive spiral galaxies. Furthermore, the shape of the average MW, LMC, and SMC extinction curves are relatively similar at the optical wavelengths of
$E(B-V)_{\mathrm{gas}}$
, because it is empirical and (mostly) independent of assumptions (Case B recombination), which helps to avoid circularity issues. While this method relies on an assumed dust extinction curve for the ionised gas reddening, our choice of the MW curve should be reasonable given that the PHANGS sample consists primarily of massive spiral galaxies. Furthermore, the shape of the average MW, LMC, and SMC extinction curves are relatively similar at the optical wavelengths of
 $\mathrm{H}\alpha$
and
$\mathrm{H}\alpha$
and
 $\mathrm{H}\beta$
(i.e. average
$\mathrm{H}\beta$
(i.e. average
 $k(\mathrm{H}\beta)-k(\mathrm{H}\alpha)$
are within 15%) and show the largest variations at UV wavelengths.
$k(\mathrm{H}\beta)-k(\mathrm{H}\alpha)$
are within 15%) and show the largest variations at UV wavelengths.
For completeness, we also performed the main analysis of this work using stellar continuum reddening (
 $A_{V,star}$
) derived from MAGPHYS SED modelling. These results are presented in Appendix B and show qualitatively the same results as we find when normalising by the ionised gas reddening. We attribute this to the fact that stellar and gas reddening show a relatively tight correlation at the spatial scales of our regions (see Fig. B2).
$A_{V,star}$
) derived from MAGPHYS SED modelling. These results are presented in Appendix B and show qualitatively the same results as we find when normalising by the ionised gas reddening. We attribute this to the fact that stellar and gas reddening show a relatively tight correlation at the spatial scales of our regions (see Fig. B2).

Figure 4. Example of how the 2175Å feature strength,
 $A_\mathrm{bump}$
, is derived for each region based on the Swift data (black squares). We fit the UV continuum slope,
$A_\mathrm{bump}$
, is derived for each region based on the Swift data (black squares). We fit the UV continuum slope,
 $\beta_{\mathrm{Swift}}$
(black line), from the two off-feature Swift filters (UVW2 and UVW1) and determine the expected flux density at UVM2 (orange square). This value is then compared to the observed flux density at UVM2 (middle observation). The 1
$\beta_{\mathrm{Swift}}$
(black line), from the two off-feature Swift filters (UVW2 and UVW1) and determine the expected flux density at UVM2 (orange square). This value is then compared to the observed flux density at UVM2 (middle observation). The 1
 $\sigma$
uncertainty on the UV slope and normalisation is shown by dashed grey lines and accounted for in the uncertainty of
$\sigma$
uncertainty on the UV slope and normalisation is shown by dashed grey lines and accounted for in the uncertainty of
 $A_\mathrm{bump}$
.
$A_\mathrm{bump}$
.
3.3 PAH abundance –
$\textbf{R}$
PAH

The abundance of PAHs is inferred using the proxy
 $R_\mathrm{PAH}$
(Chastenet et al. Reference Chastenet2023; Sutter et al. Reference Sutter2024), but slightly modified to remove the contribution of emission from the stellar continuum,
$R_\mathrm{PAH}$
(Chastenet et al. Reference Chastenet2023; Sutter et al. Reference Sutter2024), but slightly modified to remove the contribution of emission from the stellar continuum,
 \begin{equation}\begin{aligned}R_\mathrm{PAH} = \frac{f_{\nu,\mathrm{dust}}(\mathrm{F770W})+f_{\nu,\mathrm{dust}}(\mathrm{F1130W})}{f_{\nu,\mathrm{dust}}(\mathrm{F2100W})} \,,\end{aligned}\end{equation}
where
 $f_{\nu,\mathrm{dust}}(\lambda)$
is the dust-only flux density for a particular filter in units of erg s
$f_{\nu,\mathrm{dust}}(\lambda)$
is the dust-only flux density for a particular filter in units of erg s
 $^{-1}$
cm
$^{-1}$
cm
 $^{-2}$
Hz
$^{-2}$
Hz
 $^{-1}$
. The dust-only emission is determined by subtracting the stellar continuum using the Spitzer/IRAC ch1 data by assuming the stellar emission follows a blackbody,
$^{-1}$
. The dust-only emission is determined by subtracting the stellar continuum using the Spitzer/IRAC ch1 data by assuming the stellar emission follows a blackbody,
 \begin{equation}\begin{aligned}f_{\nu,\mathrm{dust}}(\lambda) = f_{\nu}(\lambda) - \frac{B_\nu(\lambda,T_{\star,eff})}{B_\nu(\mathrm{IRAC1},T_{\star,eff})} f_{\nu}(\mathrm{IRAC1}) \,.\end{aligned}\end{equation}
where
 $B_\nu(\lambda,T_{\star,eff})$
is the blackbody function and
$B_\nu(\lambda,T_{\star,eff})$
is the blackbody function and
 $T_{\star,eff}$
is the effective temperature of the stellar population. We assume
$T_{\star,eff}$
is the effective temperature of the stellar population. We assume
 $T_{\star,eff}=5\,000$
K, which is representative of local star-forming galaxies (Draine et al. Reference Draine2007). For reference, the blackbody flux ratio in Equation (8) assuming
$T_{\star,eff}=5\,000$
K, which is representative of local star-forming galaxies (Draine et al. Reference Draine2007). For reference, the blackbody flux ratio in Equation (8) assuming
 $T_{\star,eff}=5\,000$
K is 0.276, 0.133, and 0.042 for F770W, F1130W, and F2100W, respectively. For the regions analysed in this study (selection described in Section 3.9), the median fraction of emission removed is
$T_{\star,eff}=5\,000$
K is 0.276, 0.133, and 0.042 for F770W, F1130W, and F2100W, respectively. For the regions analysed in this study (selection described in Section 3.9), the median fraction of emission removed is
 $0.056^{+0.037}_{-0.021}$
,
$0.056^{+0.037}_{-0.021}$
,
 $0.019^{+0.012}_{-0.007}$
, and
$0.019^{+0.012}_{-0.007}$
, and
 $0.012^{+0.009}_{-0.005}$
for F770W, F1130, and F2100W, respectively. This approach is roughly similar to the method used in Sutter et al. (Reference Sutter2024) for PHANGS-JWST, who remove the stellar continuum using SED-fitting of the JWST/NIRCam+JWST/MIRI data. We choose to use IRAC instead of NIRCam data because we adopt stellar mass maps derived from IRAC data (see Section 3.5), and therefore we consider this approach to be more self-consistent.
$0.012^{+0.009}_{-0.005}$
for F770W, F1130, and F2100W, respectively. This approach is roughly similar to the method used in Sutter et al. (Reference Sutter2024) for PHANGS-JWST, who remove the stellar continuum using SED-fitting of the JWST/NIRCam+JWST/MIRI data. We choose to use IRAC instead of NIRCam data because we adopt stellar mass maps derived from IRAC data (see Section 3.5), and therefore we consider this approach to be more self-consistent.
We note that the 7.7
 $\mu$
m/11.3
$\mu$
m/11.3
 $\mu$
m ratio changes in galaxies with different ionising spectra (e.g. Draine et al. Reference Draine2021), which may impact the values of
$\mu$
m ratio changes in galaxies with different ionising spectra (e.g. Draine et al. Reference Draine2021), which may impact the values of
 $R_\mathrm{PAH}$
in different local environments of galaxies. We explored this by using only single PAH-feature measurements (e.g. F770W/F2100W), but found that the results are qualitatively consistent with those found using
$R_\mathrm{PAH}$
in different local environments of galaxies. We explored this by using only single PAH-feature measurements (e.g. F770W/F2100W), but found that the results are qualitatively consistent with those found using
 $R_\mathrm{PAH}$
.
$R_\mathrm{PAH}$
.
3.4 Star formation rate – SFR
Star formation rates (SFRs) for individual regions are derived from extinction-corrected
 $\mathrm{H}\alpha$
,
$\mathrm{H}\alpha$
,
 \begin{equation}\begin{aligned}F(\mathrm{H}\alpha)_\mathrm{corr}=F(\mathrm{H}\alpha) 10^{(0.4 k(\mathrm{H}\alpha)E(B-V)_{\mathrm{gas}})} \,,\end{aligned}\end{equation}
where we assume an average MW extinction curve (Fitzpatrick et al. Reference Fitzpatrick, Massa, Gordon, Bohlin and Clayton2019) for
 $k(\mathrm{H}\alpha)$
and
$k(\mathrm{H}\alpha)$
and
 $E(B-V)_{\mathrm{gas}}$
is derived following Equation (6). We convert this to a luminosity based on the luminosity distance (see Table 1) and use the conversion from Calzetti (Reference Calzetti, Falcón-Barroso and Knapen2013), which assumes a Kroupa (Reference Kroupa2001) initial mass function (IMF),
$E(B-V)_{\mathrm{gas}}$
is derived following Equation (6). We convert this to a luminosity based on the luminosity distance (see Table 1) and use the conversion from Calzetti (Reference Calzetti, Falcón-Barroso and Knapen2013), which assumes a Kroupa (Reference Kroupa2001) initial mass function (IMF),
 \begin{equation}\begin{aligned}\mathrm{SFR}(M_\odot\ \mathrm{yr}^{-1}) = 5.5\cdot 10^{-42} L(\mathrm{H}\alpha)_\mathrm{corr} \,,\end{aligned}\end{equation}
where the
 $\mathrm{H}\alpha$
luminosity is measured in erg s
$\mathrm{H}\alpha$
luminosity is measured in erg s
 $^{-1}$
.
$^{-1}$
.
3.5 Stellar Mass –
$\textbf{M}_\star$

When available, we use the Independent Component Analysis (ICA) data products produced by the S4G Pipeline 5Footnote k (P5; Querejeta et al. Reference Querejeta2015). The ICA method separates the emission from old stars and dust that contribute to the observed IRAC ch1 (3.6
 $\mu$
m) flux. Querejeta et al. (Reference Querejeta2015) find that as much as 10%–30% of the total 3.6
$\mu$
m) flux. Querejeta et al. (Reference Querejeta2015) find that as much as 10%–30% of the total 3.6
 $\mu$
m flux can be contributed by dust, with larger fractions occuring for galaxies with higher specific–SFR (sSFR=SFR/
$\mu$
m flux can be contributed by dust, with larger fractions occuring for galaxies with higher specific–SFR (sSFR=SFR/
 $M_\star$
). We use the P5 stellar emission maps (e.g. NGCXXXX.stellar.fits) together with eq (6) in Querejeta et al. (Reference Querejeta2015) to estimate the stellar mass contained in a resampled pixel. We adopt a mass-to-light ratio
$M_\star$
). We use the P5 stellar emission maps (e.g. NGCXXXX.stellar.fits) together with eq (6) in Querejeta et al. (Reference Querejeta2015) to estimate the stellar mass contained in a resampled pixel. We adopt a mass-to-light ratio
 $M/L=0.6$
as recommended by the authors. We note that this mass-to-light ratio assumes a Chabrier (Reference Chabrier2003) IMF, which differs slightly from a Kroupa (Reference Kroupa2001) IMF (used for SFRs), but that the impact on
$M/L=0.6$
as recommended by the authors. We note that this mass-to-light ratio assumes a Chabrier (Reference Chabrier2003) IMF, which differs slightly from a Kroupa (Reference Kroupa2001) IMF (used for SFRs), but that the impact on
 $M_\star$
and SFR values between these IMFs are very minor (e.g. Speagle et al. Reference Speagle, Steinhardt, Capak and Silverman2014).
$M_\star$
and SFR values between these IMFs are very minor (e.g. Speagle et al. Reference Speagle, Steinhardt, Capak and Silverman2014).
Three of the S4G galaxies do not have ICA products available (NGC1433, 1512, and IC5332), indicating they have IRAC colours consistent with minimal dust contamination. This is further supported by the weak overall PAH emission in the JWST/MIRI data for these galaxies. For these galaxies, we first estimate the
 $M/L$
for each region using eq (7) in Querejeta et al. (Reference Querejeta2015) and then use eq (6) in Querejeta et al. (Reference Querejeta2015) assuming the original IRAC data are representative of the stellar-only emission. For NGC2835, we use eq (8) in Querejeta et al. (Reference Querejeta2015) because it was not run through the S4G P5. For the sample with ICA products, we find the ICA-based stellar masses show good agreement (within
$M/L$
for each region using eq (7) in Querejeta et al. (Reference Querejeta2015) and then use eq (6) in Querejeta et al. (Reference Querejeta2015) assuming the original IRAC data are representative of the stellar-only emission. For NGC2835, we use eq (8) in Querejeta et al. (Reference Querejeta2015) because it was not run through the S4G P5. For the sample with ICA products, we find the ICA-based stellar masses show good agreement (within
 $\sim$
0.1dex) with those derived from eq (8) in Querejeta et al. (Reference Querejeta2015) (by design), such that this should not significantly affect our analysis.
$\sim$
0.1dex) with those derived from eq (8) in Querejeta et al. (Reference Querejeta2015) (by design), such that this should not significantly affect our analysis.
3.6 Ionisation source classification
The assumed intrinsic value for the Balmer decrement assumes conditions appropriate for star-forming HII regions of a galaxy. Therefore, we restrict our analysis to regions that are classified as star-forming using the standard Reference Baldwin, Phillips and TerlevichBaldwin, Phillips & Terlevich (BPT; Baldwin et al. Reference Baldwin, Phillips and Terlevich1981) diagram and using the demarcation lines from Kewley et al. (Reference Kewley, Dopita, Sutherland, Heisler and Trevena2001) and Kauffmann et al. (Reference Kauffmann2003). We require that all emission lines ([OIII]/
 $\mathrm{H}\beta$
vs. [NII]/
$\mathrm{H}\beta$
vs. [NII]/
 $\mathrm{H}\alpha$
) have
$\mathrm{H}\alpha$
) have
 $S/N\ge3$
per region for determining a classification. This requirement does not significantly restrict our sample that satisfies our photometric requirements (conditions (1) and (2) Section 3.9), with 73%-100% (median 87%) of regions in each galaxy also satisfying this emission line
$S/N\ge3$
per region for determining a classification. This requirement does not significantly restrict our sample that satisfies our photometric requirements (conditions (1) and (2) Section 3.9), with 73%-100% (median 87%) of regions in each galaxy also satisfying this emission line
 $S/N$
condition.
$S/N$
condition.
3.7 Gas-phase metallicity
We adopt the Scal prescription of Pilyugin & Grebel (Reference Pilyugin and Grebel2016), which is the preferred method of the PHANGS team (Kreckel et al. Reference Kreckel2019; Groves et al. Reference Groves2023), to estimate the gas-phase metallicity. This prescription uses a combination of the following line ratios:
 \begin{align}\begin{split}\mathrm{N}_2 &= (\mathrm{[NII]}\lambda 6548 + \lambda 6584) / \mathrm{H}\beta \,,\\\mathrm{S}_2 &= (\mathrm{[SII]}\lambda 6717 + \lambda 6731) / \mathrm{H}\beta \,,\\\mathrm{R}_3 &= (\mathrm{[OIII]}\lambda 4959 + \lambda 5007) / \mathrm{H}\beta \,.\end{split}\end{align}
These lines are extinction corrected assuming a MW extinction curve (Fitzpatrick et al. Reference Fitzpatrick, Massa, Gordon, Bohlin and Clayton2019) and
 $E(B-V)_{\mathrm{gas}}$
derived following Equation (6). We require that all emission lines have
$E(B-V)_{\mathrm{gas}}$
derived following Equation (6). We require that all emission lines have
 $S/N\ge3$
per region to estimate a metallicity for a region. This requirement is very similar to above because it uses many of the same emission lines, with the exception of [SII]. We find 73%–100% (median 86%) of regions in each galaxy that satisfy the photometric requirements also satisfy this condition.
$S/N\ge3$
per region to estimate a metallicity for a region. This requirement is very similar to above because it uses many of the same emission lines, with the exception of [SII]. We find 73%–100% (median 86%) of regions in each galaxy that satisfy the photometric requirements also satisfy this condition.
3.8 Surface area
In order to compare resolved regions of galaxies at different distances in a fair manner, we normalise stellar masses and SFRs by the surface area of the resampled regions. The surface area depends on the distance of the galaxy and the inclination according to:
 \begin{equation}\begin{aligned}Area [kpc^2] = \frac{(\theta_\mathrm{region} D_\mathrm{Lum}/206265)^2}{\cos(i)} \,,\end{aligned}\end{equation}
where we are assuming the small angle approximation and an infinitely thin disc,
 $\theta_\mathrm{region}$
is in arcsec (2.5
$\theta_\mathrm{region}$
is in arcsec (2.5
 $^{\prime\prime}$
in our case),
$^{\prime\prime}$
in our case),
 $D_\mathrm{Lum}$
is in kpc, and i is the inclination angle. The adopted distance and inclination values for each galaxy are listed in Table 1.
$D_\mathrm{Lum}$
is in kpc, and i is the inclination angle. The adopted distance and inclination values for each galaxy are listed in Table 1.
3.9 Selection cuts
We select a robust sample of star-forming regions by requiring that the following conditions are met for each resampled region:
-
(1) All Swift and JWST photometry are
$S/N \ge 5$
-
(2) Uncontaminated by MW foreground stars
-
(3) Classified as ‘star-forming’ on the BPT diagram
-
(4)
$\sigma(k_{\mathrm{bump}}) \lt 0.5$


The value of
 $\sigma(k_{\mathrm{bump}})$
is determined from propagating the uncertainty of the two free parameters in
$\sigma(k_{\mathrm{bump}})$
is determined from propagating the uncertainty of the two free parameters in
 $k_{\mathrm{bump}}$
(i.e.
$k_{\mathrm{bump}}$
(i.e.
 $\sigma(A_{\mathrm{bump}})$
and
$\sigma(A_{\mathrm{bump}})$
and
 $\sigma(E(B-V)_{\mathrm{gas}})$
). Condition (4) is imposed to restrict the analysis to regions with reliable bump measurements. The primary factor affecting the bump measurement accuracy is the Swift depth; however, we note that the sample with the lowest uncertainties on
$\sigma(E(B-V)_{\mathrm{gas}})$
). Condition (4) is imposed to restrict the analysis to regions with reliable bump measurements. The primary factor affecting the bump measurement accuracy is the Swift depth; however, we note that the sample with the lowest uncertainties on
 $k_\mathrm{bump}$
do not directly correspond to the deepest Swift data (see Table 2). This is because
$k_\mathrm{bump}$
do not directly correspond to the deepest Swift data (see Table 2). This is because
 $k_\mathrm{bump}$
also depends on the uncertainty in reddening (
$k_\mathrm{bump}$
also depends on the uncertainty in reddening (
 $E(B-V)_{\mathrm{gas}}$
), which depends on the Balmer lines from the VLT/MUSE data. At a fixed
$E(B-V)_{\mathrm{gas}}$
), which depends on the Balmer lines from the VLT/MUSE data. At a fixed
 $S/N$
value for the emission lines, regions with lower total reddening will have larger uncertainties on
$S/N$
value for the emission lines, regions with lower total reddening will have larger uncertainties on
 $k_\mathrm{bump}$
(i.e. if
$k_\mathrm{bump}$
(i.e. if
 $A_\mathrm{bump} \gt 0$
, you get
$A_\mathrm{bump} \gt 0$
, you get
 $k_{\mathrm{bump}}\rightarrow\infty$
as
$k_{\mathrm{bump}}\rightarrow\infty$
as
 $E(B-V)_{\mathrm{gas}}\rightarrow0$
). As a result, condition (4) limits our analysis to regions with
$E(B-V)_{\mathrm{gas}}\rightarrow0$
). As a result, condition (4) limits our analysis to regions with
 $E(B-V)_{\mathrm{gas}} \gtrsim 0.07$
. An example where the reddening term is the dominant source of uncertainty is IC5332, which has a median
$E(B-V)_{\mathrm{gas}} \gtrsim 0.07$
. An example where the reddening term is the dominant source of uncertainty is IC5332, which has a median
 $E(B-V)_{\mathrm{gas}}$
of 0.05 and a majority of its star-forming regions do not satisfy condition (4). Therefore, we do not report on correlation strengths for IC5332 in the subsequent analysis. The property maps for each galaxy after these selection cuts are applied are shown in Fig. 5.
$E(B-V)_{\mathrm{gas}}$
of 0.05 and a majority of its star-forming regions do not satisfy condition (4). Therefore, we do not report on correlation strengths for IC5332 in the subsequent analysis. The property maps for each galaxy after these selection cuts are applied are shown in Fig. 5.

Figure 5. Derived property maps for regions that satisfy the selection cuts described in Section 3.9. Each property (i.e. column) uses the same colour-scale range, covering 2.5%–97.5% of the full distribution (see brackets at top). From left to right: the intrinsic 2175Å strength (
 $k_\mathrm{bump}$
), PAH abundance (
$k_\mathrm{bump}$
), PAH abundance (
 $R_\mathrm{PAH}$
), SFR surface density (log(
$R_\mathrm{PAH}$
), SFR surface density (log(
 $\Sigma_\mathrm{SFR}$
)), stellar mass surface density (log(
$\Sigma_\mathrm{SFR}$
)), stellar mass surface density (log(
 $\Sigma_{\mathrm{M}\star}$
)), specific-SFR (
$\Sigma_{\mathrm{M}\star}$
)), specific-SFR (
 $\mathrm{sSFR}=\log \mathrm{SFR}-\log(M_\star)$
), ionised gas reddening (
$\mathrm{sSFR}=\log \mathrm{SFR}-\log(M_\star)$
), ionised gas reddening (
 $E(B-V)_{\mathrm{gas}}$
), and gas-phase metallicity (
$E(B-V)_{\mathrm{gas}}$
), and gas-phase metallicity (
 $12+\log(\mathrm{O/H})$
; using Scal). A positive correlation between
$12+\log(\mathrm{O/H})$
; using Scal). A positive correlation between
 $k_\mathrm{bump}$
and
$k_\mathrm{bump}$
and
 $R_\mathrm{PAH}$
is evident, which provides support for PAHs as a potential carrier of the bump. Negative correlations between
$R_\mathrm{PAH}$
is evident, which provides support for PAHs as a potential carrier of the bump. Negative correlations between
 $k_\mathrm{bump}$
and
$k_\mathrm{bump}$
and
 $R_\mathrm{PAH}$
with log(
$R_\mathrm{PAH}$
with log(
 $\Sigma_\mathrm{SFR}$
) and sSFR are evident, which may indicate that small dust grains are being destroyed by ionising photons from massive stars. No significant correlations with log(
$\Sigma_\mathrm{SFR}$
) and sSFR are evident, which may indicate that small dust grains are being destroyed by ionising photons from massive stars. No significant correlations with log(
 $\Sigma_{\mathrm{M}\star}$
),
$\Sigma_{\mathrm{M}\star}$
),
 $E(B-V)_{\mathrm{gas}}$
, or
$E(B-V)_{\mathrm{gas}}$
, or
 $12+\log(\mathrm{O/H})$
are evident. There are relatively few regions in NGC 1433, 2835, and IC5332 after our selection cuts, which is due to shallower UV coverage and/or low reddening for these galaxies. (figure continues on the next page)
$12+\log(\mathrm{O/H})$
are evident. There are relatively few regions in NGC 1433, 2835, and IC5332 after our selection cuts, which is due to shallower UV coverage and/or low reddening for these galaxies. (figure continues on the next page)
4. Results
4.1
$\textbf{k}$
bump
-
$\textbf{R}$
PAH
correlation


We present a comparison between
 $k_\mathrm{bump}$
and
$k_\mathrm{bump}$
and
 $R_\mathrm{PAH}$
for individual galaxies in Fig. 6, left. We find a slight positive correlation between these parameters, with the Spearman correlation coefficient ranging from
$R_\mathrm{PAH}$
for individual galaxies in Fig. 6, left. We find a slight positive correlation between these parameters, with the Spearman correlation coefficient ranging from
 $0.3 \lesssim \rho \lesssim 0.5$
for galaxies with a moderate number of regions available after selection cuts. The correlation strength generally increases for galaxies with tighter constraints on
$0.3 \lesssim \rho \lesssim 0.5$
for galaxies with a moderate number of regions available after selection cuts. The correlation strength generally increases for galaxies with tighter constraints on
 $k_\mathrm{bump}$
. We note that comparing
$k_\mathrm{bump}$
. We note that comparing
 $A_\mathrm{bump}$
without normalisation by reddening with
$A_\mathrm{bump}$
without normalisation by reddening with
 $R_\mathrm{PAH}$
shows systematically lower correlation strength in our sample (lower by
$R_\mathrm{PAH}$
shows systematically lower correlation strength in our sample (lower by
 $\rho\sim0.2$
). The median values of
$\rho\sim0.2$
). The median values of
 $k_\mathrm{bump}$
and
$k_\mathrm{bump}$
and
 $R_\mathrm{PAH}$
for the entire sample are 0.73 and 3.2, respectively. This
$R_\mathrm{PAH}$
for the entire sample are 0.73 and 3.2, respectively. This
 $k_\mathrm{bump}$
value corresponds to 22% the MW strength; however, we note that the true strength is likely higher due to the limitations of relying on the Swift/UVOT filters to measure the feature (see Appendix A) and the use of ionised gas reddening for the normalisation (see Appendix B).
$k_\mathrm{bump}$
value corresponds to 22% the MW strength; however, we note that the true strength is likely higher due to the limitations of relying on the Swift/UVOT filters to measure the feature (see Appendix A) and the use of ionised gas reddening for the normalisation (see Appendix B).
Fig. 6, right, shows a 2D histogram combining the five galaxies with the lowest uncertainties on
 $k_\mathrm{bump}$
(NGC 1365, 1566, 1672, 3627, and 4321; median value of
$k_\mathrm{bump}$
(NGC 1365, 1566, 1672, 3627, and 4321; median value of
 $\sigma(k_\mathrm{bump})\lesssim 0.25$
), but excluding NGC 4303 because it shows a noticeable vertical offset towards larger
$\sigma(k_\mathrm{bump})\lesssim 0.25$
), but excluding NGC 4303 because it shows a noticeable vertical offset towards larger
 $k_\mathrm{bump}$
from other galaxies. No obvious causes for this offset are apparent from inspecting the Swift data, although we note this galaxy has a larger difference between the exposure lengths of UVW2 and UVW1 relative to UVM2 than the rest of the sample (see Table 2. These five galaxies are among the most massive in the PHANGS sample, ranging from
$k_\mathrm{bump}$
from other galaxies. No obvious causes for this offset are apparent from inspecting the Swift data, although we note this galaxy has a larger difference between the exposure lengths of UVW2 and UVW1 relative to UVM2 than the rest of the sample (see Table 2. These five galaxies are among the most massive in the PHANGS sample, ranging from
 $10.7 \lt \log(M_\star/M_\odot) \lt11$
with a median of
$10.7 \lt \log(M_\star/M_\odot) \lt11$
with a median of
 $\log(M_\star/M_\odot)=10.82$
(see Table 1). We note that NGC 1433 (
$\log(M_\star/M_\odot)=10.82$
(see Table 1). We note that NGC 1433 (
 $\log(M_\star/M_\odot)=10.87$
) is not in this group because it has shallower Swift data relative to the other massive galaxies. We fit a linear relationship to these combined data using the MPFITEXY routine (Williams, Bureau, & Cappellari Reference Williams, Bureau and Cappellari2010), which relies on the MPFIT package (Markwardt Reference Markwardt, Bohlender, Durand and Dowler2009). This routine performs a linear least-squares fit using the error in both variables while also including a term accounting for intrinsic scatter in the data. We also perform a simple second-order polynomial least-square fit and note that the difference relative to the linear fit is very minor. The parameters of both fits are listed in Table 3.
$\log(M_\star/M_\odot)=10.87$
) is not in this group because it has shallower Swift data relative to the other massive galaxies. We fit a linear relationship to these combined data using the MPFITEXY routine (Williams, Bureau, & Cappellari Reference Williams, Bureau and Cappellari2010), which relies on the MPFIT package (Markwardt Reference Markwardt, Bohlender, Durand and Dowler2009). This routine performs a linear least-squares fit using the error in both variables while also including a term accounting for intrinsic scatter in the data. We also perform a simple second-order polynomial least-square fit and note that the difference relative to the linear fit is very minor. The parameters of both fits are listed in Table 3.
Table 3. Fit parameters of
 $k_\mathrm{bump}$
and
$k_\mathrm{bump}$
and
 $R_\mathrm{PAH}$
as a function of galaxy roperties.
$R_\mathrm{PAH}$
as a function of galaxy roperties.

Notes. The functional form of these fits is
 $y = p_0+p_1x+p_2x^2$
, where y is
$y = p_0+p_1x+p_2x^2$
, where y is
 $k_\mathrm{bump}$
or
$k_\mathrm{bump}$
or
 $R_\mathrm{PAH}$
(middle and right columns, respectively). We present both a linear and second-order polynomial fit for each case. We also report the intrinsic dispersion,
$R_\mathrm{PAH}$
(middle and right columns, respectively). We present both a linear and second-order polynomial fit for each case. We also report the intrinsic dispersion,
 $\sigma_{\mathrm{int}}$
, returned from MPFITEXY, and the Spearman nonparametric correlation coefficient,
$\sigma_{\mathrm{int}}$
, returned from MPFITEXY, and the Spearman nonparametric correlation coefficient,
 $\rho_S$
. The data used in the fits are a combination of five galaxies (NGC 1365, 1566, 1672, 3627, and 4321).
$\rho_S$
. The data used in the fits are a combination of five galaxies (NGC 1365, 1566, 1672, 3627, and 4321).

Figure 6. (Left:) Intrinsic 2175Å feature strength,
 $k_\mathrm{bump}$
=
$k_\mathrm{bump}$
=
 $A_\mathrm{bump}/E(B-V)_{\mathrm{gas}}$
, vs. PAH abundance,
$A_\mathrm{bump}/E(B-V)_{\mathrm{gas}}$
, vs. PAH abundance,
 $R_\mathrm{PAH}$
=(F770W+F1130W)/F2100W, for the 15 galaxies in our sample. The Spearman correlation coefficient for each galaxy is indicated in the upper-right of each panel for cases with a p-value<0.01. Representative median error bars of the regions in quartiles of
$R_\mathrm{PAH}$
=(F770W+F1130W)/F2100W, for the 15 galaxies in our sample. The Spearman correlation coefficient for each galaxy is indicated in the upper-right of each panel for cases with a p-value<0.01. Representative median error bars of the regions in quartiles of
 $R_\mathrm{PAH}$
are shown at the bottom of each panel. Most galaxies show a slight correlation between these quantities, with the correlation strength being higher when
$R_\mathrm{PAH}$
are shown at the bottom of each panel. Most galaxies show a slight correlation between these quantities, with the correlation strength being higher when
 $k_\mathrm{bump}$
is better constrained (y-axis error bar). NGC1300 and NGC4303 show a systemic offset towards higher
$k_\mathrm{bump}$
is better constrained (y-axis error bar). NGC1300 and NGC4303 show a systemic offset towards higher
 $A_\mathrm{bump}/E(B-V)_{\mathrm{gas}}$
at a given
$A_\mathrm{bump}/E(B-V)_{\mathrm{gas}}$
at a given
 $R_\mathrm{PAH}$
, the cause of which is unclear. (Right:) 2D histogram of
$R_\mathrm{PAH}$
, the cause of which is unclear. (Right:) 2D histogram of
 $k_\mathrm{bump}$
vs.
$k_\mathrm{bump}$
vs.
 $R_\mathrm{PAH}$
combining five galaxies with median value of
$R_\mathrm{PAH}$
combining five galaxies with median value of
 $\sigma(k_\mathrm{bump})\lesssim 0.25$
(except NGC 4303): NGC 1365, 1566, 1672, 3627, and 4321. The running median values are indicated by the black hatch lines. Linear and second-order best-fits are shown as a dashed orange line and dash-dot magenta line, respectively, which highlight a positive correlation between these parameters, albeit with large intrinsic scatter. A representative median errorbar is shown in the upper-right.
$\sigma(k_\mathrm{bump})\lesssim 0.25$
(except NGC 4303): NGC 1365, 1566, 1672, 3627, and 4321. The running median values are indicated by the black hatch lines. Linear and second-order best-fits are shown as a dashed orange line and dash-dot magenta line, respectively, which highlight a positive correlation between these parameters, albeit with large intrinsic scatter. A representative median errorbar is shown in the upper-right.
4.2
$\textbf{k}$
bump
and
$\textbf{R}$
PAH
correlation with
$\Sigma$
SFR
and sSFR


We present a comparison between
 $k_\mathrm{bump}$
and
$k_\mathrm{bump}$
and
 $R_\mathrm{PAH}$
with two proxies of the ionisation parameter of a region, the SFR surface density,
$R_\mathrm{PAH}$
with two proxies of the ionisation parameter of a region, the SFR surface density,
 $\Sigma_{SFR}$
=SFR/Area, and the specific-SFR, sSFR=SFR/
$\Sigma_{SFR}$
=SFR/Area, and the specific-SFR, sSFR=SFR/
 $M_\star$
. We note that MUSE does not cover [OII] to provide a direct tracer of the ionisation parameter through the [OIII]/[OII] ratio (Kewley, Nicholls, & Sutherland Reference Kewley, Nicholls and Sutherland2019). The
$M_\star$
. We note that MUSE does not cover [OII] to provide a direct tracer of the ionisation parameter through the [OIII]/[OII] ratio (Kewley, Nicholls, & Sutherland Reference Kewley, Nicholls and Sutherland2019). The
 $\Sigma_{SFR}$
and sSFR parameters are found to have the strongest correlation with
$\Sigma_{SFR}$
and sSFR parameters are found to have the strongest correlation with
 $k_\mathrm{bump}$
and
$k_\mathrm{bump}$
and
 $R_\mathrm{PAH}$
among the parameters that we examined (see Section 4.3). As described in Section 3.4, the SFRs (and SFR surface densities) in this work are derived from
$R_\mathrm{PAH}$
among the parameters that we examined (see Section 4.3). As described in Section 3.4, the SFRs (and SFR surface densities) in this work are derived from
 $\mathrm{H}\alpha$
and will correspond to average star formation on timescales of
$\mathrm{H}\alpha$
and will correspond to average star formation on timescales of
 $\sim$
10 Myr. In practice, sSFR can be easier to measure for high-redshift samples than
$\sim$
10 Myr. In practice, sSFR can be easier to measure for high-redshift samples than
 $\Sigma_{SFR}$
because the galaxies examined can be unresolved.
$\Sigma_{SFR}$
because the galaxies examined can be unresolved.
A comparison between
 $k_\mathrm{bump}$
and
$k_\mathrm{bump}$
and
 $\Sigma_{SFR}$
is shown in Fig. 7, and
$\Sigma_{SFR}$
is shown in Fig. 7, and
 $R_\mathrm{PAH}$
and
$R_\mathrm{PAH}$
and
 $\Sigma_{SFR}$
in Fig. 8. We find a moderate negative correlation between these parameters, with the Spearman correlation coefficient ranging from
$\Sigma_{SFR}$
in Fig. 8. We find a moderate negative correlation between these parameters, with the Spearman correlation coefficient ranging from
 $-0.6 \lesssim \rho \lesssim -0.3$
for
$-0.6 \lesssim \rho \lesssim -0.3$
for
 $k_\mathrm{bump}$
vs.
$k_\mathrm{bump}$
vs.
 $\Sigma_{SFR}$
, and
$\Sigma_{SFR}$
, and
 $-0.7 \lesssim \rho \lesssim -0.5$
for
$-0.7 \lesssim \rho \lesssim -0.5$
for
 $R_\mathrm{PAH}$
vs.
$R_\mathrm{PAH}$
vs.
 $\Sigma_{SFR}$
. Linear and second-order polynomial least-square fits parameters to the five galaxies with robust measurements are listed in Table 3.
$\Sigma_{SFR}$
. Linear and second-order polynomial least-square fits parameters to the five galaxies with robust measurements are listed in Table 3.

Figure 7. Similar to Fig. 6, except now showing the intrinsic 2175Å feature strength,
 $k_\mathrm{bump}$
=
$k_\mathrm{bump}$
=
 $A_\mathrm{bump}/E(B-V)_{\mathrm{gas}}$
, vs. SFR surface density,
$A_\mathrm{bump}/E(B-V)_{\mathrm{gas}}$
, vs. SFR surface density,
 $\Sigma_{SFR}$
. Representative median error bars are in quartiles of
$\Sigma_{SFR}$
. Representative median error bars are in quartiles of
 $\Sigma_{SFR}$
. The 2D histogram combines five galaxies with median value of
$\Sigma_{SFR}$
. The 2D histogram combines five galaxies with median value of
 $\sigma(k_\mathrm{bump})\lesssim 0.25$
(except NGC 4303): NGC 1365, 1566, 1672, 3627, and 4321. The best-fits highlight a negative correlation between these parameters, albeit with large intrinsic scatter.
$\sigma(k_\mathrm{bump})\lesssim 0.25$
(except NGC 4303): NGC 1365, 1566, 1672, 3627, and 4321. The best-fits highlight a negative correlation between these parameters, albeit with large intrinsic scatter.

Figure 8. Similar to Fig. 6, except now showing the PAH abundance,
 $R_\mathrm{PAH}$
=(F770W+F1130W)/F2100W, vs. SFR surface density,
$R_\mathrm{PAH}$
=(F770W+F1130W)/F2100W, vs. SFR surface density,
 $\Sigma_{SFR}$
. Representative median error bars are in quartiles of
$\Sigma_{SFR}$
. Representative median error bars are in quartiles of
 $\Sigma_{SFR}$
. For consistency with the previous figures, the 2D histogram combines the same five galaxies with median value of
$\Sigma_{SFR}$
. For consistency with the previous figures, the 2D histogram combines the same five galaxies with median value of
 $\sigma(k_\mathrm{bump})\lesssim 0.25$
(except NGC 4303): NGC 1365, 1566, 1672, 3627, and 4321. The best-fits highlight a negative correlation between these parameters, albeit with large intrinsic scatter.
$\sigma(k_\mathrm{bump})\lesssim 0.25$
(except NGC 4303): NGC 1365, 1566, 1672, 3627, and 4321. The best-fits highlight a negative correlation between these parameters, albeit with large intrinsic scatter.
A comparison between
 $k_\mathrm{bump}$
and sSFR is shown in Fig. 9, and
$k_\mathrm{bump}$
and sSFR is shown in Fig. 9, and
 $R_\mathrm{PAH}$
and sSFR in Fig. 10. We find similar trends to those with
$R_\mathrm{PAH}$
and sSFR in Fig. 10. We find similar trends to those with
 $\Sigma_{SFR}$
, with a moderate negative correlation between these parameters and sSFR, with the Spearman correlation coefficient ranging from
$\Sigma_{SFR}$
, with a moderate negative correlation between these parameters and sSFR, with the Spearman correlation coefficient ranging from
 $-0.6 \lesssim \rho \lesssim -0.2$
for
$-0.6 \lesssim \rho \lesssim -0.2$
for
 $k_\mathrm{bump}$
vs. sSFR, and
$k_\mathrm{bump}$
vs. sSFR, and
 $-0.6 \lesssim \rho \lesssim -0.3$
for
$-0.6 \lesssim \rho \lesssim -0.3$
for
 $R_\mathrm{PAH}$
vs. sSFR. Linear and second-order polynomial least-square fits parameters to the five galaxies with robust measurements are listed in Table 3. The slightly weaker correlations with sSFR than
$R_\mathrm{PAH}$
vs. sSFR. Linear and second-order polynomial least-square fits parameters to the five galaxies with robust measurements are listed in Table 3. The slightly weaker correlations with sSFR than
 $\Sigma_{SFR}$
suggest that these parameters are more closely tied to the presence of young stars (i.e. SFR) than older stars (
$\Sigma_{SFR}$
suggest that these parameters are more closely tied to the presence of young stars (i.e. SFR) than older stars (
 $M_\star$
). This is also supported by the fact that there is no (or weak) correlation with stellar mass surface density for most galaxies (Section 4.3).
$M_\star$
). This is also supported by the fact that there is no (or weak) correlation with stellar mass surface density for most galaxies (Section 4.3).

Figure 9. Similar to Fig. 6, except now showing the intrinsic 2175Å feature strength,
 $k_\mathrm{bump}$
=
$k_\mathrm{bump}$
=
 $A_\mathrm{bump}/E(B-V)_{\mathrm{gas}}$
, vs. sSFR. Representative median error bars are in quartiles of sSFR. The 2D histogram combines five galaxies with median value of
$A_\mathrm{bump}/E(B-V)_{\mathrm{gas}}$
, vs. sSFR. Representative median error bars are in quartiles of sSFR. The 2D histogram combines five galaxies with median value of
 $\sigma(k_\mathrm{bump})\lesssim 0.25$
(except NGC 4303): NGC 1365, 1566, 1672, 3627, and 4321. The best-fits highlight a negative correlation between these parameters, albeit with large intrinsic scatter. The red dash-dot line shows the relation in Kashino et al. (Reference Kashino2021) for galaxies at
$\sigma(k_\mathrm{bump})\lesssim 0.25$
(except NGC 4303): NGC 1365, 1566, 1672, 3627, and 4321. The best-fits highlight a negative correlation between these parameters, albeit with large intrinsic scatter. The red dash-dot line shows the relation in Kashino et al. (Reference Kashino2021) for galaxies at
 $z\sim1.56$
(adopting
$z\sim1.56$
(adopting
 $\log(M_\star/M_\odot)=10.82$
; the mean value of the five PHANGS galaxies shown). The red dashed line is the same relation after applying a MS-offset between
$\log(M_\star/M_\odot)=10.82$
; the mean value of the five PHANGS galaxies shown). The red dashed line is the same relation after applying a MS-offset between
 $z=1.56$
and
$z=1.56$
and
 $z=0$
(see Section 5.2) and shows qualitative agreement with the local relation.
$z=0$
(see Section 5.2) and shows qualitative agreement with the local relation.
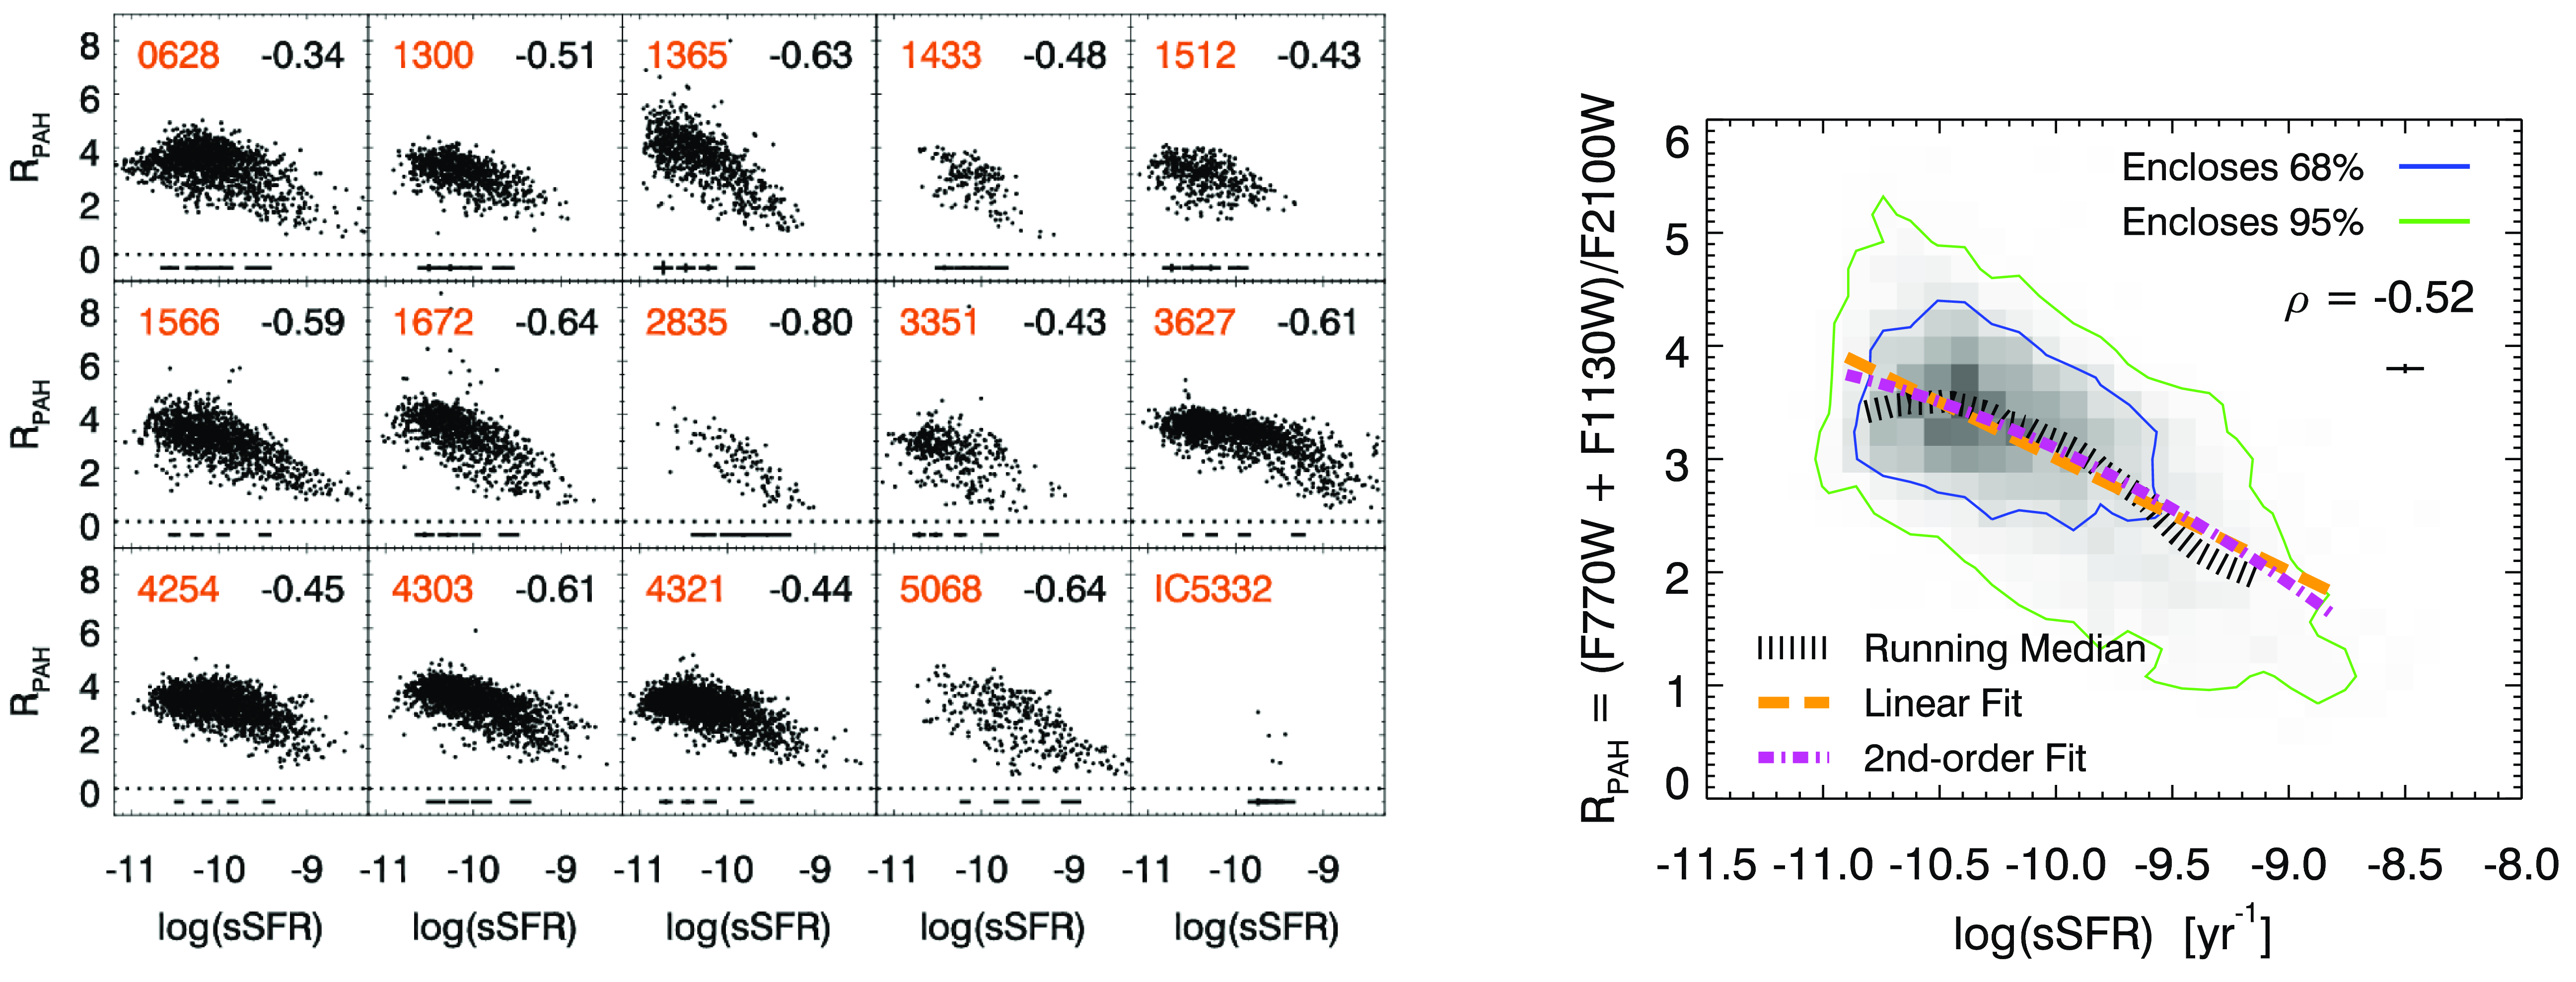
Figure 10. Similar to Fig. 6, except now showing the PAH abundance,
 $R_\mathrm{PAH}$
=(F770W+F1130W)/F2100W, vs. sSFR. Representative median error bars are in quartiles of sSFR. For consistency with the previous figures, the 2D histogram combines the same five galaxies with median value of
$R_\mathrm{PAH}$
=(F770W+F1130W)/F2100W, vs. sSFR. Representative median error bars are in quartiles of sSFR. For consistency with the previous figures, the 2D histogram combines the same five galaxies with median value of
 $\sigma(k_\mathrm{bump})\lesssim 0.25$
(except NGC 4303): NGC 1365, 1566, 1672, 3627, and 4321. The best-fits highlight a negative correlation between these parameters, albeit with large intrinsic scatter.
$\sigma(k_\mathrm{bump})\lesssim 0.25$
(except NGC 4303): NGC 1365, 1566, 1672, 3627, and 4321. The best-fits highlight a negative correlation between these parameters, albeit with large intrinsic scatter.
4.3
$\textbf{k}$
bump
and
$\textbf{R}$
PAH
correlation with other parameters


We explored a range of additional correlations between
 $k_\mathrm{bump}$
and
$k_\mathrm{bump}$
and
 $R_\mathrm{PAH}$
with other physical properties. These include gas-phase metallicity, total reddening (
$R_\mathrm{PAH}$
with other physical properties. These include gas-phase metallicity, total reddening (
 $E(B-V)_{\mathrm{gas}}$
), stellar mass surface density, and galactocentric radius. We do not attempt a comparison with the UV slope (
$E(B-V)_{\mathrm{gas}}$
), stellar mass surface density, and galactocentric radius. We do not attempt a comparison with the UV slope (
 $\beta$
) because the value derived from the Swift/UVOT filters is heavily contaminated by the 2175Å feature (see Appendix A). For nearly all cases the correlation strengths were not found to be significant (
$\beta$
) because the value derived from the Swift/UVOT filters is heavily contaminated by the 2175Å feature (see Appendix A). For nearly all cases the correlation strengths were not found to be significant (
 $\vert \rho \vert \lesssim 0.3$
), and the few exceptions do not share correlation strengths between both
$\vert \rho \vert \lesssim 0.3$
), and the few exceptions do not share correlation strengths between both
 $k_\mathrm{bump}$
and
$k_\mathrm{bump}$
and
 $R_\mathrm{PAH}$
as is found for
$R_\mathrm{PAH}$
as is found for
 $\Sigma_{SFR}$
and sSFR. We note that our sample spans a narrow range in metallicity, with 98% of the regions after our selection cuts being in the range
$\Sigma_{SFR}$
and sSFR. We note that our sample spans a narrow range in metallicity, with 98% of the regions after our selection cuts being in the range
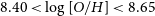 $8.40 \lt \log[O/H] \lt 8.65$
(using Scal) and that previous studies suggest that PAH abundances may only significantly vary at metallicities of
$8.40 \lt \log[O/H] \lt 8.65$
(using Scal) and that previous studies suggest that PAH abundances may only significantly vary at metallicities of
 $\log[O/H] \lesssim 8.1$
(Draine et al. Reference Draine2007; Marble et al. Reference Marble2010). Ongoing and future measurements of PAH features for nearby dwarf galaxies with JWST/MIRI will undoubtedly improve our picture of this in the near future due to these objects tending to have lower metallicities. Regarding the galactocentric radius, we do find that the strength of
$\log[O/H] \lesssim 8.1$
(Draine et al. Reference Draine2007; Marble et al. Reference Marble2010). Ongoing and future measurements of PAH features for nearby dwarf galaxies with JWST/MIRI will undoubtedly improve our picture of this in the near future due to these objects tending to have lower metallicities. Regarding the galactocentric radius, we do find that the strength of
 $k_\mathrm{bump}$
and values of
$k_\mathrm{bump}$
and values of
 $R_\mathrm{PAH}$
tend to be lower in the very central regions relative to the outskirts, but that this is likely a reflection of the central regions having higher SFRs.
$R_\mathrm{PAH}$
tend to be lower in the very central regions relative to the outskirts, but that this is likely a reflection of the central regions having higher SFRs.
5. Discussion
5.1 Implications of trends and correlation strengths
We find a moderate correlation between
 $k_\mathrm{bump}$
and
$k_\mathrm{bump}$
and
 $R_\mathrm{PAH}$
for galaxies where the former can be well-constrained. This lends support for PAHs to be a potential carrier of the feature, but this is far from conclusive. For instance, it is almost certainly the case the 2175Å feature is due to small dust grains (e.g. Mathis Reference Mathis1994; Draine Reference Draine2003), and PAHs (which are also small grains) may simply be co-spatial with other small dust grains. The link to small grains is further supported by the anti-correlation of both
$R_\mathrm{PAH}$
for galaxies where the former can be well-constrained. This lends support for PAHs to be a potential carrier of the feature, but this is far from conclusive. For instance, it is almost certainly the case the 2175Å feature is due to small dust grains (e.g. Mathis Reference Mathis1994; Draine Reference Draine2003), and PAHs (which are also small grains) may simply be co-spatial with other small dust grains. The link to small grains is further supported by the anti-correlation of both
 $k_\mathrm{bump}$
and
$k_\mathrm{bump}$
and
 $R_\mathrm{PAH}$
with
$R_\mathrm{PAH}$
with
 $\Sigma_{SFR}$
and sSFR, which are proxies of the ionising radiation strength. Ionising radiation is likely to destroy (via photodissociation) small dust grains responsible for both the 2175Å feature (e.g. Calzetti et al. Reference Calzetti, Kinney and Storchi-Bergmann1994; Clayton et al. Reference Clayton, Gordon and Wolff2000; Fischera & Dopita Reference Fischera and Dopita2011) and PAHs (e.g. Egorov et al. Reference Egorov2023; Sutter et al. Reference Sutter2024; Chastenet et al. Reference Chastenet2024; Chown et al. Reference Chown2024), and it is interesting that the correlation strengths are stronger with these ionisation proxies than the correlation with each other. However, as we discuss below, the trend of
$\Sigma_{SFR}$
and sSFR, which are proxies of the ionising radiation strength. Ionising radiation is likely to destroy (via photodissociation) small dust grains responsible for both the 2175Å feature (e.g. Calzetti et al. Reference Calzetti, Kinney and Storchi-Bergmann1994; Clayton et al. Reference Clayton, Gordon and Wolff2000; Fischera & Dopita Reference Fischera and Dopita2011) and PAHs (e.g. Egorov et al. Reference Egorov2023; Sutter et al. Reference Sutter2024; Chastenet et al. Reference Chastenet2024; Chown et al. Reference Chown2024), and it is interesting that the correlation strengths are stronger with these ionisation proxies than the correlation with each other. However, as we discuss below, the trend of
 $R_\mathrm{PAH}$
with
$R_\mathrm{PAH}$
with
 $\Sigma_{SFR}$
and sSFR can be also explained with dust heating, rather than PAH destruction. We can test the correlation between
$\Sigma_{SFR}$
and sSFR can be also explained with dust heating, rather than PAH destruction. We can test the correlation between
 $k_\mathrm{bump}$
and
$k_\mathrm{bump}$
and
 $R_\mathrm{PAH}$
while controlling for
$R_\mathrm{PAH}$
while controlling for
 $\Sigma_{SFR}$
, by examining the partial correlation coefficient Kendall (Reference Kendall1942),
$\Sigma_{SFR}$
, by examining the partial correlation coefficient Kendall (Reference Kendall1942),
 \begin{equation}\begin{aligned}\rho_{AB|C}=\frac{\rho_{AB}-\rho_{AC}\rho_{BC}}{\sqrt{1-\rho_{AC}^2}\sqrt{1-\rho_{BC}^2}} \,,\end{aligned}\end{equation}
where
 $\rho_{AB}$
is the Spearman correlation coefficient between variables A and B, and so on for other combinations. We note this metric assumes a monotonic relation is present between the quantities of interest. In our case, we choose A, B, and C to be
$\rho_{AB}$
is the Spearman correlation coefficient between variables A and B, and so on for other combinations. We note this metric assumes a monotonic relation is present between the quantities of interest. In our case, we choose A, B, and C to be
 $k_\mathrm{bump}$
,
$k_\mathrm{bump}$
,
 $R_\mathrm{PAH}$
, and
$R_\mathrm{PAH}$
, and
 $\Sigma_{SFR}$
, respectively. We adopt the correlation coefficients listed in Table 3, which are based on our five ‘robust’ galaxies. We find a value of
$\Sigma_{SFR}$
, respectively. We adopt the correlation coefficients listed in Table 3, which are based on our five ‘robust’ galaxies. We find a value of
 $\rho_{AB|C}=0.02$
, indicating that the correlation between
$\rho_{AB|C}=0.02$
, indicating that the correlation between
 $k_\mathrm{bump}$
and
$k_\mathrm{bump}$
and
 $R_\mathrm{PAH}$
may be entirely driven by the correlation of these quantities with
$R_\mathrm{PAH}$
may be entirely driven by the correlation of these quantities with
 $\Sigma_{SFR}$
. If we use sSFR for C, we get
$\Sigma_{SFR}$
. If we use sSFR for C, we get
 $\rho_{AB|C}=0.19$
.
$\rho_{AB|C}=0.19$
.
An independent, and more visually intuitive, test can be done by examining the correlation strengths of these quantities when subdividing the regions of each galaxy into quartiles of
 $\Sigma_{SFR}$
, which is shown in Fig. 11. We find that the correlation strengths between
$\Sigma_{SFR}$
, which is shown in Fig. 11. We find that the correlation strengths between
 $A_\mathrm{bump}$
and
$A_\mathrm{bump}$
and
 $R_\mathrm{PAH}$
for all galaxies are lower for the quartile subsamples (
$R_\mathrm{PAH}$
for all galaxies are lower for the quartile subsamples (
 $\rho \lesssim 0.3$
), with only the highest
$\rho \lesssim 0.3$
), with only the highest
 $\Sigma_{SFR}$
quartile retaining a moderate trend in a couple cases (
$\Sigma_{SFR}$
quartile retaining a moderate trend in a couple cases (
 $\rho \sim 0.3$
; e.g. NGC 1566, 1672). This outcome also suggests that most of the correlation between these quantities may be a consequence of the correlation with
$\rho \sim 0.3$
; e.g. NGC 1566, 1672). This outcome also suggests that most of the correlation between these quantities may be a consequence of the correlation with
 $\Sigma_{SFR}$
.
$\Sigma_{SFR}$
.
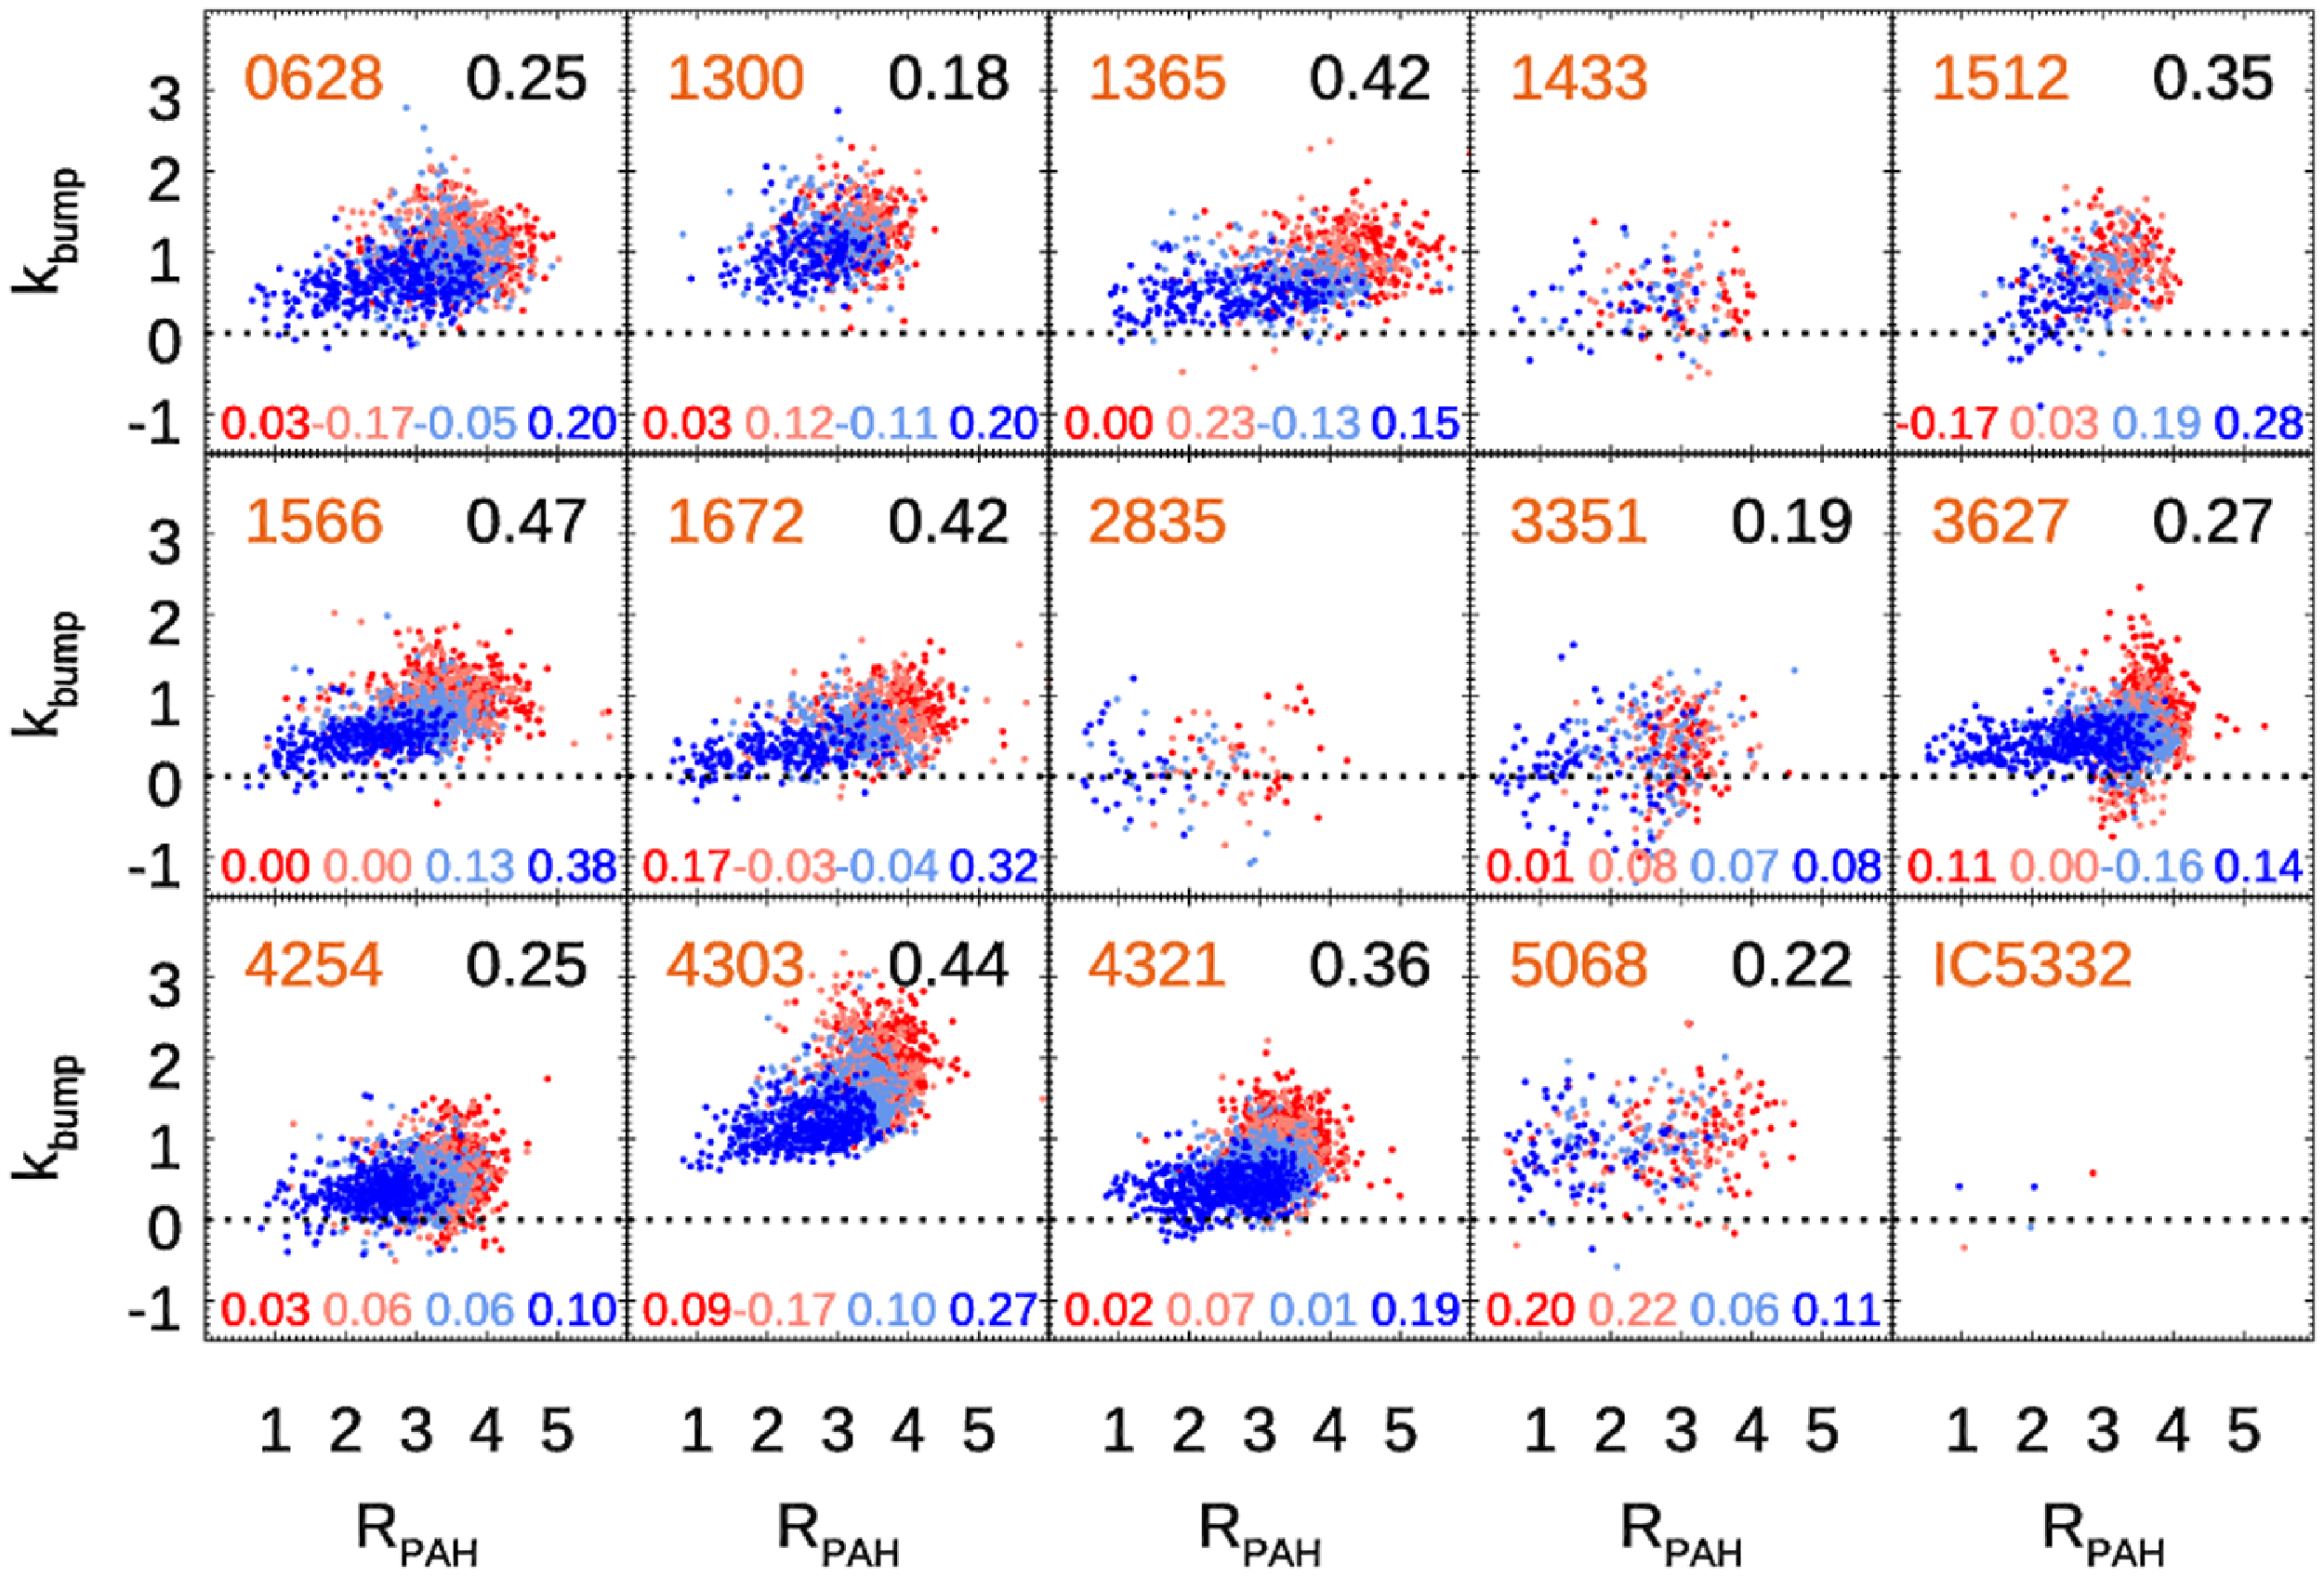
Figure 11. Similar to Fig. 6, Left, but subdividing the regions of each galaxy into quartiles of
 $\Sigma_{SFR}$
. The values of
$\Sigma_{SFR}$
. The values of
 $\Sigma_{SFR}$
increase as dark red, light red, light blue, and dark blue, respectively (i.e. dark blue is highest
$\Sigma_{SFR}$
increase as dark red, light red, light blue, and dark blue, respectively (i.e. dark blue is highest
 $\Sigma_{SFR}$
). The correlation strengths between
$\Sigma_{SFR}$
). The correlation strengths between
 $A_\mathrm{bump}$
and
$A_\mathrm{bump}$
and
 $R_\mathrm{PAH}$
for the quartile subsamples are indicated by the numbers at the bottom of each panel and are lower for all galaxies (
$R_\mathrm{PAH}$
for the quartile subsamples are indicated by the numbers at the bottom of each panel and are lower for all galaxies (
 $\rho \lesssim 0.3$
) relative to the value when using all regions (black value, upper-right).
$\rho \lesssim 0.3$
) relative to the value when using all regions (black value, upper-right).
If PAHs are a carrier of the 2175Å feature, one possible factor that could reduce the correlation strength between
 $A_\mathrm{bump}$
and
$A_\mathrm{bump}$
and
 $R_\mathrm{PAH}$
is that along the line of sight from a star-forming region there can be 2175Å absorption from intervening dust (PAHs) that resides between the source and the observer (e.g. in the diffuse ISM) that is spatially disconnected from the majority of observed PAH emission from the photodissociation region (PDR) that surrounds the star-forming region. This intervening dust would also not be affected by effects of PAH destruction, since it is far away from the strong ionising radiation (i.e. HII region). Depending on the amount of dust around the HII region (birth-cloud dust), the intervening diffuse dust may have a modest effect on the strength of the 2175Å feature. This effect is likely to be more pronounced as the inclination of galaxies go from face-on to edge-on; however, it will always be present due to the non-zero thickness of the disc. We show a cartoon visualisation of this scenario in Fig. 12 (top). Interestingly, we find a slight preference for higher correlation strength with lower inclination in our ‘robust’ sample (
$R_\mathrm{PAH}$
is that along the line of sight from a star-forming region there can be 2175Å absorption from intervening dust (PAHs) that resides between the source and the observer (e.g. in the diffuse ISM) that is spatially disconnected from the majority of observed PAH emission from the photodissociation region (PDR) that surrounds the star-forming region. This intervening dust would also not be affected by effects of PAH destruction, since it is far away from the strong ionising radiation (i.e. HII region). Depending on the amount of dust around the HII region (birth-cloud dust), the intervening diffuse dust may have a modest effect on the strength of the 2175Å feature. This effect is likely to be more pronounced as the inclination of galaxies go from face-on to edge-on; however, it will always be present due to the non-zero thickness of the disc. We show a cartoon visualisation of this scenario in Fig. 12 (top). Interestingly, we find a slight preference for higher correlation strength with lower inclination in our ‘robust’ sample (
 $\sigma(k_\mathrm{bump})\lesssim 0.25$
), as shown in Fig. 12 (bottom). We include NGC 4303 in our sample here because the correlation strength should be independent of the vertical offset in the
$\sigma(k_\mathrm{bump})\lesssim 0.25$
), as shown in Fig. 12 (bottom). We include NGC 4303 in our sample here because the correlation strength should be independent of the vertical offset in the
 $k_\mathrm{bump}$
vs
$k_\mathrm{bump}$
vs
 $R_\mathrm{PAH}$
relation that we see in this galaxy with respect to the other ‘robust’ cases. For example, NGC 1566 and 4303, the least inclined (
$R_\mathrm{PAH}$
relation that we see in this galaxy with respect to the other ‘robust’ cases. For example, NGC 1566 and 4303, the least inclined (
 $i\sim 30 ^{\circ}$
) among these sources, show slightly stronger correlation strengths relative to the more inclined galaxies. Performing this comparison in a larger sample, and also across a wider range in inclination, is needed to draw firm conclusions on whether this effect is real.
$i\sim 30 ^{\circ}$
) among these sources, show slightly stronger correlation strengths relative to the more inclined galaxies. Performing this comparison in a larger sample, and also across a wider range in inclination, is needed to draw firm conclusions on whether this effect is real.
Figure 12.
Top: Cartoon visualisation of how changes in the inclination angle of a disc galaxy could affect the correlation strength between
 $k_\mathrm{bump}$
and
$k_\mathrm{bump}$
and
 $R_\mathrm{PAH}$
.
$R_\mathrm{PAH}$
.
 $k_\mathrm{bump}$
is measured via the effect of dust attenuation towards UV-bright young stars that are affected by both birth-cloud dust and the diffuse dust in the ISM. As the inclination increases from face-on (
$k_\mathrm{bump}$
is measured via the effect of dust attenuation towards UV-bright young stars that are affected by both birth-cloud dust and the diffuse dust in the ISM. As the inclination increases from face-on (
 $0^{\circ}$
) to edge-on (
$0^{\circ}$
) to edge-on (
 $90^{\circ}$
), there will be increasing path length of the diffuse ISM between the young stars and the observer. PAHs can be present in both dust mediums, but the majority of PAH emission will come from PDRs surrounding HII regions and will be independent of viewing angle (optically thin). Thus, the association between the 2175Å absorption feature and PAH emission may be weaker as the viewing angle increases since viewing angle only affects the former. Bottom: correlation strength,
$90^{\circ}$
), there will be increasing path length of the diffuse ISM between the young stars and the observer. PAHs can be present in both dust mediums, but the majority of PAH emission will come from PDRs surrounding HII regions and will be independent of viewing angle (optically thin). Thus, the association between the 2175Å absorption feature and PAH emission may be weaker as the viewing angle increases since viewing angle only affects the former. Bottom: correlation strength,
 $\rho_\mathrm{S}$
between
$\rho_\mathrm{S}$
between
 $k_\mathrm{bump}$
and
$k_\mathrm{bump}$
and
 $R_\mathrm{PAH}$
as a function of the galaxy inclination. Orange circles denote our ‘robust’ sample of galaxies with median value of
$R_\mathrm{PAH}$
as a function of the galaxy inclination. Orange circles denote our ‘robust’ sample of galaxies with median value of
 $\sigma(k_\mathrm{bump})\lesssim 0.25$
: NGC 1365, 1566, 1672, 3627, 4303, and 4321. There is a slight preference for stronger correlation strengths between
$\sigma(k_\mathrm{bump})\lesssim 0.25$
: NGC 1365, 1566, 1672, 3627, 4303, and 4321. There is a slight preference for stronger correlation strengths between
 $k_\mathrm{bump}$
and
$k_\mathrm{bump}$
and
 $R_\mathrm{PAH}$
for galaxies at lower inclination (i.e. closer to face-on). The trends are less apparent among the rest of the sample (open circles), but this may be attributed to the large uncertainty in
$R_\mathrm{PAH}$
for galaxies at lower inclination (i.e. closer to face-on). The trends are less apparent among the rest of the sample (open circles), but this may be attributed to the large uncertainty in
 $k_\mathrm{bump}$
measurements for these galaxies.
$k_\mathrm{bump}$
measurements for these galaxies.
Assuming a link between PAHs and the UV bump, dust heating could be another factor to help explain a weak correlation between
 $A_\mathrm{bump}$
and
$A_\mathrm{bump}$
and
 $R_\mathrm{PAH}$
(i.e. if the dust continuum used as the baseline in
$R_\mathrm{PAH}$
(i.e. if the dust continuum used as the baseline in
 $R_\mathrm{PAH}$
is varying). Calzetti et al. (Reference Calzetti2007) presented calibrations of Spitzer 8 and 24
$R_\mathrm{PAH}$
is varying). Calzetti et al. (Reference Calzetti2007) presented calibrations of Spitzer 8 and 24
 $\mu$
m luminosity density (
$\mu$
m luminosity density (
 $S_{8\mu \mathrm{m,dust}}$
and
$S_{8\mu \mathrm{m,dust}}$
and
 $S_{24\mu \mathrm{m,dust}}$
) as
$S_{24\mu \mathrm{m,dust}}$
) as
 $\Sigma_{SFR}$
diagnostics (see their eq. 2 and 3; when assuming
$\Sigma_{SFR}$
diagnostics (see their eq. 2 and 3; when assuming
 $\Sigma$
(Pa
$\Sigma$
(Pa
 $\alpha_\mathrm{corr}$
) is a direct proxy of
$\alpha_\mathrm{corr}$
) is a direct proxy of
 $\Sigma_{SFR}$
). The slope of their relationship log(
$\Sigma_{SFR}$
). The slope of their relationship log(
 $S_{8\mu \mathrm{m,dust}}$
) with log(
$S_{8\mu \mathrm{m,dust}}$
) with log(
 $\Sigma_{SFR}$
) is sub-linear (
$\Sigma_{SFR}$
) is sub-linear (
 $0.94\pm0.02$
), whereas the slope for log(
$0.94\pm0.02$
), whereas the slope for log(
 $S_{24\mu \mathrm{m,dust}}$
) is super-linear (
$S_{24\mu \mathrm{m,dust}}$
) is super-linear (
 $1.23\pm 0.03$
). More recently, Calzetti et al. (Reference Calzetti2024) found a shallower super-linear relation (
$1.23\pm 0.03$
). More recently, Calzetti et al. (Reference Calzetti2024) found a shallower super-linear relation (
 $1.07 \pm 0.01$
) between log(
$1.07 \pm 0.01$
) between log(
 $S_{24\mu \mathrm{m,dust}}$
) (based on F2100W) and log(
$S_{24\mu \mathrm{m,dust}}$
) (based on F2100W) and log(
 $\Sigma_{SFR}$
). The sub-linear 8
$\Sigma_{SFR}$
). The sub-linear 8
 $\mu$
m relation could be an indication of PAH destruction at higher
$\mu$
m relation could be an indication of PAH destruction at higher
 $\Sigma_{SFR}$
values, whereas the super-linear 24
$\Sigma_{SFR}$
values, whereas the super-linear 24
 $\mu$
m could indicate increased dust-heating at higher
$\mu$
m could indicate increased dust-heating at higher
 $\Sigma_{SFR}$
values (i.e. a larger fraction of the total IR luminosity will be measured at 24
$\Sigma_{SFR}$
values (i.e. a larger fraction of the total IR luminosity will be measured at 24
 $\mu$
m as dust temperature increases). Therefore, both of these factors could affect the ratio of these quantities. We note that the slopes of these relationships are sensitive to the methodology used for local background subtraction and on the size scales being considered (see discussion in Calzetti et al. Reference Calzetti2024), and may also be time-dependent with the emergent state of embedded stellar clusters (e.g. Gregg et al. Reference Gregg2024). Assuming that the 7.7
$\mu$
m as dust temperature increases). Therefore, both of these factors could affect the ratio of these quantities. We note that the slopes of these relationships are sensitive to the methodology used for local background subtraction and on the size scales being considered (see discussion in Calzetti et al. Reference Calzetti2024), and may also be time-dependent with the emergent state of embedded stellar clusters (e.g. Gregg et al. Reference Gregg2024). Assuming that the 7.7
 $\mu$
m feature-alone relative to a dust continuum proxy (e.g. F2100W or 24
$\mu$
m feature-alone relative to a dust continuum proxy (e.g. F2100W or 24
 $\mu$
m) is a good proxy for
$\mu$
m) is a good proxy for
 $R_\mathrm{PAH}$
, which seems to be reasonable (see Appendix B in Sutter et al. Reference Sutter2024), then this would be reflected in similar trends in
$R_\mathrm{PAH}$
, which seems to be reasonable (see Appendix B in Sutter et al. Reference Sutter2024), then this would be reflected in similar trends in
 $R_\mathrm{PAH}$
(ratio of flux densities) vs
$R_\mathrm{PAH}$
(ratio of flux densities) vs
 $\Sigma_{SFR}$
.
$\Sigma_{SFR}$
.
Taking the difference (in log) of the Calzetti et al. (Reference Calzetti2007); Calzetti et al. (Reference Calzetti2024) relations gives
 $\log(S_{8\mu \mathrm{m,dust}}/S_{24\mu \mathrm{m,dust}}) \propto -0.13 \log(\Sigma_\mathrm{SFR}$
). As we show in Fig. 13, this is similar to the best-fit linear slope that we find in this work if we examine the ratio of F770W and F2100W luminosity densities as a function of
$\log(S_{8\mu \mathrm{m,dust}}/S_{24\mu \mathrm{m,dust}}) \propto -0.13 \log(\Sigma_\mathrm{SFR}$
). As we show in Fig. 13, this is similar to the best-fit linear slope that we find in this work if we examine the ratio of F770W and F2100W luminosity densities as a function of
 $\Sigma_{SFR}$
,
$\Sigma_{SFR}$
,
 \begin{equation}\begin{aligned}\log \left( \frac{S_\mathrm{F770W,dust}}{S_\mathrm{F2100W,dust}} \right) = (\!-0.16 \pm 0.01)\log(\Sigma_\mathrm{SFR}) + (0.25 \pm 0.01) \,,\end{aligned}\end{equation}
which has an intrinsic scatter of 0.09 dex. We note that there is some indication that the trend deviates from a linear form at higher
 $\Sigma_{SFR}$
, with the trend becoming slightly steeper (more negative) at
$\Sigma_{SFR}$
, with the trend becoming slightly steeper (more negative) at
 $\log(\Sigma_\mathrm{SFR})\gtrsim-1.5$
. This could correspond to a boundary where a change in dust destruction and/or dust heating is occurring. Resolving the degeneracy that these mechanisms have on the
$\log(\Sigma_\mathrm{SFR})\gtrsim-1.5$
. This could correspond to a boundary where a change in dust destruction and/or dust heating is occurring. Resolving the degeneracy that these mechanisms have on the
 $R_\mathrm{PAH}$
value will require mid-IR spectroscopy around the PAH features to properly measure the underlying dust continuum.
$R_\mathrm{PAH}$
value will require mid-IR spectroscopy around the PAH features to properly measure the underlying dust continuum.
Figure 13. 2D histogram of the F770W/F2100W surface luminosity ratio as a function of
 $\Sigma_{SFR}$
for the six ‘robust’ galaxies (NGC 1365, 1566, 1672, 3627, 4303, and 4321). The best-fit linear slope (orange dashed line) is consistent with the slope using the Calzetti et al. (Reference Calzetti2007) 8
$\Sigma_{SFR}$
for the six ‘robust’ galaxies (NGC 1365, 1566, 1672, 3627, 4303, and 4321). The best-fit linear slope (orange dashed line) is consistent with the slope using the Calzetti et al. (Reference Calzetti2007) 8
 $\mu$
m and Calzetti et al. (Reference Calzetti2024) 24
$\mu$
m and Calzetti et al. (Reference Calzetti2024) 24
 $\mu$
m relations (red dashed line), where the former is sub-linear with
$\mu$
m relations (red dashed line), where the former is sub-linear with
 $\Sigma_{SFR}$
and the latter is super-linear. These results imply that both dust destruction and dust heating could be factors in explaining the trend of
$\Sigma_{SFR}$
and the latter is super-linear. These results imply that both dust destruction and dust heating could be factors in explaining the trend of
 $R_\mathrm{PAH}$
with
$R_\mathrm{PAH}$
with
 $\Sigma_{SFR}$
.
$\Sigma_{SFR}$
.
Below we highlight a few factors that complicate our ability to provide a more definitive link between the 2175Å feature and PAHs. The first is that the spatial scales that we are measuring both quantities at (
 $\sim$
100 pc) are coarse relative to the scales of HII regions (
$\sim$
100 pc) are coarse relative to the scales of HII regions (
 $\sim$
few pc) where photo-dissociation effects can be studied more precisely (e.g. Berné et al. Reference Berné2022; Pedrini et al. 2024). This situation could be improved through higher spatial resolution UV surveys of nearby galaxies with HST to more closely match the JWST/MIRI resolution. Second, linking dust attenuation to emission is complicated because of the degeneracies that optical depth and geometric effects can have on the observed strength of the feature when dealing with unresolved star/dust distributions (e.g. Fig. 12). This problem is exacerbated by the fact that there are limited UV data available for nearby galaxies, and in most cases the filters available are very broad, to study the feature in detail. An alternative could be to study UV extinction curves using spectroscopy towards a larger number of MW, LMC, and SMC sightlines where PAH emission measurements are also available (e.g. Massa et al. Reference Massa, Gordon and Fitzpatrick2022; Gordon et al. Reference Gordon2024). Currently, HST is the only facility capable of characterising UV extinction curves near the 2175Å region and only
$\sim$
few pc) where photo-dissociation effects can be studied more precisely (e.g. Berné et al. Reference Berné2022; Pedrini et al. 2024). This situation could be improved through higher spatial resolution UV surveys of nearby galaxies with HST to more closely match the JWST/MIRI resolution. Second, linking dust attenuation to emission is complicated because of the degeneracies that optical depth and geometric effects can have on the observed strength of the feature when dealing with unresolved star/dust distributions (e.g. Fig. 12). This problem is exacerbated by the fact that there are limited UV data available for nearby galaxies, and in most cases the filters available are very broad, to study the feature in detail. An alternative could be to study UV extinction curves using spectroscopy towards a larger number of MW, LMC, and SMC sightlines where PAH emission measurements are also available (e.g. Massa et al. Reference Massa, Gordon and Fitzpatrick2022; Gordon et al. Reference Gordon2024). Currently, HST is the only facility capable of characterising UV extinction curves near the 2175Å region and only
 $\sim$
100 sightlines in the MW, LMC, and SMC have been characterised in this wavelength regime in the past 30 yr. Finally, studies to date have relied on trying to link measurements of the 2175Å feature in extinction/attenuation to PAHs observed in emission. A much more conclusive link between PAHs as the carrier would come from measuring both features in extinction along the same sightline. We highlight avenues that future facilities may provide in addressing these shortcomings in Section 5.3.
$\sim$
100 sightlines in the MW, LMC, and SMC have been characterised in this wavelength regime in the past 30 yr. Finally, studies to date have relied on trying to link measurements of the 2175Å feature in extinction/attenuation to PAHs observed in emission. A much more conclusive link between PAHs as the carrier would come from measuring both features in extinction along the same sightline. We highlight avenues that future facilities may provide in addressing these shortcomings in Section 5.3.
5.2 Literature comparison
To our knowledge, there have been relatively few attempts to link the 2175Å feature (measured in attenuation) to PAH emission. Decleir et al. (Reference Decleir2019) performed a similar comparison to NGC 0628 as this work, using Swift/UVOT and Spitzer+Herschel data. In that work, they adopted an SED-fitting approach to constrain the intrinsic bump strength and the PAH abundance was inferred from a ratio of IRAC 8
 $\mu$
m to total far-infrared luminosity. No significant correlation was found; however, this could be attributed to the large measurement uncertainties in both quantities. Indeed, we find stronger correlations are present for galaxies with better constraints on
$\mu$
m to total far-infrared luminosity. No significant correlation was found; however, this could be attributed to the large measurement uncertainties in both quantities. Indeed, we find stronger correlations are present for galaxies with better constraints on
 $k_\mathrm{bump}$
, and that NGC 0628 is not among the best-constrained in our sample, with a median value of
$k_\mathrm{bump}$
, and that NGC 0628 is not among the best-constrained in our sample, with a median value of
 $\sigma(k_\mathrm{bump})\sim 0.5$
(for regions satisfying conditions (1)–(3) in Section 3.9). Shivaei et al. (Reference Shivaei2022) examined the relation between the 2175Å feature and PAH emission, constrained using MUSE spectra and Spitzer/MIPS photometry, respectively, in a sample of 86 SFGs at
$\sigma(k_\mathrm{bump})\sim 0.5$
(for regions satisfying conditions (1)–(3) in Section 3.9). Shivaei et al. (Reference Shivaei2022) examined the relation between the 2175Å feature and PAH emission, constrained using MUSE spectra and Spitzer/MIPS photometry, respectively, in a sample of 86 SFGs at
 $z\sim2$
. Their comparison slightly differs in that it compared
$z\sim2$
. Their comparison slightly differs in that it compared
 $A_\mathrm{bump}$
(i.e. apparent bump strength in magnitude) relative to a PAH abundance (rest-frame 8
$A_\mathrm{bump}$
(i.e. apparent bump strength in magnitude) relative to a PAH abundance (rest-frame 8
 $\mu$
m relative to FIR). They find that galaxies with stronger bumps are positively correlated with higher PAH abundances, which is qualitatively consistent with our findings, although we find a weaker correlation between
$\mu$
m relative to FIR). They find that galaxies with stronger bumps are positively correlated with higher PAH abundances, which is qualitatively consistent with our findings, although we find a weaker correlation between
 $A_\mathrm{bump}$
and
$A_\mathrm{bump}$
and
 $R_\mathrm{PAH}$
relative to
$R_\mathrm{PAH}$
relative to
 $k_\mathrm{bump}$
and
$k_\mathrm{bump}$
and
 $R_\mathrm{PAH}$
.
$R_\mathrm{PAH}$
.
Several studies have explored the relationship between the 2175Å feature strength with the SFR and sSFR of galaxies, and which qualitatively follow the trends observed in our study. Kriek & Conroy (Reference Kriek and Conroy2013) used composite SEDs from a sample of
 $\sim$
3 500 galaxies at
$\sim$
3 500 galaxies at
 $0.5 \lt z \lt 2.0$
to characterise the shape of dust attenuation curves and the 2175Å feature. They found that the bump strength decreases with increasing equivalent width of
$0.5 \lt z \lt 2.0$
to characterise the shape of dust attenuation curves and the 2175Å feature. They found that the bump strength decreases with increasing equivalent width of
 $\mathrm{H}\alpha$
, which is a proxy for sSFR (e.g. Mármol-Queraltó et al. Reference Mármol-Queraltó2016), with larger EW(
$\mathrm{H}\alpha$
, which is a proxy for sSFR (e.g. Mármol-Queraltó et al. Reference Mármol-Queraltó2016), with larger EW(
 $\mathrm{H}\alpha$
) corresponding to higher sSFR. Kashino et al. (Reference Kashino2021) used individual and stacked spectra from a sample of 505 SFGs at
$\mathrm{H}\alpha$
) corresponding to higher sSFR. Kashino et al. (Reference Kashino2021) used individual and stacked spectra from a sample of 505 SFGs at
 $1.3\leq z\leq 1.8$
(median
$1.3\leq z\leq 1.8$
(median
 $z=1.56$
;
$z=1.56$
;
 $-9.3\lesssim \log\mathrm{sSFR}\lesssim -8.3$
) in the zCOSMOS-deep survey, finding that the 2175Å feature amplitude decreases with increasing sSFR, while it increases moderately with stellar mass. We show their relationship in Fig. 9, which is shifted towards higher sSFR, as well as an offset version that accounts for the difference in the galaxy main-sequence (MS; logSFR vs. log
$-9.3\lesssim \log\mathrm{sSFR}\lesssim -8.3$
) in the zCOSMOS-deep survey, finding that the 2175Å feature amplitude decreases with increasing sSFR, while it increases moderately with stellar mass. We show their relationship in Fig. 9, which is shifted towards higher sSFR, as well as an offset version that accounts for the difference in the galaxy main-sequence (MS; logSFR vs. log
 $M_\star$
) values with redshift (e.g. Popesso et al. Reference Popesso2023). We take this offset as the difference in the MS sSFR between
$M_\star$
) values with redshift (e.g. Popesso et al. Reference Popesso2023). We take this offset as the difference in the MS sSFR between
 $z=0$
and
$z=0$
and
 $z=1.56$
for a galaxy with
$z=1.56$
for a galaxy with
 $\log(M_\star/M_\odot)=10.82$
(median of the five PHANGS galaxies we combine) using the galaxy MS relationship from Leroy et al. (Reference Leroy2019) for
$\log(M_\star/M_\odot)=10.82$
(median of the five PHANGS galaxies we combine) using the galaxy MS relationship from Leroy et al. (Reference Leroy2019) for
 $z=0$
and Leslie et al. (Reference Leslie2020) for
$z=0$
and Leslie et al. (Reference Leslie2020) for
 $z=1.56$
(latter using the ‘SF’ sample). These give an offset of
$z=1.56$
(latter using the ‘SF’ sample). These give an offset of
 $\log(\mathrm{sSFR}_{z=1.56})-\log(\mathrm{sSFR}_{z=0})=1.49$
. Interestingly, we find that shifting the Kashino et al. (Reference Kashino2021) relation (i.e. subtracting the x-axis values by 1.49) is qualitatively consistent with our local relation. We note that the y-axis agreement is almost certainly coincidental between these studies because the Swift-derived bump strength is likely underestimated and Kashino et al. (Reference Kashino2021) normalise the UV bump using the reddening on the stellar continuum (
$\log(\mathrm{sSFR}_{z=1.56})-\log(\mathrm{sSFR}_{z=0})=1.49$
. Interestingly, we find that shifting the Kashino et al. (Reference Kashino2021) relation (i.e. subtracting the x-axis values by 1.49) is qualitatively consistent with our local relation. We note that the y-axis agreement is almost certainly coincidental between these studies because the Swift-derived bump strength is likely underestimated and Kashino et al. (Reference Kashino2021) normalise the UV bump using the reddening on the stellar continuum (
 $E(B-V)_{\mathrm{star}}$
; which are typically lower than
$E(B-V)_{\mathrm{star}}$
; which are typically lower than
 $E(B-V)_{\mathrm{gas}}$
, see Appendix B) Finally, Zhou et al. (Reference Zhou2023) used 134 galaxies in MaNGA (Bundy et al. Reference Bundy2015) that also have Swift data (Molina et al. Reference Molina2020) to study the 2175Å feature, finding that the 2175Å feature amplitude decreases with increasing sSFR. In that work, they estimate
$E(B-V)_{\mathrm{gas}}$
, see Appendix B) Finally, Zhou et al. (Reference Zhou2023) used 134 galaxies in MaNGA (Bundy et al. Reference Bundy2015) that also have Swift data (Molina et al. Reference Molina2020) to study the 2175Å feature, finding that the 2175Å feature amplitude decreases with increasing sSFR. In that work, they estimate
 $A_\mathrm{bump}$
in a similar way as this work by taking the difference in attenuation at 2175Å from UVM2 relative to a UV slope fit (i.e.
$A_\mathrm{bump}$
in a similar way as this work by taking the difference in attenuation at 2175Å from UVM2 relative to a UV slope fit (i.e.
 $f_{\lambda}(\mathrm{UVM2},0))$
, see Fig. 4). However, they normalise their bump strength based on the difference relative to an intrinsic SED estimated with an UV to near-IR SED-fitting approach. Therefore, a direct comparison with their findings is not straightforward.
$f_{\lambda}(\mathrm{UVM2},0))$
, see Fig. 4). However, they normalise their bump strength based on the difference relative to an intrinsic SED estimated with an UV to near-IR SED-fitting approach. Therefore, a direct comparison with their findings is not straightforward.
The relationship between the PAH abundances with the SFR and sSFR of galaxies has been explored by two papers in the PHANGS-JWST team. Egorov et al. (Reference Egorov2023) used 4 PHANGS-JWST galaxies to examine the relationship between
 $R_\mathrm{PAH}$
and various physical properties, finding lower
$R_\mathrm{PAH}$
and various physical properties, finding lower
 $R_\mathrm{PAH}$
values with larger [SIII]/[SII] and EW(
$R_\mathrm{PAH}$
values with larger [SIII]/[SII] and EW(
 $\mathrm{H}\alpha$
), which are proxies for the ionisation parameter and sSFR, respectively (correlation:
$\mathrm{H}\alpha$
), which are proxies for the ionisation parameter and sSFR, respectively (correlation:
 $-0.7 \lesssim \rho \lesssim -0.4$
). A larger analysis extending to the full 19 PHANGS-JWST galaxies was recently presented in Sutter et al. (Reference Sutter2024). In that work, they find that the difference between the average
$-0.7 \lesssim \rho \lesssim -0.4$
). A larger analysis extending to the full 19 PHANGS-JWST galaxies was recently presented in Sutter et al. (Reference Sutter2024). In that work, they find that the difference between the average
 $R_\mathrm{PAH}$
measured in nebular regions and the diffuse gas is correlated with the sSFR. The selection criteria used in this study most closely align with the ‘nebular regions’ in Sutter et al. (Reference Sutter2024), and they also find a decrease in
$R_\mathrm{PAH}$
measured in nebular regions and the diffuse gas is correlated with the sSFR. The selection criteria used in this study most closely align with the ‘nebular regions’ in Sutter et al. (Reference Sutter2024), and they also find a decrease in
 $R_\mathrm{PAH}$
values with increasing sSFR (see their Figure 11) that is qualitatively consistent with our findings.
$R_\mathrm{PAH}$
values with increasing sSFR (see their Figure 11) that is qualitatively consistent with our findings.
5.3 Future prospects for mapping the UV extinction curves in the local group
Dedicated satellite missions in the UV wavelength range could greatly advance our understanding of UV extinction curves and the 2175Å feature. As highlighted previously, studying the feature in extinction provides more direct insight into potential carriers than measuring it in attenuation. Ideally, such missions would provide moderate resolution spectroscopy, instead of photometry, in order to study the detailed shape of the bump (amplitude, central wavelength, and width), which can provide better constraints on the size distribution and chemical composition of interstellar dust grains responsible for the feature. Below, we briefly highlight a few approved or planned future UV spectroscopic missions.
First, the Ultraviolet Explorer (UVEX) is a recently approved NASA Medium-Class Explorer mission (launch
 $\sim$
2030 Kulkarni et al. Reference Kulkarni2021), that will have FUV (1 390–1 900 Å) and NUV (2 030–2 700 Å) imaging (PSF
$\sim$
2030 Kulkarni et al. Reference Kulkarni2021), that will have FUV (1 390–1 900 Å) and NUV (2 030–2 700 Å) imaging (PSF
 $\sim$
2
$\sim$
2
 $^{\prime\prime}$
) and long-slit spectroscopic capability (1 150–2 650 Å;
$^{\prime\prime}$
) and long-slit spectroscopic capability (1 150–2 650 Å;
 $R\gtrsim 1\,000$
). UVEX will perform an all-sky imaging survey, but this will have limited utility for studying the 2175Å feature because it is very difficult to characterise it using only two broad filters (similar issues for GALEX). In contrast, its spectroscopic instrument is ideal for studying the feature and the currently envisioned survey design would study
$R\gtrsim 1\,000$
). UVEX will perform an all-sky imaging survey, but this will have limited utility for studying the 2175Å feature because it is very difficult to characterise it using only two broad filters (similar issues for GALEX). In contrast, its spectroscopic instrument is ideal for studying the feature and the currently envisioned survey design would study
 $\sim$
1 000 O-stars in the LMC and SMC (Kulkarni et al. Reference Kulkarni2021); increasing the number of studied sightlines in these galaxies by over an order of magnitude.
$\sim$
1 000 O-stars in the LMC and SMC (Kulkarni et al. Reference Kulkarni2021); increasing the number of studied sightlines in these galaxies by over an order of magnitude.
Second, a small satellite (SmallSat) UV spectroscopic mission concept known as UVESS (Ultra Violet Extinction Sky Survey; Mathew et al. Reference Mathew2024) is being developed by the Australian National University and a collaboration of international partners. UVESS would map the variability in extinction curves and 2175Å feature by acquiring near-UV (1 400–2 700 Å) spectroscopy (
 $R\sim 2\,500$
) for thousands of OB-stars in the MW, LMC, and SMC. UVESS will explore the adoption of a compact spatial heterodyne spectrograph (SHS; Sahoo et al. Reference Sahoo, Mathew, Battisti and Tucker2024), which employs a modified Michelson interferometer configuration, and offers exceptional performance and cost-effectiveness for UV spectroscopy relative to traditional instruments.
$R\sim 2\,500$
) for thousands of OB-stars in the MW, LMC, and SMC. UVESS will explore the adoption of a compact spatial heterodyne spectrograph (SHS; Sahoo et al. Reference Sahoo, Mathew, Battisti and Tucker2024), which employs a modified Michelson interferometer configuration, and offers exceptional performance and cost-effectiveness for UV spectroscopy relative to traditional instruments.
Readers that are interested in helping develop the science case for UVESS are encouraged to contact the first author.
Finally, the Habitable Worlds Observatory,Footnote l a proposed NASA flagship mission (launch
 $\sim$
2040), is envisioned to have UV spectroscopic capabilities. It will likely have the potential for characterising UV extinction curves towards single stars in galaxies out to
$\sim$
2040), is envisioned to have UV spectroscopic capabilities. It will likely have the potential for characterising UV extinction curves towards single stars in galaxies out to
 $\sim$
10–20 Mpc (dependent on the mirror size). This will be revolutionary in characterising the variation of extinction curves and the 2175Å feature over a wider range of ISM conditions. The incredible sensitivity of such a large facility may also make it feasible to measure both the 2175Å feature and PAHs in extinction (latter measured from IR facility), thereby alleviating complications that arise when indirectly linking absorption and emission.
$\sim$
10–20 Mpc (dependent on the mirror size). This will be revolutionary in characterising the variation of extinction curves and the 2175Å feature over a wider range of ISM conditions. The incredible sensitivity of such a large facility may also make it feasible to measure both the 2175Å feature and PAHs in extinction (latter measured from IR facility), thereby alleviating complications that arise when indirectly linking absorption and emission.
6. Conclusion
Using a sample of 15 local galaxies in the PHANGS-JWST survey that have NUV and mid-IR data from Swift/UVOT and JWST/MIRI, respectively, we examined the correlation between the 2175Å feature and PAH abundances in a spatially-resolved manner. This comparison is made to explore the link of PAHs as a potential carrier of the 2175Å feature. We find a moderate positive correlation between the 2175Å feature strength and PAH abundance (Spearman’s coefficient,
 $0.3 \lesssim \rho \lesssim 0.5$
), albeit with large intrinsic scatter (Fig. 6, Table 3). If the two are linked, this scatter may arise from limitations in the use of broad- and medium-filters to constrain the amplitude of the feature and also in the fact that the feature is measured in attenuation, whereas the PAHs are measured via emission, such that they may not directly probe the same physical regions (i.e. due to optical depth and geometric effects; e.g. Fig. 12).
$0.3 \lesssim \rho \lesssim 0.5$
), albeit with large intrinsic scatter (Fig. 6, Table 3). If the two are linked, this scatter may arise from limitations in the use of broad- and medium-filters to constrain the amplitude of the feature and also in the fact that the feature is measured in attenuation, whereas the PAHs are measured via emission, such that they may not directly probe the same physical regions (i.e. due to optical depth and geometric effects; e.g. Fig. 12).
We also compare the strength of the 2175Å feature and PAH abundances with various galaxy properties and the strongest trends are negative correlations with
 $\Sigma_{SFR}$
and sSFR (proxies of ionising radiation intensity;
$\Sigma_{SFR}$
and sSFR (proxies of ionising radiation intensity;
 $\rho\sim-0.6$
; Figs. 7–10, Table 3), which can account for trends between
$\rho\sim-0.6$
; Figs. 7–10, Table 3), which can account for trends between
 $k_\mathrm{bump}$
and
$k_\mathrm{bump}$
and
 $R_\mathrm{PAH}$
based on partial correlation analysis (Section 4.1). This indicates that the 2175Å feature is weaker and PAH abundances are lower in strongly star-forming regions, and this is consistent with many previous findings (Section 5.2). This implies that both the 2175Å grain carrier and PAHs are linked to small dust grains that can be destroyed by UV photons, but that they are not necessarily linked to each other (i.e. PAHs may not be the 2175Å grain carrier). Performing similar analyses on a larger sample of galaxies that span a wider range in star-formation activity could provide new insight on these links. We provide prescriptions for
$R_\mathrm{PAH}$
based on partial correlation analysis (Section 4.1). This indicates that the 2175Å feature is weaker and PAH abundances are lower in strongly star-forming regions, and this is consistent with many previous findings (Section 5.2). This implies that both the 2175Å grain carrier and PAHs are linked to small dust grains that can be destroyed by UV photons, but that they are not necessarily linked to each other (i.e. PAHs may not be the 2175Å grain carrier). Performing similar analyses on a larger sample of galaxies that span a wider range in star-formation activity could provide new insight on these links. We provide prescriptions for
 $k_\mathrm{bump}$
and
$k_\mathrm{bump}$
and
 $R_\mathrm{PAH}$
in local massive (metal-rich) galaxies with
$R_\mathrm{PAH}$
in local massive (metal-rich) galaxies with
 $\Sigma_{SFR}$
and sSFR; however, the
$\Sigma_{SFR}$
and sSFR; however, the
 $k_\mathrm{bump}$
relations should be used with caution due to the fact that the bump strengths measured from Swift/UVOT are expected to be underestimated. No significant trends in
$k_\mathrm{bump}$
relations should be used with caution due to the fact that the bump strengths measured from Swift/UVOT are expected to be underestimated. No significant trends in
 $k_\mathrm{bump}$
and
$k_\mathrm{bump}$
and
 $R_\mathrm{PAH}$
with gas-phase metallicity or galactocentric radii are found; however, the metallicity range of our sample is limited (
$R_\mathrm{PAH}$
with gas-phase metallicity or galactocentric radii are found; however, the metallicity range of our sample is limited (
 $8.40 \lt 12+\log[\mathrm{O/H}] \lt 8.65$
), and a larger sample that extends to dwarf galaxies is needed to explore such trends robustly.
$8.40 \lt 12+\log[\mathrm{O/H}] \lt 8.65$
), and a larger sample that extends to dwarf galaxies is needed to explore such trends robustly.
Finally, this work highlights the limitations in characterising the 2175Å feature and PAH abundances from photometric data. Future UV spectroscopic missions are needed to establish definitive links between the 2175Å feature and its primary grain carrier. An important caveat to measuring PAH abundances from photometry is that the effects of dust heating can also cause a decrease in values of
 $R_\mathrm{PAH}$
in a manner that is similar to PAH destruction. Breaking this degeneracy will require mid-IR spectroscopy (e.g. with MIRI) to determine dust continuum baselines more accurately.
$R_\mathrm{PAH}$
in a manner that is similar to PAH destruction. Breaking this degeneracy will require mid-IR spectroscopy (e.g. with MIRI) to determine dust continuum baselines more accurately.
Acknowledgement
The authors thank the anonymous referee, whose suggestions helped to clarify and improve the content of this work. AJB thanks Miguel Querejeta for sharing the reduced Spitzer/IRAC mosaics for NGC2835 (pid 14033, PI J.C. Muñoz-Mateos) and for helpful feedback on the methodology for deriving stellar mass from Spitzer data. AJB thanks Jérémy Chastenet for providing the JWST saturation mask for NGC1365. IS acknowledges support by the Programa de Atraccíon de Talento of local Government of Madrid grant No. No.2022-T1/TIC-20472. MD acknowledges support through the ESA fellowship programme. We acknowledge the invaluable labour of the maintenance and clerical staff at our institutions, whose contributions make our scientific discoveries a reality. This research was conducted on Ngunnawal Indigenous land. We acknowledge the use of public data from the Swift data archive. This research has made use of data and/or software provided by the High Energy Astrophysics Science Archive Research Center (HEASARC), which is a service of the Astrophysics Science Division at NASA/GSFC and the High Energy Astrophysics Division of the Smithsonian Astrophysical Observatory. Based on observations collected at the European Southern Observatory under ESO programmes 1100.B-0651, 095.C-0473, and 094.C-0623 (PHANGS-MUSE; PI: Schinnerer), as well as 094.B-0321 (MAGNUM; PI: Marconi), 099.B-0242, 0100.B-0116, 098.B-0551 (MAD; PI: Carollo) and 097.B-0640 (TIMER; PI: Gadotti). This work is based on observations made with the NASA/ ESA/CSA James Webb Space Telescope programme 2107. The data were obtained from the Mikulski Archive for Space Telescopes at the Space Telescope Science Institute, which is operated by the Association of Universities for Research in Astronomy, Inc., under NASA contract NAS 5-03127 for JWST. This work uses data from SDSS. Funding for SDSS-III has been provided by the Alfred P. Sloan Foundation, the Participating Institutions, the National Science Foundation, and the U.S. Department of Energy Office of Science. The SDSS-III web site is http://www.sdss3.org/. SDSS-III is managed by the Astrophysical Research Consortium for the Participating Institutions of the SDSS-III Collaboration including the University of Arizona, the Brazilian Participation Group, Brookhaven National Laboratory, Carnegie Mellon University, University of Florida, the French Participation Group, the German Participation Group, Harvard University, the Instituto de Astrofisica de Canarias, the Michigan State/Notre Dame/JINA Participation Group, Johns Hopkins University, Lawrence Berkeley National Laboratory, Max Planck Institute for Astrophysics, Max Planck Institute for Extraterrestrial Physics, New Mexico State University, New York University, Ohio State University, Pennsylvania State University, University of Portsmouth, Princeton University, the Spanish Participation Group, University of Tokyo, University of Utah, Vanderbilt University, University of Virginia, University of Washington, and Yale University. This publication makes use of data products from the Two Micron All Sky Survey, which is a joint project of the University of Massachusetts and the Infrared Processing and Analysis Center/California Institute of Technology, funded by the National Aeronautics and Space Administration and the National Science Foundation.
Data availability statement
The galaxies used in this study are part of the Physics at High Angular resolution in Nearby GalaxieS (PHANGS) surveys. The PHANGS team provide public data products for the JWST and VLT/MUSE data on their website.Footnote m The raw Swift data are publicly available through the NASA High Energy Astrophysics Science Archive Research Center (HEASARC) service.Footnote n Reduced Swift/UVOT images or other data products can be made available upon reasonable request to the first author.
Funding statement
Parts of this research were supported by the Australian Research Council Centre of Excellence for All Sky Astrophysics in 3 Dimensions (ASTRO 3D), through project No. CE170100013.
Competing interests
None.
Appendix A. Reliability of UV slope and 2175Å Feature Strength from the Swift/UVOT Filters
In this study, we rely on the three Swift/UVOT filters to constrain the 2175Å feature. This is based on first measuring the UV slope from the UVW2 and UVW1 wide filters and measuring the difference of the observed UVM2 medium filter relative to this continuum. Due to the width of the filters, it is difficult to translate these measurements to the intrinsic bump strength.
We demonstrate the position of the UVOT filters relative to a Drude profile, which is commonly used to model the shape of the 2175Å dust absorption feature (Fitzpatrick & Massa Reference Fitzpatrick and Massa1986), in Fig. A1. As can be seen, all filters are affected by the feature to some extent, regardless of the feature width (FWHM value), where we illustrate the cases of the average MW value (FWHM
 $\sim$
470 Å; Fitzpatrick & Massa Reference Fitzpatrick and Massa1990) and the average value from spectroscopy of
$\sim$
470 Å; Fitzpatrick & Massa Reference Fitzpatrick and Massa1990) and the average value from spectroscopy of
 $z\sim2$
galaxies (FWHM
$z\sim2$
galaxies (FWHM
 $\sim$
274 Å; Noll et al. Reference Noll2009). This range should be fairly representative of the possible FWHM ranges we might expect to see in our resolved regions. As we will demonstrate later in this section, this has a larger impact on the reliability of UV slopes that are measured, but only results in fixed offsets in 2175Å bump amplitude estimates over a wide range of UV slopes. Fig. A1 implies that for the FWHM
$\sim$
274 Å; Noll et al. Reference Noll2009). This range should be fairly representative of the possible FWHM ranges we might expect to see in our resolved regions. As we will demonstrate later in this section, this has a larger impact on the reliability of UV slopes that are measured, but only results in fixed offsets in 2175Å bump amplitude estimates over a wide range of UV slopes. Fig. A1 implies that for the FWHM
 $\sim$
470 Å profile, the amplitude of the UVW2, UVM2, and UVW1 filters will reflect 50%, 70%, and 35% of the peak bump amplitude, respectively. For the FWHM
$\sim$
470 Å profile, the amplitude of the UVW2, UVM2, and UVW1 filters will reflect 50%, 70%, and 35% of the peak bump amplitude, respectively. For the FWHM
 $\sim$
274 Å profile, the amplitude of the UVW2, UVM2, and UVW1 filters will reflect 33%, 53%, and 21% of the peak bump amplitude, respectively. Therefore, the rough expectation is that the observed bump strength from UVM2, using UVW2 and UVW1 as a continuum baseline, would be
$\sim$
274 Å profile, the amplitude of the UVW2, UVM2, and UVW1 filters will reflect 33%, 53%, and 21% of the peak bump amplitude, respectively. Therefore, the rough expectation is that the observed bump strength from UVM2, using UVW2 and UVW1 as a continuum baseline, would be
 $\sim$
25–30% of the true value (i.e. difference between UVM2 and the average of the two wide filters). We test this more rigorously below.
$\sim$
25–30% of the true value (i.e. difference between UVM2 and the average of the two wide filters). We test this more rigorously below.
To examine the behaviour of the Swift/UVOT filters on measurements of the UV slope and the 2175Å feature, we will adopt a 10 Gyr stellar population experiencing constant star formation and Solar metallicity from the Starburst99 models (Leitherer et al. Reference Leitherer1999) as our reference galaxy SED. These parameters are a reasonable approximation for the massive star-forming galaxies in our sample and are sufficient for the purpose of the qualitative discussion in this section. We adopt a Calzetti et al. (Reference Calzetti2000) dust attenuation curve with a Drude profile superimposed with varying intrinsic amplitude,
 $k_\mathrm{bump}$
, values and FWHM widths. We then impose this attenuation curve with varying the amount of reddening, parameterised through
$k_\mathrm{bump}$
, values and FWHM widths. We then impose this attenuation curve with varying the amount of reddening, parameterised through
 $E(B-V)_{\mathrm{star}}$
, onto the stellar population model. We examine 6 values of bump amplitudes, ranging from
$E(B-V)_{\mathrm{star}}$
, onto the stellar population model. We examine 6 values of bump amplitudes, ranging from
 $k_\mathrm{bump}$
=0 to 3.3 (MW average), and 6 values of reddening, ranging from
$k_\mathrm{bump}$
=0 to 3.3 (MW average), and 6 values of reddening, ranging from
 $E(B-V)_{\mathrm{star}}$
=0 to 0.70, where the latter corresponds to the largest values we see in regions for our sample. The results are shown in Fig. A2 and summarised below.
$E(B-V)_{\mathrm{star}}$
=0 to 0.70, where the latter corresponds to the largest values we see in regions for our sample. The results are shown in Fig. A2 and summarised below.

Figure A1. The upper panel demonstrates two Drude profiles with fixed central wavelengths at 2175Å but different widths (FWHM). The dashed black line shows the average MW feature (Fitzpatrick & Massa Reference Fitzpatrick and Massa1990) and the orange solid line shows the average from spectroscopic data of
 $z\sim2$
galaxies (Noll et al. Reference Noll2009). The values of these features after convolving them with the Swift/UVOT filters (shown in lower panel) is indicated by the symbols. All filters extend into the 2175Å feature, which complicates their use to measure the feature. However, the bump values inferred from the UVOT filters (see Section 3.1) are well-behaved over a wide range of UV slopes and under different assumptions for the FWHM of the feature (see Fig. A2).
$z\sim2$
galaxies (Noll et al. Reference Noll2009). The values of these features after convolving them with the Swift/UVOT filters (shown in lower panel) is indicated by the symbols. All filters extend into the 2175Å feature, which complicates their use to measure the feature. However, the bump values inferred from the UVOT filters (see Section 3.1) are well-behaved over a wide range of UV slopes and under different assumptions for the FWHM of the feature (see Fig. A2).

Figure A2. Left: Comparison between UV slopes
 $\beta_\mathrm{IUE}$
, derived using the 10 spectral windows from Calzetti et al. (Reference Calzetti, Kinney and Storchi-Bergmann1994), and
$\beta_\mathrm{IUE}$
, derived using the 10 spectral windows from Calzetti et al. (Reference Calzetti, Kinney and Storchi-Bergmann1994), and
 $\beta_\mathrm{swift}$
(see Equation 2). The symbols indicate 6 different values of the intrinsic bump strength
$\beta_\mathrm{swift}$
(see Equation 2). The symbols indicate 6 different values of the intrinsic bump strength
 $k_\mathrm{bump,int}$
and are shown for 6 different values of reddening (
$k_\mathrm{bump,int}$
and are shown for 6 different values of reddening (
 $E(B-V)_{\mathrm{star}}$
), which start at 0 at the bottom-left and increase towards the top-right with the values indicated in the plot. The slopes agree in the absence of a bump, but deviate with increasing bump strength in a roughly linear manner. This panel shows results for the FWHM=274 Å bump and the FWHM=470 Å case is qualitatively similar but with slightly larger deviations for each point (not shown for clarity). Right: Comparison between the bump measured using UVOT filters
$E(B-V)_{\mathrm{star}}$
), which start at 0 at the bottom-left and increase towards the top-right with the values indicated in the plot. The slopes agree in the absence of a bump, but deviate with increasing bump strength in a roughly linear manner. This panel shows results for the FWHM=274 Å bump and the FWHM=470 Å case is qualitatively similar but with slightly larger deviations for each point (not shown for clarity). Right: Comparison between the bump measured using UVOT filters
 $k_\mathrm{bump,obs}$
(see Equations 4 and 5) relative to the intrinsic bump strength
$k_\mathrm{bump,obs}$
(see Equations 4 and 5) relative to the intrinsic bump strength
 $k_\mathrm{bump,int}$
. It can be seen that they follow roughly linear relations (black dashed and orange solid lines) with minimal impact from the UV slope variation (i.e.
$k_\mathrm{bump,int}$
. It can be seen that they follow roughly linear relations (black dashed and orange solid lines) with minimal impact from the UV slope variation (i.e.
 $E(B-V)_{\mathrm{star}}$
variation; see left panel). The symbol size relates to
$E(B-V)_{\mathrm{star}}$
variation; see left panel). The symbol size relates to
 $E(B-V)_{\mathrm{star}}$
as indicated in the legend and the colours match the Drude profiles used (see Fig. A1). This implies that the correlations observed with
$E(B-V)_{\mathrm{star}}$
as indicated in the legend and the colours match the Drude profiles used (see Fig. A1). This implies that the correlations observed with
 $k_\mathrm{bump,obs}$
in this work should reflect true correlations that would be seen with
$k_\mathrm{bump,obs}$
in this work should reflect true correlations that would be seen with
 $k_\mathrm{bump,int}$
, albeit with different scaling factors.
$k_\mathrm{bump,int}$
, albeit with different scaling factors.
First, we compare the UV slope estimate from Swift (
 $\beta_\mathrm{swift}$
). For our reference UV slope, we perform a fit (in log-space) on the reddened SED using the windows defined in Calzetti et al. (Reference Calzetti, Kinney and Storchi-Bergmann1994) for spectroscopic observations from the International Ultraviolet Explorer (IUE) telescope, (
$\beta_\mathrm{swift}$
). For our reference UV slope, we perform a fit (in log-space) on the reddened SED using the windows defined in Calzetti et al. (Reference Calzetti, Kinney and Storchi-Bergmann1994) for spectroscopic observations from the International Ultraviolet Explorer (IUE) telescope, (
 $\beta_\mathrm{IUE}$
). The 10 UV windows used are between
$\beta_\mathrm{IUE}$
). The 10 UV windows used are between
 $1\,200 \lt\lambda \lt2\,600$
Å and are designed to avoid strong stellar absorption features, including the 2175Å feature. However, we note that the window red-ward of the 2175Å feature used in
$1\,200 \lt\lambda \lt2\,600$
Å and are designed to avoid strong stellar absorption features, including the 2175Å feature. However, we note that the window red-ward of the 2175Å feature used in
 $\beta_\mathrm{IUE}$
(2 400–2 580 Å) can become affected by the feature in the case of large values of
$\beta_\mathrm{IUE}$
(2 400–2 580 Å) can become affected by the feature in the case of large values of
 $k_\mathrm{bump}$
(
$k_\mathrm{bump}$
(
 $k_\mathrm{bump}\gtrsim1$
) when there is moderate reddening, which were not seen in the starburst galaxy sample being studied by Calzetti et al. (Reference Calzetti, Kinney and Storchi-Bergmann1994). In cases with large values of
$k_\mathrm{bump}\gtrsim1$
) when there is moderate reddening, which were not seen in the starburst galaxy sample being studied by Calzetti et al. (Reference Calzetti, Kinney and Storchi-Bergmann1994). In cases with large values of
 $k_\mathrm{bump}$
,
$k_\mathrm{bump}$
,
 $\beta_\mathrm{IUE}$
will have bluer values (lower
$\beta_\mathrm{IUE}$
will have bluer values (lower
 $\beta$
) than the true UV slope. Adopting an even redder window (e.g. 2 600–3 000 Å) could provide a more reliable measure of the true continuum, but this is complicated by the fact that older stars can have non-negligible contributions at
$\beta$
) than the true UV slope. Adopting an even redder window (e.g. 2 600–3 000 Å) could provide a more reliable measure of the true continuum, but this is complicated by the fact that older stars can have non-negligible contributions at
 $\lambda \gt 2\,600$
Å and cause deviations from a power-law form. Therefore, we simply adopt the standard
$\lambda \gt 2\,600$
Å and cause deviations from a power-law form. Therefore, we simply adopt the standard
 $\beta_\mathrm{IUE}$
for the purpose of this comparison. Fig. A2, left compares
$\beta_\mathrm{IUE}$
for the purpose of this comparison. Fig. A2, left compares
 $\beta_\mathrm{IUE}$
vs
$\beta_\mathrm{IUE}$
vs
 $\beta_\mathrm{Swift}$
for the case of a FWHM=274Å Drude profile with different
$\beta_\mathrm{Swift}$
for the case of a FWHM=274Å Drude profile with different
 $E(B-V)_{\mathrm{star}}$
and
$E(B-V)_{\mathrm{star}}$
and
 $k_\mathrm{bump}$
values. In the case of no bump (
$k_\mathrm{bump}$
values. In the case of no bump (
 $k_\mathrm{bump,int}=0$
), the value of
$k_\mathrm{bump,int}=0$
), the value of
 $\beta_\mathrm{swift}$
shows excellent agreement with
$\beta_\mathrm{swift}$
shows excellent agreement with
 $\beta_\mathrm{IUE}$
. These parameters deviate from 1:1 as the value of
$\beta_\mathrm{IUE}$
. These parameters deviate from 1:1 as the value of
 $k_\mathrm{bump,int}$
increases, with larger disagreement at larger
$k_\mathrm{bump,int}$
increases, with larger disagreement at larger
 $E(B-V)_{\mathrm{star}}$
for a fixed
$E(B-V)_{\mathrm{star}}$
for a fixed
 $k_\mathrm{bump,int}$
value.
$k_\mathrm{bump,int}$
value.
Second, we compare the bump measured using UVOT filters
 $k_\mathrm{bump,obs}$
(see Equations 4 and 5) relative to the intrinsic bump strength
$k_\mathrm{bump,obs}$
(see Equations 4 and 5) relative to the intrinsic bump strength
 $k_\mathrm{bump,int}$
, which corresponds to the true peak amplitude value. We find that for the two FWHM tested, they follow roughly linear relations with minimal impact from the UV slope variation (i.e.
$k_\mathrm{bump,int}$
, which corresponds to the true peak amplitude value. We find that for the two FWHM tested, they follow roughly linear relations with minimal impact from the UV slope variation (i.e.
 $E(B-V)_{\mathrm{star}}$
variation). This implies that the correlations observed with
$E(B-V)_{\mathrm{star}}$
variation). This implies that the correlations observed with
 $k_\mathrm{bump,obs}$
in this work should reflect true correlations with the intrinsic bump, albeit with different scaling factors. The slopes of the two relations are 0.30 and 0.26 for FWHM=470 Å and 274 Å, respectively, which agrees with our simple assessment in the beginning of this section.
$k_\mathrm{bump,obs}$
in this work should reflect true correlations with the intrinsic bump, albeit with different scaling factors. The slopes of the two relations are 0.30 and 0.26 for FWHM=470 Å and 274 Å, respectively, which agrees with our simple assessment in the beginning of this section.
Finally, we stress that this comparison assumed the galaxy redshift is
 $z\sim0$
and that these relationships are subject to change as the UVOT filters change position in terms of their rest-frame wavelength.
$z\sim0$
and that these relationships are subject to change as the UVOT filters change position in terms of their rest-frame wavelength.
Appendix B. Comparison between Stellar Continuum and Ionised Gas Reddening and Impact of Normalisation Choice
We performed a comparison of reddening on the stellar continuum and the ionised gas for all galaxies in our sample. To estimate the stellar continuum reddening we perform SED modelling using the MAGPHYS code (da Cunha, Charlot, & Elbaz Reference da Cunha, Charlot and Elbaz2008; Battisti et al. Reference Battisti, da Cunha, Shivaei and Calzetti2020). For details on the assumptions and priors used by MAGPHYS, we refer readers to the papers above. The most relevant aspect for this Section is that MAGPHYS uses the two-component dust attenuation prescription of Charlot & Fall (Reference Charlot and Fall2000), where young stars (
 $t\leq10$
Myr) experience a steeper, SMC-like attenuation curve (birth cloud dust) and older stars (
$t\leq10$
Myr) experience a steeper, SMC-like attenuation curve (birth cloud dust) and older stars (
 $t \gt 10$
Myr) experience a shallower, starburst-like attenuation curve (diffuse ISM dust), with a flexible 2175Å feature on the diffuse ISM dust curve (see Figure 1 in Battisti et al. Reference Battisti, da Cunha, Shivaei and Calzetti2020).
$t \gt 10$
Myr) experience a shallower, starburst-like attenuation curve (diffuse ISM dust), with a flexible 2175Å feature on the diffuse ISM dust curve (see Figure 1 in Battisti et al. Reference Battisti, da Cunha, Shivaei and Calzetti2020).
The photometric data used in the SED fits include Swift/UVOT (UVW2, UVM2, UVW1), SDSS (ugriz) when available (PHANGS-MUSE (gri) otherwise), 2MASS (JHK), Spitzer/IRAC (3.6, 4.5; when available, includes 5.8, 8.0
 $\mu$
m), and JWST/MIRI (F770W, F1130W, F2100W). The SDSS, 2MASS, and Spitzer data were retrieved from the NASA/IPAC Extragalactic Database.Footnote o We emphasise that the outcomes of the SED modelling are dependent on the assumption of energy balance being reliable at the size scales of our regions (out to 21
$\mu$
m), and JWST/MIRI (F770W, F1130W, F2100W). The SDSS, 2MASS, and Spitzer data were retrieved from the NASA/IPAC Extragalactic Database.Footnote o We emphasise that the outcomes of the SED modelling are dependent on the assumption of energy balance being reliable at the size scales of our regions (out to 21
 $\mu$
m). Given that the mid-IR probes warmer dust primarily heated by young stars, this assumption may not be completely unreasonable. Prior to SED fitting, all data were convolved to match the Swift resolution (2.5
$\mu$
m). Given that the mid-IR probes warmer dust primarily heated by young stars, this assumption may not be completely unreasonable. Prior to SED fitting, all data were convolved to match the Swift resolution (2.5
 $^{\prime\prime}$
) and resampled to a common grid, following the procedure outlined in Section 2.5. Example SED fits to individual regions in NGC1300 and NGC4321 are shown in the Bottom Panels of Fig. B1. As the primary output parameter relating to attenuation in MAGPHYS is
$^{\prime\prime}$
) and resampled to a common grid, following the procedure outlined in Section 2.5. Example SED fits to individual regions in NGC1300 and NGC4321 are shown in the Bottom Panels of Fig. B1. As the primary output parameter relating to attenuation in MAGPHYS is
 $A_{V,\mathrm{stars}}$
, we compare this to the value
$A_{V,\mathrm{stars}}$
, we compare this to the value
 $A_{V,\mathrm{gas}}$
derived from the Balmer decrement using VLT/MUSE IFS data and assuming an average MW-extinction curve for the nebular reddening. The relationships between these quantities and
$A_{V,\mathrm{gas}}$
derived from the Balmer decrement using VLT/MUSE IFS data and assuming an average MW-extinction curve for the nebular reddening. The relationships between these quantities and
 $E(B-V)_{\mathrm{star}}/ E(B-V)_{\mathrm{gas}}$
will depend on the shape of the attenuation/extinction curves (i.e.
$E(B-V)_{\mathrm{star}}/ E(B-V)_{\mathrm{gas}}$
will depend on the shape of the attenuation/extinction curves (i.e.
 $k_V=A_V/E(B-V)$
), which is flexible in MAGPHYS and therefore complicated to recover. However, this would only introduce a scaling factor assuming that the
$k_V=A_V/E(B-V)$
), which is flexible in MAGPHYS and therefore complicated to recover. However, this would only introduce a scaling factor assuming that the
 $k_V$
values (i.e.
$k_V$
values (i.e.
 $R_V$
) for the stellar attenuation curve do not vary dramatically across each galaxy.
$R_V$
) for the stellar attenuation curve do not vary dramatically across each galaxy.
Comparisons between
 $A_{V,\mathrm{stars}}$
and
$A_{V,\mathrm{stars}}$
and
 $A_{V,\mathrm{gas}}$
are shown visually in the Top Panels of Fig. B1 and as 2D histograms for all galaxies in Fig. B2. All cases show a moderately tight, linear correlation with the stellar continuum experiencing less reddening than the nebular emission. The average between the two cases is that the stellar continuum experiences roughly half as much reddening as the nebular emission (the average slope is
$A_{V,\mathrm{gas}}$
are shown visually in the Top Panels of Fig. B1 and as 2D histograms for all galaxies in Fig. B2. All cases show a moderately tight, linear correlation with the stellar continuum experiencing less reddening than the nebular emission. The average between the two cases is that the stellar continuum experiences roughly half as much reddening as the nebular emission (the average slope is
 $\sim$
0.5), which agrees with previous studies of local galaxies (
$\sim$
0.5), which agrees with previous studies of local galaxies (
 $\langle E(B-V)_{\mathrm{star}}\rangle/\langle E(B-V)_{\mathrm{gas}}\rangle\ \sim0.5$
; e.g. Calzetti et al. Reference Calzetti, Kinney and Storchi-Bergmann1994; Kreckel et al. Reference Kreckel2013; Battisti et al. Reference Battisti, Calzetti and Chary2016; Emsellem et al. Reference Emsellem2022). These results imply that using ionised gas reddening is a reasonable proxy for stellar continuum reddening for normalising the 2175Å bump, as adopted in the main analysis.
$\langle E(B-V)_{\mathrm{star}}\rangle/\langle E(B-V)_{\mathrm{gas}}\rangle\ \sim0.5$
; e.g. Calzetti et al. Reference Calzetti, Kinney and Storchi-Bergmann1994; Kreckel et al. Reference Kreckel2013; Battisti et al. Reference Battisti, Calzetti and Chary2016; Emsellem et al. Reference Emsellem2022). These results imply that using ionised gas reddening is a reasonable proxy for stellar continuum reddening for normalising the 2175Å bump, as adopted in the main analysis.
For completeness, we also test our main results when normalising by
 $A_{V,\mathrm{stars}}$
instead of
$A_{V,\mathrm{stars}}$
instead of
 $E(B-V)_{\mathrm{gas}}$
. We adopt the same primary selection criteria in Section 3.9 ((1)–(3)), because we also compared to quantities derived from the emission lines (e.g. SFR), with a variation to Condition (4) as
$E(B-V)_{\mathrm{gas}}$
. We adopt the same primary selection criteria in Section 3.9 ((1)–(3)), because we also compared to quantities derived from the emission lines (e.g. SFR), with a variation to Condition (4) as
 $\sigma(A_\mathrm{bump}/A_{V,\mathrm{stars}}) \lt0.3$
. The
$\sigma(A_\mathrm{bump}/A_{V,\mathrm{stars}}) \lt0.3$
. The
 $A_\mathrm{bump}/A_{V,\mathrm{stars}}$
-
$A_\mathrm{bump}/A_{V,\mathrm{stars}}$
-
 $R_\mathrm{PAH}$
relationship is shown in Fig. B1. The uncertainties on
$R_\mathrm{PAH}$
relationship is shown in Fig. B1. The uncertainties on
 $A_{V,\mathrm{stars}}$
are slightly larger relative to
$A_{V,\mathrm{stars}}$
are slightly larger relative to
 $A_{V,\mathrm{gas}}$
(i.e.
$A_{V,\mathrm{gas}}$
(i.e.
 $E(B-V)_{\mathrm{gas}}$
) for nearly all galaxies, which we attribute to the age-dust degeneracy in the SED modelling. In MAGPHYS, both the amplitude and shape of the attenuation curve are free parameters, with the final ‘effective’ attenuation curve being a combination of the ISM and birth-cloud dust curves in the Charlot & Fall (Reference Charlot and Fall2000) model (e.g. Battisti et al. Reference Battisti, da Cunha, Shivaei and Calzetti2020). As a reminder, for the nebular reddening we assume a fixed average MW extinction curve. We also find similar outcomes between
$E(B-V)_{\mathrm{gas}}$
) for nearly all galaxies, which we attribute to the age-dust degeneracy in the SED modelling. In MAGPHYS, both the amplitude and shape of the attenuation curve are free parameters, with the final ‘effective’ attenuation curve being a combination of the ISM and birth-cloud dust curves in the Charlot & Fall (Reference Charlot and Fall2000) model (e.g. Battisti et al. Reference Battisti, da Cunha, Shivaei and Calzetti2020). As a reminder, for the nebular reddening we assume a fixed average MW extinction curve. We also find similar outcomes between
 $A_\mathrm{bump}/A_{V,\mathrm{stars}}$
and other parameters. We show the comparison with
$A_\mathrm{bump}/A_{V,\mathrm{stars}}$
and other parameters. We show the comparison with
 $\Sigma_{SFR}$
in Fig. B4. The parameters of both the linear and second-order fits (including as a function of sSFR, not shown) are listed in Table B1.
$\Sigma_{SFR}$
in Fig. B4. The parameters of both the linear and second-order fits (including as a function of sSFR, not shown) are listed in Table B1.
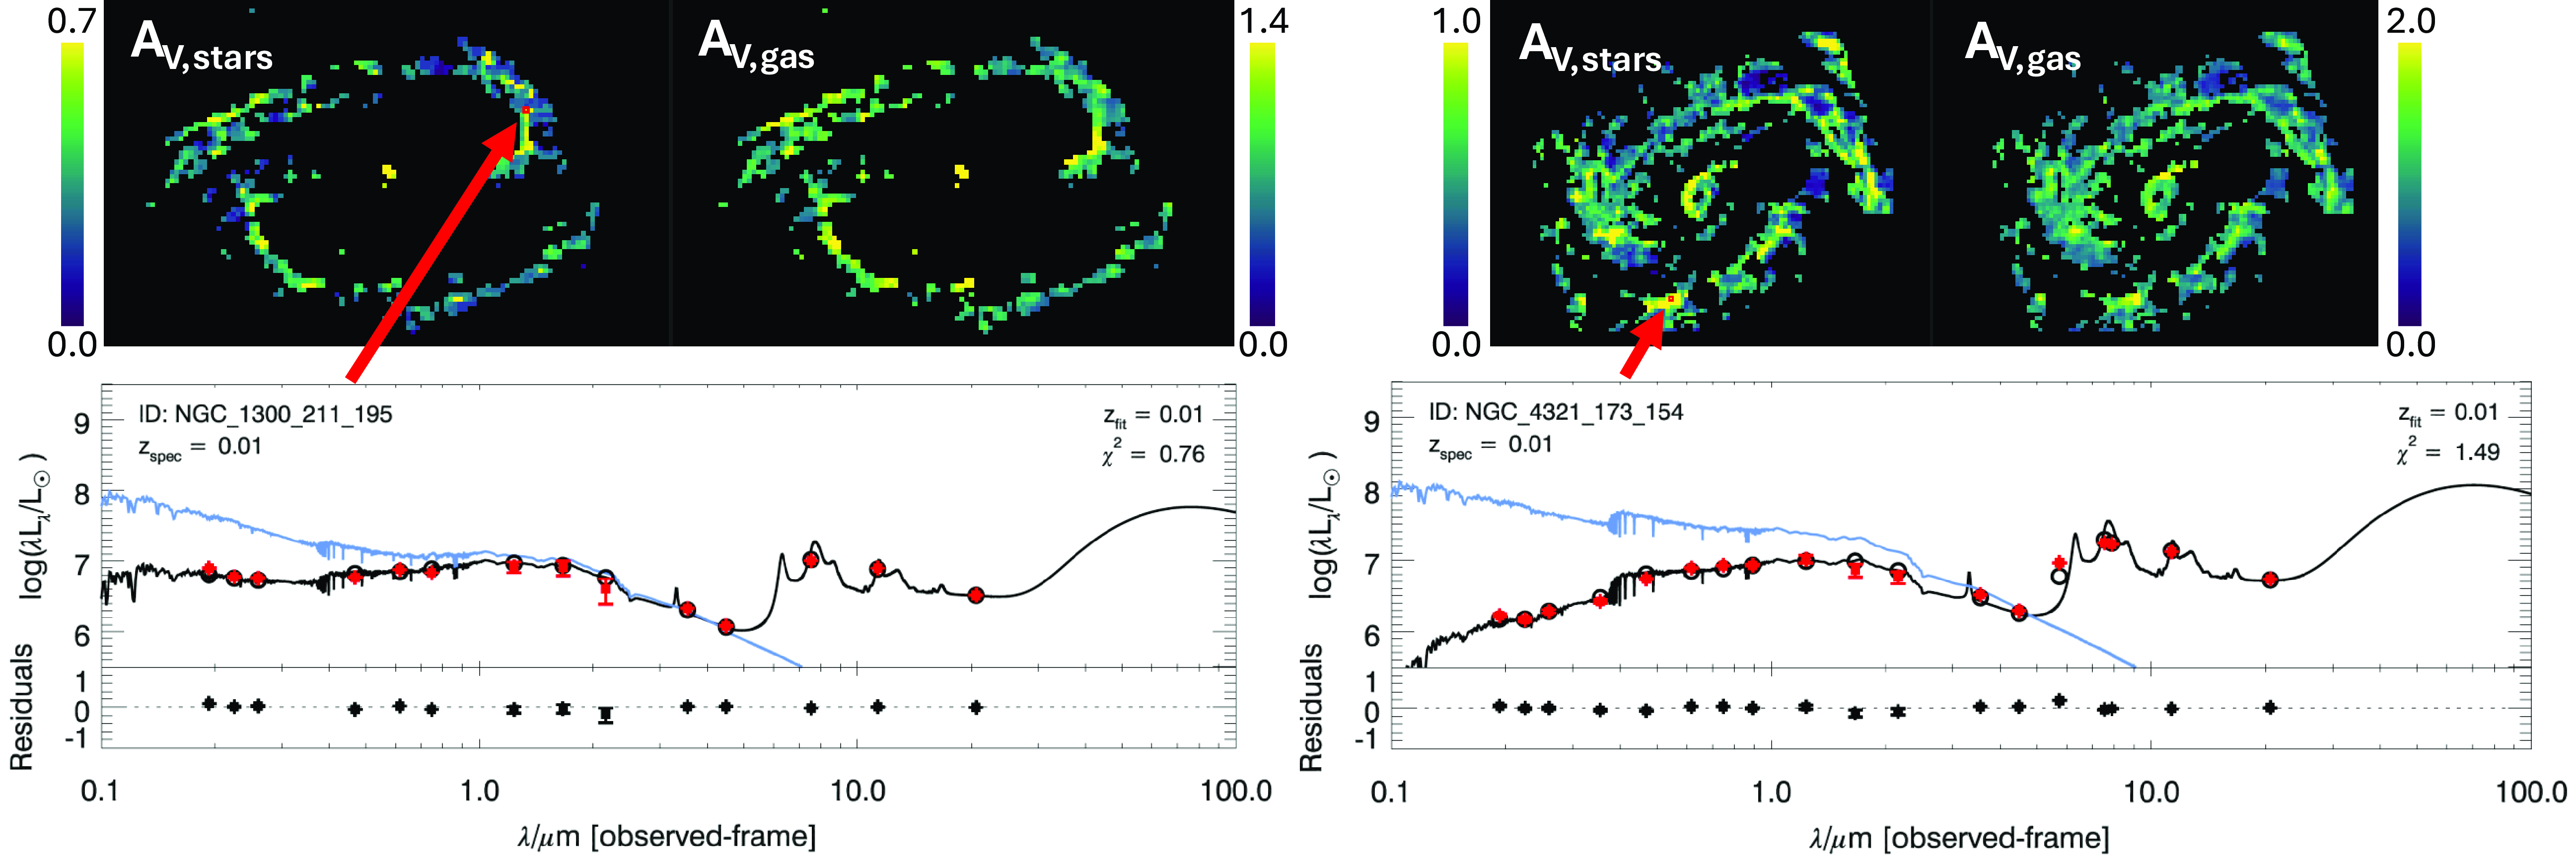
Figure B1. Top panels: Maps of
 $A_{V,\mathrm{stars}}$
, derived from MAGPHYS SED modelling of the photometry of individual regions, and
$A_{V,\mathrm{stars}}$
, derived from MAGPHYS SED modelling of the photometry of individual regions, and
 $A_{V,\mathrm{gas}}$
, derived from the Balmer decrement using VLT/MUSE IFS data and assuming a MW-extinction curve for the nebular reddening for NGC 1300 (left) and NGC 4321 (right). The regions shown are restricted to those satisfying the criteria described in Section 3.9. Bottom panels: Example region fits with MAGPHYS for the regions indicated by the red arrows and boxes.
$A_{V,\mathrm{gas}}$
, derived from the Balmer decrement using VLT/MUSE IFS data and assuming a MW-extinction curve for the nebular reddening for NGC 1300 (left) and NGC 4321 (right). The regions shown are restricted to those satisfying the criteria described in Section 3.9. Bottom panels: Example region fits with MAGPHYS for the regions indicated by the red arrows and boxes.
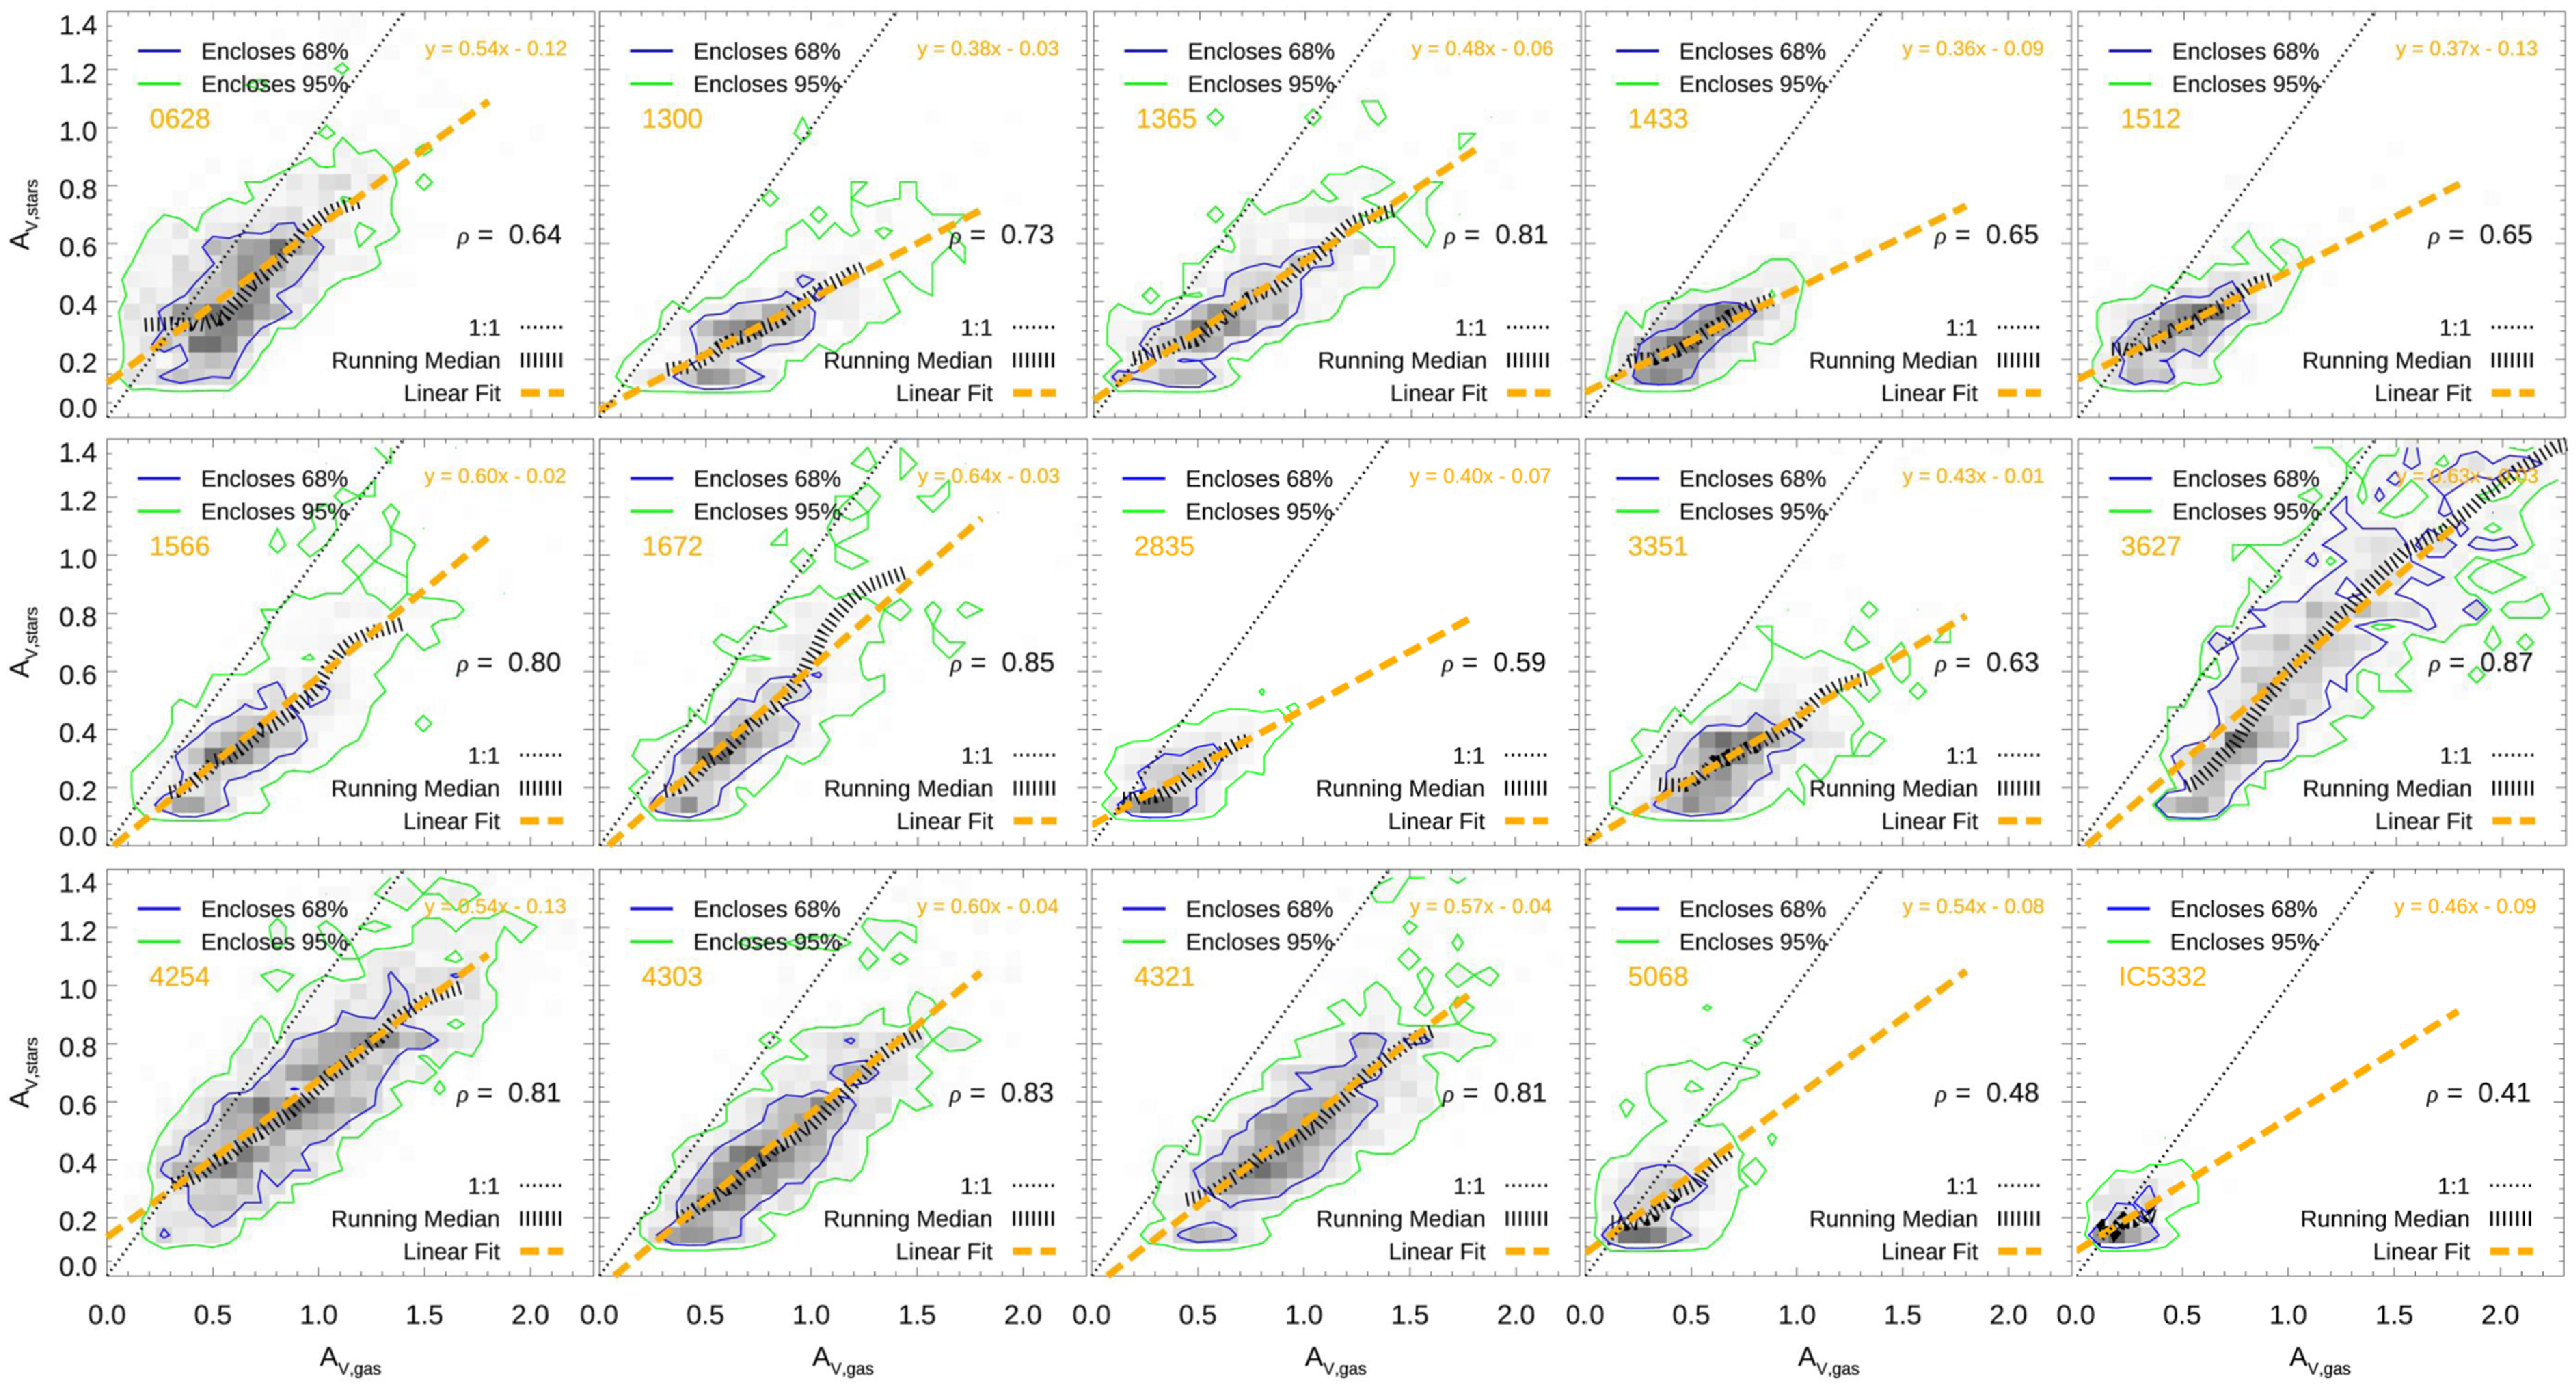
Figure B2. 2D histograms of
 $A_{V,\mathrm{stars}}$
vs
$A_{V,\mathrm{stars}}$
vs
 $A_{V,\mathrm{gas}}$
for all galaxies, which show moderately tight (
$A_{V,\mathrm{gas}}$
for all galaxies, which show moderately tight (
 $0.4\lesssim \rho \lesssim 0.9$
), linear correlations. The regions shown are restricted to those satisfying criteria (1)–(3) in Section 3.9 and also
$0.4\lesssim \rho \lesssim 0.9$
), linear correlations. The regions shown are restricted to those satisfying criteria (1)–(3) in Section 3.9 and also
 $A_V \gt 0.1$
and
$A_V \gt 0.1$
and
 $\sigma(A_V) \lt0.3$
(for both cases). The stellar continuum experiences less reddening than the nebular emission in all cases (linear fit slopes are typically between 0.4 and 0.6), similar to previous findings. This implies that using ionised gas reddening is a reasonable proxy for stellar continuum reddening for normalising the 2175Å bump. Dustier galaxies (those with larger
$\sigma(A_V) \lt0.3$
(for both cases). The stellar continuum experiences less reddening than the nebular emission in all cases (linear fit slopes are typically between 0.4 and 0.6), similar to previous findings. This implies that using ionised gas reddening is a reasonable proxy for stellar continuum reddening for normalising the 2175Å bump. Dustier galaxies (those with larger
 $A_V$
) tend to have larger slopes (smaller difference in reddening) and tighter correlations than less dusty galaxies.
$A_V$
) tend to have larger slopes (smaller difference in reddening) and tighter correlations than less dusty galaxies.
Table B1. Fit parameters of
 $A_\mathrm{bump}/A_{V,\mathrm{stars}}$
as a function of galaxy properties.
$A_\mathrm{bump}/A_{V,\mathrm{stars}}$
as a function of galaxy properties.

Notes. The functional form of these fits is
 $y = p_0+p_1x+p_2x^2$
, where y is
$y = p_0+p_1x+p_2x^2$
, where y is
 $A_\mathrm{bump}/A_{V,\mathrm{stars}}$
. We present both a linear and second-order polynomial fit for each case. We also report the intrinsic dispersion,
$A_\mathrm{bump}/A_{V,\mathrm{stars}}$
. We present both a linear and second-order polynomial fit for each case. We also report the intrinsic dispersion,
 $\sigma_{\mathrm{int}}$
, returned from MPFITEXY, and the Spearman nonparametric correlation coefficient,
$\sigma_{\mathrm{int}}$
, returned from MPFITEXY, and the Spearman nonparametric correlation coefficient,
 $\rho_S$
. The data used in the fits are a combination of five galaxies (NGC 1365, 1566, 1672, 3627, and 4321).
$\rho_S$
. The data used in the fits are a combination of five galaxies (NGC 1365, 1566, 1672, 3627, and 4321).
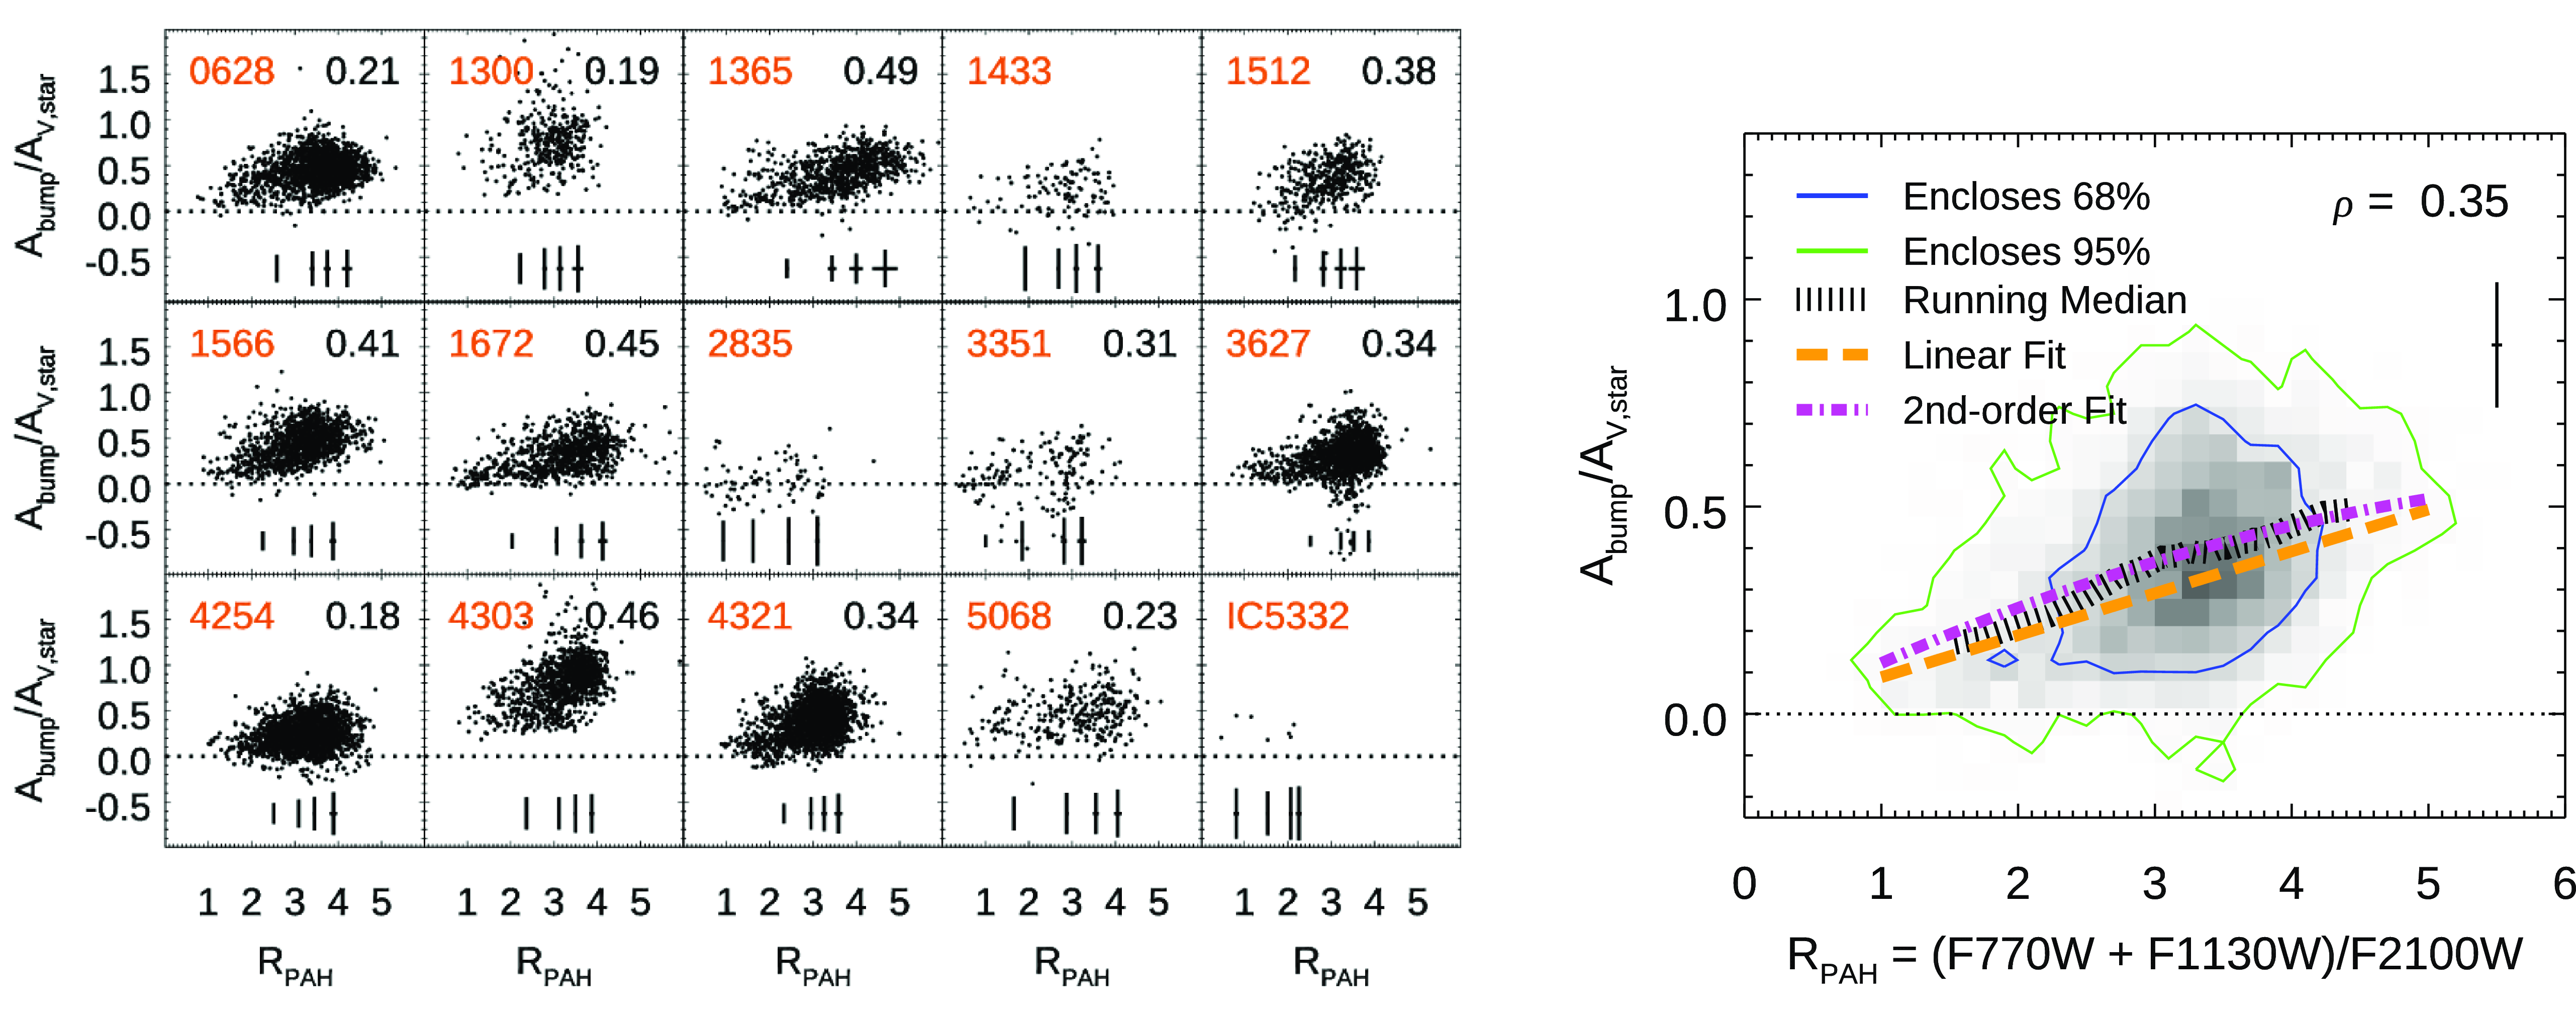
Figure B3. Similar to Fig. 6 but now normalising the 2175Å bump by
 $A_{V,\mathrm{stars}}$
. (Left:) Intrinsic 2175Å feature strength in terms of
$A_{V,\mathrm{stars}}$
. (Left:) Intrinsic 2175Å feature strength in terms of
 $A_\mathrm{bump}/A_{V,\mathrm{stars}}$
vs. PAH abundance,
$A_\mathrm{bump}/A_{V,\mathrm{stars}}$
vs. PAH abundance,
 $R_\mathrm{PAH}$
=(F770W+F1130W)/F2100W, for the 15 galaxies in our sample. (Right:) 2D histogram of
$R_\mathrm{PAH}$
=(F770W+F1130W)/F2100W, for the 15 galaxies in our sample. (Right:) 2D histogram of
 $A_\mathrm{bump}/A_{V,\mathrm{stars}}$
vs.
$A_\mathrm{bump}/A_{V,\mathrm{stars}}$
vs.
 $R_\mathrm{PAH}$
combining the five ‘robust’ galaxies: NGC 1365, 1566, 1672, 3627, and 4321. A representative median errorbar is shown in the upper-right, which is slightly larger than when normalising by the ionised gas reddening. Trends are qualitatively similar to those found when normalising by the ionised gas reddening,
$R_\mathrm{PAH}$
combining the five ‘robust’ galaxies: NGC 1365, 1566, 1672, 3627, and 4321. A representative median errorbar is shown in the upper-right, which is slightly larger than when normalising by the ionised gas reddening. Trends are qualitatively similar to those found when normalising by the ionised gas reddening,
 $E(B-V)_{\mathrm{gas}}$
.
$E(B-V)_{\mathrm{gas}}$
.
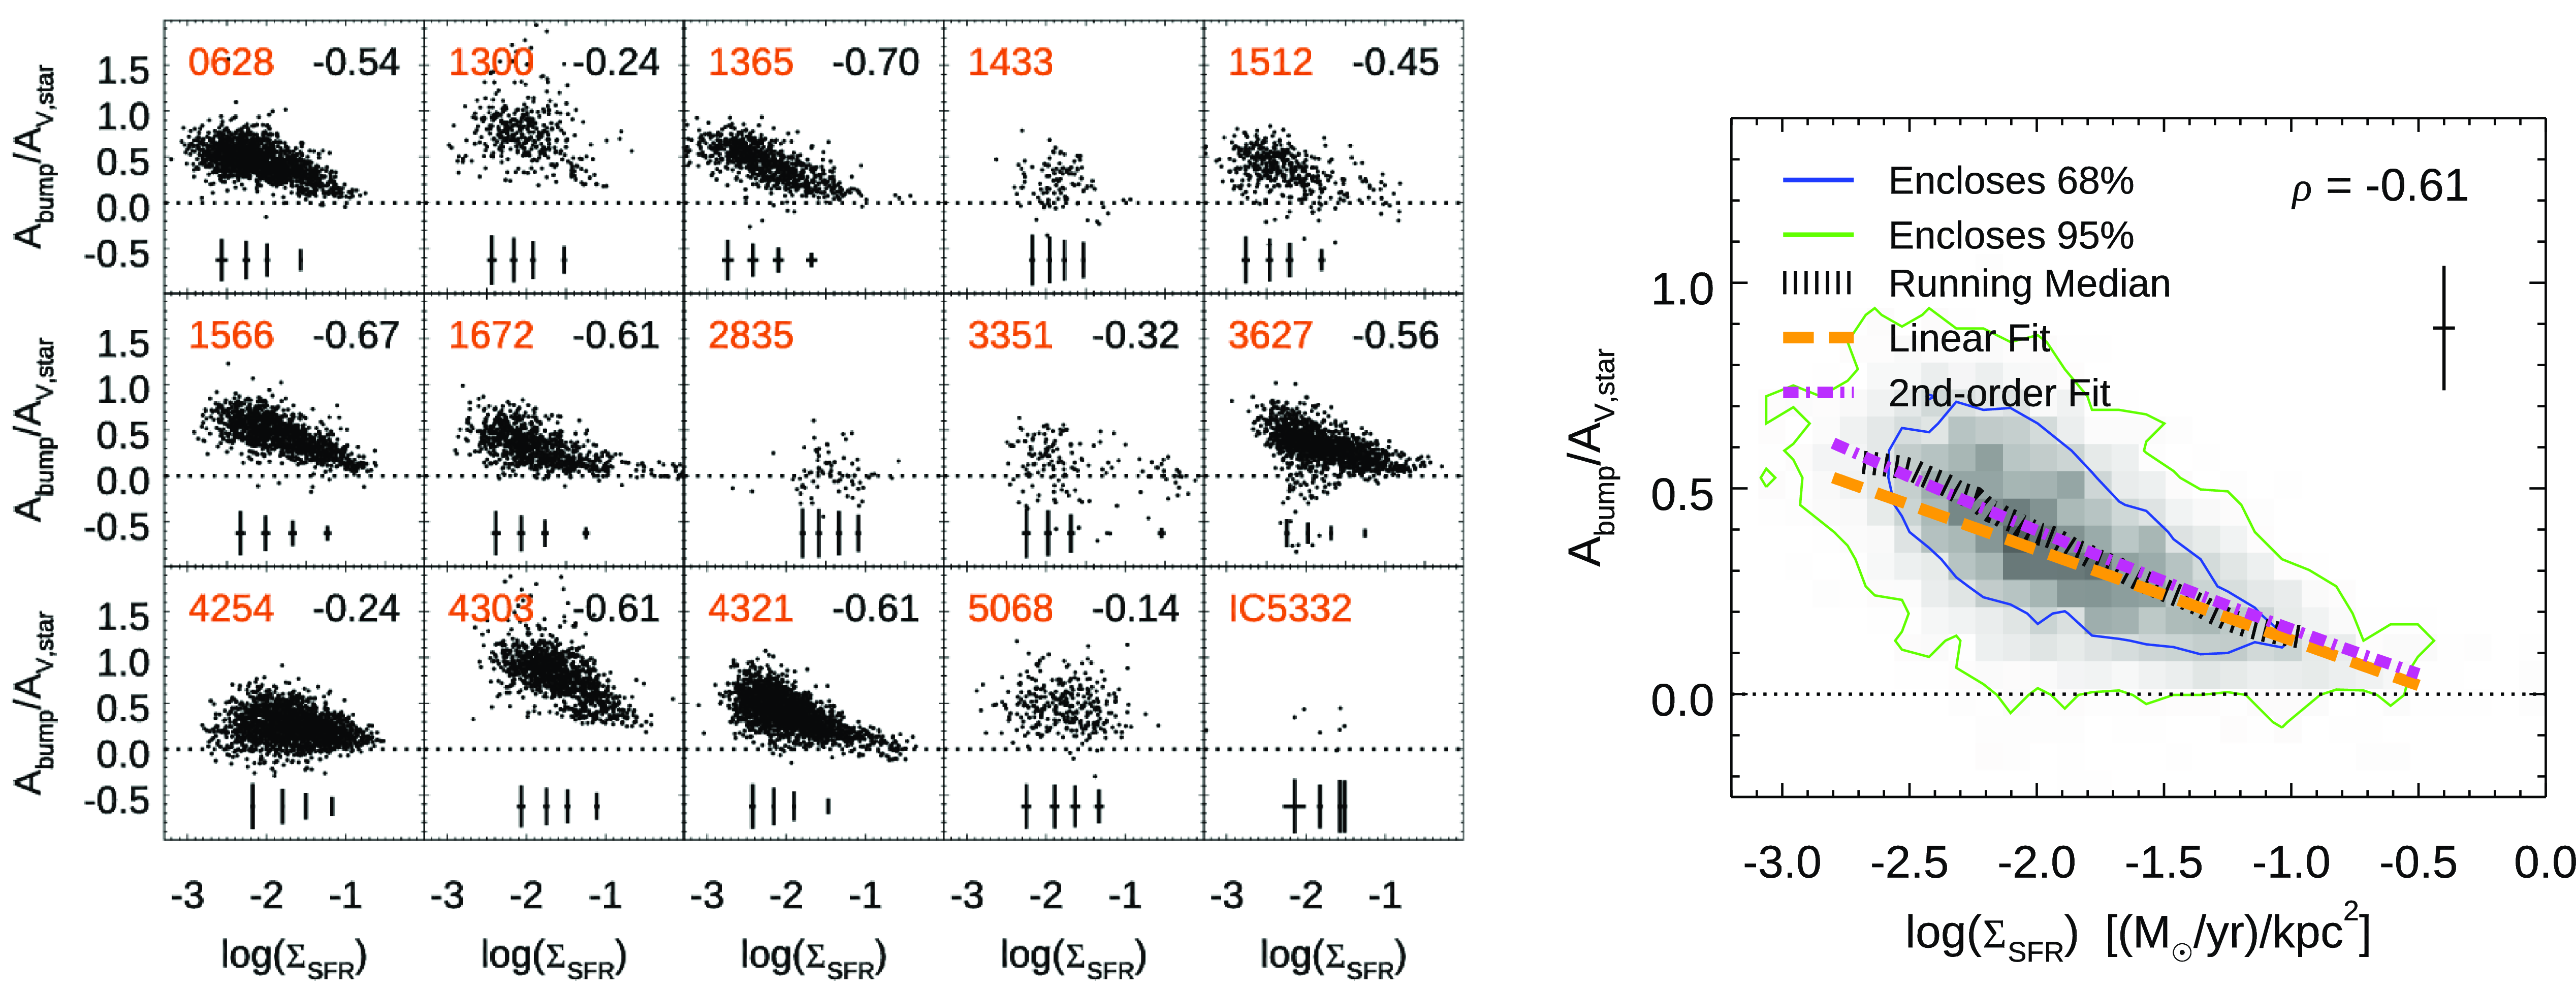
Figure B4. Similar to Fig. 7 but now showing the intrinsic 2175Å feature strength in terms of
 $A_\mathrm{bump}/A_{V,\mathrm{stars}}$
vs. SFR surface density,
$A_\mathrm{bump}/A_{V,\mathrm{stars}}$
vs. SFR surface density,
 $\Sigma_{SFR}$
. The 2D histogram combines NGC 1365, 1566, 1672, 3627, and 4321. Trends are qualitatively similar to those found when normalising by the ionised gas reddening,
$\Sigma_{SFR}$
. The 2D histogram combines NGC 1365, 1566, 1672, 3627, and 4321. Trends are qualitatively similar to those found when normalising by the ionised gas reddening,
 $E(B-V)_{\mathrm{gas}}$
.
$E(B-V)_{\mathrm{gas}}$
.


 Open access