Introduction
Working memory (WM) deficits are a pivotal neuropsychological impairment in patients with schizophrenia (SCZ) (Silver et al. Reference Silver, Feldman, Bilker and Gur2003; Lee & Park, Reference Lee and Park2005; Forbes et al. Reference Forbes, Carrick, McIntosh and Lawrie2009). The visuospatial domain of WM is particularly affected by this impairment (Lee & Park, Reference Lee and Park2005; Forbes et al. Reference Forbes, Carrick, McIntosh and Lawrie2009; Hui et al. Reference Hui, Li, Li, Lee, Chang and Chan2016; Stäblein et al. Reference Stäblein, Sieprath, Knöchel, Landertinger, Schmied and Ghinea2016) and evidence indicates that the process of encoding information into WM is inefficient in SCZ (Hahn et al. Reference Hahn, Robinson, Kaiser, Harvey, Beck and Leonard2010; Mayer & Park, Reference Mayer and Park2012; Mayer et al. Reference Mayer, Kim and Park2014). Findings from functional magnetic resonance imaging (fMRI) studies suggest that impaired visuospatial WM encoding is associated with reduced neuronal activation in prefrontal brain areas, as in the inferior frontal gyrus (IFG) and middle frontal gyrus (MFG), as well as in the inferior parietal lobule (IPL) in SCZ (Choi et al. Reference Choi, Park, Jung, Jang, Kang and Jung2012; Anticevic et al. Reference Anticevic, Repovs and Barch2013; Bittner et al. Reference Bittner, Linden, Roebroeck, Härtling, Rotarska-Jagiela and Maurer2015), but the current understanding of underlying neuronal dysfunctions is limited.
Healthy biological first-degree relatives of SCZ show poorer WM performances as well, although to a lesser extent than SCZ (Snitz et al. Reference Snitz, MacDonald and Carter2006). Furthermore, the meta-analytic evidence demonstrates that biological relatives of SCZ show decreases in neuronal activation in (pre)frontal areas and increases in frontopolar, parietal and thalamic regions throughout WM tasks when compared to healthy control subjects (Zhang et al. Reference Zhang, Picchioni, Allen and Toulopoulou2016). The meta-analysis by Zhang et al. (Reference Zhang, Picchioni, Allen and Toulopoulou2016) also shows that in the MFG both greater and reduced activation can be observed across studies using different analysis approaches, emphasizing the potential functional relevance of abnormal MFG activation for WM performance in first-degree relatives of SCZ. Thus, behavioral WM deficits, as well as aberrant neuronal activation patterns during WM tasks, are discussed as an endophenotypic trait marker of the disease (Snitz et al. Reference Snitz, MacDonald and Carter2006; Repovš & Barch, Reference Repovš and Barch2012; Park & Gooding, Reference Park and Gooding2014). However, these conclusions are based on the aggregation of studies that investigated different WM types, predominantly the verbal domain, and only occasionally differentiated between processes/phases. One study by Choi et al. (Reference Choi, Park, Jung, Jang, Kang and Jung2012) investigated spatial WM in first-degree relatives of SCZ during the encoding phase and reported delayed reaction times and increased neuronal activation in the dorsolateral prefrontal cortex (DLPFC), superior temporal gyrus, and IPL. Overall, the visuospatial domain and especially the encoding process and their neuronal correlates – although of particular interest and relevance in studies with SCZ – remain less understood in biological relatives.
A concept that is closely related – albeit not identical – to WM encoding is WM consolidation. The process is described as the formation (Fuller et al. Reference Fuller, Luck, McMahon and Gold2005, Reference Fuller, Luck, Braun, Robinson, McMahon and Gold2009; Woodman & Vogel, Reference Woodman and Vogel2005; Vogel et al. Reference Vogel, Woodman and Luck2006) or further strengthening (Ricker & Cowan, Reference Ricker and Cowan2014) of durable WM representations and is often conceptualized as a variety (Fuller et al. Reference Fuller, Luck, McMahon and Gold2005, Reference Fuller, Luck, Braun, Robinson, McMahon and Gold2009; Vogel et al. Reference Vogel, Woodman and Luck2006) or type (Jolicoeur & Dell'Acqua, Reference Jolicoeur and Dell'Acqua1998) of WM encoding, but the term has also been used synonymously to WM encoding (Woodman & Vogel, Reference Woodman and Vogel2005; Mainy et al. Reference Mainy, Kahane, Minotti, Hoffmann, Bertrand and Lachaux2007). The time rate of visual WM consolidation is most commonly investigated with change detection tasks where the consolidation of a number of items (e.g. colored squares; rectangular bars of different orientation) is interrupted with a masking stimulus. Prior behavioral studies showed that the visual consolidation is impaired in SCZ and argued that the process may be slowed so that SCZ need more time to fully consolidate individual items (Fuller et al. Reference Fuller, Luck, McMahon and Gold2005, Reference Fuller, Luck, Braun, Robinson, McMahon and Gold2009).
The primary goal of this study was the identification of possible WM impairments and accompanying aberrant neuronal activation patterns during visual WM encoding in SCZ and first-degree relatives of schizophrenia patients (REL) when compared with healthy control subjects (CON). We hypothesized that SCZ show reduced neuronal activation and that REL show increased/decreased neuronal activation, predominantly in the DLPFC, during WM encoding compared to CON. Based on prior findings outlined above we expected abnormal neural activation of the MFG in both SCZ and REL. A secondary goal was the examination of the visual WM consolidation process in these groups. We hypothesized that SCZ and REL show poorer WM performance when compared with CON, that behavioral performance in all groups increases with the time available for consolidation, and that SCZ and REL need more time for consolidation to reach performance levels of CON. To the best of our knowledge, this is the first study investigating WM consolidation in REL as well as encoding specific visual WM activation differences in SCZ and REL.
In view of the diverging usage of the term WM consolidation, we opted for the most applied definition of the term: WM consolidation is the process of forming durable WM representations that can be interrupted by the presentation of a stimulus mask. Thus, we attributed the behavioral results of the visual change detection task applied in this study to the consolidation concept. Regarding our fMRI analysis and results, we use the broader term WM encoding as we think it describes the multi-second (hemodynamic response) phase of interest investigated in this study more accurately.
Methods
Participants
A total of 72 subjects were included in the study, consisting of 25 patients with paranoid SCZ according to criteria of the Diagnostic and Statistical Manual for Mental Disorders (Fourth Edition, Text Revision; DSM–IV–TR) (American Psychiatric Association, 2000), 22 healthy first-degree relatives of persons with schizophrenia (REL; of which four were directly related to patients in the SCZ group) and 25 healthy unrelated control subjects (CON). REL were asked to present a confirmation that a first-degree relative of theirs has been diagnosed with SCZ. Medical reports as well as, in few cases, direct calls with the treating physician (after prior release from medical confidentiality obligations by the patient) were accepted as confirmation. Initially, 81 subjects enrolled and took part in the study, nine subjects had to be removed from the analysis after quality control of the imaging and behavioral data (see online Supplementary Methods for more details).
All participants were between 18 and 60 years of age and were right-handed. The German language versions of the Structured Clinical Interview for DSM–IV axis I and axis II disorders (SCID-I and -II) (Wittchen et al. Reference Wittchen, Zaudig and Fydrich1997) were conducted to establish a diagnosis and to rule out comorbidities in the SCZ group, or any psychiatric disorder in the CON and REL groups, respectively. Further exclusion criteria for all groups included substance abuse in the last 4 months, neurological disorders including disorders of the central nervous system and head injuries, a family history of neurological disorders, current intake of anticoagulant drugs or psychiatric drugs (criteria only valid for CON and REL), color blindness as well as general MRI exclusion criteria. In CON, we used a semistructured clinical interview to rule out a family history of major mental disorders.
SCZ were recruited at the Department of Psychiatry, Psychosomatic Medicine and Psychotherapy, University Hospital Frankfurt, Germany. All patients were in a stable clinical condition and clinical symptom severity was rated with the Positive and Negative Syndrome Scale (PANSS) (Kay et al. Reference Kay, Fiszbein and Opler1987). All but one patient were being treated with antipsychotic medication; it was ensured that the medication type and/or dosage have been consistent for at least 2 weeks. REL were not only recruited via SCZ patients that were being treated at the University Hospital Frankfurt but also through local and online advertisements, which were also used to recruit CON. The three groups were matched for age, sex, years of education, and parental years of education (see Table 1 for details). Verbal intelligence was measured with a vocabulary test (MWT-B). The study was approved by the ethical board of the faculty of medicine of the University Hospital Frankfurt, Germany, and all subjects gave written informed consent.
Table 1. Demographic characteristics and clinical information

SCZ, schizophrenia patients; REL, first-degree relatives of persons with schizophrenia; CON, healthy control subjects; CPZE, chlorpromazine equivalent medication doses; PANSS, Positive and Negative Syndrome Scale.
* p < 0.001, v. CON (post hoc t test).
a Average of mother's and father's years of education.
Visual WM task
A masked change detection task was used to investigate WM consolidation efficiency. Subjects were instructed to memorize the orientation of three objects. The amount of time to consolidate the objects was controlled and varied in different task conditions. This was implemented through the use of a subsequently presented stimulus mask. After a retention interval subjects had to decide if the orientation of three objects in a test array matches the orientation of the initially presented objects. Response accuracy and reaction time across trials served as measures of task performance.
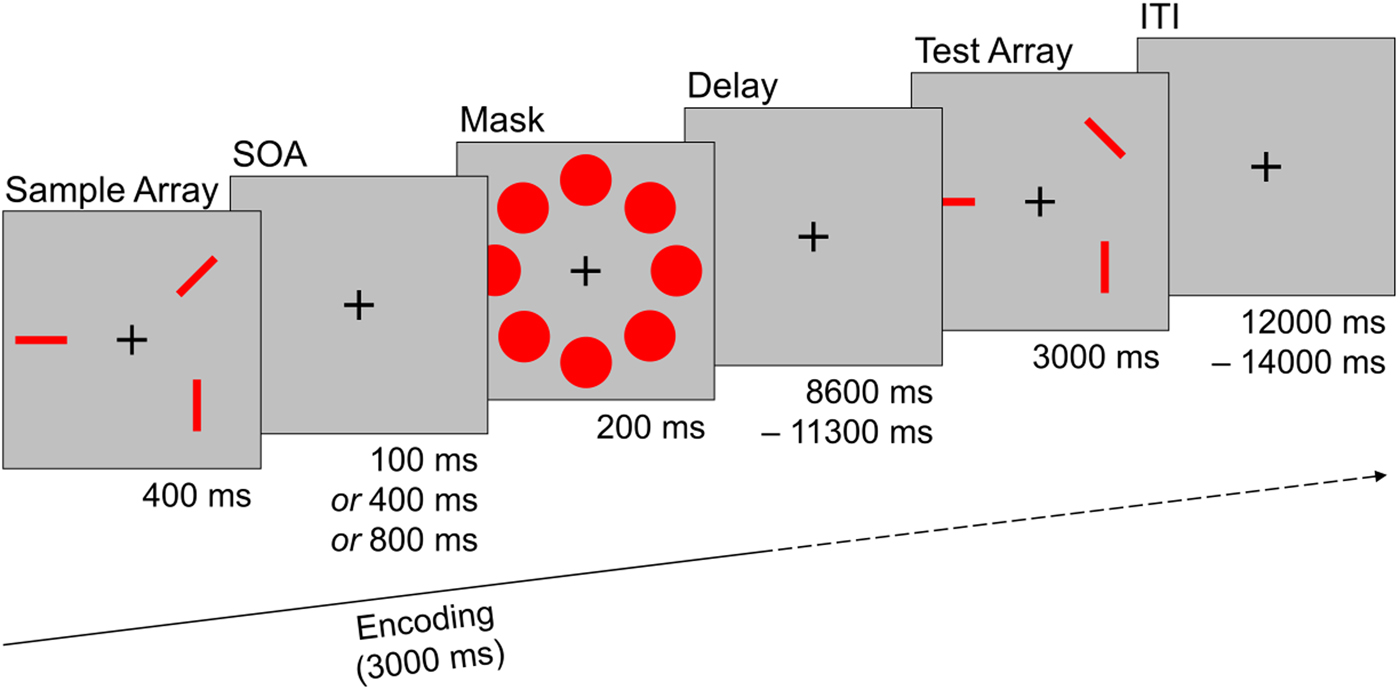
Every trial started with the presentation of a sample array consisting of three rectangular red bars for 400 ms. Each bar was randomly aligned in one of four possible orientations and two bars never aligned in the same orientation. The spatial location of each bar was randomly set in one of eight possible locations that were arranged circularly around a fixation cross in the middle of the screen. After a short interval, a stimulus mask consisting of eight red circles that covered all possible stimulus locations was shown for 200 ms. The time between sample array offset and mask onset was systematically varied and could last either 100, 400, or 800 ms [stimulus onset asynchrony (SOA); please see online Supplementary Methods for additional information]. Mask offset was followed by a delay interval of variable length (8600–11 300 ms) before a test array was shown for 3000 ms. The test array consisted either of the same (i.e. identically oriented) red bars as the sample array (‘same’ trials), or of three red bars in the same spatial location as in the sample array, but with the orientation of one red bar changed (‘different’ trials). Participants had to indicate via button press whether the orientation of the red bars remained the same, or if the orientation of one red bar changed. After the test array a fixation cross was shown for a variable duration [12 000–14 000 ms; interstimulus interval (ITI)] until the start of the next trial. The task consisted of 30 randomly ordered trials and participants performed three practice trials before the start of the task. Half of the trials were ‘same’ trials, the other half were ‘different’ trials (see Fig. 1).

Fig. 1. Sample trial of the visual working memory task used during fMRI assessment. Participants had to remember the orientation of three red bars that were masked after a systematically varied interval (SOA). After a delay phase subjects had to decide if the orientation of the bars in the test array match the sample array. The trial depicted here is a ‘different’ trial were the orientation of one bar changed. SOA, stimulus onset asynchrony; ITI, interstimulus interval.
Image acquisition and data preprocessing
We obtained MRI images with a Siemens Magnetom Trio 3-Tesla system; used a gradient echo EPI pulse sequence to acquire functional T2*-weighted images; obtained anatomical scans for co-registration purpose with a T1-weighted 3D MPRAGE pulse sequence; quality controlled, preprocessed and aligned the data and transformed it into Talairach coordinate space. All data processing and statistical analyses were performed with the BrainVoyager QX software package (v2.8.4; Brain Innovation, Maastricht, The Netherlands). Detailed information on image acquisition parameters, quality control, and data preprocessing can be found in the online Supplementary Methods.
Statistical analysis
Performance in the visual WM task was analyzed with one mixed design analysis of variance (ANOVA) for each outcome measure (response accuracy and reaction time; dependent variables) with group (SCZ/REL/CON) as between-subjects variable and SOA as within-subjects variable (repeated measures; three-factor levels: SOA 100/SOA 400/SOA 800). In case of significant main or interaction effects post hoc comparisons were performed using Fisher's least significant difference test.
fMRI data were analyzed with a general linear model (GLM) procedure estimating the hemodynamic response for the encoding phase of the WM task. The first-level (intra-subject) event-related design matrix was built by defining encoding phase specific predictors for each SOA task condition modeled by box-car functions. The encoding phase predictor covered an interval of 3000 ms and comprised the task segments sample array, SOA, mask, and part of delay (see Fig. 1; straight timeline on the bottom shows the approximate encoding predictor duration in relation to the timing of the task). Only trials that were answered correctly were included as main predictors, task trials with incorrect responses were included as confound predictors. The 6 head motion estimates (x, y, z translation and rotation) obtained during fMRI preprocessing were z-transformed and included as confound predictors (nuisance variables) as well. The main predictor box-car time courses were convolved with a two-gamma hemodynamic response function and a GLM was calculated for each subject.
Estimated beta values were entered into a second-level (multi-subject) random effects repeated measures ANOVA with encoding phase SOA conditions as a within-subjects factor (three-factor levels: SOA 100/SOA 400/SOA 800) and the group as a between-subjects factor (three-factor levels: SCZ/REL/CON). We tested the following planned comparisons across all encoding phase SOA conditions: SCZ > CON and REL > CON. Statistical maps were corrected for multiple comparisons using the false discovery rate (FDR) approach with a minimum cluster size of 160 mm3. In addition, we tested planned group comparisons (SCZ > CON and REL > CON) for each encoding phase SOA condition. A cluster-size thresholding procedure was used to correct for multiple comparisons: statistical images were thresholded with an initial single-voxel threshold of p < 0.01 (uncorrected); cluster-level false-positive voxels were estimated with a Monte Carlo simulation (1000 iterations) with a false-positive rate of p < 0.05. In order to further investigate the implications of potential brain activation differences, we also conducted a post hoc region-of-interest (ROI) analysis with brain areas showing aberrant neural activation in REL and examined the relationship between neural activation during the encoding phase and behavioral performance in the three groups (see online Supplementary Materials for more details).
Results
A significant effect of the factor group on verbal IQ was observed [F (2,65) = 9.398, p < 0.001, η 2p = 0.224], with post hoc comparisons revealing a significant difference between SCZ and CON (p < 0.001). A subsequent correlation analysis showed that verbal IQ is not associated with behavioral performance in the visual WM task [r (66) = 0.180, p = 0.141] across groups.
Behavioral performance
In the visual WM task we observed significant main effects for the factors group [F (2,69) = 3.841, p = 0.026, η 2p = 0.100] and SOA [F (2,69) = 4.478, p = 0.013, η 2p = 0.061] on response accuracy with a significant linear trend for SOA [F (1,69) = 7.263, p = 0.009, η 2p = 0.095]. Post hoc comparisons revealed significant differences between SCZ and CON (p = 0.011) and between SCZ and REL (p = 0.041) as well as between SOA 100 and 800 (p = 0.009) and between SOA 100 and 400 (p = 0.023). With regard to reaction time, we found a significant main effect of SOA [F (2,69) = 3.897, p = 0.023, η 2p = 0.053] with a significant linear trend [F (2,69) = 7.335, p = 0.009, η 2p = 0.096]. Post hoc comparisons showed significant differences between SOA 100 and 800 (p = 0.009).
There were no significant interaction effects between group and SOA, but descriptive data inspection of mean accuracy values and reaction times indicated different SOA slopes in the CON/REL and SCZ groups (see Fig. 2). Group-specific exploratory analyses indicated that the linear effect of SOA on response accuracy is mainly driven by CON [F (1,24) = 4.032, p = 0.056, η 2p = 0.144] and REL [F (1,21) = 5.271, p = 0.032, η 2p = 0.201] and not by SCZ [F (1,24) = 0.242, p = 0.627, η 2p = 0.010].

Fig. 2. Behavioral performance in the visual working memory task. (a) Mean response accuracy across all trials and significant differences between groups. (b) Mean reaction time across all trials. (c) Mean response accuracy in SOA conditions. Statistically significant differences for graph c are not depicted but can be found in the text. SOA, stimulus onset asynchrony. *p < 0.05.
fMRI data
Brain activation differences between groups during encoding
SCZ showed widespread decreased neuronal activation during the encoding phase when compared with CON. In (pre)frontal brain regions, we observed the most expansive voxel clusters with decreased BOLD activity including DLPFC areas BA9 (MFG) and BA46 (IFG), as well as in BA6 [precentral gyrus (PrCG)] and BA8 [medial frontal gyrus (MeFG)]. Decreased activation was also observed in parietal, temporal, and occipital areas; the limbic system; and other brain regions (see Table 2 for a full list). The anterior cingulate (ACC; BA24/32) showed an increase in neuronal activation during encoding.
Table 2. Brain activation difference between groups during the encoding phase of the working memory task

SCZ, schizophrenia patients; REL, first-degree relatives of persons with schizophrenia; CON, healthy control subjects; R/L, right/left; BA, Brodmann area.
Note: p < 0.05, FDR corrected; cluster size >160 mm3 (approx. k = 6 contiguous functional voxels); Talairach coordinates, anatomical regions, and Brodmann areas refer to peak voxel of the cluster.
a No Brodmann area.
In REL, we observed decreased neuronal activation in MFG and MeFG (BA6) and increased activation in PrCG (BA6) and insula (BA13) compared with CON (see Fig. 3).

Fig. 3. Brain activation differences between groups during the encoding phase of the visual working memory task. (a) Comparison between SCZ and CON. (b) Comparison between REL and CON. (c) Group comparisons in the SOA 100 condition. (d) Group comparisons in the SOA 400 condition. (e) Group comparisons in the SOA 800 condition. For abbreviations of anatomical regions and further statistical information please see corresponding Table 2. Z values refer to axial pane/ventral–dorsal direction in Talairach coordinate space. R/L, right/left.
Brain activation differences between groups in SOA conditions during encoding
In the SOA 100 condition, SCZ showed decreased activation mainly in sub-lobar brain regions such as the Thalamus and Caudate, but also in the Cuneus (BA23) when compared with CON. In the SOA 400 condition, the cingulate gyrus (BA24/31), Cuneus (BA18), and Precuneus (BA7) showed lower activation, while in the SOA 800 condition the superior temporal gyrus (BA22), postcentral gyrus (BA4), and cingulate gyrus (BA6) were less activated. The ACC (BA24) showed increased activation in the SOA 800 condition (see online Supplementary Table S1 for a full list).
In REL, we observed only decreased activation in the SOA 100 condition, including the superior frontal gyrus (SFG; BA10) and fusiform gyrus (BA37). In the SOA 400 condition, REL showed decreased activation in the MFG (BA6) and increased activation in the SFG (BA9), while only increased neuronal activation was observed in the IFG (BA 9) in the SOA 800 condition (see Fig. 3).
Taken together, we observed mostly neuronal deactivation in SCZ in all SOA conditions. In REL, we observed decreased activity in SOA 100, decreased and increased activity in SOA 400 and only increased activity in SOA 800 compared with CON.
Post hoc ROI analysis: correlation with behavioral performance
No significant correlations between brain activation in selected ROIs (MFG, MeFG, PrCG, and insula) during encoding and response accuracy in the visual WM task were observed. Correlations coefficients did not differ between groups (see online Supplementary Table S2).
Discussion
In the present study, we demonstrate that both SCZ and REL show neurofunctional abnormalities during the encoding of visual stimuli into WM. We provide evidence that visual WM impairment in SCZ is accompanied by neuronal hypoactivation in a variety of brain areas, most prominently in (pre)frontal regions, and local hyperactivity in the ACC during the encoding phase. Contrary to our hypothesis, we did not find a deficit in WM performance in REL, but decreased (BA6) and increased (BA6/13) neuronal activation in WM-related areas during encoding. Furthermore, we observed an impairment of the WM consolidation process in SCZ, but not in REL; while the behavioral performance of CON and REL improves with the time available for item consolidation, the performance of SCZ does not. In REL, however, this consolidation-time-dependent behavioral improvement is associated with a shift from decreased (shortest time interval) to increased (longest time interval) activation in frontal brain regions.
Impaired WM performance and prevailing hypoactivation during the encoding phase in SCZ point toward an inability to engage the functional WM network with the concurrent increased recruitment of the ACC. The pattern of frontal hypoactivity and increased ACC activity has been meta-analytically described for n-back tasks (Glahn et al. Reference Glahn, Ragland, Abramoff, Barrett, Laird and Bearden2005) and can be considered as a robust expression of neuronal dysregulation in SCZ. In respect of the encoding phase, patterns of neuronal deactivation similar to those presented in this study have been shown for verbal WM (Johnson et al. Reference Johnson, Morris, Astur, Calhoun, Mathalon and Kiehl2006; Schlösser et al. Reference Schlösser, Koch, Wagner, Nenadic, Roebel and Schachtzabel2008). For visual WM, decreases in cortical functioning have been reported to a lesser extent in prior encoding centered research works, such as in the ventrolateral prefrontal cortex and IPL (Bittner et al. Reference Bittner, Linden, Roebroeck, Härtling, Rotarska-Jagiela and Maurer2015) and in the IFG and MFG, although accompanied by greater activation in the IPL (Anticevic et al. Reference Anticevic, Repovs and Barch2013).
The picture of an entire dysregulated network as observed in SCZ is not represented in REL in a corresponding manner; aberrant neural functioning is rather found in specific frontal cortical structures and the insula, whereas WM performance is not impaired. The presence of both decreased and increased neuronal activity in the premotor cortex and increased insula activity might reflect an imbalance in the deployment of neuronal resources: functioning of certain structures (MFG and MeFG) may be deficient and other regions (PrCG and insula) may play a compensating role to achieve the acquired operating level. Decreased MFG activity during spatial WM has been reported for biological relatives before (Keshavan et al. Reference Keshavan, Diwadkar, Spencer, Harenski, Luna and Sweeney2002) and is regarded as a consistent finding across WM studies using the n-back task, as pointed out by a meta-analysis (Zhang et al. Reference Zhang, Picchioni, Allen and Toulopoulou2016). The (to the best of our knowledge) only study investigating phase-specific brain changes in REL during spatial WM, not only found increased activation of the insula as well, although during the maintenance phase, but also reported greater MFG activation during retrieval of stimuli (Choi et al. Reference Choi, Park, Jung, Jang, Kang and Jung2012).
We observed neural hypoactivation of the MFG in both SCZ and REL, with strongest neural deactivation in the right anterior MFG (BA9) in SCZ and in the left posterior MFG (BA6) for REL. A linkage between abnormal MFG activity and the genetic liability of SCZ has not only been suggested by meta-analysis for WM (Zhang et al. Reference Zhang, Picchioni, Allen and Toulopoulou2016), but also for executive functioning (Goghari, Reference Goghari2011). WM and executive functioning have also been proposed as possible cognitive endophenotypes of SCZ, as they show relatively strong effect sizes in a meta-analysis on cognitive deficits in REL (Snitz et al. Reference Snitz, MacDonald and Carter2006). As both cognitive constructs seem to be related (McCabe et al. Reference McCabe, Roediger, McDaniel, Balota and Hambrick2010) and may be conceptualized in the same theoretical framework – in Baddeley's (Reference Baddeley2012) multicomponent model of WM executive functions are ascribed to the central executive component – neural dysfunction of the MFG might be mutually underlying deficits in both domains.
There is evidence that increased neuronal activation in the ACC (as observed in SCZ) and the insula (as observed in REL) may be an expression of a shared genetically modulated pathomechanism. A prior study (Kauppi et al. Reference Kauppi, Westlye, Tesli, Bettella, Brandt and Mattingsdal2015) examined the relationship between the polygenetic risk for SCZ and brain functioning during the n-back task: they reported an association between increased risk for SCZ and lower activation in the ACC and IFG/insula, but in group comparisons they found higher activation for SCZ in these areas. Hence, inferences on the relevance of these regions could hardly be drawn because of contradictory results. Interestingly, the above-mentioned phase-specific study (Choi et al. Reference Choi, Park, Jung, Jang, Kang and Jung2012) did also find greater ACC activation in REL as well as greater ACC and Insula activity in subjects at ultra-high risk for SCZ during maintenance, but also lesser ACC activation during encoding in SCZ. Eventually, it is possible that aberrant functioning of these regions represents an intermediate phenotype, but the exact role in the pathophysiology of the disease has to be further investigated.
Our behavioral results indicate SCZ form memory representations that are more fragile (i.e. prone to interruption) and transient and that WM consolidation does not improve when more time is available. This finding in part conforms to two previous studies (Fuller et al. Reference Fuller, Luck, McMahon and Gold2005, Reference Fuller, Luck, Braun, Robinson, McMahon and Gold2009) showing an impairment of this process, but differs in regard to the time independency we report. Prior findings suggest that WM consolidation is slowed/prolonged in SCZ so that patients need more time to form durable WM representations. In fact, one study (Fuller et al. Reference Fuller, Luck, Braun, Robinson, McMahon and Gold2009) demonstrated that SCZ show no masking effects with three visual items at an SOA of 800 ms but at 100 and 400 ms. Differentiating results may arise from heterogeneity between subject groups and stimuli material, with the named study including patients across the schizophrenic spectrum and making use of colored cubes as stimuli. Although we found no impairment of WM performance in REL, one might interpret the performance of REL, which is (descriptively) intermediate between SCZ and CON and follows a linear trend as in CON, as an indicator of a slightly prolonged consolidation process. This assumption remains speculative in respect of our behavioral findings, but the neuroimaging data might support this idea.
The shift from decreased to increased frontal activity over SOA conditions may reflect the successive adaption of compensatory neuronal processes under different memory-processing requirements in REL. With a very short time interval available for WM consolidation (SOA 100) and thus high processing demands, REL show neuronal hypoactivation and demonstrate slight reductions in performance. Processing demands at SOA 400 are more moderate and REL might be able to deploy additional frontal neuronal resources to stabilize WM processing, resulting in solid behavioral performance. With a long consolidation time interval (SOA 800) and light processing demands, REL could be able to fully compensate fundamental consolidation difficulties with increased frontal activity, so that behavioral WM performance remains unaffected. On the behavioral level and across SOA conditions, this could result in the overall picture of slowed WM consolidation in REL.
In the evaluation of our results, some limitations of this study should be noted. We did not identify specific risk gene variants (Tan et al. Reference Tan, Callicott and Weinberger2009; Lencz et al. Reference Lencz, Knowles, Davies, Guha, Liewald and Starr2014; Liu et al. Reference Liu, Malone, Vaidyanathan, Keller, Abecasis, McGue, Iacono and Vrieze2016) for SCZ due to limited sample size. Thus, conclusions about genetic underpinnings of WM impairments and associated neurofunctional abnormalities should be drawn with caution. Inferences on the pathomechanistic function of changes in brain activation are constrained by the cross-sectional study approach. All but one patient were being treated with antipsychotic medication and an influence on neurofunctional results cannot be ruled out entirely. An effect of medication on behavioral performance is considered unlikely, as SCZ showed similar reaction times as CON. Verbal IQ differed between SCZ and CON and although we found no association with visual WM performance, future studies are well advised to control for possible IQ effects, ideally with culture fair (non-verbal) intelligence measures. Applying a 3 s encoding phase predictor in our fMRI analysis was based on previous studies showing that neural activity associated with the encoding phase might extend into subsequent phases (Pessoa et al. Reference Pessoa, Gutierrez, Bandettini and Ungerleider2002; Postle et al. Reference Postle, Druzgal and D'Esposito2003) and that different task-phase predictors should be separated by at least 4 s (Zarahn et al. Reference Zarahn, Aguirre and D'Esposito1997). However, it might still be possible that our encoding predictor covered neural activity of early stimuli maintenance. A strength of this study is the first-time operationalization and measurement of the WM consolidation concept in REL, as well as phase-specific analysis approach and the diagnostic homogeneity of SCZ subjects.
In summary, we showed that the process of WM consolidation is impaired in SCZ and accompanied by widespread neuronal hypoactivation and increased ACC activity during the encoding phase. We observed no behavioral deficits in REL, but aberrant neuronal activation patterns during encoding are considered as an indicator of compensatory neuronal mechanisms to ensure WM functioning. Our findings support the notion of WM-related neuronal dysfunctions as a candidate endophenotype for SCZ and extend the evidence toward a more phase-specific and processual understanding of WM encoding.
Supplementary material
The supplementary material for this article can be found at https://doi.org/10.1017/S003329171800051X
Acknowledgements
We would like to thank Constanze Rickmeyer and Bianca Lienerth for help in data acquisition, and also David E. J. Linden, Jutta Mayer, and Armin Heinecke for helpful comments and methodical discussions. This research received no specific grant from any funding agency, commercial or not-for-profit sectors.
Declaration of interest
None.