


Introduction
Bipolar disorder has been described as a disease characterized by recurrent episodes of depressive, manic and mixed affective symptoms with intervening periods of remission (Kraepelin, Reference Kraepelin1921). However, in many individuals the course is less episodic and is characterized by protracted symptoms of varying degree (Judd et al. Reference Judd, Akiskal, Schettler, Endicott, Maser, Solomon, Leon, Rice and Keller2002, Reference Judd, Akiskal, Schettler, Coryell, Endicott, Maser, Solomon, Leon and Keller2003 a; Post et al. Reference Post, Denicoff, Leverich, Altshuler, Frye, Suppes, Rush, Keck, McElroy, Luckenbaugh, Pollio, Kupka and Nolen2003). Depressive symptoms in particular dominate the long-term course of bipolar disorder in a large proportion of individuals (Post et al. Reference Post, Denicoff, Leverich, Altshuler, Frye, Suppes, Rush, Keck, McElroy, Luckenbaugh, Pollio, Kupka and Nolen2003) and determine to a large extent the personal and societal cost of this disorder (Judd et al. Reference Judd, Akiskal, Schettler, Endicott, Leon, Solomon, Coryell, Maser and Keller2005). Other types of course variation, including length of episodes, frequency of cycling and polyphasic episodes, have also been described (Winokur & Kadrmas, Reference Winokur and Kadrmas1989; Maj et al. Reference Maj, Pirozzi, Magliano and Bartoli2002; Bauer et al. Reference Bauer, Beaulieu, Dunner, Lafer and Kupka2008; Solomon et al. Reference Solomon, Leon, Coryell, Endicott, Li, Fiedorowicz, Boyken and Keller2010). However, the individual variation in the course of episodic and long-lasting depressive and manic symptoms is not adequately reflected in current conceptualization and classification of bipolar disorder.
At present, bipolar disorder is classified into type I and type II, based on the peak lifetime severity of manic symptoms and related impairment. This distinction does not capture persistence of symptoms, quality of remissions and the relative burden of manic and depressive symptoms, which may all be important determinants of disability, treatment response, long-term prognosis and suicide risk (Judd et al. Reference Judd, Akiskal, Schettler, Endicott, Leon, Solomon, Coryell, Maser and Keller2005; Paykel et al. Reference Paykel, Abbott, Morriss, Hayhurst and Scott2006; Kupka et al. Reference Kupka, Altshuler, Nolen, Suppes, Luckenbaugh, Leverich, Frye, Keck, McElroy, Grunze and Post2007; Valtonen et al. Reference Valtonen, Suominen, Haukka, Mantere, Leppamaki, Arvilommi and Isometsa2008; Baldessarini et al. Reference Baldessarini, Salvatore, Khalsa, Gebre-Medhin, Imaz, Gonzalez-Pinto, Perez, Cruz, Maggini and Tohen2010; Mantere et al. Reference Mantere, Isometsä, Ketokivi, Kiviruusu, Suominen, Valtonen, Arvilommi and Leppamaki2010). The course specifiers ‘with rapid cycling’ and ‘with(out) full interepisode recovery’ allow coding of the extremes of episode frequency and the quality of recovery. However, there is no established classification for other aspects of clinical course, such as the relative frequency, duration and typical sequence of manic and depressive episodes, which may also be relevant for treatment selection and prognosis (Coryell et al. Reference Coryell, Andreasen, Endicott and Keller1987; Winokur & Kadrmas, Reference Winokur and Kadrmas1989; Turvey et al. Reference Turvey, Coryell, Arndt, Solomon, Leon, Endicott, Mueller, Keller and Akiskal1999; Maj et al. Reference Maj, Pirozzi, Magliano and Bartoli2002). Although these various aspects of clinical course have been described in terms of average values (Judd et al. Reference Judd, Akiskal, Schettler, Endicott, Maser, Solomon, Leon, Rice and Keller2002; Solomon et al. Reference Solomon, Leon, Coryell, Endicott, Li, Fiedorowicz, Boyken and Keller2010), it is not known whether certain aspects of clinical course tend to co-occur and constitute distinct types.
The aim of the present study was to investigate the potential for a typology of bipolar disorder based on individual variation in the recent clinical course in a prospective study of an unselected clinical sample (Mantere et al. Reference Mantere, Suominen, Leppamaki, Valtonen, Arvilommi and Isometsä2004, Reference Mantere, Suominen, Valtonen, Arvilommi, Leppamaki, Melartin and Isometsä2008). As the course of bipolar disorder often evolves over time and the degree of disability changes in concert with the symptom burden (Judd et al. Reference Judd, Akiskal, Schettler, Endicott, Leon, Solomon, Coryell, Maser and Keller2005; Baldessarini et al. Reference Baldessarini, Salvatore, Khalsa, Gebre-Medhin, Imaz, Gonzalez-Pinto, Perez, Cruz, Maggini and Tohen2010), an examination of recent clinical course over a medium-length follow-up period may provide a typology that is relevant to prognosis. We hypothesized that certain course characteristics may be connected and form relatively distinct types and that a longitudinal evaluation of recent clinical course may provide information that is distinct from commonly used subtypes (bipolar I and II). For this purpose, we carried out an analysis of individual differences in the clinical course in a representative clinical sample of individuals with bipolar disorder with detailed prospective follow-up (Mantere et al. Reference Mantere, Suominen, Leppamaki, Valtonen, Arvilommi and Isometsä2004, Reference Mantere, Suominen, Valtonen, Arvilommi, Leppamaki, Melartin and Isometsä2008). We first extracted relevant characteristics of the clinical course selected to capture the aspects of course reported in published literature and then applied latent class analysis (LCA) to derive an empirically based typology of recent clinical course.
Method
Sample
This study used a sample of individuals with bipolar disorder who were recruited and followed up as part of the Finnish Jorvi Bipolar Study (JoBS) (Mantere et al. Reference Mantere, Suominen, Leppamaki, Valtonen, Arvilommi and Isometsä2004, Reference Mantere, Suominen, Valtonen, Arvilommi, Leppamaki, Melartin and Isometsä2008; Arvilommi et al. Reference Arvilommi, Suominen, Mantere, Leppamaki, Valtonen and Isometsä2010). The JoBS aimed to recruit all individuals with bipolar disorder presenting to in- and out-patient psychiatric services in Espoo, which are comprehensively covering a socially diverse catchment area near Helsinki. The recruitment was carried out in two stages. In the first stage, 1630 individuals presenting to the psychiatric services in Espoo were screened with a version of the Mood Disorder Questionnaire (MDQ), adapted to be more sensitive for bipolar disorder type II (Isometsa et al. Reference Isometsä, Suominen, Mantere, Valtonen, Leppamaki, Pippingskold and Arvilommi2003). In the second stage, 490 individuals who screened positive on the MDQ were interviewed by an experienced psychiatrist using the Structured Clinical Interview for DSM-IV Disorders, Research Version, Patient Edition with Psychotic Screen (SCID-I/P; First et al. Reference First, Spitzer, Gibbon and Williams2002). The DSM-IV diagnosis of bipolar disorder was confirmed in 201 individuals, of whom 191 (95%) consented to participate in JoBS and be contacted for follow-up interviews.
Planned follow-ups were carried out 6 and 18 months after recruitment through face-to-face interviews with a psychiatrist. Data from interview and from in- and out-patient clinical records were integrated into graphic life charts (Mantere et al. Reference Mantere, Suominen, Valtonen, Arvilommi, Leppamaki, Melartin and Isometsä2008). Concurrent clinical records were available from any psychiatric or medical consultations or admissions within the catchment area and represent a prospective source of information that supplemented the retrospective interviews. The life charts record the onsets and offsets of DSM-IV manic, hypomanic, depressive and mixed episodes. Hypomanic phases with a minimum duration of 2 days and depressive mixed phases (three simultaneous intra-episode hypomanic symptoms present for at least 50% of the time during a major depressive episode) were also recorded (Benazzi, Reference Benazzi2001). Subsyndromal symptoms were recorded when a patient was not euthymic but did not fulfil the criteria of an episode. Each symptom level change was dated based on the combination of retrospective interview data and medical records, resulting in a dataset with a mood status recorded for each day of the follow-up. The follow-up data were collected from 176 (92%) participants.
Descriptors of clinical course
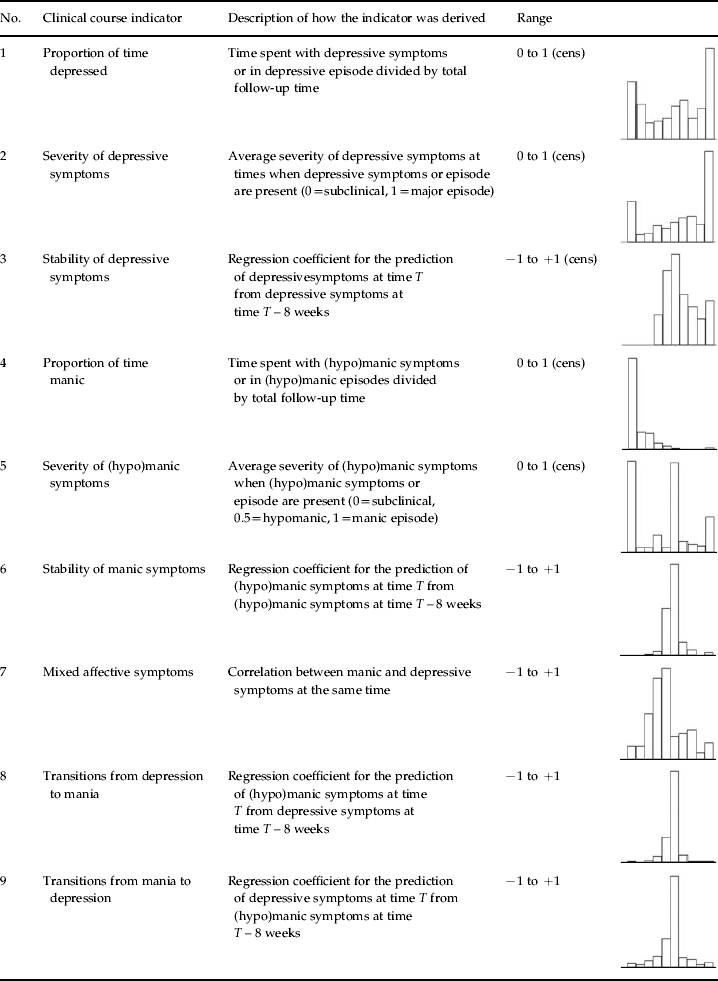
The information from the prospective life chart was coded into variables denoting the level of depression (0 = none, 1 = subsyndomal, 2 = minor, 3 = major) and mania (0 = none, 1 = subsyndomal, 2 = hypomania, 3 = mania) on each day of the follow-up. The large number of time points (mean 455 valid time points per individual, range 171–555) would make LCA on raw data unstable. It is recommended that to achieve a stable estimation in LCA, there should be at least 10 times as many individuals as variables. Therefore, based on a literature review (Angst, Reference Angst1978; Coryell et al. Reference Coryell, Andreasen, Endicott and Keller1987; Winokur & Kadrmas, Reference Winokur and Kadrmas1989; Maj et al. Reference Maj, Pirozzi, Formicola and Tortorella1999; Turvey et al. Reference Turvey, Coryell, Arndt, Solomon, Leon, Endicott, Mueller, Keller and Akiskal1999; Benazzi, Reference Benazzi2001; Maj et al. Reference Maj, Pirozzi, Magliano and Bartoli2002; Judd et al. Reference Judd, Akiskal, Schettler, Endicott, Maser, Solomon, Leon, Rice and Keller2002; Post et al. Reference Post, Denicoff, Leverich, Altshuler, Frye, Suppes, Rush, Keck, McElroy, Luckenbaugh, Pollio, Kupka and Nolen2003; Baldessarini et al. Reference Baldessarini, Salvatore, Khalsa, Gebre-Medhin, Imaz, Gonzalez-Pinto, Perez, Cruz, Maggini and Tohen2010; Solomon et al. Reference Solomon, Leon, Coryell, Endicott, Li, Fiedorowicz, Boyken and Keller2010) we extracted nine features that capture the salient characteristics of clinical course for each individual (Table 1). A time lag of 8 weeks for stability and transition indicators was chosen based on correlation analysis of different time lags because it was sufficiently distinct from concurrent correlations, correlated with time lags ranging from 2 to 26 weeks, approximated the median length of an affective episode, and there were sufficient number of data points for such analysis within the follow-up period.
Table 1. The course indicators. Indicators declared as censored variables in model fitting are marked by ‘(cens)’ under the value range. The distribution of each variable is shown in the last column
Statistical procedures and model fitting
The nine course variables described in Table 1 were used as indicators in LCA of 176 individuals. LCA seeks to maximize the description of covariance in a dataset through separating individuals into groups (classes) with distinct profiles of the indicator variables. LCA models with 1–10 classes were fitted in Mplus, version 6 (Muthén & Muthén, Reference Muthén and Muthén2011), using maximum likelihood estimation. Depending on the distribution, indicator variables were declared as either continuous or censored. To avoid local maxima, we used at least 100 000 sets of random starting values and only accepted a model if the best likelihood replicated. A crucial step in LCA is to decide how many classes are needed to describe a dataset. We used two criteria to select the model with the optimal number of classes: the first, the Bayesian Information Criterion (BIC), reflects how well the model explains the variation in the dataset given the number of estimated parameters to find an optimal balance between simple and complex models. Smaller BIC means a better-fitting model (Raftery, Reference Raftery1995). Second, we used the bootstrapped likelihood ratio test (BLRT) to estimate whether a model with N classes provides a significantly better description of the dataset compared to a model with N – 1 classes. A non-significant BLRT (p > 0.05) means that a model with one less class is preferred (Nylund et al. Reference Nylund, Asparouhov and Muthen2007).
Results
Model fitting
To derive a typology of clinical course empirically, we fitted LCA models with 1–10 classes in an attempt to parsimoniously describe the dataset including nine course indicators in 176 individuals with bipolar disorder (Table 2). As the number of classes increased, the ability of the model to explain the relationship between covariates improved at the expense of estimating a larger number of parameters. The BIC and BLRT were in agreement and both favoured the model with nine latent classes (Table 2). The nine-class model had the lowest BIC, indicating an optimal balance between complexity and parsimony. The BLRT indicated that addition of each class up to nine significantly improved the model fit (all p < 0.05), but the addition of the tenth class no longer improved the model (p = 0.42). Entropy was very high, suggesting a good quality of classification, with each individual clearly belonging to one class (probability of class membership >0.90). The larger classes tended to remain constant across models: for example, a class of 56 individuals separated in the model with two classes and remained constant for models with up to 10 classes. The three most common classes changed little across models with 4–9 classes. Models with more classes separated small groups of individuals with an unusual clinical course. As the decision about the best-fitting model was unambiguous and the larger classes were relatively stable across models, we only interpreted the best-fitting model with nine latent classes.
Table 2. Model fitting: fit parameters for models with 1–10 classes

BIC, Bayesian Information Criterion; BLRT, bootstrapped likelihood ratio test.
The best-fitting model with nine classes is shown in bold.
Typology of course based on the best-fitting model
The best-fitting model suggests that the majority of individuals with bipolar disorder follow a clinical course that can be classified into two common types: episodic bipolar (47%) and depressive type (32%). Two intermediate classes group individuals with extended hypomanias (10%) and mixed symptoms (5%). The remaining five classes separate small groups of individuals with a relatively unusual clinical course. The class profiles are shown in Fig. 1: Fig. 1a shows the four commoner classes and Fig. 1b shows the five small classes. Figure 2 gives examples of individual trajectories characteristic of each of the four commoner classes.

Fig. 1. Course profiles according to the best-fitting model showing: (a) the four larger classes (common course classes) and (b) the five small classes (uncommon course classes).

Fig. 2. Examples of individual trajectories of clinical course. Each graph represents a single individual. Manic symptoms/episodes are plotted above the horizontal line. Depressive symptoms/episodes are plotted below the horizontal line.
Episodic bipolar type
Nearly half of the individuals were included in class 1, with a typical episodic course of depressive and manic episodes alternating with euthymia. They spent on average half of the follow-up (52% time) in depressive episodes and less than one-tenth (9% time) in (hypo)manic episodes. The low stability of both types of symptoms reflects the fact that neither depressive nor manic episodes were long-lasting.
Depressive type
Nearly one-third of individuals experienced no manic or hypomanic episodes and spent on average two-thirds of the follow-up (63% time) in protracted depressive episodes or with chronic depressive symptoms.
Extended hypomanias
One-tenth of individuals belonged to the third class, characterized by a higher stability and lower severity of (hypo)manic symptoms. Although their hypomanias tended to be prolonged, they still spent more time with depressive symptoms (53%) than with (hypo)manic symptoms (12%).
Mixed episodes
A fourth class grouped about 5% of individuals whose clinical course was characterized by extended episodes of mixed depressive and manic symptoms in addition to depressive episodes and occasional brief hypomanias. They also spent more time with depressive symptoms (57% time) than with manic symptoms (21% of time, including mixed episodes).
Uncommon course classes
The remaining five small classes grouped individuals with relatively uncommon types of clinical course including ‘depression-to-mania switches’ with either extended (class 6) or brief (class 7) (hypo)manic episodes, ‘chronic mixed symptoms’ (class 8) and ‘long depressive and manic episodes’ with no intervening euthymia (class 9).
Relationship of latent types to clinical descriptive variables
Because classes 5–9 were too small to enable a meaningful comparison, we concentrated on the description of clinical characteristics in the four more common course classes. For each characteristic, we first compared the two large classes and then carried out an omnibus test of differences between the four classes (Table 3).
Table 3. Clinical characteristics of course classes (the four more common classes are described)

s.d., Standard deviation.
Anxiety disorders and alcohol substance abuse/dependence are lifetime co-morbid diagnoses. Statistics and p values are shown first for the comparison of the two most common classes (1 degree of freedom) and second for the comparison of the four classes (three degrees of freedom), based on the general linear model for the continuous variable and χ2 tests for categorical variables. Age of onset is the retrospectively reported age at the start of the first affective episode (depressive, hypomanic or manic). Mood stabilizers include lithium, anticonvulsants and atypical antipsychotics. A significant p value (<0.05) is highlighted in bold.
The classes defined based on the clinical course of bipolar disorder over the follow-up period did not differ in age and sex composition or in age at onset of first mood episode. The empirically derived course typology was not strongly related to the subtypes of bipolar disorder established at baseline: the rates of bipolar II disorder were highest in class 3 (65%) but the differences between classes were not statistically significant (p > 0.05, Table 3). A history of rapid cycling also did not significantly predict class membership.
The episodic bipolar course class had a significantly higher rate of lifetime co-morbidity with alcohol and substance use disorders than the depressive-type class (χ21 = 7.34, p = 0.0067) or than all other classes combined (χ21 = 6.67, p = 0.0098). Lifetime co-morbidity with anxiety disorders did not differ across the classes (Table 3).
Treatment with mood stabilizers, antidepressants or a combination did not significantly predict class membership (Table 3).
Discussion
The analysis of the individual variation in clinical course over a medium-term follow-up in an unselected clinical sample highlights a principal distinction between episodic bipolar and depressive types of clinical course. Approximately half of those diagnosed with bipolar disorder followed the commonly described ‘bipolar’ course, which includes episodes of depression and mania, whereas one-third spent a high proportion of time with depressive symptoms and episodes with no manic or mixed symptoms. Less common types of clinical course included prolonged and less severe hypomanias and mixed episodes.
This analysis of recent course suggests a typology that is not captured by the bipolar I versus bipolar II division or the rapid cycling specifier. Indeed, the predictive validity of a diagnosis of bipolar I or bipolar II is relatively weak, with no differences in the total number of episodes or duration of specific episodes, and contradictory results on the proportion of time in mood episodes (Judd et al. Reference Judd, Schettler, Akiskal, Maser, Coryell, Solomon, Endicott and Keller2003b; Mantere et al. Reference Mantere, Suominen, Valtonen, Arvilommi, Leppamaki, Melartin and Isometsä2008; Tondo et al. Reference Tondo, Lepri and Baldessarini2008). The stability and prospective validity of the course specifier ‘with rapid cycling’ is acceptable, but does not capture many aspects of clinical course that are relevant to prognosis and treatment response (Dunner, Reference Dunner1998; Bauer et al. Reference Bauer, Beaulieu, Dunner, Lafer and Kupka2008).
Although the typology derived here is relatively independent of the bipolar I versus II distinction, it maps well on the typology of course proposed previously by Angst (Reference Angst1978), based on a long-term follow-up. Like Angst (Reference Angst1978), we have also found large groups of primarily bipolar and primarily depressive course. By contrast, we find that a predominantly manic course is relatively rare and not sufficiently distinct from the episodic course and we do not confirm the relationship between depressive type of course and female sex.
Unlike the bipolar I versus II distinction and rapid cycling, our proposed typology of recent course is not related to gender and anxiety disorders co-morbidity. It is, however, relatively strongly associated with lifetime co-morbidity with alcohol and substance use disorders, which is much more common in those with bipolar episodic course than in those following the depressive-type clinical course. This replicates previously reported associations between alcohol/substance abuse and a more unstable and episodic course of bipolar disorder and the associations between alcohol use and manic symptoms (Feinman & Dunner, Reference Feinman and Dunner1996; Dunner, Reference Dunner1998; Merikangas et al. Reference Merikangas, Herrell, Swendsen, Rössler, Ajdacic-Gross and Angst2008). The proposed typology of course is not associated with the use of antidepressants and/or mood stabilizers and is therefore more likely to reflect a natural propensity rather than being an artefact of treatment.
Depressive symptoms dominate all common course classes. This is consistent with previous findings showing a high burden of depressive symptomatology for a large proportion of bipolar patients (Joffe et al. Reference Joffe, MacQueen, Marriott, Robb, Begin and Young2002; Judd et al. Reference Judd, Akiskal, Schettler, Endicott, Maser, Solomon, Leon, Rice and Keller2002, Reference Judd, Akiskal, Schettler, Coryell, Endicott, Maser, Solomon, Leon and Keller2003a; Post et al. Reference Post, Denicoff, Leverich, Altshuler, Frye, Suppes, Rush, Keck, McElroy, Luckenbaugh, Pollio, Kupka and Nolen2003; Mantere et al. Reference Mantere, Suominen, Valtonen, Arvilommi, Leppamaki, Melartin and Isometsä2008). Some other previously described patterns of course, such as typical sequences of manic and depressive phases (Maj et al. Reference Maj, Pirozzi, Magliano and Bartoli2002), were rare in our sample.
A novel aspect of the present study is the combination of life charts with latent variable modelling to derive typology for the course of bipolar disorder. One previous study used a graphic classification of life charts that were sorted by experienced clinicians into 12 possible course types derived on theoretical grounds (Post et al. Reference Post, Denicoff, Leverich, Altshuler, Frye, Suppes, Rush, Keck, McElroy, Luckenbaugh, Pollio, Kupka and Nolen2003). The advantage of the present approach is in the increased objectivity inherent in the method we used to determine the number of classes and classify subjects. Similar methods have been used to classify the types of individual affective episodes (Solomon et al. Reference Solomon, Leon, Endicott, Coryell, Li, Fiedorowicz and Keller2009) and the fine-grained course of daily subclinical symptoms between episodes (Bonsall et al. Reference Bonsall, Wallace-Hadrill, Geddes, Goodwin and Holmes2012). Future studies may combine these approaches to help understand the relationship between long-term course and short-term patterns of mood reactivity (Holmes et al. Reference Holmes, Deeprose, Fairburn, Wallace-Hadrill, Bonsall, Geddes and Goodwin2011; Pavlova et al. Reference Pavlova, Uher, Dennington, Wright and Donaldson2011).
The results presented here should be interpreted with respect to several limitations. First, the number of patients included is moderate. For this reason, we limit the interpretation to those classes that seem relatively common. Extension of this method to a larger sample may help to establish the robustness of the typology reported here, and determine whether the less common classes detected here also represent a ‘type’ or whether other less common yet distinctive types of course should be considered. Second, even though the study had a prospective longitudinal design, the course between assessments was reconstructed retrospectively based on the combination of interview and clinical records. This leaves a potential for recall bias, especially for symptoms of less severity that did not come to clinical attention and for which there are no contemporary clinical records. Therefore, the role of milder and subsyndromal symptoms in the proposed typology of course should be interpreted with caution. Third, although the recruitment was systematic, the patients were recruited at presentation to clinical services and therefore were symptomatic at the time of recruitment. This means that our results may generalize to clinical rather than population-based samples. The longitudinal course of bipolar disorder may differ by stage of illness. Therefore, we may be classifying a stage of illness rather than an enduring type. However, a typology based on such medium-term follow-up is more directly applicable in clinical practice, where only the most recent course can typically be established with reasonable accuracy and often guides clinical decisions, and it may be more relevant to medium-term prognosis and outcomes (Judd et al. Reference Judd, Akiskal, Schettler, Endicott, Leon, Solomon, Coryell, Maser and Keller2005; Baldessarini et al. Reference Baldessarini, Salvatore, Khalsa, Gebre-Medhin, Imaz, Gonzalez-Pinto, Perez, Cruz, Maggini and Tohen2010). The relationship between medium-term and long-term characteristics of clinical course is an important target for future work.
In conclusion, we have introduced a method to analyse prospective life charts to propose a typology of the recent clinical course of bipolar disorder. The typology primarily distinguishes bipolar episodic and depressive types of clinical course. This typology awaits replication, prospective validation and extension to a longer time scale.
Acknowledgements
This study was supported by the Helsinki University Central Hospital. Dr Uher is supported by the Canada Research Chairs Program (www.chairs-chaires.gc.ca/).
Declaration of Interest
None.


