


Introduction
Many different personality measurements reflect the structure of negative affects (NAs) including trait anxiety, neuroticism, general maladjustment, and repression sensitization (Watson & Clark, Reference Watson and Clark1984). In a series of studies, Clark et al. showed that two emotional experiences, anxiety and depression, might differ with regard to their presentation modes among individuals under pressure but are both influenced by underlying NA together (Clark & Watson, Reference Clark and Watson1991; Watson & Clark, Reference Watson and Clark1984; Watson & Walker, Reference Watson and Walker1996). Researchers also indicated the importance of attending to the NA common to many emotional experiences (Tackett, Waldman, Van Hulle, & Lahey, Reference Tackett, Waldman, Van Hulle and Lahey2011); they might be even more important than their specific types (Andrews, Reference Andrews and Rapee1996) because they help to reveal the common potential influencing factors associated with emotional experiences or emotional disorders and help explain the comorbidity patterns of multiple emotional disorders.
NA has the trait and state features. These features have different functions in physiological and mental health. Individuals with high NA across different situations are more likely to report discomfort, even when the current situation does not have an obvious source of stress (Watson & Clark, Reference Watson and Clark1984). In addition, NA significantly affects the experience of pressure (Kong, Zhao, & You, Reference Kong, Zhao and You2012), health concerns, and the cognitive processing of unpleasant experiences (Jeronimus, Riese, Sanderman, & Ormel, Reference Jeronimus, Riese, Sanderman and Ormel2014). The state feature usually refers to the temporary discomfort caused by uncertain events (negative stimulation or physiological situations) (Polk, Cohen, Doyle, Skoner, & Kirschbaum, Reference Polk, Cohen, Doyle, Skoner and Kirschbaum2005; Rutherford, MacLeod, & Campbell, Reference Rutherford, MacLeod and Campbell2004) and is the result of the interaction between many factors (specific feelings, physiological reactions, physical movements, ways of thinking, and experiences stored in memory) and the external environment (Berkowitz, Reference Berkowitz and Huesmann1994; Russell, Reference Russell1980; Tepper, Duffy, Henle, & Lambert, Reference Tepper, Duffy, Henle and Lambert2006). Its major feature is that related NA experiences adapt with a change in the external environment and the internal physiological conditions of the individual, although these changes fluctuate around the baseline (i.e. trait) level (Mehra & Sah, Reference Mehra and Sah2002; Zelenski & Larsen, Reference Zelenski and Larsen2000). The current study sought to deepen the understanding of the potential influences of NA with regard to physiological and mental health based on the neural bases of state and trait NA as revealed by graph theory.
NA and related emotional disorders likely involve interactions among critical brain networks such as the fronto-parietal task control network (i.e. dorsolateral prefrontal cortex; right orbital and middle frontal gyrus), the default mode network (DMN) (i.e. medial prefrontal cortex, mPFC; anterior cingulate cortex, ACC), the dorsal/ventral attention network and subcortical structures. Individuals with high NA and/or related emotional disorders have weaker top-down (primarily from the frontal cortex to the limbic system/dorsal attention network) regulatory functions but stronger bottom-up driving functions (Pessoa, Reference Pessoa2017; Savitz & Drevets, Reference Savitz and Drevets2009). For example, the mPFC and the ACC connect up to the frontal cortex, parietal cortex, and sensorimotor area and down to limbic system structures and regions of ventral attention network (Pessoa, Reference Pessoa2008, Reference Pessoa2017), and they are involved in the appraisal and expression of negative emotion and the attention reorienting (Etkin, Egner, & Kalisch, Reference Etkin, Egner and Kalisch2011; Kaiser et al., Reference Kaiser, Andrews-Hanna, Spielberg, Warren, Sutton, Miller and Banich2015b; Kaiser, Andrews-Hanna, Wager, & Pizzagalli, Reference Kaiser, Andrews-Hanna, Wager and Pizzagalli2015a). Studies of related emotional disorders have usually reported abnormal functional connectivity (FC) in these networks (Drevets, Price, & Furey, Reference Drevets, Price and Furey2008; Etkin & Wager, Reference Etkin and Wager2007; Pizzagalli, Reference Pizzagalli2011). Furthermore, the deregulation of frontoparietal functions can result in an excessively active, which produces uncontrolled negative emotions (Davidson, Reference Davidson2002). Abnormal FC presents with related emotional disorders and is considered as an important neural mechanism of pathological emotional affective disorders (Koenigs & Grafman, Reference Koenigs and Grafman2009).
Importantly, resting-state functional magnetic resonance imaging (fMRI) exhibits a rich source of information regarding the spontaneous (or intrinsic) activity of the brain (Buckner, Andrews-Hanna, & Schacter, Reference Buckner, Andrews-Hanna and Schacter2008; Raichle, Reference Raichle2015) and its inner relationships with personality features (Scalabrini et al., Reference Scalabrini, Huang, Mucci, Perrucci, Ferretti, Fossati and Ebisch2017), subjectivity (Scalabrini et al., Reference Scalabrini, Huang, Mucci, Perrucci, Ferretti, Fossati and Ebisch2017), self (Northoff et al., Reference Northoff, Heinzel, De Greck, Bermpohl, Dobrowolny and Panksepp2006; Northoff & Bermpohl, Reference Northoff and Bermpohl2004), and task-evoked activity (Scalabrini, Mucci, & Northoff, Reference Scalabrini, Mucci and Northoff2018; Viola et al., Reference Viola, Galina, Johan, Micha?, J?rg, Linda and Tobias2018). For instance, the correlation between spontaneous activity and neural activity of anticipating the animate target in anterior insula was mediated by individual personality features (Scalabrini et al., Reference Scalabrini, Huang, Mucci, Perrucci, Ferretti, Fossati and Ebisch2017). Moreover, the findings of revealing the correlations between disturbed resting-state activity and NA (Cui et al., Reference Cui, Zhang, Liu, Li, Li, Zhang and Li2016; Disner, Marquardt, Mueller, Burton, & Sponheim, Reference Disner, Marquardt, Mueller, Burton and Sponheim2018; Northoff, Reference Northoff2016) may bear important implications for understanding various emotional experiences. Specifically, the resting-state FC mode has both trait and state features. Although this mode largely remains stable (Cole, Bassett, Power, Braver, & Petersen, Reference Cole, Bassett, Power, Braver and Petersen2014; Tavor et al., Reference Tavor, Jones, Mars, Smith, Behrens and Jbabdi2016), it also undergoes a certain degree of adjustment as the individual's state changes (Laumann et al., Reference Laumann, Gordon, Adeyemo, Snyder, Joo, Chen and Dosenbach2015; Yeo, Tandi, & Chee, Reference Yeo, Tandi and Chee2015), which reflects the variability of the resting-state. The variability of resting-state FC has attracted great attention due to its close relationship with various behaviors (Baldassarre et al., Reference Baldassarre, Lewis, Committeri, Snyder, Romani and Corbetta2012; Douw, Wakeman, Tanaka, Liu, & Stufflebeam, Reference Douw, Wakeman, Tanaka, Liu and Stufflebeam2016; Sun et al., Reference Sun, Liu, Rolls, Chen, Yao, Yang and Feng2019) and in serving as a sensitive biomarker for a number of mental disorders (Liu et al., Reference Liu, Wang, Li, Wang, Li, Zhang and Chen2017a; Magioncalda et al., Reference Magioncalda, Martino, Conio, Escelsior, Piaggio, Presta and Vassallo2015; Yu et al., Reference Yu, Erhardt, Sui, Du, He, Hjelm and Pearlson2015; Zhang et al., Reference Zhang, Cheng, Liu, Zhang, Lei, Yao and Lu2016). However, studies on the relationship between state-trait NA and the variability of resting-state FC are rare.
In the current study, we hypothesize that resting-state FC with different variability will correspond to NA with different characteristics. In other words, trait NA should correspond to relatively stable (low-variability) resting-state FC, whereas state NA should be associated with relatively variable (high-variability) FC. The purpose of this study was to use FC with different variability characteristics to predict the trait and state NA levels of individuals. First, the principal component score (PCS) of NA was obtained by a principal component analysis. The Pearson correlation between the resting-state FCs and the PSC was calculated in sample 1 (n = 367). The identified NA-related FCs were validated through an independent sample (n = 232; sample 2). Next, a community detection algorithm was applied to calculate FC variability. According to the median of the FC variability at the group level, the NA-related FCs were divided into high- and low-variability groups. Finally, FCs in different variability groups were separately applied to predict individuals' neuroticism level (which is assumed to be the core trait-related factor underlying NA), and the change of NA level (which represents the state-related fluctuation of NA).
Methods
Data collection
The Southwest University Longitudinal Multimodal Imaging (SLMI) Data Repository (Liu et al., Reference Liu, Wei, Chen, Yang, Meng, Wu and Qiu2017c) provided the data for this study. The SLMI was divided into three time points to longitudinally track the participants (the average time interval of the whole process was 515 days). Magnetic resonance imaging (MRI) multimodal brain imaging data were collected at all time points. In addition, various demographic, statistical, and physiological variables were collected at all time points.
The behavioral data were collected within 1–2 weeks of the MRI data acquisition. The NA-related measurements included were the State-Trait Anxiety Inventory (STAI), the Beck Depression Inventory (BDI-II) (Beck, Steer, & Brown, Reference Beck, Steer, Ball and Ranieri1996); the Positive Affect and Negative Affect Schedule (PANAS) (Watson, Clark, & Tellegen, Reference Watson, Clark and Tellegen1988), and the Perceived Stress Scales (CPSS) (Yang & Huang, Reference Yang and Huang2003). The STAI includes two subscales: the State Anxiety Inventory (SAI) and the Trait Anxiety Inventory (TAI). The Negative Affect Score (NAS) in the PANAS was included in the subsequent calculation. All subjects who completed the five questionnaires were divided into two samples. Sample 1 consisted of 385 subjects who completed five questionnaires at any one time point. Sample 2, a total of 236 people (118 × 2), completed the five questionnaires at the 1st and 3rd time points.
Furthermore, the personality trait of neuroticism is closely related to negative emotionality (Jeronimus et al., Reference Jeronimus, Riese, Sanderman and Ormel2014; Jeronimus, Kotov, Riese, & Ormel, Reference Jeronimus, Kotov, Riese and Ormel2016; Markon, Krueger, & Watson, Reference Markon, Krueger and Watson2005). These two have a stable relationship; the former is usually considered as an effective prediction factor for the latter (Jeronimus, Ormel, Aleman, Penninx, & Riese, Reference Jeronimus, Ormel, Aleman, Penninx and Riese2013). Trait neuroticism can be understood as ‘the sensitivity and activity of the negative affect system’ (Henriques, Reference Henriques2011). Our study used neuroticism as a representative indicator of trait NA. Neuroticism was measured using the Revised Neuroticism Extraversion Openness Personality Inventory (NEO-PI-R) (Costa & McCrae, Reference Costa and McCrae1992).
The resting-state functional MRI imaging data were collected using a Siemens scanner (3.0-T Siemens Trio MRI) at the Brain Imaging Center of Southwest University, China. The resting-state scan used a gradient-echo EPI sequence to continuously collect 242 whole-brain resting-state 3D images within 8 min. The scanning parameters were as follows: repetition time (TR) = 2000 ms, echo time (TE) = 30 ms, flip angle (FA) = 9°, matrix = 64 × 64, field of vision (FOV) = 192 × 192 mm2, slice = 32, thickness = 3 mm, distance between slice = 1 mm, and voxel size = 3.4 × 3.4 × 4 mm3. After the resting-state data were collected, 3D structural imaging was performed using the magnetization-prepared rapid acquisition gradient echo (MPRAGE) sequence. The scanning parameters were as follows: TR = 1900 ms, TE = 2.52 ms, inversion time (TI) = 900 ms, FA = 9°, slice = 176, thickness = 1 mm, FOV = 256 × 256 mm2, matrix = 256 × 256, and voxel size = 1 × 1 × 1 mm3.
Data preprocessing
(1) To ensure signal stability, the first 10 time points in the time sequence were deleted. (2) The remaining 232 time-points were subject to a slice-timing correction. In addition, head motion realignment was performed based on the displacement of the adjacent EPI data. (3) The EPI template (Ashburner & Friston, Reference Ashburner and Friston1999) was used to map the data from the original space to the Montreal Neurological Institute (MNI) space with a voxel size of 3 × 3 × 3 mm3. (4) The global signals, cerebrospinal fluid (CSF) signals, white matter signals, and 24 head motion parameters were used as covariates in the regression (Friston, Williams, Howard, Frackowiak, & Turner, Reference Friston, Williams, Howard, Frackowiak and Turner1996). (5) Waves (0.01–0.1 Hz) were filtered to remove the low-frequency signal drift and high-frequency physiological noise. (6) A 4-mm kernel was used for smoothing. EPI data with framewise-dependent (FD) values exceeding 0.5 (together with the data at the previous time point and the next two time points) were removed (Power et al., Reference Power, Mitra, Laumann, Snyder, Schlaggar and Petersen2014). If more than 10% of the EPI data of one participant were excluded, then he or she was no longer included in the subsequent analysis. Based on this standard, sample 1 remained 367 subjects, and sample 2 remained 232 subjects. The above processing steps were competed using the DPABI toolbox (http://rfmri.org/dpabi).
Construction of the resting-state FC matrix
(1) The Power-264 template defined based on the meta-analysis of task-based fMRI studies and resting-state fMRI data was selected (Power et al., Reference Power, Cohen, Nelson, Wig, Barnes, Church and Schlaggar2011). This template provides near whole-brain coverage with greater specificity than most atlases and accurately divides nodes into communities to enable us to investigate canonical functional networks. Moreover, the homogeneity of the nodes is superior to most parcellations (Gordon et al., Reference Gordon, Laumann, Adeyemo, Huckins, Kelley and Petersen2016) and they do not share physical boundaries, which will not overestimate the local connectivity of regions. Furthermore, this template has been widely used in FC studies (Cole, Ito, Bassett, & Schultz, Reference Cole, Ito, Bassett and Schultz2016; Doré et al., Reference Doré, Scholz, Baek, Garcia, O'Donnell, Bassett and Falk2019; Yang et al., Reference Yang, Gu, Honnorat, Linn, Shinohara, Aselcioglu and Satterthwaite2018), and there is evidence to suggest that this template yields superior predictive features that are strongly related to behavioral measures (Plitt, Barnes, & Martin, Reference Plitt, Barnes and Martin2015), thus this approach may be well suited for predicting. Therefore, considering the above advantages and our research aim of predicting NA using resting-state FC, we selected the Power-264 template. (2) The average blood oxygenation level-dependent (BOLD) time sequence was extracted from 264 cortical and subcortical brain regions (nodes). (3) Four cerebellum nodes, 11 nodes with a signal-to-noise ratio smaller than 100 (primarily including regions in the orbitofrontal cortex, temporal pole, and inferior temporal gyrus), and 21 nodes with unclear attributions in the brain network were excluded. Finally, 228 nodes were included as regions of interest (ROIs). (4) The Pearson's correlation coefficients between any two ROI time sequences were calculated, and the values were converted into z-scores using Fisher's r-to-z transformation to define the strength of the FC among ROIs and ultimately construct the 228 × 228 resting-state FC matrix.
Data analysis
Identification of NA-related FCs
Principal component analysis. All subjects in samples 1 and 2 who completed the five NA measures (TAI, SAI, BDI, NAS, and CPSS) were included in the principal component analysis (the scores of the same participant at different time points were viewed as independent data points). The Kaiser-Meyer-Olkin (KMO) and Bartlett's sphericity test were used to examine whether the above data were suitable for principal component analysis. Specifically, we generated 1000 of 5 (measure) × 621 (subjects) random data matrices and calculated the average eigenvalue. Then the principal components were extracted according to the principle that the eigenvalue of real data should be greater than that of random data, and the corresponding factor score was multiplied by the square root of the variance to obtain the standardized principal component score of negative affect (NA-PCS).
FC-based correlation analysis. The following analysis steps were performed: (1) identify the FC related to NA: the Pearson correlation between the resting-state FC matrices and the NA-PCS was calculated across all individuals in sample 1, with age, sex being regressed out. (2) Feature selection: edges of a significance threshold at p < 0.05 were selected as input features. (3) Model fitting: to enhance the robustness of our conclusions, kernel ridge regression (KRR) algorithms combined with a five-fold cross-validation procedure were adopted to prediction analysis. Kernel method is a classical machine learning approach and minimizes the estimation error in the training data and model complexity. The KRR has received considerable attention among kernel-based methods due to its non-iterative approach of learning ability and efficient way for predicting behavioral phenotypes in individuals using resting-state fMRI (He et al., Reference He, Kong, Holmes, Nguyen, Sabuncu, Eickhoff and Yeo2020; Kong et al., Reference Kong, Li, Orban, Sabuncu, Liu, Schaefer and Yeo2018). In this step, the KRR assumes a linear relationship between the selected edges (independent variable) and the NA-PCS values (the dependent variable) in a training set (80% of the sample). In each five-fold cross-validation, 80% of the sample was used for training and 20% for testing. (4) Evaluation of the predictive model: after predicting the NA-PCS values for all subjects in the testing set, statistical significance for the correlation between predicted and observed values were assessed using permutation testing (1000 iterations). Furthermore, to cross-validate the findings from sample 1, we masked the individual connectivity matrices with edges selected in step 2 among an independent set (sample 2), and then we repeated steps 3 and 4.
Calculation of the resting-state FC variability
In sample 2, the participants with NEO-PI-R were included in the analysis of calculating variability and predicting trait and state NA. A total of 184 people (92 × 2) provided excellent imaging data. To detect the variability of the resting-state FC, we first applied the community detection algorithm for each participant's resting-state FC matrix at different time points to generate the node-affiliation matrix. In this matrix, if two nodes belong to the same network, their edge assignment is 1; otherwise, 0. Then, on this basis, the variability matrix (VM) is generated by examining how possible each link changes its network affiliation among the node-affiliation matrices at different scanning time points. Because this study only focused on the variability of specific connections under the general level, the mean of the variability matrices of all participants was obtained to generate the VM at the group level to determine whether the connection relationship was relatively stable or variable. The specific procedures were as follows: (1) the network structure of resting-state FC was detected using the multilayer Louvain community detection algorithm (Mucha, Richardson, Macon, Porter, & Onnela, Reference Mucha, Richardson, Macon, Porter and Onnela2010). Briefly, this algorithm performs repetitive iterations of the community structure until the maximum modularity (Q) is obtained. Gamma (γ) and omega (ω) are two important parameters. Respectively, they define the expected community size (larger values denote more communities and more scattered nodes) and the connectivity strength of the same node at different levels (i.e. time points; higher values denote stronger connectivity between levels). The formula of this algorithm was as follows:
(Formula 1)

In the above formula, i and j indicate different nodes in the FC matrix; 1 and r indicate different layers (time points); Aij indicated the FC matrix; Pijlr indicates the Newman-Girvan null model; γ l indicates the structure analysis parameters in one layer; ωjlr indicates the coupling parameter of node j between the l and r layers. When node j at the l and r layers belong to the same community, δ(gjl, gjr) is 1; otherwise, it is 0. Based on previous studies (Mantini, Corbetta, Romani, Orban, & Vanduffel, Reference Mantini, Corbetta, Romani, Orban and Vanduffel2013), γ and ω parameters were both set as 1. This algorithm was involved in the null model, and a certain degree of randomness was present; therefore, each data point was simulated 100 times using this algorithm. (2) After the community detection of the FC matrix at different time points, the 100 node relation matrices were generated based on the community division results. In addition, the variability of the specific FC was calculated based on the relation matrix at any two time points to further generate the VM. The calculation formula was as follows:
(Formula 2)

In the above formula, N indicates the theoretic variability of the relationship between any two nodes, and $\sum\nolimits_{i = 1}^N {f_i}$ indicates the actual variability of the relationship between these two nodes. We extend the node variability (Bassett et al., Reference Bassett, Wymbs, Porter, Mucha, Carlson and Grafton2011) to FC variability within and between resting-state networks, and that reflects the rapid adaptation and continuous evolution of the temporal scales in the brain networks, and the indicator is sensitive to both intraindividual and interindividual temporal variability (Reddy et al., Reference Reddy, Mattar, Murphy, Wymbs, Grafton, Satterthwaite and Bassett2018; Sun et al., Reference Sun, Liu, Rolls, Chen, Yao, Yang and Feng2019). Because 100 community detection simulations were executed, the variability of each detection result was calculated. The final variability at the individual level was the average value after 100 iterations, and the variability at the group level was the mean variability (mV) of all participants. The above analytic process enabled the calculation of the mV from different levels (sides, nodes, and network), where the mV of one node was the mean of the mV of all sides of that node. The mV of the whole network was the mean of the mV of all sides in the network. Finally, through the median of the FC variability at the group level, the NA-PCS-related FC was divided into two components: relatively stable [variability lower than the median, the stable connectivity component (SCC)] and relatively variable [variability higher than the median, the variable connectivity component (VCC)].
Predictive analyses of state and trait NA
Prediction of trait NA: (1) Neuroticism was used as a representative indicator of trait NA. (2) The SCC and VCC were inputted as features which masked by the edges selected in step 2 (see ‘FC-based correlation analysis’ section) to predict neuroticism. And the same predictive procedure (steps 3 and 4 of the above ‘FC-based correlation analysis’ section) was performed. Prediction of state NA: (1) the difference in subjects' NA-PCS (NA-PCSD) values was calculated between two time points as an indicator of the change of state NA. (2) The difference between SCC and VCC (ΔSCC, ΔVCC) between two time points (3rd time point and 1st time point) was calculated as an indicator of the FC change of NA level. Note that, the trait NA might be strongly correlated with state NA, and that in its phenomenology people with higher scores of neuroticism might be more prone to state NA and its features of variability across time. Therefore, covariates of neuroticism scores, as well as sex and age, were regressed out from every participants' FCs by removing values of each link on covariates to obtain residuals as final values. (3) The ΔSCC and ΔVCC which masked by the edges selected in step 2 (see ‘FC-based correlation analysis’ section) were used as features to predict the NA-PCSD. And the same predictive procedure (steps 3 and 4 of the above ‘FC-based correlation analysis’ section) was performed.
Global signal
Previous researches have shown that global signal is associated with non-neuronal activity, such as respiration and cardiac rhythms (Liu, Nalci, & Falahpour, Reference Liu, Nalci and Falahpour2017b; Power, Plitt, Laumann, & Martin, Reference Power, Plitt, Laumann and Martin2017), and therefore global signal regression (GSR) is highly effective at removing global artifacts arising from these physiological sources. Moreover, this recent research suggests that some behavioral phenotypes exhibit greater improvement in prediction accuracy after GSR (using kernel regression) (Li et al., Reference Li, Kong, Liegeois, Orban, Tan, Sun and Yeo2019b). Consequently, given the absolute importance of the prediction analysis to the current study, we mainly focus on results with GSR. However, the global signal is not only mere noise but also an important source of information (Li et al., Reference Li, Bolt, Bzdok, Nomi, Yeo, Spreng and Uddin2019a). Therefore, we repeated the same prediction analyses based on the corresponding FC features without GSR, which can serve as a control analysis for the FCs identified in our study and may provide complementary insights.
Results
The principal component analysis included 621 participants (342 females; mean ± s.d. age, 20.7 ± 1.4 years, ranging from 17 to 27 years). Common factors were observed between the matrices suitable for principal component extraction (KMO = 0.837, p < 0.001). Based on the parallel analysis principle, one principal component was extracted. This principal component explained 62.4% of the total variation of the variables (Table 1).
Table 1. The eigenvalues and variance contribution rates of all components

We first confirmed the resting-state FC related to the NA-PCS at the p < 0.05 level in sample 1. As the prediction analyses showed, these FCs significantly predicted the NA-PCS in sample 1. The correlation between the real value (Y) and the predicted Y was 0.72 (Fig. 1b), and the permutation test (1000 iterations) showed that the prediction function was significant (p < 0.001). Using the independent dataset (sample 2), these FCs still predicted the NA-PCS based on the permutation test with p = 0.003. And the correlation between Y and the predicted Y reached 0.24 (Fig. 1c). We sorted all nodes by the total number of its functional connectivities and the FCs of the top 25 nodes were presented in Fig. 1a. Based on the classical functional network defined in previous studies (Power et al., Reference Power, Cohen, Nelson, Wig, Barnes, Church and Schlaggar2011), Fig. 1a showed the positive and negative FCs mainly involved the DMN, fronto-parietal task control network (FPN), the attention system (dorsal/ventral attention network), and the sensory system (visual network, auditory network, sensory-somatomotor network). The results of the same prediction analyses using preprocessing data without GSR were showed in the online Supplementary material, which indicated the FCs also predicted the NA-PCS in sample 1 and sample 2. Please see the online Supplementary material for details.
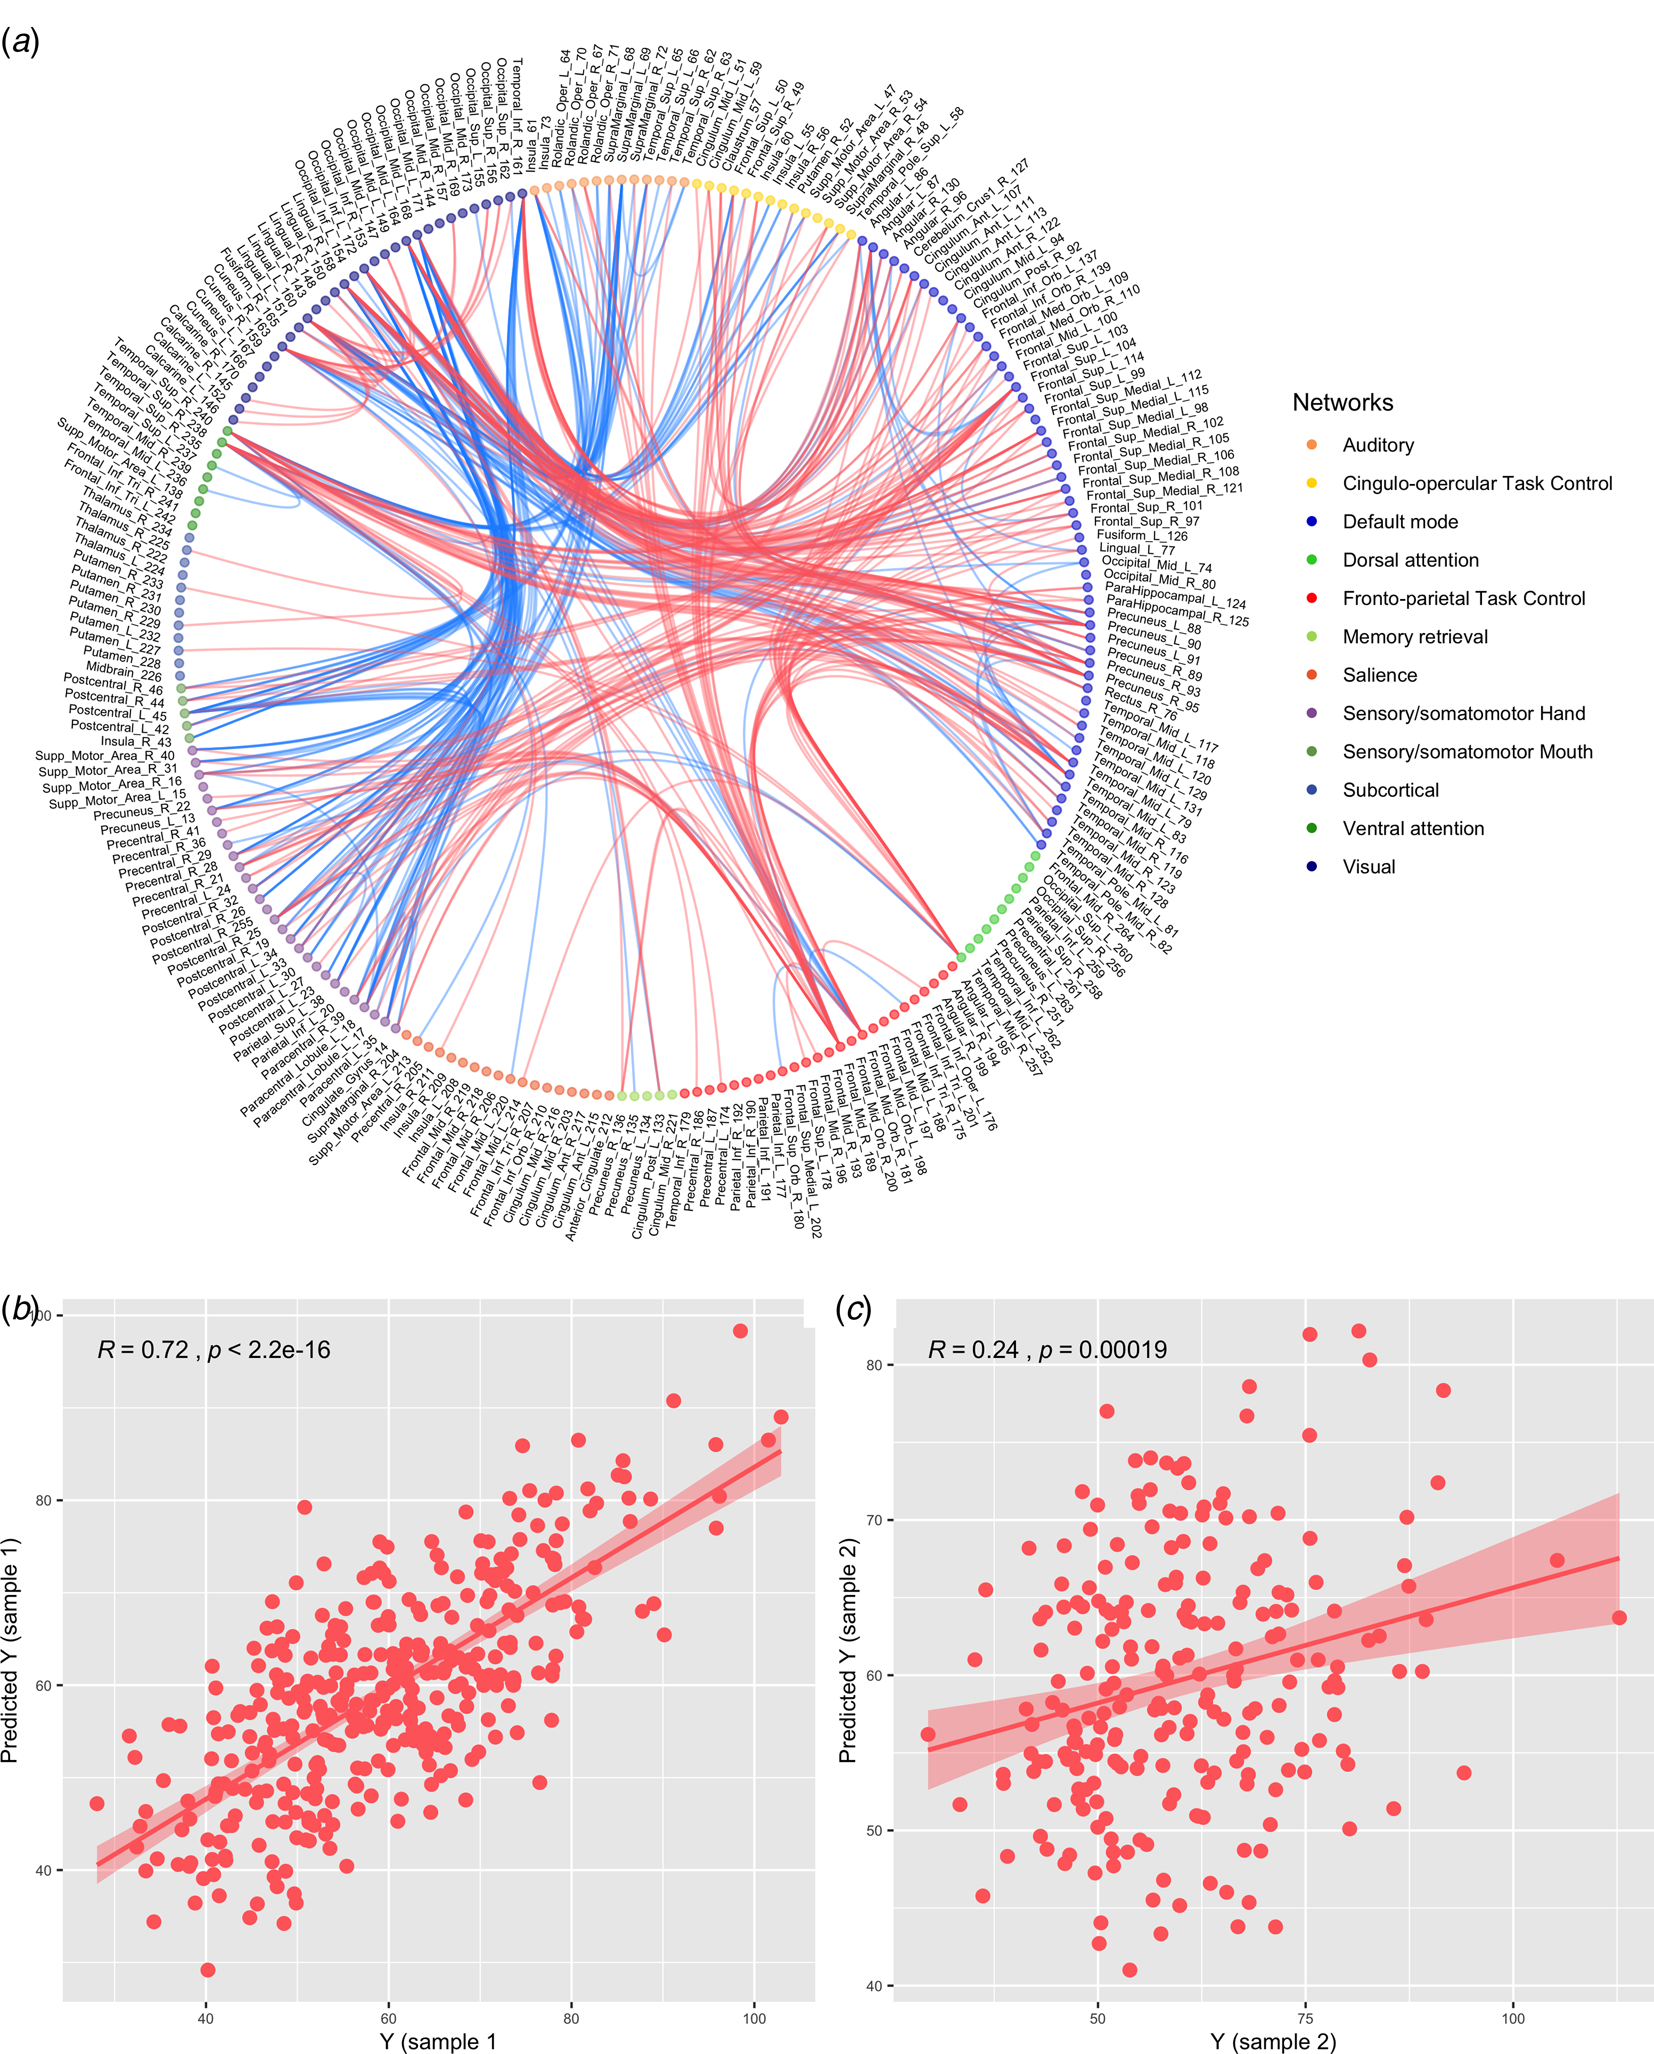
Fig. 1. (a) Functional connectivities (the functional connectivity of the top 25 nodes were presented) associated with the NA-PCS at the p < 0.05 level in sample 1. (b) The prediction effect of the NA-PCS-related functional connectivities in sample 1. (c) The prediction effect of the NA-PCS-related functional connectivities in sample 2. Red: increased functional connectivity, Blue: decreased functional connectivity.
According to the median of the FC variability at the group level, the NA-PCS-related FCs were divided into relatively stable FCs and relatively variable FCs. Figure 2a shows the FCs of the top 12 nodes in SCC. These connections were mostly positive and mainly within DMN or between the DMN and the dorsal attention network/sensory system. Figure 3a shows FC of the top 13 nodes in VCC, and the connections were primarily between the DMN and the ventral attention network, the FPN and the DMN/sensory system. Specifically, ΔSCC did not show a predictive function with regard to the NA-PCSD. The correlation between the Y and the predicted Y was 0.06 (see Fig. 2b). The permutation test (1000 iterations) showed that the prediction function was not significant (p = 0.488). In contrast, a significant predictive function regarding SCC and neuroticism was presented with r = 0.22 (see Fig. 3a) and p = 0.005. The ΔVCC predicted the NA-PCSD, the correlation between the Y and the predicted Y was 0.34 (Fig. 3b), and the permutation test (1000 iterations) showed that the prediction function was significant (p = 0.026). No prediction function was found with regard to VCC and neuroticism based on r = 0.11 (Fig. 3c) and p = 0.091. The details of the same prediction analyses using preprocessing data without GSR were presented in the online Supplementary material.
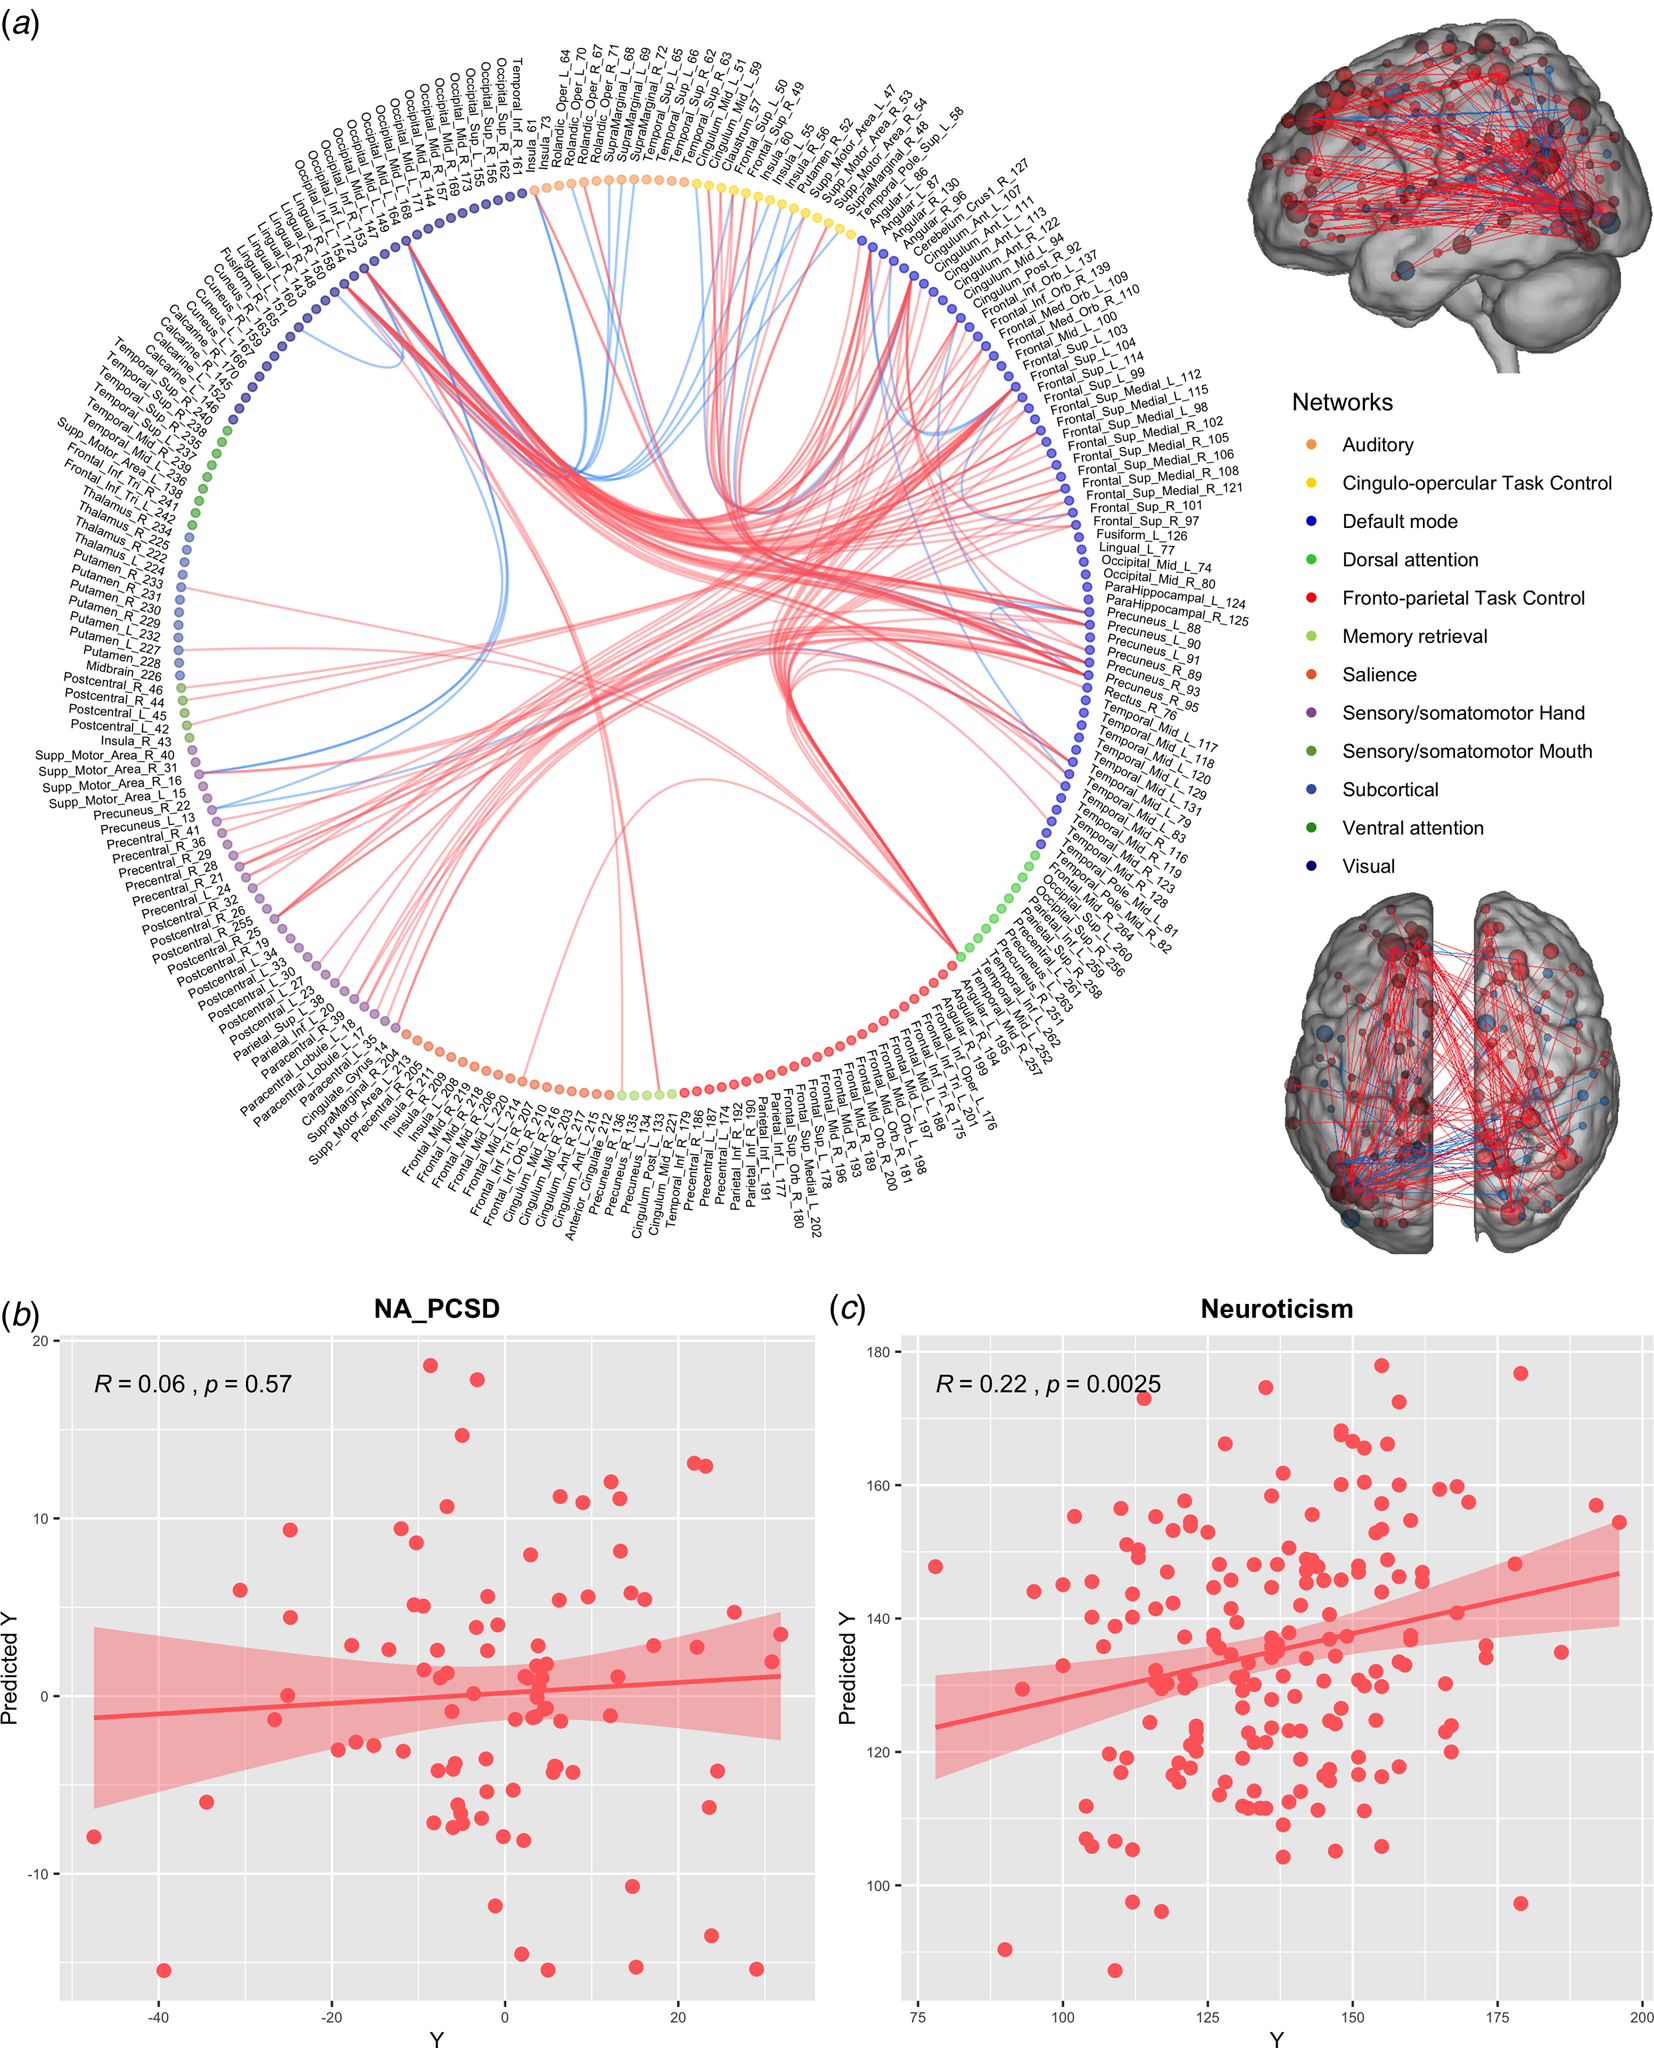
Fig. 2. (a) Functional connectivities of the top 12 nodes in SCC. Red: increased functional connectivity, Blue: decreased functional connectivity. (b) The prediction effect of the ΔSCC on the NA-PCSD. (c) The prediction effect of the SCC on neuroticism. SCC: the stable connectivity component. NA-PCSD: the difference in subjects' principal component score of negative affect.

Fig. 3. (a) Functional connectivities of the top 13 nodes in VCC. Red: increased functional connectivity, Blue: decreased functional connectivity. (b) The prediction effect of the ΔVCC on the NA-PCSD. (c) The prediction effect of the VCC on neuroticism. VCC: the variable connectivity component. NA-PCSD: the difference in subjects' principal component score of negative affect.
Discussion
In the current study, we used FC with different variabilities to predict the trait and state NA among individuals. Firstly, we identified the resting-state FC which predicted NA. And then the FC was divided into high- and low-variability groups to predict trait and state NA. Finally, we found that the low-variability FCs significantly predicted neuroticism (trait) rather than NA-PCSD (state), and high-variability FCs significantly predicted NA-PCSD, not neuroticism. Specifically, the relatively stable (low-variability) FCs were primarily within DMN or between DMN and the dorsal attention network/sensory system. The relatively variable (high-variability) FCs were primarily between the DMN and the ventral attention network, the FPN and the DMN/sensory system. These results suggest that the trait and state NA can be separately predicted by stable and variable resting-state FC which may involve in different attentional processes and emotion regulatory mechanisms.
We found that the stable FCs, which were positively correlated with NA and within the DMN or between the DMN and the sensory system/dorsal attention network, were sensitive to trait rather than state NA. Firstly, the DMN is involved in affective regulation and internal mental thoughts (i.e. mind wandering, self-referential processes) (Christoff, Gordon, Smallwood, Smith, & Schooler, Reference Christoff, Gordon, Smallwood, Smith and Schooler2009; Davidson, Reference Davidson2000; Sheline et al., Reference Sheline, Barch, Price, Rundle, Vaishnavi, Snyder and Raichle2009). Our results of intranetwork FC in the DMN positively related to NA might indicate that individuals generate internally focused spontaneous thoughts which bias toward NA and self-focused, which has found in NA-related mental disorders. For instance, the abnormally increased FCs within the DMN have found in depression (Anand et al., Reference Anand, Li, Wang, Wu, Gao, Bukhari and Lowe2005; Liu et al., Reference Liu, Kaneko, Ouyang, Li, Hao, Chen and Liu2012) as well as ultra-high risk for psychosis relative to healthy individuals (Shim et al., Reference Shim, Oh, Jung, Jang, Choi, Kim and Kwon2010). Regarding the sensory system, as the center of sensory processing and motor functions (Huang et al., Reference Huang, Li, Zhang, Zhang, Liu, Mo and Chen2015), it is important for the psychomotor dimension (Martino et al., Reference Martino, Magioncalda, Huang, Conio, Piaggio, Duncan and Wolff2016). We found the connections between the DMN and the sensory system might suggest the internally oriented cognition for NA interact with the psychomotor behaviors. As recent evidence further shows that the DMN/sensorimotor networks in depression exhibited interaction between excessive internally directed thoughts and fluctuating psychomotor (Martino et al., Reference Martino, Magioncalda, Huang, Conio, Piaggio, Duncan and Wolff2016).
The results also indicated that the increased connections between the DMN and the dorsal attention network were correlated with increased trait NA. Briefly, the dorsal attention network has been suggested to generate and maintain voluntary attention by biasing processing based on internal goals or expectations (top-down orienting) (Corbetta, Patel, & Shulman, Reference Corbetta, Patel and Shulman2008). Our result is consistent with previous researches showing that weakened anti-correlations between the DMN and the dorsal attention network are involved in worse clinical status (De Havas, Parimal, Soon, & Chee, Reference De Havas, Parimal, Soon and Chee2012; Kelly, Uddin, Biswal, Castellanos, & Milham, Reference Kelly, Uddin, Biswal, Castellanos and Milham2008). Indeed, the greater connectivity between the DMN and the dorsal attention network predicts poorer distractor suppression (Poole et al., Reference Poole, Robinson, Singleton, DeGutis, Milberg, McGlinchey and Esterman2016) and shows increased levels of rumination in healthy subjects (Lois & Wessa, Reference Lois and Wessa2016). Taken together, our findings may support the idea that the DMN provides sustained internally concerned negative experiences indicating where, when, or to what individuals should orient their attention. Importantly, the dynamic characteristic of the connectivities identified to predict trait NA are stable, which indicates these FCs maintain community allegiance during the resting-state, and this is an important attribute for predicting trait rather than state. The previous researches suggest that static aspects of FC may simultaneously capture individuals' disposition about stably inherent traits (Cole, Yarkoni, Repovš, Anticevic, & Braver, Reference Cole, Yarkoni, Repovš, Anticevic and Braver2012; Finn et al., Reference Finn, Shen, Scheinost, Rosenberg, Huang, Chun and Constable2015). Combining with our results, the DMN might provide sustained internally directed negative cognition coupling with the sensory system (psychomotor function) and the dorsal attention network (top-down orienting) to predict trait NA in a stable modular manner.
On the other hand, we found the changing level of the variable FCs, which were positively correlated with NA and between the DMN and the ventral attention network, were sensitive to the change of state rather than trait NA. In contrast to the dorsal attention network which supports top-down orienting, the ventral attention network is primarily involved in bottom-up stimulus-driven which re-orienting attention toward salient external stimuli (Fox, Corbetta, Snyder, Vincent, & Raichle, Reference Fox, Corbetta, Snyder, Vincent and Raichle2006). Our result is consistent with the previous evidence, which shows that, in response to negative emotional distractors, subclinical depressive individuals are associated with hyperconnectivity between brain regions responsive to salience and regions related to internal mentation (Kaiser et al., Reference Kaiser, Andrews-Hanna, Spielberg, Warren, Sutton, Miller and Banich2015b). In this study, the findings of the connections between the DMN and the ventral attention network might suggest the bottom-up processing of negative cues that correspond to the content of internal thoughts. Crucially, the high level of variability of these connections indicates that the FC constantly shifts allegiance, which appears to characterize the frequently regulating focus of external stimuli (Vartanian, Reference Vartanian2009) or shifting of the focus of mental thoughts (Kucyi, Esterman, Riley, & Valera, Reference Kucyi, Esterman, Riley and Valera2016). The regulating or shifting of connections between the DMN and the ventral attention network thus may influence the level of NA.
Moreover, the findings indicated that the increased connectivity between the FPN and DMN/sensory system predicted greater state NA. The FPN is typically involved in the executive, top-down regulation of attention and emotion (Vincent, Kahn, Snyder, Raichle, & Buckner, Reference Vincent, Kahn, Snyder, Raichle and Buckner2008), and the abnormal activity within the FPN may reflect deficits in cognitive control (Kaiser et al., Reference Kaiser, Andrews-Hanna, Spielberg, Warren, Sutton, Miller and Banich2015b). Previous researches show that the FPN and the DMN positively couple during internal attention-oriented processing such as self-referential processing (Spreng, Reference Spreng2012) and mind-wandering (Fox, Spreng, Ellamil, Andrews-Hanna, & Christoff, Reference Fox, Spreng, Ellamil, Andrews-Hanna and Christoff2015). Furthermore, allocating too many resources toward the internally oriented processing at the cost of engaging with external attention may lead to hyperconnectivity between the two networks. For example, the increased connectivity between the FPN and the DMN is observed in major depressive disorder (Whitton et al., Reference Whitton, Deccy, Ironside, Kumar, Beltzer and Pizzagalli2018). This evidence suggests that aberrant communication between the two networks may reflect ongoing rumination or an underlying bias for control systems (Kaiser et al., Reference Kaiser, Andrews-Hanna, Spielberg, Warren, Sutton, Miller and Banich2015b). Combining with our results, the communication between the two networks may contribute to certain patterns in cognitive and affective functioning that are considered to underlie state NA. In addition to the sensory system, the FPN may positively couple with it for use of sensory computational resources (Anticevic et al., Reference Anticevic, Cole, Murray, Corlett, Wang and Krystal2012) according to task demands which may be associated with the level of NA. Specifically, the above connections constantly shifted among modular structures. This high-variability pattern within FPN or between FPN and other networks (i.e. DMN, sensory system) has been reported in previous studies, which shows that the dynamic FC of FPN, as a flexible hub of cognitive control, is related to the state-dependent variability (Betzel, Satterthwaite, Gold, & Bassett, Reference Betzel, Satterthwaite, Gold and Bassett2017; Douw et al., Reference Douw, Wakeman, Tanaka, Liu and Stufflebeam2016; Zanto & Gazzaley, Reference Zanto and Gazzaley2013). Therefore, this pattern may facilitate dynamic cognitive regulation for internal-oriented processing or transformations of sensory manifestation of psychomotricity, and thus be related to the change of NA.
To summarize, the current study combines FC strength with variability to distinguish trait and state NA. The low-variability with the attribute of maintaining community allegiance may provide implications for understanding individuals' personality trait or a disposition to retain NA. In contrast, the high-variability with the attribute of shifting allegiance frequently may play an important role in the fluctuation of NA. And the FCs correlated with trait and state NA were involved in different networks, such as DMN-dorsal attention network v. DMN-ventral attention network, within DMN v. FPN-DMN, which suggests that trait and state NA are specifically subserved by the intrinsic brain activities with different attentional processes and emotion regulatory mechanisms. This study supports the hypotheses of previous studies regarding the important neural mechanisms of NA. Furthermore, the variability of the intrinsic activity was adopted to obtain additional unique NA-related brain imaging mode which previous studies have rarely used to predict the trait and state NA separately. The current study deepens our understanding of NA and provides new thinking and references for future studies.
Supplementary material
The supplementary material for this article can be found at https://doi.org/10.1017/S0033291720002391
Acknowledgements
The authors disclosed receipt of the following financial support for the research, authorship, and publication of this article: National Natural Science Foundation of China (31600878; 31771231), Changjiang Scholar Program of Chinese Ministry of Education, and Innovative Research Project for Postgraduate Student of Chongqing (CYB19101).
Conflict of interest
The authors declared no potential conflicts of interest with respect to the research, authorship, and publication of this article.


