


Introduction
Genetic factors play an important role in the susceptibility to depression. A meta-analysis of twin studies on major depressive disorder (MDD) estimated the heritability between 31 and 42% (Sullivan et al. Reference Sullivan, Neale and Kendler2000). The success of genome-wide association studies (GWAS) aiming to find genes underlying vulnerability for depression, however, has been limited; the most promising findings to date are poorly replicated and explain only a small proportion of this heritability (Muglia et al. Reference Muglia, Tozzi, Galwey, Francks, Upmanyu, Kong, Antoniades, Domenici, Perry, Rothen, Vandeleur, Mooser, Waeber, Vollenweider, Preisig, Lucae, Muller-Myhsok, Holsboer, Middleton and Roses2008; Psychiatric GWAS Case Control Consortium et al. Reference Cichon, Craddock, Daly, Faraone, Gejman, Kelsoe, Lehner, Levinson, Moran, Sklar and Sullivan2009; Sullivan et al. Reference Sullivan, de Geus, Willemsen, James, Smit, Zandbelt, Arolt, Baune, Blackwood, Cichon, Coventry, Domschke, Farmer, Fava, Gordon, He, Heath, Heutink, Holsboer, Hoogendijk, Hottenga, Hu, Kohli, Lin, Lucae, Macintyre, Maier, McGhee, McGuffin, Montgomery, Muir, Nolen, Nothen, Perlis, Pirlo, Posthuma, Rietschel, Rizzu, Schosser, Smit, Smoller, Tzeng, van Dyck, Verhage, Zitman, Martin, Wray, Boomsma and Penninx2009). This may be explained by the polygenic architecture of the trait as well as difficulties in diagnosis. A validated biomarker for depression does not exist and the diagnosis is based solely on symptoms. Such symptoms include depressed mood states, loss of interest in activities, feelings of worthlessness or inappropriate guilt, recurrent thoughts of death, poor concentration, and somatic symptoms such as changes in appetite, sleep patterns, fatigue, and weight gain or loss (American Psychiatric Association, 1994; National Institute for Clinical Excellence, 2003). Depression can manifest with different patterns of symptoms, and such phenotypic heterogeneity may reflect genetic heterogeneity. It is plausible that different genetic pathways are associated with the various symptom clusters, and analyses of more narrowly defined phenotypes may reduce genetic heterogeneity. Indeed, the diverse domains of complaints, which result in variations in presentation of the disease within and between populations, may lead to problems for gene discovery. A focus on outcomes based on depressive symptoms and endophenotypes has been shown to increase power in association studies (Teslovich et al. Reference Teslovich, Musunuru, Smith, Edmondson, Stylianou, Koseki, Pirruccello, Ripatti, Chasman, Willer, Johansen, Fouchier, Isaacs, Peloso, Barbalic, Ricketts, Bis, Aulchenko, Thorleifsson, Feitosa, Chambers, Orho-Melander, Melander, Johnson, Li, Guo, Li, Shin Cho, Jin Go, Jin Kim, Lee, Park, Kim, Sim, Twee-Hee Ong, Croteau-Chonka, Lange, Smith, Song, Hua Zhao, Yuan, Luan, Lamina, Ziegler, Zhang, Zee, Wright, Witteman, Wilson, Willemsen, Wichmann, Whitfield, Waterworth, Wareham, Waeber, Vollenweider, Voight, Vitart, Uitterlinden, Uda, Tuomilehto, Thompson, Tanaka, Surakka, Stringham, Spector, Soranzo, Smit, Sinisalo, Silander, Sijbrands, Scuteri, Scott, Schlessinger, Sanna, Salomaa, Saharinen, Sabatti, Ruokonen, Rudan, Rose, Roberts, Rieder, Psaty, Pramstaller, Pichler, Perola, Penninx, Pedersen, Pattaro, Parker, Pare, Oostra, O'Donnell, Nieminen, Nickerson, Montgomery, Meitinger, McPherson, McCarthy, McArdle, Masson, Martin, Marroni, Mangino, Magnusson, Lucas, Luben, Loos, Lokki, Lettre, Langenberg, Launer, Lakatta, Laaksonen, Kyvik, Kronenberg, Konig, Khaw, Kaprio, Kaplan, Johansson, Jarvelin, Janssens, Ingelsson, Igl, Kees Hovingh, Hottenga, Hofman, Hicks, Hengstenberg, Heid, Hayward, Havulinna, Hastie, Harris, Haritunians, Hall, Gyllensten, Guiducci, Groop, Gonzalez, Gieger, Freimer, Ferrucci, Erdmann, Elliott, Ejebe, Doring, Dominiczak, Demissie, Deloukas, de Geus, de Faire, Crawford, Collins, Chen, Caulfield, Campbell, Burtt, Bonnycastle, Boomsma, Boekholdt, Bergman, Barroso, Bandinelli, Ballantyne, Assimes, Quertermous, Altshuler, Seielstad, Wong, Tai, Feranil, Kuzawa, Adair, Taylor, Borecki, Gabriel, Wilson, Holm, Thorsteinsdottir, Gudnason, Krauss, Mohlke, Ordovas, Munroe, Kooner, Tall, Hegele, Kastelein, Schadt, Rotter, Boerwinkle, Strachan, Mooser, Stefansson, Reilly, Samani, Schunkert, Cupples, Sandhu, Ridker, Rader, van Duijn, Peltonen, Abecasis, Boehnke and Kathiresan2010; van der Sluis et al. Reference van der Sluis, Posthuma, Nivard, Verhage and Dolan2013). However, the genetic architecture of these outcomes is also complex and may involve the effects of multiple common variants (Demirkan et al. Reference Demirkan, Penninx, Hek, Wray, Amin, Aulchenko, van Dyck, de Geus, Hofman, Uitterlinden, Hottenga, Nolen, Oostra, Sullivan, Willemsen, Zitman, Tiemeier, Janssens, Boomsma, van Duijn and Middeldorp2011).
Depressive symptoms can be measured by questionnaires, such as the Center for Epidemiological Studies Depression (CES-D) scale, which shows moderate heritability (López-León et al. Reference López-León, Aulchenko, Tiemeier, Oostra, van Duijn and Janssens2010). The CES-D scale measures symptoms clustered in somatic complaints, lack of positive affect, negative affect and interpersonal problems domains, which are usually combined into a single score (Radloff, Reference Radloff1977). The CES-D subscales can also be analysed separately in order to focus on the specific symptom domains. We conducted a meta-analysis of GWAS of specific symptom domains measured by the CES-D scale. The discovery set consisted of 12 cohorts (n = 32 528) and the replication set consisted of five cohorts (n = 6813).
Method
Table 1 summarizes the characteristics of the discovery and replication cohorts from the Cohorts for Health and Aging Research in Genetic Epidemiology (CHARGE) Consortium. The main aim of CHARGE is to facilitate GWAS meta-analyses and replication opportunities among multiple large and well-phenotyped longitudinal cohort studies (Psaty et al. Reference Psaty, O'Donnell, Gudnason, Lunetta, Folsom, Rotter, Uitterlinden, Harris, Witteman and Boerwinkle2009). The discovery sample consisted of the CHARGE cohorts with eligible 20-item CES-D (CES-D-20) data. These cohorts were the Baltimore Longitudinal Study of Aging (BLSA) (Sutin & Zonderman, Reference Sutin and Zonderman2012), the Dortmund Health Study (Vennemann et al. Reference Vennemann, Hummel and Berger2008; Pfaffenrath et al. Reference Pfaffenrath, Fendrich, Vennemann, Meisinger, Ladwig, Evers, Straube, Hoffmann and Berger2009), the Erasmus Rucphen Family Study (ERF) (Aulchenko et al. Reference Aulchenko, Heutink, Mackay, Bertoli-Avella, Pullen, Vaessen, Rademaker, Sandkuijl, Cardon, Oostra and van Duijn2004; López-León et al. Reference López-León, Chi Choy, Aulchenko, Claes, Oostra, Mackenbach, van Duijn and Janssens2009), the National Heart, Lung, and Blood Institute's Framingham Heart Study (FHS) (Dawber et al. Reference Dawber, Meadors and Moore1951; Feinleib et al. Reference Feinleib, Kannel, Garrison, McNamara and Castelli1975; Splansky et al. Reference Splansky, Corey, Yang, Atwood, Cupples, Benjamin, D'Agostino, Fox, Larson, Murabito, O'Donnell, Vasan, Wolf and Levy2007), the Helsinki Birth Cohort Study (HBCS) (Barker et al. Reference Barker, Osmond, Forsen, Kajantie and Eriksson2005), European ancestry participants from the Health, Aging and Body Composition study (HEALTH ABC-Eur) (Cesari et al. Reference Cesari, Penninx, Newman, Kritchevsky, Nicklas, Sutton-Tyrrell, Tracy, Rubin, Harris and Pahor2003), the Rotterdam Study I-II and III (RS I-II and RS-III) (Hofman et al. Reference Hofman, van Duijn, Franco, Ikram, Janssen, Klaver, Kuipers, Nijsten, Stricker, Tiemeier, Uitterlinden, Vernooij and Witteman2011) and SardiNIA (Pilia et al. Reference Pilia, Chen, Scuteri, Orru, Albai, Dei, Lai, Usala, Lai, Loi, Mameli, Vacca, Deiana, Olla, Masala, Cao, Najjar, Terracciano, Nedorezov, Sharov, Zonderman, Abecasis, Costa, Lakatta and Schlessinger2006) and two studies in which the symptoms of depression were measured with the 10-item version of CES-D (CES-D-10): the Atherosclerosis Risk In Communities (ARIC) study (ARIC Investigators, 1989) and the Swedish Twin Registry (STR) study (Rahman et al. Reference Rahman, Bennet, Pedersen, de Faire, Svensson and Magnusson2009). FINRISK (Vartiainen et al. Reference Vartiainen, Laatikainen, Peltonen, Juolevi, Männistö, Sundvall, Jousilahti, Salomaa, Valsta and Puska2010), the Health and Retirement Study (HRS) (Juster & Suzman, Reference Juster and Suzman1995; Weir, Reference Weir2008), Invechhiare in Chianti (InCHIANTI), and the Memory and Aging Project and Religious Order Study of Rush Alzheimer's Disease Center (RUSH-ROS and RUSH-MAP) (Bennett et al. Reference Bennett, Schneider, Buchman, Mendes de Leon, Bienias and Wilson2005; Bennett, Reference Bennett2006) were used as replication analysis of rs713224 (see online Supplementary text S1 for the study descriptions and online Supplementary text S2 for the items of the CES-D scale). With these sample sizes, we had about 80% power to detect associations that explain about 0.12% of the trait variation in the discovery cohort and replication cohort with a p value of 5 × 10⁻⁸ and 0.05, respectively. In the case of multiple measurements the study centers preferred to analyse the measurements that maximize the number in the analysis. This is usually the first measurement as the response declines by years of follow-up. In this case the mean age of the samples refers to the time of measurement date.
Table 1. Study sample characteristics of discovery and replication cohorts
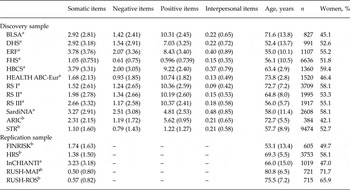
Data are given as mean (standard deviation).
n, Number of subjects included; BLSA, Baltimore Longitudinal Study of Aging; DHS, Dortmund Health Study; ERF, Erasmus Rucphen Family Study; FHS, Framingham Heart Study; HBCS, Helsinki Birth Cohort Study; HEALTH ABC-Eur, Health, Aging and Body Composition study (of European ancestors); RS I-II-III, Rotterdam Study first, second and third waves; SardiNIA, SardiNIA study; ARIC, Atherosclerosis Risk in Communities study; STR, Swedish Twin Registry; FINRISK, National FINRISK Study of Finland; HRS, Health and Retirement Study; InCHIANTI, Invechhiare in Chianti; RUSH-MAP, Rush Memory and Aging Project; RUSH-ROS, Rush Religious Orders Study; CES-D, Center for Epidemiological Studies Depression.
a 20-item CES-D scale.
b 10-item CES-D scale.
GWAS analyses were performed individually by the study centers, according to the same analysis plan; each study excluded dementia cases (Mini-Mental State Examination score < 22), and anti-depressive medication users (except BLSA), since the effect of anti-depressive medication on the scales was not consistent across the studies. There was no restriction on age. Each study center computed the subscales of the CES-D questionnaire that resulted in four separate scores for each individual, measuring different domains of complaints. The reliability coefficients (Cronbach's α) for the somatic complaints (seven items), lack of positive affect (four items) and negative affect (seven items) domains were adequate and ranged from 0.68 to 0.84 whereas for the interpersonal problems domain (two items) those were between 0.45 and 0.63 for the 20-item CES-D scale cohorts. For the 10-item scale, Cronbach's α's for the somatic complaints (three items) ranged from 0.52 to 0.78 and for lack of positive affect (two items) and negative affect (three items) between 0.64 and 0.71. Each study implemented linear regression models, adjusted for age, age-square and sex, under the assumption of an additive genetic model, regressing each subscale on allele dosage and reported the summary statistics. The genotyping and imputation methods for each study are given in online Supplementary Table S1. Additional study site-specific adjustments included linear mixed-effect models to account for familial correlations in the FHS and ERF, and adjustment for the top three Eigen vectors in RUSH-MAP, RUSH-ROS and STR. Prior to meta-analysis, all single nucleotide polymorphism (SNP) IDs were mapped to dbSNP Build 129. Possible measurement and scoring differences across different study centers were checked through extracting the median standard error from the GWAS summary statistics of each study center and plotting it against the square-root of the sample size. Allele frequencies for all SNPs were compared with HapMap frequencies. Stratified Q-Q plots were generated for minor allele frequency (MAF) and imputation quality strata to assess potential sources of inflation. Meta-analyses were performed using the sample size-weighted method as implemented in METAL software package (Willer et al. Reference Willer, Li and Abecasis2010). Due to poor psychometric properties and differences in the median standard errors across the cohorts we excluded the interpersonal problems domain from further analysis. Furthermore, this domain has been criticized for not being consistent with the current criteria for depression and therefore introducing confounding in the validity of the CESD (Carleton et al. Reference Carleton, Thibodeau, Teale, Welch, Abrams, Robinson and Asmundson2013). SNPs with a MAF less than 2.5% or an observed:expected variance ratio (imputation quality) less than 0.30 were excluded on a per-study basis. SNPs for which the total sample size was lower than 5000 were removed from further analysis. We did not use genomic control as this method has been shown to be too conservative (Bulik-Sullivan et al. Reference Bulik-Sullivan, Loh, Finucane, Ripke, Yang, Patterson, Daly, Price and Neale2015). SNP-based heritability was calculated using 1 069 063 markers that were common in the meta-analyses results and linkage disequilibrium (LD) scores were computed using the 1000 Genomes Central EUrope (CEU) reference panel as suggested by the tutorials and provided by the developers of the method.
To test the amount of variance explained by the genetic risk score, we performed a genetic risk score analysis. We excluded one of the cohorts (RS I) (n = 3709) from the discovery set and used this cohort as the target sample. The total score for individuals was calculated for each set of SNPs that were defined on the basis of the p values in the discovery set (e.g. p < 0.00001, 0.0001, 0.1, 0.2). Genetic risk scores were calculated by multiplying the Z-score that was obtained in the discovery analyses with the risk alleles per SNP (0, 1, 2). The PLINK toolset was used to calculate the risk scores (Purcell et al. Reference Purcell, Neale, Todd-Brown, Thomas, Ferreira, Bender, Maller, Sklar, de Bakker, Daly and Sham2007). Linear regression analysis was used to test the association of the genetic risk scores with somatic item scores in the target sample.
Results
The inflation factors for the discovery GWAS of the three scales varied between 1.026 and 0.984. We did not observe any genome-wide significant SNPs for any of the scales in the discovery set apart from the top SNP, rs713224, that showed significant association with the somatic complaints scale(p discovery = 3.82 × 10⁻⁸). Q-Q plots and Manhattan plots of this analysis are presented in the online Supplementary Figs S1 and S2. Online Supplementary Table S2 shows the SNPs with p < 10−4 from the discovery set of 32 528 persons for the somatic, positive and negative domains. The analysis of rs713224 was further extended to a second stage, which included 6813 persons from five study samples, as shown in Table 1. Study-specific summary results for rs713224 are given in online Supplementary Table S3. The overall analysis yielded a non-significant result (p discovery+replication = 1.10 × 10⁻⁶) in the genome-wide scale. Testing for heterogeneity showed evidence for outliers (p het = 0.07) in the combined analysis, compared with the discovery phase (p het = 0.17).
SNP-based heritability estimates (h 2) were 0.038 (s.e. = 0.01), 0.01 (s.e. = 0.01) and 0.024 (s.e. = 0.01) for the somatic, positive and negative domains, respectively. The somatic and negative domains showed significant co-heritability (genetic correlation: 1.1, s.e. = 0.23, Z-score = 4.6, p = 4.3 × 10⁻⁶). The positive domain did not show significant genetic correlation with the negative domain (genetic correlation: 1.5, s.e. = 1.4, Z-score = 1.1, p = 0.27) or with the somatic domain (genetic correlation: 1.5, s.e. = 1.3, Z-score = 1.1; p = 0.27).
In order to search for possible real associations among the subthreshold loci we have performed also a risk score analysis using the discovery set after excluding one of the cohorts as discovery and the RS as the training set. The SNPs with p values less than 10−5 explained a significant but very small part of the variance on the somatic items scale (p = 0.001, R 2 = 0.3%) (online Supplementary Fig. S4).
Discussion
We conducted a GWAS on specific symptom domains of depression in which we combined the results of 12 population-based studies including 32 528 individuals to find common variants that increase the vulnerability to a particular symptom domain (somatic complaints, lack of positive affect and negative affect). In the discovery set we found evidence for one SNP near the brain-expressed melatonin receptor (MTNR1A) gene with respect to the somatic complaints domain only (p discovery = 3.82 × 10⁻⁸). This is in line with an earlier study showing that symptoms of depression linked with physiological functions may show higher heritability compared with symptoms related to negative affect (Jang et al. Reference Jang, Livesley, Taylor, Stein and Moon2004). Rs713224 was further analysed in five separate samples and also in combined meta-analyses of the discovery and replication sets. However, the level of significance of this SNP was attenuated (p discovery+replication = 1.10 × 10⁻⁶). The negative and positive domains did not yield any genome-wide significant SNPs.
Our top SNP, rs713224, is located near the MTNR1A gene, which encodes one of the two melatonin receptors expressed in the brain. Melatonin is a circadian and seasonal regulator in many organisms including humans and is secreted in darkness by the pineal gland. Although melatonin is the hormone of the pineal gland, MTNR1A is ubiquitously expressed, predominantly in the suprachiasmatic nucleus, hypothalamus and prefrontal cortex. The melatonin receptor pathway is known to be involved in depression (Carman et al. Reference Carman, Post, Buswell and Goodwin1976; Wetterberg et al. Reference Wetterberg, Beck-Friis, Kjellman and Ljunggren1984; Goldstein, Reference Goldstein1985; Bourin & Prica, Reference Bourin and Prica2009; Anderson, Reference Anderson2010; Gałecka et al. Reference Gałecka, Szemraj, Florkowski, Gałecki, Bieńkiewicz, Karbownik-Lewińska and Lewiński2011) and its relationship with somatic complaints, and vitality in general, makes it a biologically plausible gene.
However, lack of replication raises the conclusion that our finding for this SNP is likely to be a false positive. Among other reasons, population stratification can result in false-positive findings. To avoid population stratification, only individuals of European descent were included in this study. Including only individuals from population-based studies of European descent also minimized measurement error caused by cultural differences in response to the CES-D (Bernert et al. Reference Bernert, Matschinger, Alonso, Haro, Brugha and Angermeyer2009). On the other hand, this does not count for the replication set. Among them, for instance the RUSH sample included more women and older persons and reported very low mean values for the somatic items (Table 1). Difference in age across the study samples can introduce heterogeneity since melatonin and melatonin receptors are shown to decrease by age (Hill et al. Reference Hill, Cheng, Yuan, Mao, Jockers, Dauchy and Blask2013). An additional sensitivity analysis, excluding the RUSH study, yielded a p discovery+replication = 4.96 × 10⁻⁷ and decreased the heterogeneity (p het = 0.08), but did not exclude it completely. A particular reason of heterogeneity for the melatonin receptor signaling-related outcomes is the interaction with melatonin levels as reviewed extensively before (Pandi-Perumal et al. Reference Pandi-Perumal, Trakht, Srinivasan, Spence, Maestroni, Zisapel and Cardinali2008) and therefore the influence on depressive symptoms may be season specific, depending on the calendar time and latitude that the depression screening took place. However, it was not possible to control for this in the current study.
Although our study is among the largest ones conducted thus far on the common genomic variation in depression with power to detect effects explaining 0.12% of the variation, our study failed to clearly detect and replicate a single loci related to symptoms of depression. Among several reasons, one is that the trait may not be genetically controlled.
The CES-D questionnaire measures depressive symptoms in the past week and the total CES-D scale has been shown to be conserved through life (Radloff, Reference Radloff1977), while this does not rule out the fact that responses to different symptom clusters may differ throughout the lifetime as there is no study to our knowledge that has focused on this. In addition, responses to specific symptom clusters may be population specific due to cultural acceptance or practices. Moreover, age differences across the CHARGE cohorts might have played a role as presentation of depressive symptoms strongly differs by age whereas some genetic variants are hypothesized to interact with age (Simino et al. Reference Simino, Shi, Bis, Chasman, Ehret, Gu, Guo, Hwang, Sijbrands, Smith, Verwoert, Bragg-Gresham, Cadby, Chen, Cheng, Corre, de Boer, Goel, Johnson, Khor, Lluis-Ganella, Luan, Lyytikainen, Nolte, Sim, Sober, van der Most, Verweij, Zhao, Amin, Boerwinkle, Bouchard, Dehghan, Eiriksdottir, Elosua, Franco, Gieger, Harris, Hercberg, Hofman, James, Johnson, Kahonen, Khaw, Kutalik, Larson, Launer, Li, Liu, Liu, Morrison, Navis, Ong, Papanicolau, Penninx, Psaty, Raffel, Raitakari, Rice, Rivadeneira, Rose, Sanna, Scott, Siscovick, Stolk, Uitterlinden, Vaidya, van der Klauw, Vasan, Vithana, Volker, Volzke, Watkins, Young, Aung, Bochud, Farrall, Hartman, Laan, Lakatta, Lehtimaki, Loos, Lucas, Meneton, Palmer, Rettig, Snieder, Tai, Teo, van der Harst, Wareham, Wijmenga, Wong, Fornage, Gudnason, Levy, Palmas, Ridker, Rotter, van Duijn, Witteman, Chakravarti and Rao2014). These would probably introduce phenotypic and genetic heterogeneity. To see if the individual studies were indeed genetically controlled we estimated the SNP-based heritability from the separate GWAS summary statistics collected in this research. The SNP-based heritability estimations in the meta-analysis were surprisingly low (1–4%), indicating the reason for the sparse findings. This is partially due to several reasons sourcing from the genetic architecture of the traits, which are not adequately addressed by the simple association models; such as exclusion of X chromosome, and limiting the analysis only with an additive genetic model which deviates from sufficient power when the MAF < 0.5. Another important reason is that interaction of any genetic determinant with stressful life events, traumas, therapeutic agents, smoking or menopause, which may confer risk to depression (Keers & Uher, Reference Keers and Uher2012), were neglected. We further estimated the co-heritability to see if there are genetic outliers amongst the meta-analysis cohorts. This revealed surprisingly low co-heritability across the contributing cohorts, explaining the lack of successful meta-analysis and replication in our study. The low co-heritability estimations are the indicators of high genetic and phenotypic heterogeneity across the cohorts and are the plausible explanation of insignificant replication in our research. Here it is important to note that the estimates from LD score regression have to be treated with caution because of the small sample size in some individual cohorts.
We also considered the possibility that individual common SNPs explain only a very small proportion of some complex traits, as shown by the polygenic risk score analyses in the current study in which only 0.3% of variance was explained by the most significant SNPs. The risk score for the remaining thresholds did not improve the explained variance, contrary to previous reports (Demirkan et al. Reference Demirkan, Penninx, Hek, Wray, Amin, Aulchenko, van Dyck, de Geus, Hofman, Uitterlinden, Hottenga, Nolen, Oostra, Sullivan, Willemsen, Zitman, Tiemeier, Janssens, Boomsma, van Duijn and Middeldorp2011). Previous studies exploring complex traits (e.g. educational attainment, MDD) revealed similar results (Major Depressive Disorder Working Group of the Psychiatric GWAS Consortium et al. Reference Ripke, Wray, Lewis, Hamilton, Weissman, Breen, Byrne, Blackwood, Boomsma, Cichon, Heath, Holsboer, Lucae, Madden, Martin, McGuffin, Muglia, Noethen, Penninx, Pergadia, Potash, Rietschel, Lin, Muller-Myhsok, Shi, Steinberg, Grabe, Lichtenstein, Magnusson, Perlis, Preisig, Smoller, Stefansson, Uher, Kutalik, Tansey, Teumer, Viktorin, Barnes, Bettecken, Binder, Breuer, Castro, Churchill, Coryell, Craddock, Craig, Czamara, De Geus, Degenhardt, Farmer, Fava, Frank, Gainer, Gallagher, Gordon, Goryachev, Gross, Guipponi, Henders, Herms, Hickie, Hoefels, Hoogendijk, Hottenga, Iosifescu, Ising, Jones, Jones, Jung-Ying, Knowles, Kohane, Kohli, Korszun, Landen, Lawson, Lewis, Macintyre, Maier, Mattheisen, McGrath, McIntosh, McLean, Middeldorp, Middleton, Montgomery, Murphy, Nauck, Nolen, Nyholt, O'Donovan, Oskarsson, Pedersen, Scheftner, Schulz, Schulze, Shyn, Sigurdsson, Slager, Smit, Stefansson, Steffens, Thorgeirsson, Tozzi, Treutlein, Uhr, van den Oord, Van Grootheest, Volzke, Weilburg, Willemsen, Zitman, Neale, Daly, Levinson and Sullivan2013; Rietveld et al. Reference Rietveld, Medland, Derringer, Yang, Esko, Martin, Westra, Shakhbazov, Abdellaoui, Agrawal, Albrecht, Alizadeh, Amin, Barnard, Baumeister, Benke, Bielak, Boatman, Boyle, Davies, de Leeuw, Eklund, Evans, Ferhmann, Fischer, Gieger, Gjessing, Hagg, Harris, Hayward, Holzapfel, Ibrahim-Verbaas, Ingelsson, Jacobsson, Joshi, Jugessur, Kaakinen, Kanoni, Karjalainen, Kolcic, Kristiansson, Kutalik, Lahti, Lee, Lin, Lind, Liu, Lohman, Loitfelder, McMahon, Vidal, Meirelles, Milani, Myhre, Nuotio, Oldmeadow, Petrovic, Peyrot, Polasek, Quaye, Reinmaa, Rice, Rizzi, Schmidt, Schmidt, Smith, Smith, Tanaka, Terracciano, van der Loos, Vitart, Volzke, Wellmann, Yu, Zhao, Allik, Attia, Bandinelli, Bastardot, Beauchamp, Bennett, Berger, Bierut, Boomsma, Bultmann, Campbell, Chabris, Cherkas, Chung, Cucca, de Andrade, De Jager, De Neve, Deary, Dedoussis, Deloukas, Dimitriou, Eiriksdottir, Elderson, Eriksson, Evans, Faul, Ferrucci, Garcia, Gronberg, Guethnason, Hall, Harris, Harris, Hastie, Heath, Hernandez, Hoffmann, Hofman, Holle, Holliday, Hottenga, Iacono, Illig, Jarvelin, Kahonen, Kaprio, Kirkpatrick, Kowgier, Latvala, Launer, Lawlor, Lehtimaki, Li, Lichtenstein, Lichtner, Liewald, Madden, Magnusson, Makinen, Masala, McGue, Metspalu, Mielck, Miller, Montgomery, Mukherjee, Nyholt, Oostra, Palmer, Palotie, Penninx, Perola, Peyser, Preisig, Raikkonen, Raitakari, Realo, Ring, Ripatti, Rivadeneira, Rudan, Rustichini, Salomaa, Sarin, Schlessinger, Scott, Snieder, St Pourcain, Starr, Sul, Surakka, Svento, Teumer, Tiemeier, van Rooij, Van Wagoner, Vartiainen, Viikari, Vollenweider, Vonk, Waeber, Weir, Wichmann, Widen, Willemsen, Wilson, Wright, Conley, Davey-Smith, Franke, Groenen, Hofman, Johannesson, Kardia, Krueger, Laibson, Martin, Meyer, Posthuma, Thurik, Timpson, Uitterlinden, van Duijn, Visscher, Benjamin, Cesarini and Koellinger2013).
The difficulty in finding and replicating GWAS signals for major depression has been a common experience both for depressive symptoms and MDD. A previous study of depressive symptoms of the CHARGE Consortium (Hek et al. Reference Hek, Demirkan, Lahti, Terracciano, Teumer, Cornelis, Amin, Bakshis, Baumert, Ding, Liu, Marciante, Meirelles, Nalls, Sun, Vogelzangs, Yu, Bandinelli, Benjamin, Bennett, Boomsma, Cannas, Coker, de Geus, De Jager, Diez-Roux, Purcell, Hu, Rimm, Hunter, Jensen, Curhan, Rice, Penman, Rotter, Sotoodehnia, Emeny, Eriksson, Evans, Ferrucci, Fornage, Gudnason, Hofman, Illig, Kardia, Kelly-Hayes, Koenen, Kraft, Kuningas, Massaro, Melzer, Mulas, Mulder, Murray, Oostra, Palotie, Penninx, Petersmann, Pilling, Psaty, Rawal, Reiman, Schulz, Shulman, Singleton, Smith, Sutin, Uitterlinden, Volzke, Widen, Yaffe, Zonderman, Cucca, Harris, Ladwig, Llewellyn, Raikkonen, Tanaka, van Duijn, Grabe, Launer, Lunetta, Mosley, Newman, Tiemeier and Murabito2013) on a partially overlapping sample suggested a region on 5q21 in a combined analysis of more than 50 000 persons. A meta-analysis of eight GWAS of MDD status (about 6000 MDD cases and about 7000 controls) yielded only one genome-wide significant finding in the solute carrier family 6 member 15 gene (SLC6A15) (Kohli et al. Reference Kohli, Lucae, Saemann, Schmidt, Demirkan, Hek, Czamara, Alexander, Salyakina, Ripke, Hoehn, Specht, Menke, Hennings, Heck, Wolf, Ising, Schreiber, Czisch, Muller, Uhr, Bettecken, Becker, Schramm, Rietschel, Maier, Bradley, Ressler, Nothen, Cichon, Craig, Breen, Lewis, Hofman, Tiemeier, van Duijn, Holsboer, Muller-Myhsok and Binder2011), while the recent Psychiatric Genomics Consortium (PGC) mega-analysis (9238 cases and 8039 controls) pointed out one region on 3p21.1 that reached genome-wide significance; however, to our knowledge no replication has been reported so far. A PGC-MDD GWAS also showed an association of rs4478239, located within 800 kB of MTNR1A, with recurrent depression (p = 4.7 × 10⁻⁷) in a study including 6743 cases and 9519 controls (online Supplementary Fig. S3). However, the proxy for our top SNP in that region (rs2375800) was not associated with MDD. Similarly, we were not able to replicate the two main findings of a recent report by the CONVERGE Consortium (2015) who attributed their success to the recruitment of relatively homogeneous cases with severe illness. For the LHPP gene region the proxy SNP rs12258489 yielded insignificant p values for negative items (Z-score = 1.52, p = 0.12), for positive items (Z-score = −0.52, p = 0.59) and for somatic items (Z-score = 1.23, p = 0.22). For the sirtuin 1 (SIRT1) region, the SNP of interest, rs12415800, did not associate with negative items (Z-score = 0.12, p = 0.89), positive items (Z-score = −0.57, p = 0.56) or somatic items scales (Z-score = 1.81, p = 0.07).
Conclusion
To conclude, our efforts in a large collaboration utilizing phenotypes defined by symptom clustering yielded no genome-wide significant hit except the somatic complaints domain. One SNP, associated with somatic complaints, reached genome-wide significance in the combined sample and suggested the involvement of MTNR1A in the melatonin signaling pathway, but was not further replicated. Our results suggest that GWAS for depression in large population-based samples remain underpowered due to phenotypic and genetic heterogeneity.
Supplementary material
To view supplementary material for this article, please visit http://dx.doi.org/10.1017/S0033291715002081
Acknowledgements
ARIC study
The research is carried out as a collaborative study supported by: National Heart, Lung, and Blood Institute contracts N01-HC-55015, N01-HC-55016, N01-HC-55018, N01-HC-55019, N01-HC-55020, N01-HC-55021, N01-HC-55022, and grants R01-HL087641, R01-HL093029 and R01-HL70825; National Human Genome Research Institute contract U01-HG004402; and National Institutes of Health (NIH) contract HHSN268200625226C. The authors thank the staff and participants of the ARIC study for their important contributions. Infrastructure was partly supported by grant number UL1RR025005, a component of the NIH Roadmap for Medical Research.
BLSA
BLSA research was supported by the Intramural Research Program of the NIH, National Institute on Aging.
Dortmund Health Study
Blood collection in the Dortmund Health Study was funded by the Institute of Epidemiology and Social Medicine, University of Münster and genotyping with the HumanOmni chip by the German Ministry of Research and Education (BMBF, 01ER0816). The collection of sociodemographic and clinical data in the Dortmund Health Study was supported by the German Migraine & Headache Society (DMKG) and by unrestricted grants of equal share from Almirall, Astra Zeneca, Berlin Chemie, Boehringer, Boots Health Care, Glaxo-Smith-Kline, Janssen Cilag, McNeil Pharma, MSD Sharp & Dohme and Pfizer to the University of Münster.
ERF study
The genotyping for the ERF study was supported by EUROSPAN (European Special Populations Research Network) and the European Commission FP6 STRP grant (018947; LSHG-CT-2006-01947). The ERF study was further supported by grants from the Netherlands Organization for Scientific Research, Erasmus MC, the Centre for Medical Systems Biology (CMSB) and the Netherlands Brain Foundation (HersenStichting Nederland). We are grateful to all participating individuals and their relatives, general practitioners and neurologists for their contributions and to P. Veraart for her help in genealogy, Jeannette Vergeer for the supervision of the laboratory work and P. Snijders for his help in data collection.
FHS
The phenotype–genotype association analyses in the FHS were supported by R01-AG29451. This research was conducted in part using data and resources from the FHS of the National Heart, Lung, and Blood Institute of the NIH and Boston University School of Medicine. The analyses reflect intellectual input and resource development from the FHS investigators participating in the SNP Health Association Resource (SHARe) project. This work was partially supported by the National Heart, Lung, and Blood Institute's FHS (contract no. N01-HC-25195) and its contract with Affymetrix, Inc. for genotyping services (contract no. N02-HL-6-4278). A portion of this research utilized the Linux Cluster for Genetic Analysis (LinGA-II) funded by the Robert Dawson Evans Endowment of the Department of Medicine at Boston University School of Medicine and Boston Medical Center.
FINRISK
The FINRISK Study has been funded by the Sigrid Juselius Foundation, the Jalmari and Rauha Ahokas Foundation and the Biomedicum Helsinki Foundation.
HEALTH ABC-Eur
This research was supported by National Institute on Aging contracts N01AG62101, N01AG62103 and N01AG62106. The GWAS was funded by National Institute on Aging grant 1R01AG032098-01A1 to Wake Forest University Health Sciences and genotyping services were provided by the Center for Inherited Disease Research (CIDR). The CIDR is fully funded through a federal contract from the NIH to The Johns Hopkins University (contract number HHSN268200782096C).
HBCS
We thank all study participants as well as everybody involved in the HBCS. The HBCS has been supported by grants from the Academy of Finland, the Finnish Diabetes Research Society, Folkhälsan Research Foundation, Novo Nordisk Foundation, Finska Läkaresällskapet, Signe and Ane Gyllenberg Foundation, University of Helsinki, European Science Foundation (EUROSTRESS), Ministry of Education, Ahokas Foundation, Emil Aaltonen Foundation, Juho Vainio Foundation and the Wellcome Trust (grant number WT089062).
HRS
The HRS is supported by the National Institute on Aging (NIA U01AG009740). The genotyping was funded as a separate award from the National Institute on Aging (RC2 AG036495). Our genotyping was conducted by the NIH CIDR at Johns Hopkins University. Genotyping quality control and final preparation of the data were performed by the Genetics Coordinating Center at the University of Washington.
InCHIANTI
The InCHIANTI Study was supported as a ‘targeted project’ (ICS 110.1RS97.71) by the Italian Ministry of Health, by the US National Institute on Aging (contracts N01-AG-916413, N01-AG-821336, 263 MD 916413 and 263 MD 821336) and in part by the Intramural Research Program, National Institute on Aging, NIH, USA.
RS
The generation and management of the genotype data for the RS are supported by the Netherlands Organization of Scientific Research Investments (no. 175.010.2005.011, 911-03-012). The RS is funded by: the Erasmus Medical Center and Erasmus University, Rotterdam; the Netherlands Organization for Health Research and Development (ZonMw); the Research Institute for Diseases in the Elderly (RIDE and RIDE2); the Ministry of Education, Culture and Science; the Ministry for Health, Welfare and Sports; the European Commission (DG XII); the Municipality of Rotterdam; and the Netherlands Genomics Initiative/Netherlands Organization for Scientific Research project number 050-060-810.
RUSH-ROS
The RUSH-ROS study was supported by National Institute on Aging grant P30AG10161 and the Illinois Department of Public Health.
RUSH-MAP
The RUSH-MAP study was supported by National Institute on Aging grants R01AG17917 and R01AG15819, and by the Illinois Department of Public Health.
SardiNIA
SardiNIA research was supported by the Intramural Research Program of the NIH, National Institute on Aging. M.C.C. is a recipient of a NARSAD Young Investigator Award. Funding was also provided through contract NO1-AG-1-2109 from the National Institute on Aging, NIH.
TWINGENE
The STR study was supported by The Ministry for Higher Education, the Swedish Research Council (M-2005-1112), GenomEUtwin (EU/QLRT-2001-01254; QLG2-CT-2002-01254), NIH DK U01-066134, the Swedish Foundation for Strategic Research (SSF) and the Heart and Lung Foundation (no. 20070481).
North American Brain Expression Consortium (NABEC) brain expression quantitative trait loci (eQTL) data
The work performed by the NABEC was supported in part by the Intramural Research Program of the National Institute on Aging, NIH, part of the US Department of Health and Human Services; project number ZIA AG000932-04. In addition this work was supported by a Research Grant from the Department of Defense, W81XWH-09-2-0128. This study utilized the high-performance computational capabilities of the Biowulf Linux cluster at the NIH, Bethesda, MD (http://biowulf.nih.gov). NABEC scientists are Andrew B. Singleton, Mark R. Cookson, J. Raphael Gibbs, Dena G. Hernandez, Alissa Dilman, Michael A. Nalls, Alan B. Zonderman, Sampath Arepalli, Luigi Ferrucci, Robert Johnson, Dan L. Longo, Richard O'Brien, Bryan Traynor, Juan Troncoso and Marcel van der Brug.
UK Brain Expression Consortium (UKBEC) Brain eQTL data
UKBEC scientists are John Hardy, Michael E. Weale, Mina Ryten, Adaikalavan Ramasamy, Daniah Trabzuni, Colin Smith, H. Ronald Zielke and Robert Walker. These studies performed by the UKBEC were supported by the Medical Research Council (MRC) through the MRC Sudden Death Brain Bank (C.S.), by a project grant (G0901254 to J.H. and M.W.) and by a fellowship award (G0802462 to M.R.). D.T. was supported by the King Faisal Specialist Hospital and Research Centre, Saudi Arabia. Computing facilities used at King's College London were supported by the National Institute for Health Research (NIHR) Biomedical Research Centre based at Guy's and St Thomas' NHS Foundation Trust and King's College London. We would like to thank AROS Applied Biotechnology AS company laboratories and Affymetrix for their valuable input (PMID: 20485568, PMID: 21848658 and PMID: 227230.18).
Declaration of Interest
None.


