


Introduction
Sexual minority individuals consistently report higher rates of mental disorder than heterosexuals (Cochran et al., Reference Cochran, Sullivan and Mays2003; Meyer, Reference Meyer2003; Fergusson et al., Reference Fergusson, Horwood, Ridder and Beautrais2005; Sandfort et al., Reference Sandfort, Bakker, Schellevis and Vanwesenbeeck2006), including those who are considered to be predominantly but not exclusively heterosexual (Vrangalova and Savin-Williams, Reference Vrangalova and Savin-Williams2014; Krueger et al., Reference Krueger, Meyer and Upchurch2018). However, much of the research has substantial methodological limitations.
A common methodological problem is how to measure or classify sexuality (Geary et al., Reference Geary, Tanton, Erens, Clifton, Prah, Wellings, Mitchell, Datta, Gravningen and Fuller2018). A number of studies (e.g. see Sandfort et al., Reference Sandfort, Bakker, Schellevis and Vanwesenbeeck2006; Booker et al., Reference Booker, Rieger and Unger2017) use one variable (e.g. sexual behaviour) to classify individuals even though the research has shown that measures such as sexual behaviour, identification, attraction and fantasy may be incongruently reported by the individual (Matthews et al., Reference Matthews, Blosnich, Farmer and Adams2014; Geary et al., Reference Geary, Tanton, Erens, Clifton, Prah, Wellings, Mitchell, Datta, Gravningen and Fuller2018; Kuperberg and Walker, Reference Kuperberg and Walker2018). An approach to overcome this problem is to use multiple measures of sexuality (Sandfort et al., Reference Sandfort, Bakker, Schellevis and Vanwesenbeeck2006; Herek and Garnets, Reference Herek and Garnets2007) to create an overall classification of sexual identity.
Another pervasive methodological problem in sexuality research is the use of cross-sectional data which provides information for one point in time only that may not be accurately representative, particularly in early adulthood when sexual attraction has been shown to be unstable (Dickson et al., Reference Dickson, Paul and Herbison2003). Compounding this problem is ‘fluidity’ of sexuality (the propensity to change sexuality over time) which means that a person may or may not be considered to be a member of a sexual minority depending on what time point the data are gathered (Diamond, Reference Diamond2016). This is especially true for females who reportedly have more fluid sexuality compared to males (Baumeister, Reference Baumeister2000). Sexual fluidity research is still in its infancy, however, one study has reported that sexually fluid females but not males experience worse mental health outcomes (Katz-Wise et al., Reference Katz-Wise, Williams, Keo-Meier, Budge, Pardo and Sharp2017).
Finally, many studies of sexual minorities employ sampling techniques that are convenient (Hershberger et al., Reference Hershberger, Pilkington and D'Augelli1997; Beard et al., Reference Beard, Stroebel, O'Keefe, Harper-Dorton, Griffee, Young, Swindell, Steele, Linz and Moore2015) but are not necessarily representative and therefore introduce bias (Savin-Williams, Reference Savin-Williams2016). For example, sexual minority research that recruits from lesbian, gay or bisexual (LGB) venues or organisations tend to underrepresent sexual minority individuals who do not associate with the LGB community and who may not identify as LGB. These samples tend to be younger and more open about their sexuality and may not be representative of sexual minorities in general, for instance those that are considered ‘mostly heterosexual’ (Kuyper et al., Reference Kuyper, Fernee and Keuzenkamp2016). To examine this problem Kuyper et al. (Reference Kuyper, Fernee and Keuzenkamp2016) recruited two samples to a study investigating sexual orientation and mental health, one from LGB venues and another from a general research panel. They found the LGB sample to be severely biased and recommended using other sampling methods that are more inclusive (Kuyper et al., Reference Kuyper, Fernee and Keuzenkamp2016).
Against this background of methodological difficulties it is hard to know whether differing levels of mental health outcomes seen between sexual minority individuals and heterosexuals are an accurate reflection of lifetime mental health and sexuality. To overcome these problems, we used longitudinal data from a birth cohort to categorise sexuality using latent class analysis. The analyses described here used sexual behaviour, identity, attraction and fantasy measures gathered over five assessments, from ages 18 to 35, to inform the statistical model for classification. The measures have been assessed at multiple time points meaning that participants have had numerous opportunities to describe their sexuality and the analyses will account for variation over time in those descriptions of sexuality. Mental health and substance use variables collected at four assessments at ages 21, 25, 30 and 35 years were used as outcome measures.
The specific aims of this paper are to:
(1) Classify individuals according to sexuality using longitudinal, repeated measures of sexuality variables of behaviour, attraction, identity and fantasy, gathered across the years of adulthood, from age 18 to 35 years.
(2) Use the derived sexuality classification to estimate the association of mental health and substance use disorders over the course of adulthood for participants with diverse sexualities, before and after adjustment for prospectively assessed social, family and childhood confounding factors.
(3) To explore the possible role of fluidity in reports of sexuality as a factor in mental health outcomes.
Methods
Participants
Participants were drawn from the Christchurch Health and Development Study (CHDS), a birth cohort of 1265 children recruited in Christchurch, New Zealand in 1977. The cohort was assessed at birth, four months, annually to age 16, and then at ages 18, 21, 25, 30 and 35. The current analysis uses data from 1040 participants (511 males, 529 females; 82.2% of the surviving cohort at age 35) for whom partial or complete sexuality data were available from the assessments at age 18, 21, 25, 30 and 35.
Measures of sexual orientation
Participants were asked a series of questions about sexual behaviour, identity, attraction and fantasy at ages 18, 21, 25, 30 and 35 years. Same-sex sexual behaviour was assessed from age 18 to 35 years with a question about whether participants had ever had a same-sex sexual relationship. At age 25, and for all future assessments, a further question was added which asked if they had ever had a same-sex sexual experience. At age 21 participants were also asked whether they identified as heterosexual, homosexual or bisexual. For assessments at age 25, 30 and 35 participants were asked five sexuality questions that covered sexual behaviour (two questions, see above), identity, attraction and fantasy. All sexuality questions asked are shown in online Supplementary Table S1. Sexual identity was assessed by asking ‘which of the following best describes your feelings about your sexual orientation or identification at present?’ and answers were on a five-point scale. Sexual attraction was also measured on a five-point scale and participants were asked ‘Which of the following best describes your sexual feelings at present’. Sexual fantasy was assessed with the following question ‘When you think or daydream about sex, do you think about’: ‘males only’; ‘females only’; or ‘both males and females’. The distribution of observed responses for each sexuality question, by age and sex are shown in online Supplementary Table S2. For the analysis, the behavioural sexuality questions were consolidated to show those that endorsed a homosexual relationship or experience at any of the five assessments.
Mental health and substance use disorders (ages 18–35 years)
At each assessment from age 21 years, cohort members were asked a series of questions concerning symptoms of mental health and substance use disorders since the previous assessment. Questions from the Composite International Diagnostic Interview (World Health Organisation, 1993) were used to assess DSM-IV criteria (American Psychiatry Association, 1994) for major depression, anxiety disorders (generalised anxiety disorder, panic disorder, agoraphobia, social and specific phobia), current nicotine dependence, alcohol use disorder and cannabis use disorder, for each assessment period. For nicotine dependence, the questions were supplemented by custom-written survey items. In addition, for suicidal ideation participants were asked custom-written questions about thoughts of killing themselves during the period since the previous assessment. This information was used to classify participants using a series of dichotomous measures as to whether they met DSM-IV criteria for the mental/substance use disorders listed above. Additionally, to provide an overall measure of the severity of mental health problems at each age, a count measure was created that was the mean of the total number of disorders that each cohort member met criteria for during each assessment period.
Confounding factors
In order to examine the extent to which the associations between the latent class measure of sexual orientation and mental health/substance use outcomes may have been confounded by childhood/adolescent background and family factors, a series of potential confounding factors were drawn from the study database. A wide range of confounding factors were considered, spanning socio-economic, family and individual factors as well as family violence and child abuse (see online Supplementary Table S3). The selection of potential confounding factors was guided by previous research on sexuality done with this cohort (Fergusson et al., Reference Fergusson, Horwood and Beautrais1999, Reference Fergusson, Horwood, Ridder and Beautrais2005). Preliminary analysis identified 14 factors for inclusion as covariates. The 14 factors were: sex; socio-economic status (at birth); parental educational achievement; changes of parents (0–15 years); exposure to childhood sexual abuse (0–16 years); parental intimate partner violence (0–16 years); conduct problems and internalising symptoms (ages 7–9); attention problems (7–9 years); neuroticism (age 14); novelty seeking (age 16); IQ (8–9 years); GPA (11–13 years); self-esteem (age 15). The covariate factors are described in more detail in the online Supplement.
Statistical analysis
Latent class modelling of the observed report measures of sexual identity, attraction, fantasy and behaviour was conducted using Mplus 7.11 (Muthén and Muthén, Reference Muthén and Muthén2013). A sequential model fitting procedure was used that first determined the optimal number of latent classes and then tested parameter equivalence for males and females. A four-class model of sexuality (described as ‘heterosexual’, ‘mostly heterosexual’, ‘bisexual’, ‘gay/lesbian’) was identified as providing the best fit to the observed data. Full details of model fitting are provided in the online Supplementary Material. Participants were assigned to latent classes based on the class with the highest posterior probability of latent class membership.
Associations between sexuality latent class and potential social, family and individual confounding factors were tested for statistical significance using either the χ2 test of independence or one-way analysis of variance.
Associations between latent class membership and the repeated measures data on adult mental health/substance use outcomes (at ages 18–21, 21–25, 25–30 and 30–35 years) were modelled using a generalised estimating equations (GEE) framework to fit a series of population-averaged regression models for each outcome. An initial baseline model was fitted of the form:
 $$G(Y_{it}) = B_0 + B_1\,{\rm SE}{\rm X}_i + \sum B_j\,{\rm CLAS}{\rm S}_{ij} + \sum B_k\,{\rm AG}{\rm E}_{kt}$$
where G(Y it) is either the log odds of outcome Y for the ith participant at time t (for dichotomous outcomes) or the log rate of outcome Y (for the number of mental health problems); SEXi is the participant's sex; CLASSij (j = 2, 3, 4) are a set of dummy variables representing membership of the three sexuality minority latent classes with the heterosexual class defined as the reference class and AGEkt are a set of dummy variables representing the assessment waves. Estimates of the rate ratio of disorder [odds ratios (OR) for dichotomous outcomes or incidence rate ratios (IRR) for the count of disorders] and 95% confidence interval (CI) for each category of sexual orientation (relative to the heterosexual latent class) were obtained by exponentiation of the model parameters B j ( ${\rm e}^{B_j \pm 1.96{\rm SE(}B_j{\rm )}}$). In each case a test of the overall effect of sexuality in the fitted model was derived from a test of the joint hypothesis that the parameters B j (j = 2, 3, 4) were simultaneously zero. All models were fitted using Stata 15 (StataCorp, 2017) and all models assumed an unstructured correlation matrix of the repeated measures of each outcome over time.
The baseline models were then extended to test for sex by sexuality latent class interactions and age by sexuality latent class interactions. The models were extended to include potential confounders and to calculate adjusted effect size estimates. Finally, a supplementary analysis was conducted to examine: (a) factors associated with fluidity in reports of sexuality; and (b) whether fluidity in reporting was related to the experience of mental disorder for sexual minorities (see online Supplementary Material).
Results
Latent class classification of sexual orientation
Latent class modelling of the repeat measures of sexual identity, attraction, fantasy and behaviour identified a four-class model as providing the best fit to the observed data (see the online Supplement for a full description of the model selection process and fitted model parameters). The four classes were characterised as: ‘heterosexual’, ‘mostly heterosexual’, ‘bisexual’ and ‘gay/lesbian’. The fitted model permitted the probability of latent class membership to vary with participant sex but assumed that the item response probabilities (conditional on latent class membership) were the same for males and females. Entropy for the fitted model was 0.96, suggesting very strong discrimination of the latent classes.
Table 1 shows the proportions of males, females and the total sample classified into the four sexuality groups. The table also reports the associations between sexuality latent class and a series of summary measures of lifetime same-sex behaviour, identity, attraction and fantasy. These summary associations are intended to provide face validity for the sexuality latent class classification. Online Supplementary Table S4 reports the fitted model parameters for the latent class model, including a complete listing of the estimated response probabilities for the individual sexuality items at each age.
Table 1. Latent class sexuality group by sex and measures of bisexual/gay/lesbian behaviour, identity, attraction and fantasy
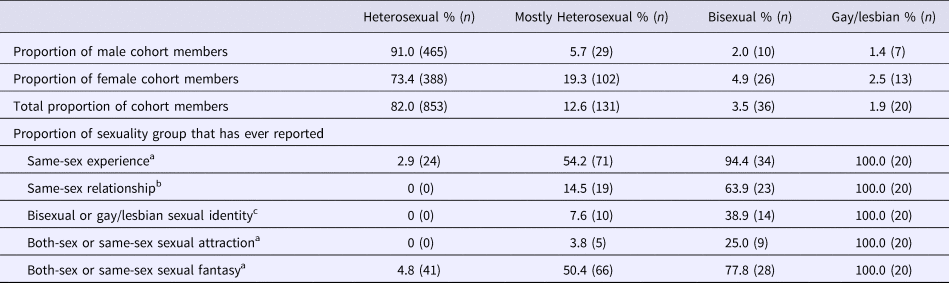
a Asked at ages 25, 30 and 35.
b Asked at ages 18, 21, 25, 30 and 35.
c Asked at ages 21, 25, 30 and 35.
Most of the sample (82%) was classified in the ‘heterosexual’ class. In this class none reported a same-sex relationship, identity or attraction between the ages of 18 and 35 but 2.9% reported same-sex experience and just under 5% reported bisexual or same-sex sexual fantasies. In the ‘mostly heterosexual’ class, which constituted 12.6% of the total sample, 14.5% reported ever having a same-sex relationship and over half stated they had had a same-sex experience (54.2%) and bisexual or same-sex fantasies (50.4%). Only a small minority of this group (7.6%) reported gay/lesbian or bisexual identity up to age 35 and 3.8% reported the same or both sex attraction. In the ‘bisexual’ class (3.5% of the sample) nearly all reported a same-sex experience (94.4%), two thirds (63.9%) a same-sex relationship and over a third (38.9%) endorsed a bisexual or gay/lesbian identity. A quarter of this group reported both-sex or same-sex attraction and three quarters (77.8%) reported both-sex or same-sex sexual fantasies. Amongst the ‘gay/lesbian’ group (1.9% of the sample) all had reported bisexual or same-sex behaviour, identity, attraction and fantasy. In the three sexual minority classes females outweighed males by; 3:1 ‘mostly heterosexual’, 2:1 ‘bisexual’ and ‘gay/lesbian’ groups.
Associations between sexuality and mental health (18–35 years)
Table 2 shows the pooled mental health and substance use data from four assessments at ages 21, 25, 30 and 35 years by sexuality classification. Results are shown for the whole sample and for males and females. Online Supplementary Table S5 provides a complete breakdown of these associations at each age. Regression modelling of the repeated measures data showed that there were statistically significant differences (p < 0.0001) between the ‘heterosexual’ group and the three remaining sexual minority groups for depression, anxiety, suicidal ideation, and on the measure of all disorders, with the sexual minority groups showing higher rates of disorder. Bivariate associations between the sexual minority group and substance use disorders were not statistically significant with the exception of cannabis abuse (p < 0.01).
Table 2. Pooled percentages for mental and substance use disorders across four assessments (ages 21, 25, 30 and 35 years) by sex and sexuality group
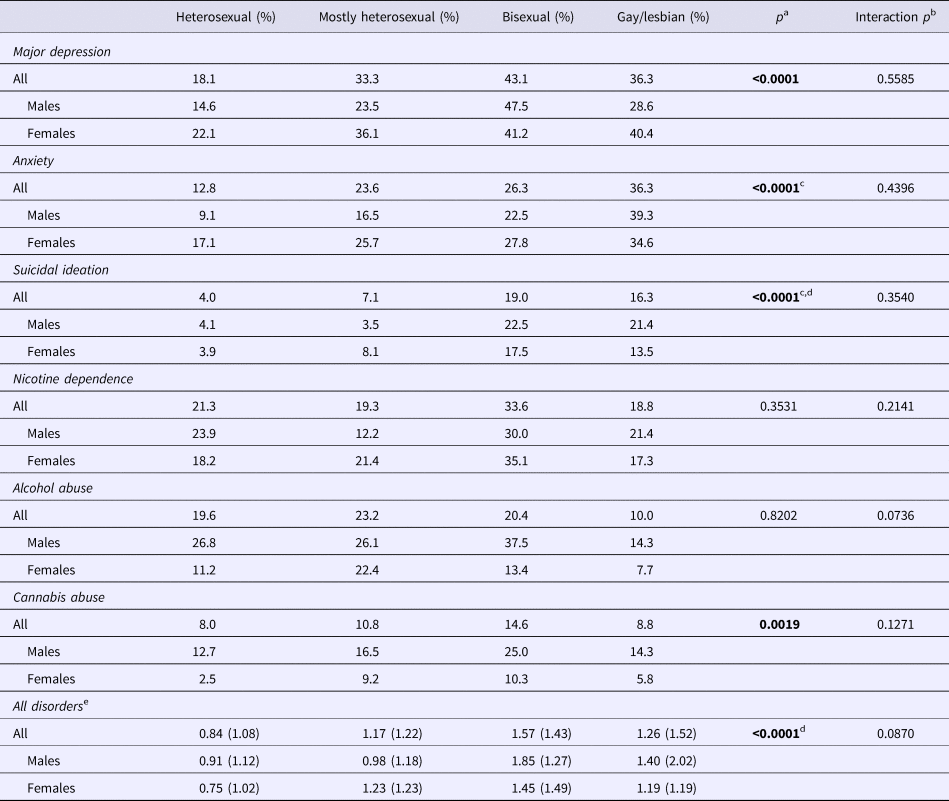
a Log-likelihood χ2, Poisson regression for all disorders.
b Test of significance of sex by sexuality group interaction.
c ‘Gay/lesbian’ had significantly higher rates than ‘mostly heterosexual’ p < 0.05.
d ‘Bisexual’ had significantly higher rates than ‘mostly heterosexual’ p < 0.01.
e Mean (s.d.).
The fitted models showed evidence of statistically significant sex differences in rates of disorder for most outcomes. However, extension of the models to test for sex by sexuality group and age by sexuality group interactions showed no significant interactions, suggesting that the associations between sexuality group and mental health outcomes were similar for males and females and did not vary with age.
Associations between sexuality classification and mental health outcomes, after adjustment for confounding
It could be argued that the associations between the classification of sexuality and mental health outcomes from ages 18 to 35 shown in Table 2 may be due to factors that may be confounded with the classification of sexuality (shown in online Supplementary Table S3). In order to address this issue, the associations between sexuality classification and mental health outcomes were adjusted for the potential influence of these confounding factors, including sociodemographic factors, childhood family functioning, abuse exposure, and individual factors.
Table 3 shows the odds ratios (ORs) for mental and substance use disorders and the incidence rate ratio (IRR) for all disorders in comparison to the ‘heterosexual’ group, before and after adjustment for covariate childhood factors. Of the 14 covariate childhood factors that had significant bivariate associations, 11 were significant in the fitted models (p < 0.05). For mental disorder (depression, anxiety and suicidal ideation) group differences remained statistically significant after adjustment (p = 0.0001). The adjusted OR for the associations between sexuality classification and major depression ranged from 1.6 to 2.1 in the sexual minority groups with the ‘bisexual’ group having the highest OR. Adjusted ORs for anxiety were similar for the ‘mostly heterosexual’ group and ‘bisexual’ group (1.7 and 1.9 respectively) but raised to 2.9 for the ‘gay/lesbian’ group. Suicidal ideation showed a different pattern, with the lowest ORs being for the ‘mostly heterosexual’ (1.5); then the ‘gay/lesbian’ group (2.9) and the highest was in the ‘bisexual’ group (3.9). Cannabis abuse was the only substance use disorder to show a significant association with sexuality group and remained significant after adjustment for covariates (p < 0.01). The highest OR for cannabis abuse after adjustment was in the ‘bisexual’ group (2.4). The overall association between sexuality classification and the count measure of total number of disorders remained statistically significant (p = 0.0001) after adjustment. IRRs ranged from 1.1 (‘gay/lesbian’ group) to 1.6 (‘bisexual’ group).
Table 3. Rate ratios and 95% confidence intervals for mental and substance use disorders by sexual minority group with heterosexual as the reference group, before and after adjustment for covariate factors
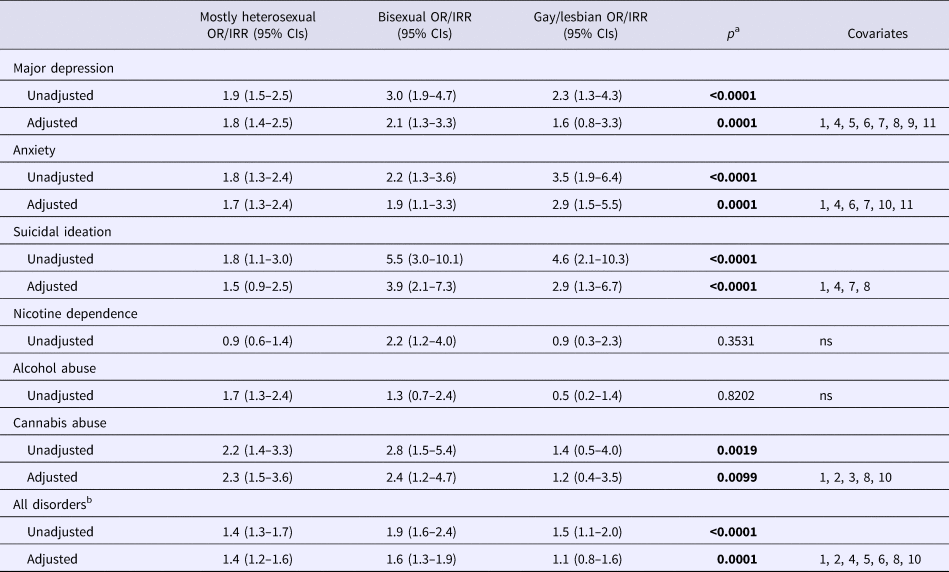
ORs, odds ratios; CIs, confidence intervals.
a Log-likelihood χ2.
b Incidence rate ratio.
Significant covariates: (1) sex; (2) socio-economic status at birth; (3) father lacks formal educational qualifications; (4) childhood sexual abuse to age 16; (5) parental intimate partner violence to age 16; (6) conduct problems at ages 7–9; (7) neuroticism at age 14; (8) novelty seeking at age 16; (9) IQ at ages 8–9; (10) self-esteem at age 15; (11) internalising symptoms at ages 7–9.
Sexual fluidity
A limitation of the latent class analysis above is that it does address the issue of fluidity or change in sexuality over time. Problems of data sparseness precluded in-depth analysis of sexual fluidity within the latent class framework. However, it was possible to conduct a limited exploration of this issue using the observed report data on sexual identity, attraction and fantasy at ages 25, 30 and 35 to examine: (a) factors associated with fluidity in reports of sexuality; and (b) whether fluidity in reporting was related to experience of mental disorder. See online Supplementary Material for additional detail.
Overall, 12% of the sample was classified as giving fluid responses to sexuality questions and 76% of those giving fluid responses were female. On logistic regression three factors were identified as significant (p < 0.05) predictors of fluidity. Women, those who had been exposed to more severe sexual abuse and those whose mothers adopted a more over-controlling parenting style were more likely to be fluid in their reporting of sexuality.
Online Supplementary Table S6 shows rates of mental health problems in each latent class cross-classified by age and fluidity of reporting. There was little evidence to suggest that fluidity was systematically related to the experience of mental health problems. Those who were fluid in their reporting had higher rates of some disorders at some time points and lower rates at other times. These observations were confirmed in multivariable modelling that showed no evidence of statistically significant main effects for fluidity, or interactions of fluidity with time or sexuality latent class.
Discussion
In this study, we have used latent class modelling and sexuality data gathered at five assessments, at ages 18, 21, 25, 30 and 35 years, to classify participant's sexuality and the extent to which those classified as sexual minorities experience mental and substance use disorder. To our knowledge, this is the first study to classify sexuality using multiple sexuality questions across five assessments that spanned 17 years.
The assessment of sexual orientation
The resulting four class latent model categorised 82% of the sample as being ‘heterosexual’. The remaining 18% were classified as follows: 12.6% ‘mostly heterosexual’, 3.5% ‘bisexual’ and 1.9% as ‘gay/lesbian’. Sexuality indicators (behaviour, identity, attraction and fantasy) from the sample indicate that a small number of those classified as ‘heterosexual’ had, at some point up to the age of 35 years, reported a same-sex experience (2.9%) and same-sex or bisexual fantasy (4.8%). For the ‘mostly heterosexual’ group, the behavioural figures were larger, with 14.5% reporting ever having a same-sex relationship and over 50% reporting same-sex experience. These sexuality measures rise further in the ‘bisexual’ and ‘gay/lesbian’ groups.
The prevalence of sexual minorities in this study was 18%. Comparisons to other studies reporting prevalence are problematic because most studies do not employ multiple questions about sexuality over several assessments. An earlier analysis of this cohort (Fergusson et al., Reference Fergusson, Horwood, Ridder and Beautrais2005) found that a three class latent model was the best fit for the data and estimated sexual minorities to be about 12% of the sample. It is not surprising that the percentage of sexual minorities in this cohort has increased because (a) participants have had two more occasions at which to describe their sexuality, and (b) attitudes towards sexual minorities have become more tolerant in the intervening ten years. For example, legislation has been introduced which allows same-sex civil unions from 2005 onwards (Ministry of Justice, 2004). Other New Zealand studies have reported the prevalence of sexual minorities (based on sexual attraction) as between 7.1% and 17.5% (Dickson et al., Reference Dickson, van Roode, Cameron and Paul2013) and a UK study which included sexual identity, behaviour and attraction reported that sexual minorities represent 14% of the population (Ellison and Gunstone, Reference Ellison and Gunstone2009). Additionally, the largest sexual minority group were the ‘mostly heterosexuals’ which concurs with previous sexual minority research (Vrangalova and Savin-Williams, Reference Vrangalova and Savin-Williams2014; Krueger et al., Reference Krueger, Meyer and Upchurch2018).
Recently, a comprehensive review (Savin-Williams and Vrangalova, Reference Savin-Williams and Vrangalova2013) has reported that women tend to endorse sexual identities or attraction of mostly heterosexual or bisexual more than men do but that the trend reverses for gay/lesbian identity, where more men than women endorse gay/lesbian identity or attraction. In this sample women consistently outnumbered men in all of the sexual minority categories. There are a number of possible explanations for this finding. First, the classification described here uses five measures of sexuality over five assessments spanning 17 years. Very few studies use this type of longitudinal data and it may be that studies that only assess sexual identification and sexual attraction in cross-sectional data underestimate rates of homosexuality in women. Further, women consistently report a more fluid (or flexible) sexuality (Diamond, Reference Diamond2016) and the longitudinal design of this study may reflect that some women will have more frequent same-sex sexual attraction, identity, fantasy or behaviour over the course of adulthood than men who may be less fluid in their sexuality. Supporting this explanation are data from other New Zealand studies which have reported that young women engage in more same-sex sexual behaviour than men (Dickson et al., Reference Dickson, Paul and Herbison2003; Wells et al., Reference Wells, McGee and Beautrais2011). It is possible that the results presented here were subject to measurement error because data were collected by face-to-face or telephone interviews rather than self-administered modes of data collection which give the respondent more perceived anonymity (Burkill et al., Reference Burkill, Copas, Couper, Clifton, Prah, Datta, Conrad, Wellings, Johnson and Erens2016). However, this seems unlikely because the rates of sexual minorities reported in this paper (18%) are similar to or a little higher than other studies (Ellison and Gunstone, Reference Ellison and Gunstone2009; Dickson et al., Reference Dickson, van Roode, Cameron and Paul2013).
Sexual minorities and mental health
The inequalities of mental health disorders for sexual minorities has been confirmed in many studies recently (Plöderl and Tremblay, Reference Plöderl and Tremblay2015) and the present study supports these findings. The outcomes presented here of increased rates of depression, anxiety and suicidal ideation expand on the results of two previous studies of this cohort (Fergusson et al., Reference Fergusson, Horwood and Beautrais1999; Fergusson et al., Reference Fergusson, Horwood, Ridder and Beautrais2005). The present study found that four latent classes of sexuality were a better fit than three, allowing for the separation of those classified as ‘bisexual’ and ‘gay/lesbian’. The ‘gay/lesbian’ group showed higher rates and odds ratios for anxiety compared to the ‘bisexual’ group which suggests that more experience of same-sex sexual behaviour, attraction, identity and fantasy infers a greater risk of this problem. However, the ‘bisexual’ group had higher odds ratios for depression, suicidal ideation and for all disorders than all other groups indicating that this group has a similar or heightened risk for mental disorder compared to those classified as ‘gay/lesbian’, congruent with a recent review (Ross et al., Reference Ross, Salway, Tarasoff, MacKay, Hawkins and Fehr2018). We did not find evidence of significant sex by sexuality interactions, in contrast to a previous study of this cohort (Fergusson et al., Reference Fergusson, Horwood, Ridder and Beautrais2005). This may be because the current measure of sexuality is based on more items over a longer period, resulting in a greater proportion of the sample being classified into the sexuality minority groups than happened previously.
Extending the previous findings of this cohort, we have shown that rates of mental disorder continue to be higher in sexual minorities throughout adulthood to age 35 after adjustment for covariates, and that includes those classified as ‘mostly heterosexual’. Additionally, we found rates of negative mental health outcomes are higher in sexual minorities than in their heterosexual counterparts, regardless of when they expressed any same-sex attraction, behaviour, identity and fantasy. This may indicate that participants are experiencing internalised aspects of minority stress (such as internalised homophobia) before (or after) they have reported any same-sex attraction, identity, fantasy or behaviour. However, we have not measured minority stress so this comment is speculative. The results also suggest that although an individual may change the way in which they report their sexuality over time (fluidity) it does not mean that the source or nature of minority stress has also changed. The results reported here, that there was no difference in mental health outcomes between fluid and non-fluid individuals classified as sexual minorities, supports this assertion (see online Supplementary Material).
There is a growing interest in sexual fluidity and factors associated with it (Baumeister, Reference Baumeister2000; Diamond, Reference Diamond2016). In common with other reports (Mock and Eibach, Reference Mock and Eibach2012; Dickson et al., Reference Dickson, van Roode, Cameron and Paul2013), this study found that more women than men exhibited fluidity in reporting as did those exposed to childhood sexual abuse and, to a lesser extent, those with over-controlling parents. As far as we are aware this has not been reported before but is not surprising to the extent that severity of sexual abuse has been shown to have pervasive influences on adult functioning (Fergusson et al., Reference Fergusson, McLeod and Horwood2013). We found minimal evidence of linkages between fluidity and risk of mental health problems. However, we were limited by data sparseness in the extent to which we could explore this issue in depth.
Apart from cannabis abuse, we did not find that rates of substance abuse in sexual minorities were significantly different from the ‘heterosexual’ group. Generally, the findings for substance use disorder or health risk behaviours in sexual minorities are that they are at increased risk for these problems (King et al., Reference King, Semlyen, Tai, Killaspy, Osborn, Popelyuk and Nazareth2008). Much of the research has been conducted in adolescence or early adulthood and results presented here may reflect attenuation of these problems as people age. Interestingly, for alcohol use disorder the group with the highest rates were the ‘mostly heterosexual’ group, although the four groups were not statistically different from each other. Corliss et al. (Reference Corliss, Rosario, Wypij, Fisher and Austin2008) also found that mostly heterosexual adolescents had higher levels of alcohol use than heterosexuals and other sexual minority groups and the results here suggests that problematic drinking in this group may continue into adulthood. It also highlights the importance of not aggregating sexual minorities into one group because this may obscure important variations in the data.
Strengths and limitations
The latent class analysis of sexual orientation over time using multiple indicators in a population sample overcomes the common methodological problems seen in sexuality research. Outcomes in sexuality research have been shown to be influenced by the use of different operational definitions of sexuality (Matthews et al., Reference Matthews, Blosnich, Farmer and Adams2014). We have circumnavigated this problem by using multiple indicators of sexual behaviour, attraction, identity and fantasy. Additionally, by using longitudinal rather than cross-sectional data participants have multiple opportunities to describe their sexual orientation rather than just one point in time. The latent class model presented here also takes into account sexual fluidity because the data were collected five times over 17 years so fluctuations in sexuality over time are accounted for. This means that sexually fluid individuals, whose sexual preferences change over time, can be accurately classified. However, with this approach changes or fluidity in the reporting of sexuality over time are reflected in the response probabilities of the latent class model (see online Supplementary Table S4), rather than explicitly in the latent class classification.
The other strengths of this study are that the data are from a large representative cohort that has good retention rates which overcome the bias associated with using convenience samples. Additionally, covariates were collected prospectively throughout childhood. However, the study is not without limitations. All data are self-report and are therefore open to the usual biases associated with this kind of reporting including underreporting or misreporting of sensitive topics such as sexuality. Without external validation of sexuality variables the possibility of distortion from self-report remains. However, participants struggling with their sexuality are presumably more likely to underreport options related to same-sex behaviour, attraction, identity and fantasy making it more likely that any bias would be from underestimation of psychological problems associated with same-sex classification rather than overestimation. Finally, the data were collected in 2012 or earlier and in the intervening years further anti-discrimination laws [e.g. the right for same-sex couples to marry in New Zealand: Marriage (Definition of Marriage) Amendment Act (Government of New Zealand, 2013)] have come into force indicating more tolerance to sexual minorities. More tolerant attitudes may result in a lower burden of mental health problems for those with same-sex tendencies.
Implications
The present findings add to the evidence that sexual minority individuals are at risk of increased mental health problems, compared to heterosexuals, and that these problems are present across adulthood. We found little evidence of associations between substance use and sexuality, contrary to much of the research, and this may be because of methodological differences or remission of these difficulties as people age. Either explanation warrants further investigation. The most likely explanation of increased rates of mental health difficulties in sexual minorities is because of increased stigma and stress experienced by minority members, usually called minority stress (Meyer, Reference Meyer2003; Bränström, Reference Bränström2017). What is concerning is that the mental health disparities continue to be a significant problem as people move towards middle-age, indicating that treatment has either not been sought or has been ineffective. Further research is needed to clarify why mental health disparities persist in sexual minorities.
Supplementary material
The supplementary material for this article can be found at https://doi.org/10.1017/S0033291719001284.
Author ORCIDs
J. K. Spittlehouse, 0000-0002-6765-4573.
Acknowledgements
We thank all the CHDS study participants who give their time so readily.
Financial support
This research was conducted during the tenure of a Health Sciences Career Development Award of the University of Otago. The CHDS is funded by the Health Research Council of New Zealand (Programme Grant 16/600).
Conflict of interest
None.
Ethical standards
The authors assert that all procedures contributing to this work comply with the ethical standards of the relevant national and institutional committees on human experimentation and with the Helsinki Declaration of 1975, as revised in 2008.


