


Introduction
The high heritability of attention deficit hyperactivity disorder (ADHD), averaging at 76% (Faraone et al. Reference Faraone, Perlis, Doyle, Smoller, Goralnick, Holmgren and Sklar2005), has led to studies aiming to identify cognitive endophenotypes that underlie the genetic liability for the disorder (Castellanos & Tannock, Reference Castellanos and Tannock2002; Kuntsi et al. Reference Kuntsi, McLoughlin and Asherson2006a). One of the cognitive indices most strongly associated with ADHD at the phenotypic level is reaction time (RT) variability (Kuntsi et al. Reference Kuntsi, Oosterlaan and Stevenson2001; Klein et al. Reference Klein, Wendling, Huettner, Ruder and Peper2006), which has made it a potential target for genetic studies.
Although RT variability may not have the instant appeal of neater cognitive neuroscientific concepts – on the surface it could be viewed as the ‘noise’ that we typically aim to reduce in our data – its greater sensitivity to ADHD compared to traditional measures of task performance (Kuntsi et al. Reference Kuntsi, Oosterlaan and Stevenson2001; Klein et al. Reference Klein, Wendling, Huettner, Ruder and Peper2006) call for a rigorous investigation of this measure. RT variability may reflect lapses in attention and hence relates to the role of sustained attention in ADHD. In aiming to explain RT variability and poor sustained attention, models of ADHD emphasize alternatively the top-down cortical control of executive attention (Bellgrove et al. Reference Bellgrove, Hester and Garavan2004, Reference Bellgrove, Hawi, Kirley, Gill and Robertson2005) or the role of low arousal and alertness in leading to poor attentional control (van der Meere, Reference van der Meere and Sandberg1996, Reference van der Meere and Sandberg2002; O'Connell et al. Reference O'Connell, Bellgrove, Dockree, Lau, Fitzgerald and Robertson2008) or both (Johnson et al. Reference Johnson, Kelly, Bellgrove, Barry, Cox, Gill and Robertson2007). Two recent studies that directly measured arousal support the association between decreased arousal and increased RT variability in ADHD: Loo & Smalley (Reference Loo and Smalley2008) reported an association between RT variability and electroencephalogram (EEG)-indexed underarousal, whereas O'Connell et al. (Reference O'Connell, Bellgrove, Dockree, Lau, Fitzgerald and Robertson2008) established a similar association using skin conductance measures.
The proposal that increased RT variability in ADHD relates to underarousal under low stimulation conditions links to theoretical models that view the regulation of state as the key difficulty in ADHD (van der Meere, Reference van der Meere and Sandberg2002; Sergeant, Reference Sergeant2005). According to this view, cognitive performance deficits in ADHD, such as RT variability, disappear under conditions that successfully optimize the child's arousal, activation or effort state. We recently demonstrated with the present sample that RT variability, and also the slow overall speed, normalized to group means in children with high ADHD symptoms on an RT task called the ‘fast task’ under a condition that combined a fast event rate and incentives (Kuntsi et al. Reference Kuntsi, Wood, Van Der Meere and Asherson2009). These findings extend our previous finding with a clinically diagnosed ADHD group, where RT variability on the same task improved more among the ADHD group than the control group but did not completely normalize (Andreou et al. Reference Andreou, Neale, Chen, Christiansen, Gabriels, Heise, Meidad, Muller, Uebel, Banaschewski, Manor, Oades, Roeyers, Rothenberger, Sham, Steinhausen, Asherson and Kuntsi2007). Overall, the findings suggest that RT variability in ADHD can be modulated, at least in part, by energetic or motivational factors.
RT performance is under at least a moderate degree of genetic influence, as indicated by our univariate twin model fitting analyses on approximately 60% of the present sample (Kuntsi et al. Reference Kuntsi, Rogers, Swinard, Borger, Meere, Rijsdijk and Asherson2006b). For both mean RT and RT variability, we obtained the highest heritability estimates when using composite scores, based on two tasks. These heritability estimates increased further, from 60% to 73% for mean RT and from 48% to 68% for RT variability, when corrected for measured test–retest unreliability (Kuntsi et al. Reference Kuntsi, Rogers, Swinard, Borger, Meere, Rijsdijk and Asherson2006b). This suggests a similar degree of underlying heritability for the RT variables as for ADHD.
The evidence for shared genetic effects on ADHD and RT variability first emerged in a small-scale twin study (Kuntsi & Stevenson, Reference Kuntsi and Stevenson2001) and further support has since emerged from twin and family studies by independent groups (Nigg et al. Reference Nigg, Blaskey, Stawicki and Sachek2004; Bidwell et al. Reference Bidwell, Willcutt, Defries and Pennington2007). For the first time reporting such data for the ‘fast task’, we recently estimated within a sibling design that 60% (or 100% for a male-only subsample) of the phenotypic association between ADHD and RT variability was due to shared familial influences (Andreou et al. Reference Andreou, Neale, Chen, Christiansen, Gabriels, Heise, Meidad, Muller, Uebel, Banaschewski, Manor, Oades, Roeyers, Rothenberger, Sham, Steinhausen, Asherson and Kuntsi2007).
Despite these advances in our understanding of the association between ADHD and RT variability, we know little about whether this aetiological pathway is shared with other affected cognitive processes in ADHD. Furthermore, the shared versus unique aetiological association with ADHD has not been investigated across the two RT constructs of mean RT and RT variability. Our sibling study on clinically diagnosed ADHD indicated shared familial effects on mean RT and ADHD and RT variability and ADHD (Andreou et al. Reference Andreou, Neale, Chen, Christiansen, Gabriels, Heise, Meidad, Muller, Uebel, Banaschewski, Manor, Oades, Roeyers, Rothenberger, Sham, Steinhausen, Asherson and Kuntsi2007) but a multivariate approach between the two RT constructs has as yet been lacking. ADHD is also associated with lower IQs, which we and others showed to be due to shared genetic influences, for both ADHD diagnosis and continuous ADHD symptom scores in the general population (Kuntsi et al. Reference Kuntsi, Eley, Taylor, Hughes, Asherson, Caspi and Moffitt2004; Polderman et al. Reference Polderman, Gosso, Posthuma, Van Beijsterveldt, Heutink, Verhulst and Boomsma2006). Although one study reports a limited shared genetic aetiology between measures of mean choice RT and IQ in adolescence (with both shared and measure-specific genetic effects; Luciano et al. Reference Luciano, Wright, Geffen, Geffen, Smith and Martin2004), this finding would benefit from replication in school-age children when ADHD may be first diagnosed. It is also not clear whether any aetiological pathway between IQ and RT (Luciano et al. Reference Luciano, Wright, Geffen, Geffen, Smith and Martin2004) contributes to the covariation between ADHD and RT (Andreou et al. Reference Andreou, Neale, Chen, Christiansen, Gabriels, Heise, Meidad, Muller, Uebel, Banaschewski, Manor, Oades, Roeyers, Rothenberger, Sham, Steinhausen, Asherson and Kuntsi2007). Here, our main aim was to address the novel question of whether there is a shared set of genes that influence RT variability, mean RT, IQ and ADHD symptom scores or whether separate aetiological pathways exist. In addition, focusing on RT variability, we aimed to investigate how we can maximally increase its detectable genetic association with ADHD symptom scores, to maximize its usefulness for molecular genetic studies. These analyses further incorporate the aim of replicating the findings of shared genetic influences on ADHD and RTV, and on ADHD and IQ, using a general population sample.
Method
Sample and procedure
The participants are members of the Study of Activity and Impulsivity Levels in children (SAIL), a study of a general population sample of twins at age 7 to 10 years. The sample was recruited from a birth cohort study, the Twins' Early Development Study (TEDS; Trouton et al. Reference Trouton, Spinath and Plomin2002), that had invited parents of all twins born in England and Wales during 1994–1996 to enrol. Despite attrition, the TEDS families continue to be reasonably representative of the UK population with respect to parental occupation, education and ethnicity (Spinath & O'Connor, Reference Spinath and O'Connor2003). Zygosity has been determined using a standard zygosity questionnaire that has been shown to have 95% accuracy (Price et al. Reference Price, Freeman, Craig, Petrill, Ebersole and Plomin2000).
Families on the TEDS register were invited to take part, if they fulfilled the following SAIL project inclusion criteria: twins' birthdates between 1 September 1995 and 31 December 1996; living within a feasible travelling distance (return daytrip) from the Research Centre; ethnic origin white European (to reduce population heterogeneity for molecular genetic studies); recent participation in TEDS, as indicated by return of questionnaires at either 4- or 7-year data collection point; no extreme pregnancy or perinatal difficulties (15 pairs excluded), specific medical syndromes and chromosomal anomalies (two pairs excluded) or epilepsy (one pair excluded); not participating in other current TEDS substudies (45 pairs excluded); and not on stimulant or other neuropsychiatric medications (two pairs excluded).
Of the 1230 suitable families on the register whom we contacted, 672 families agreed to participate, reflecting a participation rate of 55%. Thirty individual children were subsequently excluded (16 children with IQ<70, three children due to epilepsy, three children due to mild autism, two with obsessive–compulsive disorder, and one child due to each of the following: neurofibromatosis, hyperthyroidism, dyspraxia, severe autism, sickness on day of testing and on stimulant medication for ADHD). This left a final sample of 1314 children. All participants were invited to a research centre for cognitive assessment (see Kuntsi et al. Reference Kuntsi, Rogers, Swinard, Borger, Meere, Rijsdijk and Asherson2006b), where Conners' rating scale data by the parents were collected for the sample. The final sample consisted of 513 identical (monozygotic, MZ) twins (data for 255 complete twin pairs), 374 same-sex non-identical (dizygotic, DZ) twins (data for 184 complete twin pairs) and 427 opposite-sex DZ twins (207 complete twin pairs). The data for the remaining 22 ‘singleton’ twins were also used for model fitting in the structural equation modelling (see Neale et al. Reference Neale, Boker, Xie and Maes2006). The mean age was 8.83 years (s.d.=0.67), with similar proportions of boys (49%) and girls (51%). Parents of all participants gave informed consent and the Institute of Psychiatry Ethical Committee approved the study.
The families visited the Research Centre for the assessments. Two testers assessed the twins simultaneously in separate testing rooms. The tasks were administered in a fixed order as part of a more extensive test session, which in total (including breaks) lasted approximately 2.5 h.
Measures
Wechsler Intelligence Scales for Children, Third Edition (WISC-III; Wechsler, Reference Wechsler1991)
The vocabulary, similarities, picture completion and block design subtests from WISC-III were used to obtain an estimate of the child's IQ [pro-rated following procedures described by Sattler (Reference Sattler1992)].
The go/no-go task (van der Meere et al. Reference van der Meere, Stemerdink and Gunning1995; Borger & van der Meere, Reference Borger and van der Meere2000; Kuntsi et al. Reference Kuntsi, Andreou, Ma, Borger and van der Meere2005)
On each trial, one of two possible stimuli appeared for 300 ms in the middle of a computer screen. The child was instructed to respond only to the ‘go’ stimuli and to react as quickly as possible, but to maintain a high level of accuracy. The proportion of ‘go’ stimuli to ‘no-go’ stimuli was 4:1. The slow condition had an interstimulus interval (ISI) of 8 s and consisted of 72 trials. A practice session preceded the experimental condition. The response variables we focused on were mean RT (MRT) to ‘go’ stimuli and standard deviation of the RTs [RT variability (RTV)].
The fast task (Kuntsi et al. Reference Kuntsi, Andreou, Ma, Borger and van der Meere2005, Reference Kuntsi, Rogers, Swinard, Borger, Meere, Rijsdijk and Asherson2006b; Andreou et al. Reference Andreou, Neale, Chen, Christiansen, Gabriels, Heise, Meidad, Muller, Uebel, Banaschewski, Manor, Oades, Roeyers, Rothenberger, Sham, Steinhausen, Asherson and Kuntsi2007)
The baseline condition (72 trials) followed a standard warned four-choice RT (Leth-Steensen et al. Reference Leth-Steensen, Elbaz and Douglas2000). A warning signal (four empty circles, arranged side by side) first appeared on the screen. At the end of the fore period of 8 s (presentation interval for the warning signal), the circle designated as the target signal for that trial was filled (coloured) in. The child was asked to make a compatible choice by pressing the response key that directly corresponded in position to the location of the target stimulus. Following a response, the stimuli disappeared from the screen and a fixed inter-trial interval of 2.5 s followed. Speed and accuracy were emphasized equally. If the child did not respond within 10 s, the trial terminated. First a practice session was administered, during which the child had to respond correctly to five consecutive trials. The response variables are MRT and RTV, calculated based on correct responses only.
Phenotype selection
We include data here from the go/no-go slow condition and fast task baseline condition only, which our previous analyses on the present sample indicated were associated with ADHD (both when using continuous and categorical definitions of ADHD; Kuntsi et al. Reference Kuntsi, Wood, Van Der Meere and Asherson2009).
Cross-task phenotypic correlations were in the moderate range across the go-no/go and fast task data [MRT r=0.44, 95% confidence interval (CI) 0.40–0.49; RTV r=0.35, 95% CI 0.30–0.40]. Initial bivariate analyses indicated that across both cognitive indices, the underlying genetic aetiology was largely shared [MRT genetic correlation (r A)=0.62, 95% CI 0.37–0.92; RTV r A=0.64, 95% CI 0.25–1.00]. Given our previous analyses supporting the creation of composite RT scores (Kuntsi et al. Reference Kuntsi, Rogers, Swinard, Borger, Meere, Rijsdijk and Asherson2006b), in the models a latent factor score across both conditions was used, to capture the common variation. Models were repeated, using a mean score, and the pattern of results remained the same (not presented here, but available from A.C.W. upon request).
Rating scales
ADHD symptoms were measured using the Long Version of Conners' Parent Rating Scale (CPRS-R:L; Conners et al. Reference Conners, Sitarenios, Parker and Epstein1998a) and the Long Version of Conners' Teacher Rating Scale (CTRS-R:L; Conners et al. Reference Conners, Sitarenios, Parker and Epstein1998b). On both the parent and teacher Conners' scales, summing the scores on the nine-item hyperactive-impulsive and nine-item inattentive DSM-IV symptoms subscales forms a total DSM-IV ADHD symptoms subscale. We created an ADHD composite score by taking a mean of the scores on the parent and teacher DSM-IV ADHD symptoms subscales. In a few cases, missing data in Conners' scales were pro-rated (i.e. a summary score based on the mean of individual questions on the rest of the subscale was used) if there was more than 75% completion for each subscale.
Analyses
The structural equation modelling program Mx (Neale et al. Reference Neale, Boker, Xie and Maes2006) was used to conduct the genetic analyses and to estimate correlations. Models were fitted to age- and sex-regressed residual scores and the unstandardized residuals were transformed using the optimized minimal skew command in Stata version 9.2 (StataCorp, USA). Participants with incomplete data were included in the analyses, as Mx provides a method for handling incomplete data by using raw maximum likelihood estimation, in which a likelihood statistic (−2LL) of the data for each observation is calculated.
Genetic models
Univariate genetic analyses use twin correlations for a trait and, on the basis that MZ twins share 100% of their segregating alleles and DZ twins share 50% of additive genetic influences and also 25% of non-additive genetic influences, partition the phenotypic variance of the measures into additive genetic (A), dominance (D) or shared environmental (C), and child-specific environmental (E) effects. Any possible measurement error is subsumed under the E effects (Rijsdijk & Sham, Reference Rijsdijk and Sham2002). For IQ and RT measures, the DZ correlations were around or more than half of the MZ correlations, which indicated a possible shared environmental component to the behaviour. For the ADHD ratings the MZ correlations were more than twice the DZ correlations, which in the absence of significant MZ/DZ variance differences (p=0.07) indicated that an ADE model would be a good fit. In all cases the best-fitting univariate model reflected the expectations from the ratio of MZ:DZ twin correlations, as outlined above. These preliminary analyses indicated that there were neither qualitative nor quantitative sex differences underlying the variance in traits, although there were phenotypic variance differences between males and females, which were accounted for in the multivariate modelling by the inclusion of a scaling factor.
Multivariate genetic models between IQ, MRT, RTV and ADHD composite score
Multivariate genetic analyses use the power given by the MZ:DZ ratio of cross-twin cross-trait correlations to decompose the covariation between traits into A, C or D and E influences. That is, one twin's score on one trait correlating with the co-twin's score on another trait imply familial (A+D/C) influences on the covariation between traits. With twin data this can be further separated into genetic and shared environmental influences using the same logic as with univariate modelling (Rijsdijk & Sham, Reference Rijsdijk and Sham2002).
Latent factor model (Fig. 1)
Here the variance in variables is decomposed into that which is shared between RTV or MRT across the two tasks (a phenotypic latent factor), and that which is unique to each task or phenotype. A triangular, or Cholesky, decomposition is used to decompose the variance in each latent phenotype, and covariance between the phenotypes, into A, D/C and E influences. This allows an estimate to which some phenotypes covary independent of others (i.e. the extent to which MRT and RTV covary, independent of any influences shared with IQ). When this is the case, the ordering of variables in the model is decided a priori for computational reasons. However, when looking at absolute aetiological correlation, irrespective of the aetiological influences shared with other variables, the order of variables is arbitrary and the model can be converted to a correlated factors solution (Loehlin, Reference Loehlin1996). This is a mathematically equivalent solution of the triangular decomposition, where the variance in each phenotype is decomposed into A, C/D and E influences, and the correlations between variance components for each phenotype are estimated.
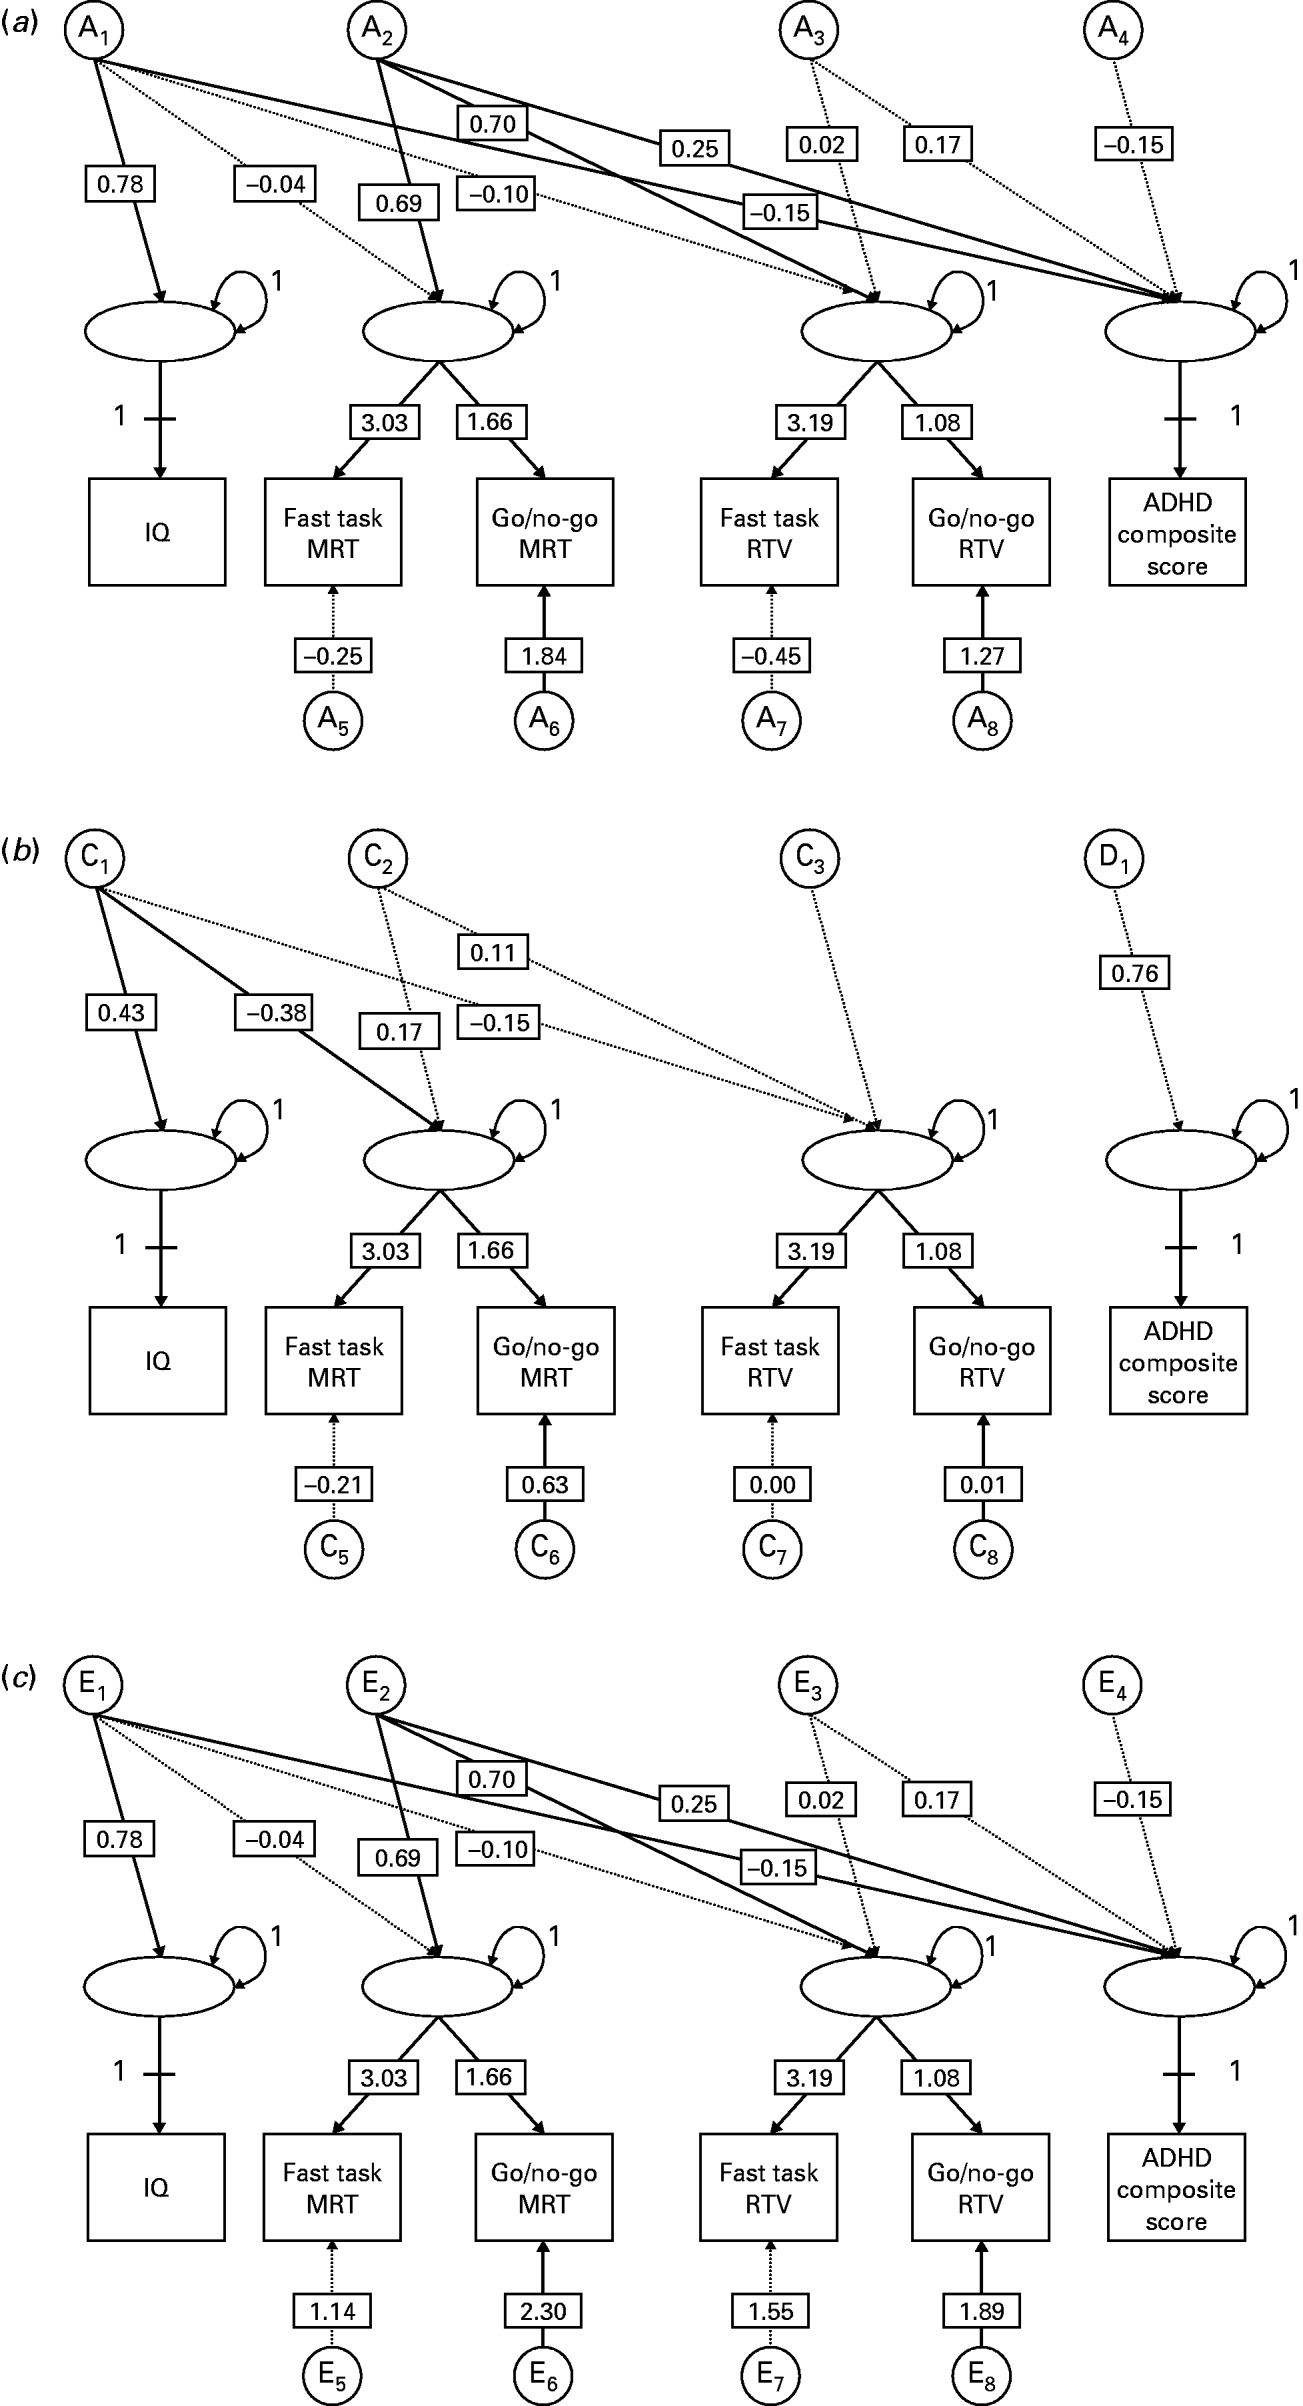
Fig. 1. Latent factor model across IQ, two measures of mean reaction time (MRT), two measures of reaction time variability (RTV) and an ADHD composite score. This model examines the variance covariance structure of latent phenotypic factors: some factors (IQ and ADHD) are represented by a 1:1 correspondence with the observed variable, while the MRT and RTV constructs are influenced by two observed indicator variables (fast task and go/no-go). An A, D/C and E model is fit to the four latent constructs, such that the variance in the latent factors is influenced by A1–4; C1–3; D1 and E1–4). Twin 1 only shown for simplicity. Latent factor loadings on IQ and ADHD constrained to 1. All parameter estimates are derived from the same model, presented separately here for clarity: (a) additive genetic parameter estimates plus factor loadings; (b) dominant genetic (ADHD composite score) and shared environment parameter estimates (IQ, MRT, RTV) plus factor loadings; (c) child-specific parameter estimates plus factor loadings.
Results
In all cases, to avoid artificially inflating parameters, estimates from full models (with 95% CIs) are provided, and non-significance is indicated by CIs that include zero. As assumed by the genetic model, phenotypic (Table 1) and twin (Table 2) correlations are presented from a constrained saturated model, where phenotypic correlations across twin 1 and twin 2 and across zygosity are equated. As there were no significant quantitative differences in variance components between the sexes, MZ and DZ correlations are not presented for each sex. However, given the scalar differences across sexes, means and standard deviations are broken down into sex- and zygosity-specific groups.
Table 1. Phenotypic correlations (with 95% confidence intervals in parentheses) across IQ, two measures of mean reaction time (MRT), two measures of reaction time variability (RTV), and an attention deficit hyperactivity disorder (ADHD) composite score

a Summed parent and teacher ratings.
Table 2. Within-pair correlations (with 95% confidence intervals in parentheses) plus means (and standard deviations) for and across IQ, two measures of mean reaction time (MRT), two measures of reaction time variability (RTV), and an attention deficit hyperactivity disorder (ADHD) composite score

s.d., Standard deviation; MZ, monozygotic; DZ, dizygotic, M, male; F, female.
a Summed parent and teacher ratings.
Latent factor model
By summing the contribution of genetics and environmental influences to the phenotypic correlation, the total phenotypic correlation can be ascertained as estimated by the model. Between a latent factor RTV score and ADHD composite score the phenotypic correlation was r=0.28, and between an MRT and ADHD composite score the phenotypic correlation was r=0.23, replicating results on single task variables (Kuntsi et al. Reference Kuntsi, Wood, Van Der Meere and Asherson2009).
The multivariate models further address the aetiological associations across MRT, RTV, IQ and the ADHD composite score (Table 3, Fig. 1). A high phenotypic correlation was estimated between the latent MRT and RTV factors at r=0.97, driven by an r A and r E of 1.00 (0.90–1.00 and 0.95–1.00 respectively) and an r C of 0.98 (−1.00 to +1.00). This implies that, when removing task-specific variance through the derivation of a latent factor score, MRT and RTV are indexing the same underlying liability.
Table 3. Standardized parameter estimates (with 95% confidence intervals) from genetic models estimating the aetiological influences within and across IQ, a latent mean reaction time (MRT) factor, a latent reaction time variability (RTV) factor and an attention deficit hyperactivity disorder (ADHD) composite score

a Summed parent and teacher ratings.
The heritability (with 95% confidence intervals) of each variable is given in bold on the diagonal. The genetic correlations between the pairs of variables (with 95% confidence intervals) are given below the diagonal. The contribution of genetic factors to the phenotypic correlation between variables is given above the diagonal, with the percentage of the phenotypic correlation that is due to genetic effects in parentheses. The same three types of information are presented for dominant genetic/shared environmental and child-specific environmental influences in the middle and lower thirds of the table respectively.
IQ showed a correlation of r=−0.23 (−0.29 to −0.17) with the latent MRT factor and −0.18 (−0.25 to −0.12) with the latent RTV factor. Although almost all of a latent RTV factor could be accounted for by aetiological influences shared with a latent MRT factor (Fig. 1), there were nonetheless some very small (non-significant) RTV-specific factors, leading to a slightly differential overlap with ADHD composite score. Seventy-six per cent of the covariance between a latent MRT factor and ADHD composite score arose out of genetic factors not shared with IQ, and 17% out of unshared environmental effects. For a latent RTV factor these figures were 66% and 25% respectively. These differences (between latent RTV and latent MRT) are unlikely to be meaningful and the main result is that, with a latent factor approach, approximately 92% of the covariation between ADHD composite score and the RT variables was not due to the covariation with IQ.
Discussion
Data from a large twin sample showed that the shared genetic influences on ADHD symptom scores and RT variability are largely shared with those on the overall slower speed of responding (mean RT). By contrast, the shared genetic influences on ADHD symptom scores and RT variability (or mean RT) are largely independent of the genetic influences that ADHD symptom scores share with IQ. These findings indicate partially separable sets of genetic influences on ADHD related to RT variability and IQ. These unique and shared aetiological pathways therefore illustrate two key components in the genetic architecture of the cognitive and energetic processes that underlie the behavioural symptoms of ADHD.
Unlike previous studies, the focus was on ADHD symptom scores in a general population sample, and we found similar findings to those obtained in clinical samples of children with a research diagnosis of ADHD and their siblings, that showed shared familial effects on ADHD and RT variability (Nigg et al. Reference Nigg, Blaskey, Stawicki and Sachek2004; Andreou et al. Reference Andreou, Neale, Chen, Christiansen, Gabriels, Heise, Meidad, Muller, Uebel, Banaschewski, Manor, Oades, Roeyers, Rothenberger, Sham, Steinhausen, Asherson and Kuntsi2007; Bidwell et al. Reference Bidwell, Willcutt, Defries and Pennington2007). These data therefore support the notion that we can generalize findings on ADHD from population to clinical datasets and provide further confirmation that familial effects observed in previous studies result largely from shared genes rather than shared environments.
We further showed that this finding is independent of the task used because the genetic correlation with the ADHD composite score, indicating here the proportion of shared additive genes, was 0.68 for RT variability from the go/no-go task and 0.64 for RT variability from the fast task. Shared additive genetic influences accounted for 72% of the phenotypic association between the ADHD composite score and RT variability from the go/no-go task, and for 65% of the phenotypic association between the ADHD composite score and RT variability from the fast task. Direct comparisons across the two RT variability variables indicated a similar degree of shared genetic aetiology between them. These genetic results add to the previous phenotypic results (Klein et al. Reference Klein, Wendling, Huettner, Ruder and Peper2006) that supported RT variability as a unitary construct. The findings of phenotypic and genetic association between ADHD and RT variability therefore seem to be robust, replicating across tasks, samples and definitions of ADHD (diagnosis versus a continuum of symptoms). We further found that there are shared risk factors for RT variability and mean RT. The high genetic and child-specific environmental correlations of 1.00 (95% CI 0.90–1.00 and 0.95–1.00 respectively) indicate that, when measurement error is removed, mean RT and RT variability indicate the same underlying liability. Overall these data confirm RT measures as central to our understanding of aetiological processes in ADHD in addition to their strong phenotypic association with the disorder. We also replicated our previous finding of shared genetic influences on ADHD symptom scores and IQ, obtaining a genetic correlation of approximately −0.40, with 69% of the phenotypic correlation estimated as due to shared genetic influences (the figures were −0.45 and 86% respectively in Kuntsi et al. Reference Kuntsi, Eley, Taylor, Hughes, Asherson, Caspi and Moffitt2004). Previous research using mean choice RT indicated that mean RT and IQ may be influenced by a unitary genetic factor in addition to construct-specific genetic factors (Luciano et al. Reference Luciano, Wright, Geffen, Geffen, Smith and Martin2004). In the current analyses, although IQ showed some phenotypic association with the RT variables, with correlations of up to −0.22, the genetic correlations between RT variables and IQ were small (mean RT: −0.06; RTV: −0.14) and non-significant. Yet 66–76% of the covariation between RT variability and ADHD symptom scores was due to genetic factors not shared with IQ. Taking into account environmental influences, approximately 92% of the overlap between RT variables and ADHD symptom scores were accounted for by aetiological influences that were not shared with IQ. This novel finding indicates that IQ does not mediate the association between ADHD symptoms and RT performance and that IQ and RT performance measures index largely separate genetic influences on the risk for ADHD.
The findings here relate to ADHD symptoms as measured in a general population sample of children aged 7 to 10, and hence the applicability to a clinical diagnosis of ADHD and across a wider age range needs to be established in future research. The phenotypic correlation between ADHD symptom scores and IQ was slightly lower than in our previous study (Kuntsi et al. Reference Kuntsi, Eley, Taylor, Hughes, Asherson, Caspi and Moffitt2004), further emphasizing the need to replicate the novel findings reported here in other samples. Although the correlations between ADHD symptom scores and the RT variables were also relatively modest, in our previous analyses on this sample we showed how correlations of this magnitude translate to highly significant group differences between children with high ADHD symptoms and controls (with odd ratios of up to 1.70; Kuntsi et al. Reference Kuntsi, Wood, Van Der Meere and Asherson2009). Similarly comparing across dimensional and categorical approaches in our previous study on ADHD and IQ, the correlation of −0.28 translated to difference of nine IQ points in the ADHD–control group comparison (Kuntsi et al. Reference Kuntsi, Eley, Taylor, Hughes, Asherson, Caspi and Moffitt2004).
Whereas many cognitive indices have been explored as candidate endophenotypes in ADHD (Castellanos & Tannock, Reference Castellanos and Tannock2002; Rommelse, Reference Rommelse2008; Rommelse et al. Reference Rommelse, Altink, Oosterlaan, Beem, Buschgens, Buitelaar and Sergeant2008), a multivariate genetic approach that can identify common and unique aetiological pathways has been lacking. The novel findings presented here provide direct evidence that a single aetiological pathway is unlikely to account for all cognitive impairments associated with ADHD symptoms and indicates separate groups of measures for genetic mapping studies.
Cognitive theories of ADHD differ in whether they propose a single underlying cause for the widespread behavioural and cognitive impairments associated with ADHD, or multiple aetiological pathways (Johnson et al. Reference Johnson, Wiersema and Kuntsi2009). In future research the alternative cognitive models can be further tested using multivariate genetic analyses on cognitive indices of a wider range of cognitive processes associated with ADHD. Furthermore, the multivariate genetic analyses, including the examination of composite scores, provide valuable data for future molecular genetic analyses, enabling a genetically informed approach to maximizing power in molecular genetic studies by reducing the overall number of variables tested for association with genotype data. One important clinical application may be to groups with lower general cognitive ability, where RT measures may help in the differentiation of ADHD from more general behavioural consequences related to lower IQ. The ability to isolate separate aetiological processes in ADHD is likely to have important implications for both diagnosis and treatment of ADHD, with the development of prevention and treatment strategies targeted at the different underlying aetiological processes involved.
Acknowledgements
The Study of Activity and Impulsivity Levels in children (SAIL) is funded by a project grant from the Wellcome Trust (GR070345MF) to J. Kuntsi. A. C. Wood is funded by the Economic and Social Research Council. All statistical analyses were conducted by A. C. Wood. Thank you to all who made this research possible: the TEDS-SAIL families, who give their time and support so unstintingly; R. Gibbs, H. Rogers, E. Salih, G. Swinard, K. Lievesley, K. O'Flynn, S. Marquis and R. Whittemore; and everyone on the TEDS team.
Declaration of Interest
None.


