


Introduction
In cross-national epidemiological studies, the sociodemographic correlates of mental disorders are consistent across countries, but the prevalence estimates of disorders vary widely (Scott, De Jonge, Stein, & Kessler, Reference Scott, De Jonge, Stein and Kessler2018). Earlier cross-national studies varied in methods, which may have contributed to varying prevalence estimates, but the WHO World Mental Health (WMH) Surveys (Kessler & Üstün, Reference Kessler and Üstün2008) sought to control methodological variation through the centralized coordination of surveys and the use of a common diagnostic instrument, the WMH-CIDI 3.0 (Kessler & Üstün, Reference Kessler and Üstün2004), to assess DSM-IV disorders in diverse countries. As more data from low-income WMH countries have become available, a pattern has emerged whereby prevalence of the vast majority of mental disorders is, on average, lower in the low-income WMH countries than in the high-income countries (Scott et al., Reference Scott, De Jonge, Stein and Kessler2018). This pattern is also apparent in studies beyond the WMH initiative. In a meta-analysis of the prevalence of common mental disorders in 63 countries, the highest lifetime prevalence was in high-income English speaking countries, with lower prevalence found in North and South East Asia and in Sub-Saharan Africa (Steel et al., Reference Steel, Marnane, Iranpour, Chey, Jackson, Patel and Silove2014). In addition, a recent study of 96 countries found suicide prevalence to be significantly lower in low-income countries compared to high-income countries (Dückers, Reifels, De Beurs, & Brewin, Reference Dückers, Reifels, De Beurs and Brewin2019).
Lower prevalence of mental disorders in lower- than in higher-income countries is unexpected, given: (i) the well-established inverse association between mental disorders and socioeconomic status within countries; and (ii) the numerous studies identifying life stress and traumatic events as predictors of mental disorders, factors that tend to be highly prevalent in low-income countries. These findings of lower mental disorder prevalence in lower-income countries are potentially of great theoretical interest, suggesting that there may be environmental or sociocultural factors that have the capacity to buffer the detrimental effects on mental health of stress, trauma and deprivation. The question remains, though, whether the low prevalence in low-income countries reflects true variation or methodological artefact. One of the limitations of the WMH surveys in adjudicating the issue is that it includes few truly low-income countries.
Against this background the present study offers two features of particular interest. First, it surveyed mental disorders using the WMH-CIDI in Nepal, one of the poorest countries worldwide, with a history of gender and ethnic/caste-based inequalities and years of insurgency that have been a continuous source of violence, intimidation and traumatic experience. Second, the study has several methodological characteristics expected to optimize the detection of mental disorders. These include a large, long-term panel sample with substantial prior success measuring sensitive topics, a high response rate, years of preliminary work establishing appropriate translation and clinical validation of the WMH-CIDI, and utilization of a novel life history calendar (LHC) integrated with the CIDI that was shown in an experimental sub-study to enhance recall of the experience and timing of mental disorder symptoms (Axinn et al., Reference Axinn, Chardoul, Gatny, Ghimire, Smoller, Zhang and Scott2020).
Methods
Sample
The assessment of mental disorders was undertaken in the Chitwan Valley Family Survey (CVFS). The CVFS launched in 1995 with a general population sample of 151 neighborhoods (clusters of 5–15 households) fully representative of Western Chitwan in Nepal (Barber, Shivakoti, Axinn, & Gajurel, Reference Barber, Shivakoti, Axinn and Gajurel1997). Years of previous research in Nepal by this team, combined with years of living in Chitwan among the study population, drove the innovative combinations of ethnography and survey research that characterize the CVFS (Axinn & Pearce, Reference Axinn and Pearce2006; Axinn, Barber, & Ghimire, Reference Axinn, Barber and Ghimire1997; Axinn, Ghimire, & Williams, Reference Axinn, Ghimire and Williams2012; Axinn, Pearce, & Ghimire, Reference Axinn, Pearce and Ghimire1999). Across more than 20 years, multiple rounds of interviews have generated very high quality data with high response rates, low refusal rates (less than 0.02%), low panel attrition, low level of item missing rates, and high reliability in measures (Axinn et al., Reference Axinn, Ghimire and Williams2012; Thornton, Ghimire, & Mitchell, Reference Thornton, Ghimire and Mitchell2012).
In 2016–2018 selected modules from the WMH-CIDI 3.0 were administered to the full CVFS sample aged 15–59. The response rate for this survey was 93%, generating 10 714 completed interviews.
All procedures were approved by the University of Michigan Institutional Review Board and by the Nepal Health Research Council. Written or verbal informed consent was obtained from all participants.
Measures
Diagnostic assessment
The WMH-CIDI is a fully structured diagnostic instrument administered by lay interviewers using computer-assisted methods (Kessler & Üstün, Reference Kessler and Üstün2004). Given the range of ethnic groups, languages and conceptualizations of mental health among the survey population it was recognized that the CIDI translation and validation process for Nepal would require a multi-method, multi-step approach, aiming at conceptual equivalence rather than literal translation.
A multiethnic team of long term CVFS researchers created a Nepal-specific version of the WMH-CIDI modules. This process required application of state-of-the-art survey methodology grounded in a mixed-method informed understanding of the local setting (see Supplementary Materials). The initial process took more than 3 years to produce clinically valid measures (Ghimire, Chardoul, Kessler, Axinn, & Adhikari, Reference Ghimire, Chardoul, Kessler, Axinn and Adhikari2013), resulting in a diagnostic instrument that was used in a large pilot survey for the main survey reported here. A team of bi-lingual Nepali psychiatrists were employed to repeatedly validate the CIDI translations against the Structured Clinical Interview for DSM-IV (SCID), resulting in the CIDI version used for the pilot study. This pilot version of the Nepal CIDI yielded strong validation results before being finalized for the full scale CVFS launch (Ghimire et al., Reference Ghimire, Chardoul, Kessler, Axinn and Adhikari2013).
To take this base design to the larger scale, the CVFS team employed a computer-assisted personal interviewing (CAPI) questionnaire application, a setting-specific life history calendar (LHC), and long term CVFS practices of supporting privacy, confidentiality and data security (details in Supplementary Materials). The CIDI questionnaire features screening for key symptoms of disorders and then, among those who screen positive, detailed diagnostic assessments for more than 30 disorders. However, achieving success with translation and adaptation required the CVFS team to limit the number of disorders. Based on guidance from local clinicians and health policy leaders, this Nepal-CIDI was limited to modules generating the disorders we report herein: major depressive disorder (MDD), bipolar disorder broad (BPD: bipolar I, II and subthreshold), panic disorder (PD), generalized anxiety disorder (GAD), alcohol abuse (ALA), alcohol dependence (ALD), post-traumatic stress disorder (PTSD), and intermittent explosive disorder (IED).
LHC-CIDI and age-of-onset
This study enhanced lifetime recall of mental disorders by linking the occurrence and timing of onset of disorders to existing measures of individual and community events. This LHC approach adds measures of highly memorable personal and family events to the matrix of memory cues given to respondents, creating personalized memory ‘anchors’ to facilitate recall of the occurrence and age-of-onset of psychiatric symptoms. In a sub-study that randomized two groups to receive either the LHC-CIDI or the conventional CIDI, the LHC-CIDI method significantly improved measurement of lifetime experience with mental disorder (Axinn et al., Reference Axinn, Chardoul, Gatny, Ghimire, Smoller, Zhang and Scott2020).
The LHC-CIDI was also clinically validated with the SCID in the largest clinical validation ever conducted in Nepal. The Nepal CIDI's two independent clinical validation studies demonstrate good concordance of the Nepal CIDI with the SCID, equaling or exceeding the performance of the WMH-CIDI in Europe and the USA (Axinn et al., Reference Axinn, Chardoul, Gatny, Ghimire, Smoller, Zhang and Scott2020; Ghimire et al., Reference Ghimire, Chardoul, Kessler, Axinn and Adhikari2013), although the CIDI is somewhat conservative relative to the SCID. Finally, as part of the CIDI diagnostic assessment, respondents were asked if their symptoms could have been caused by medical problems. A team of clinicians reviewed these responses and applied an organic exclusion where appropriate.
Sociodemographic variables
Correlates included age (in years), birth cohort (in age groups), gender, ethnicity, and education. Birth cohort is defined by age at interview 15–24, 25–34, 35–44, or 45–59 years. In Nepal race/ethnicity is complex, but in the CVFS study population six categories capture key aspects of the variance: Brahmin/Chhetri (high caste Hindus); Dalits (low caste Hindus); Hill Janjati (multiple ethnic groups of Tibetan origin, primarily Buddhist); Terai Janjati (multiple plains ethnic groups, primarily of Burmese decent); Newar; and others (primarily recent and temporary migrants from India). Education in schools only began to spread in Nepal in the 1970s, but by 2016 all children attended at least some school. In Nepal, a School Leaving Certificate (SLC) is awarded to those passing a nationally standardized exam offered after the successful completion of 10th grade.
12-month role impairment
Respondents were asked to rate the extent to which symptoms interfered with his or her life and activities in the worst month of the past year using the Sheehan Disability Scales (Leon, Olfson, Portera, Farber, & Sheehan, Reference Leon, Olfson, Portera, Farber and Sheehan1997). The latter are 0–10 visual analogue scales that ask how much a focal disorder interfered with home management, work/school, social life, and personal relationships using the response options none (0), mild (1–3), moderate (4–6), and severe (7–10).
A proportion of respondents meeting 12-month diagnostic criteria had missing Sheehan data. By disorder, missing rates were 23% for ALA, 32% (ALD), 10% (MDD), 1% (GAD), 36% (PTSD), 0 (PD), and 18% for BPD. Missing data were imputed with disorder-specific multivariate regression models that included measures of lifetime disorder symptom count and impairment, age-of-onset, comorbidity, ethnicity and education.
Analytic methods
Lifetime prevalence was estimated as the percent who met diagnostic criteria up to their age at interview; 12-month prevalence was estimated as the percent who were symptomatic in 12-months prior to interview. Age-of-onset and projected lifetime risk as of age 60 years were estimated using the two-part actuarial method implemented in STATA 15. In discrete-time survival analysis with person-years as the unit of analysis, logistic regression models estimated associations of sociodemographic predictors with lifetime onset of disorder, with the survival coefficients presented as odds ratios. We restricted this analysis to the four most prevalent disorders, combining alcohol abuse and dependence into one category. In the survival models, only person years up to the onset of the focal mental disorder were analyzed. Only age was treated as a time varying predictor in these analyses. To examine the sociodemographic correlates of disorder recurrence, a series of logistic regression models (with persons as the unit of analysis) estimated associations between correlates and the occurrence of a 12-month disorder among those with a lifetime history of that disorder (used here as a proxy for disorder recurrence). All significance tests were evaluated at 0.05 with two-sided tests.
Results
Sample characteristics
The sample is demographically representative of the wider Chitwan district except in terms of education, where the sample has higher levels of education compared to the district and the national average, although still low in comparison with higher-income countries. Education varies substantially by birth cohort, being much higher in younger cohorts (see Table SA in Supplementary Materials). The age and gender distribution of the sample is similar to the national population. The ethnic make-up of the sample is similar to the Chitwan district but differs, for some ethnic subgroups, from the national average (Table 1).
Table 1. Sample description
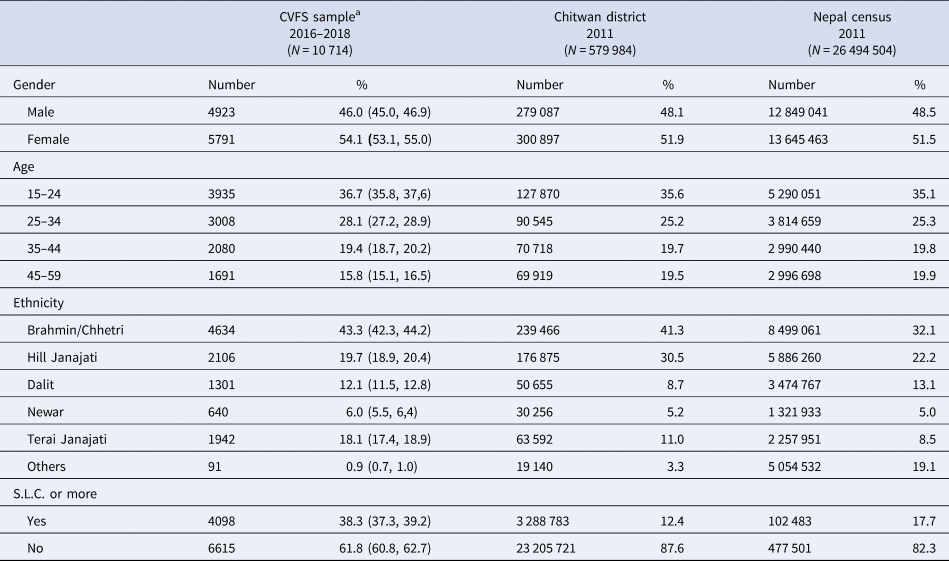
SLC = school leaving certificate.
a The age range in the CVFS sample is between 15 years and 59 years. For comparison, the calculated age distribution for the Chitwan district and Nepal census excludes people younger than 15 years and older than 59 years.
Positive screening, lifetime diagnosis and 12-month diagnosis prevalence
In Table 2 we show the percent screening positive for disorder as well the percent meeting lifetime and 12-month diagnostic criteria. For all disorders, screening rates were much higher than rates of diagnosis. MDD was the single most prevalent lifetime disorder at 15.1%, while GAD and ALA had intermediate prevalence of 5.6 and 5.4% respectively, and the other four disorders had low lifetime prevalence ranging from 0.3% (BPD) to 2.6% (PTSD). There were no lifetime diagnoses of IED. Gender differences were marked, with higher prevalence of alcohol use disorders among men and of mood and anxiety disorders among women. The 12-month prevalences were considerably lower than the lifetime rates, ranging from 0.2% (PD and BPD) to 2.7% for MDD.
Table 2. Lifetime and 12-month prevalence of mental disorders (N = 10 714)
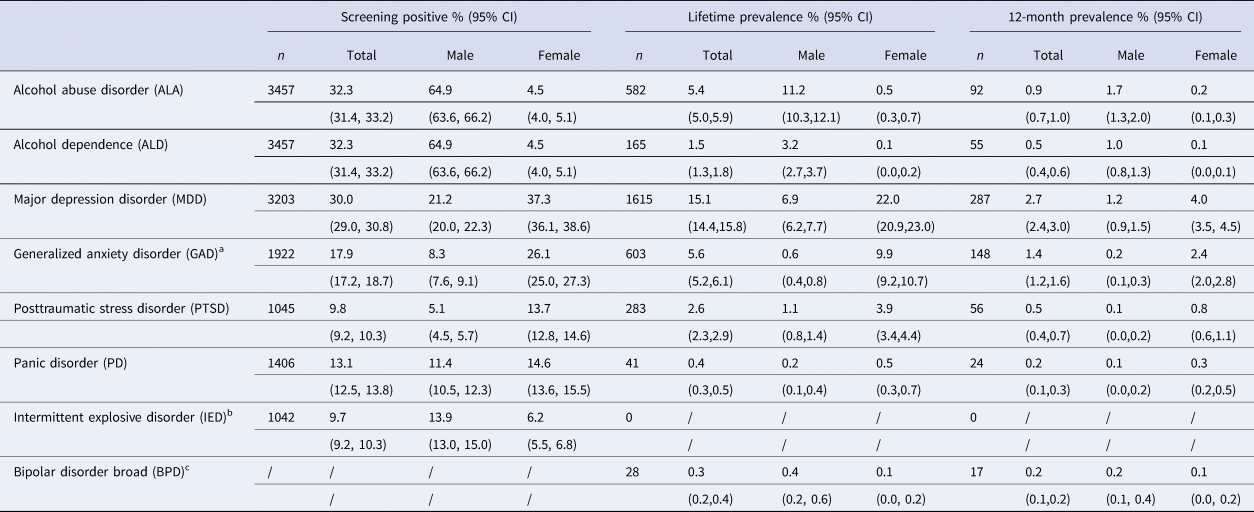
a Without hierarchy diagnosis.
b 1042 participants screened into the module. No participants met full diagnostic criteria for intermittent explosive disorder (IED).
c There is no appropriate ‘screening’ items for bipolar disorder broad. The bipolar diagnosis is constructed from the depression and mania data.
Age-of-onset (AOO) and projected lifetime risk
The distributions of cumulative lifetime risk estimates were examined for fixed percentiles and are displayed in Table 3. Bipolar disorder had the earliest median AOO (i.e. the 50th percentile on the age-of-onset distribution) at 19 years of age. For the other disorders with the exception of PD, the median AOOs fell within the range of 32–42. Projected lifetime risk of these disorders as of age 60, based on the age-of-onset distributions, was substantially higher than the lifetime prevalence. This is because lifetime prevalence is prevalence-to-date, among those aged 15–59. Younger participants have not passed through the age-at-risk of onset of the disorders.
Table 3. Age at selected percentiles on the standardized age of onset distributions of CIDI disorders with projected lifetime risk at age 60

a Age at selected percentiles on the standardized age of onset distributions of CIDI disorders was estimated using the two-part actuarial method.
b Without hierarchy.
Role impairment
The proportion of those with a 12-month disorder who reported severe impairment in at least one domain (home, work/school, intimacy or social life) ranged from a low of 37.0% for ALA to 78.6% for PTSD (Table 4). Averaging across disorders, role impairment was substantial; for all of the mood and anxiety disorders more than half of those meeting diagnostic criteria reported severe impairment in at least one domain. There was a pattern for 5/6 of the disorders (ALA being the exception) of severe impairment being more likely to be reported in connection with meeting role demands in the home, or at work, than in the social and intimate relationship domains.
Table 4. Percent with severe role impairment among those with 12-month mental disorders
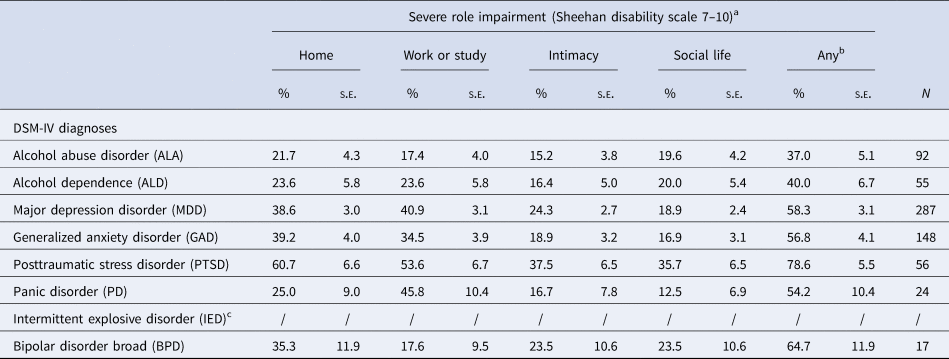
a None = 0; mild = 1–3; moderate = 4–6; severe = 7–9; and very severe = 10.
b ‘Any’ means the proportion reporting scores of 7–10 in any domain.
c 1038 participants screened into the module. No participants met full diagnostic criteria for intermittent explosive disorder (IED).
Sociodemographic correlates
Table 5 shows the associations of sociodemographic variables with (i) lifetime disorder onset and (ii) with 12-month prevalence among lifetime cases; the latter prevalence is a proxy for having a recurrent or persistent disorder. After controlling for gender, age was positively correlated with likelihood of lifetime onset, but after controlling for age, being in the youngest birth cohort was associated with increased odds of disorder onset. This cohort effect could reflect true higher prevalence in more recent cohorts or differential recall error (higher in older cohorts) and/or differential mortality. Women had much higher odds of mood and anxiety disorders while men had much higher odds of alcohol use disorders. Lower education was consistently associated with increased odds of lifetime disorders. The Dalit (low caste) ethnic group were at elevated risk of all four disorders, while the Brahmin/Chhetri (high caste) group were at decreased risk of alcohol use disorders (Brahmin/Chhetri include many lifelong abstainers from alcohol).
Table 5. Sociodemographic correlates of disorder onset (lifetime prevalence)a and recurrence (12-month prevalence/lifetime prevalence)b
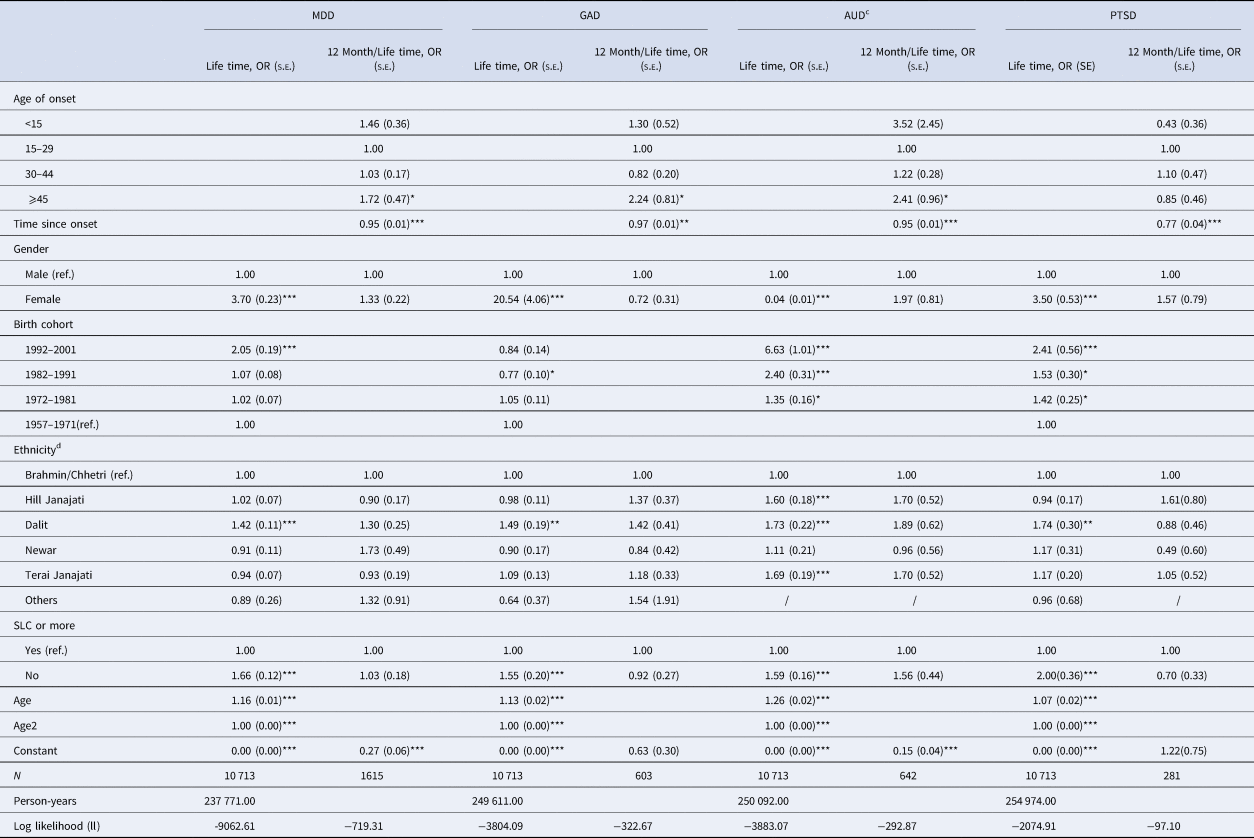
SLC = school leaving certificate. * p <0.05; ** p<0.01; ***p<0.001
a The results for lifetime disorder onset were based on discrete-time hazard models, adjusted for birth cohorts, age, and gender. Age is a time-varying variable, set up in the hazard model between 10 and 59. We centered the discrete-time hazard models at age 15, so the constants could be interpreted as the odds of mental disorders at age 10.
b The results for 12-month disorder recurrence among those diagnosed with lifetime diagnoses were based on logistic models, adjusted for age of onset, time since onset and gender. Since age, age of onset (in years), and time since onset are in a perfectly linear relationship, we did not adjust for age in these models.
c AUD means any alcohol abuse disorder (ALA) or alcohol dependence disorder (ALD).
d There were no cases in the ethnicity category of ‘others’ for lifetime and 12-month diagnosis of AUD and for 12-month diagnosis of PTSD.
Most of the predictors of lifetime onset were not found to be associated with recurrence. Age-at-interview among those with recurrent disorders is decomposed into age-of-onset of the disorder and time-since-onset (these sum to age-at-interview). Table 5 shows that they had opposite signs in association with disorder course: earlier disorder onset tended to be associated (non-significantly) with increased odds of recurrent disorder (this is the case for 3 of the 4 disorders), while time-since-onset was inversely associated with likelihood of recurrence for all disorders.
Discussion
This study reports on the findings of a large, general population survey of mood, anxiety, substance use and impulse control disorders in Nepal using a specially designed WMH-CIDI diagnostic interview. Limitations include the restricted range of disorders assessed and the use of trained lay, rather than clinician, interviewers. In addition, the lifetime estimates rely on retrospective recall by participants, which is known to underestimate prevalence and to be prone to recall bias in age-of-onset (Takayanagi et al., Reference Takayanagi, Spira, Roth, Gallo, Eaton and Mojtabai2014). This study also has several methodological strengths. It built on years of earlier mixed-method work refining the translated instrument and undertaking clinical validation of the CIDI interviews (Ghimire et al., Reference Ghimire, Chardoul, Kessler, Axinn and Adhikari2013). It used an LHC method demonstrated to enhance recall of mental disorder symptoms yielding high clinical validity (Axinn et al., Reference Axinn, Chardoul, Gatny, Ghimire, Smoller, Zhang and Scott2020). The study was conducted among a large sample, well used to being interviewed about potentially sensitive topics, resulting in a very high response rate (93%).
The lifetime prevalences of several disorders were found to be higher in Nepal than comparable prevalences in other low-income countries using the WMH-CIDI (Scott et al., Reference Scott, De Jonge, Stein and Kessler2018). However, we attribute this to the improved recall for lifetime disorders associated with the LHC method used in the Nepal survey, rather than to mental disorder prevalence actually being higher in Nepal. This is because the 12-month prevalences in Nepal fell either below, or within the range observed for other low-income countries using the WMH-CIDI. For example, 12-month prevalence of MDD, the most prevalent disorder in Nepal, was 2.7%; the comparable prevalence averaged across Colombia, Iraq, Nigeria, Peru, Ukraine and three regional surveys in the Peoples' Republic of China was 3.6% (Scott et al., Reference Scott, De Jonge, Stein and Kessler2018). Twelve-month prevalence suffers much less from recall bias than lifetime prevalence, so it is a better metric for comparing prevalence across surveys using the WMH-CIDI.
Note the prevalence of disorders in Nepal that we report here is substantially lower than prevalence for Nepal reported in some studies (Jordans et al., Reference Jordans, Luitel, Kohrt, Rathod, Garman, Silva and Lund2019; Luitel et al., Reference Luitel, Jordans, Sapkota, Tol, Kohrt, Thapa and Sharma2013). The most obvious reason is that many prior studies from the humanitarian literature focus on specific populations at high risk of disorder and we present results for the general population. For example, a study of former child soldiers in Nepal reported 53.2% child soldiers meeting criteria for depression, 46.1% for anxiety, 55.3% for PTSD (Kohrt et al., Reference Kohrt, Jordans, Tol, Speckman, Maharjan, Worthman and Komproe2008). Another reason may be the tendency for Nepali respondents to answer surveys in anticipation of receiving aid if they meet the criteria for aid (Stone & Campbell, Reference Stone and Campbell1984), something the CVFS panel has learned has no direct material benefits (Supplementary Materials). Anticipated material benefit is particularly likely to inflate prevalence rates in intervention studies, such as a recent evaluation study in Chitwan Nepal in which respondents learned they could receive health care support if their answers matched criteria (Jordans et al., Reference Jordans, Luitel, Kohrt, Rathod, Garman, Silva and Lund2019). A third reason may be that prior studies use screening questions to assess disorders [e.g. Jordans et al., {PHQ-9} (Jordans et al., Reference Jordans, Luitel, Kohrt, Rathod, Garman, Silva and Lund2019), Luitel et al., {Beck inventories} (Luitel et al., Reference Luitel, Jordans, Sapkota, Tol, Kohrt, Thapa and Sharma2013)], more similar to the Nepal-CIDI screener results reported above, rather than more stringent DSM diagnostic criteria. A fourth reason may be that the careful respondent attention to timing of symptoms produced by the LHC reduces ‘telescoping’ – the common tendency to report symptoms that occurred 12+ months ago as within the past 12 months (Groves et al., Reference Groves, Fowler, Couper, Lepkowski, Singer and Tourangeau2009). This is likely to inflate 12-month prevalence among other studies in Nepal that do not use an LHC tool to more clearly define timing of symptoms.
The median AOOs for BP, MDD, GAD and PTSD in this Nepal sample were keeping with the average median AOO found for these disorders in the WMH surveys (Scott et al., Reference Scott, De Jonge, Stein and Kessler2018.). The median AOO for PD is later (i.e. older) than we have seen in other countries, but the Nepal estimate is based on a small number of cases so would need replication in other surveys. The alcohol use disorders also had a somewhat later onset in Nepal compared to other countries using the WMH-CIDI. In part this is due to the religious prohibitions against alcohol use among Hindus in the majority Hindu population. Many Hindus do drink eventually, especially men, but their access to alcohol is often limited until well into adulthood. As we note above, these AOO estimates may be biased upwards if older respondents forget disorder episodes occurring earlier in life, or if the sample is biased by earlier mortality due to mental disorders, especially if the latter is more true for early-onset disorders than later-onset disorders.
Sociodemographic predictors of lifetime onset were consistent with other epidemiological studies, but two findings are noteworthy. First, the one ethnic group found to have elevated rates of disorder was the Dalit, treated as ‘untouchables’ in the Hindu caste system that was legal in Nepal through 1961 (and not punishable until 1990). This finding attests to the mental health impact of social exclusion, discrimination and poverty (Hawes, Axinn, & Ghimire, Reference Hawes, Axinn and Ghimire2016). Second, gender differences in this study were of generally greater magnitude than in other studies. In the WMH Surveys, the female:male ORs for lifetime MDD, GAD and PTSD ranged between 1.5 and 2.5 (Scott et al., Reference Scott, De Jonge, Stein and Kessler2018) while this study found ORs of 3.7 for MDD, 3.6 for PTSD and 20.4 for GAD. The LHC method increased lifetime diagnoses among women more than among men (Axinn et al., Reference Axinn, Chardoul, Gatny, Ghimire, Smoller, Zhang and Scott2020) so the greater gender differences may be due to gender differences in responsiveness to the LHC method, or because the LHC method allowed the true extent of gender disparities in disorder rates to become more apparent than less careful recall ascertainment. Other research has found that increasingly egalitarian gender roles within countries over historic time is associated with decreasing gender differences in MDD and substance use disorders (Seedat et al., Reference Seedat, Scott, Angermeyer, Berglund, Bromet, Brugha and Jin2009). In Nepal gender roles remain clearly demarcated and traditional, with significant gender differences in universal experiences, such as the level of choice in marital decision making (Ghimire, Axinn, Yabiku, & Thornton, Reference Ghimire, Axinn, Yabiku and Thornton2006).
Levels of exposure to potentially traumatic experiences (PTEs) are quite high in Nepal. In addition to high poverty, the Nepalese population experienced a widespread, medium intensity armed-conflict from 1998 to 2006 (Axinn et al., Reference Axinn, Ghimire and Williams2012). Central Nepal, nearby the study population, also experienced a catastrophic earthquake in 2015. Thus, using the Nepal version of the WMH-CIDI more than 80% of the study population reported exposure to a PTE and nearly 65% reported exposure to two or more PTEs; these rates are higher than some, but comparable to other WMH countries (Benjet et al., Reference Benjet, Bromet, Karam, Kessler, McLaughlin, Ruscio and Koenen2016). Given the high levels of poverty, trauma and social disadvantage in Nepal, the low 12-month prevalences are counter-intuitive, although they are consistent with the cross-national pattern noted earlier. Methodological factors cannot be ruled out, but this study incorporated a number of methodological features to maximize disorder detection and reporting. So, it is reasonable at this point to consider substantive explanations for the lower-than-expected rates of disorder in countries like Nepal.
One possibility is that there may be sociocultural factors in non-Western countries that offer some protection against the development of mental disorders. Social capital may be one such factor (McKenzie, Whitley, & Weich, Reference McKenzie, Whitley and Weich2002). Although the literature on social capital is complex and at times contradictory, individual cognitive social capital (perception of quality of social relationships such as trust and social harmony) is fairly reliably associated with reduced odds of mental disorder (De Silva, Huttly, Harpham, & Kenward, Reference De Silva, Huttly, Harpham and Kenward2007; Ehsan & De Silva, Reference Ehsan and De Silva2015) and appears to be prevalent in the low-income countries where it has been measured (De Silva et al., Reference De Silva, Huttly, Harpham and Kenward2007). In a recent cross-national study, the association between social capital and health outcomes was found to be significantly stronger in low-income countries than in high-income countries (Lee, Reference Lee2018). This may reflect the distinction between interdependent (non-Western) cultures that place high value on fitting in and maintaining harmony within the social world, v. independent (Western) cultures that emphasize the desire to discover and express unique attributes (Markus & Kitayama, Reference Markus and Kitayama1991). In a similar vein, East-West differences in the way people see themselves, their relationships, and world they live in have recently been proposed to help explain the lower rates of affective disorders in Asian countries. Researchers suggest that in holistic (Eastern) cultures, there is a tendency to embrace contradiction, to expect change, and to understand the self in context. As a result, negative emotions are seen as less negative, less threatening, more manageable, and less intrinsically tied to the individual self than in analytic (Western) cultures (De Vaus, Hornsey, Kuppens, & Bastian, Reference De Vaus, Hornsey, Kuppens and Bastian2017).
There may also be sociocultural factors in high-income Western countries that are toxic for mental health. Income inequalities are typically higher in high-income countries than in low-income countries and mental disorders have been found to be substantially more prevalent in unequal societies (Pickett & Wilkinson, Reference Pickett and Wilkinson2010). Moreover, independent of actual objective socioeconomic status, the perception of lower relative socioeconomic status is also associated with higher odds of mental disorder and this association is significantly stronger in high-income countries (Scott et al., Reference Scott, Al-Hamzawi, Andrade, Borges, Caldas-de-Almeida, Fiestas and Kessler2014). It may be that the emphasis on individual achievement and status in the West, in the context of high-income inequalities, renders individuals in those countries vulnerable to social comparisons that undermine mental health. Relatedly, it has been suggested that wealthy countries facilitate a potential mismatch between high expectations and the realized outcomes for the majority of the population (Koplewicz, Gurian, & Williams, Reference Koplewicz, Gurian and Williams2009; Luthar, Barkin, & Crossman, Reference Luthar, Barkin and Crossman2013). By contrast, in a setting like Nepal, expectations are low, which may facilitate concordance between expectations and experience (Axinn, Ghimire, Williams, & Scott, Reference Axinn, Ghimire, Williams and Scott2013).
These suggestions as to why Nepal and other low-income countries may have lower prevalence of mental disorders than high-income countries cannot be formally tested using WMH survey data. The limited number of WMH surveys reduces the ability to conduct analyses with country as the unit of analysis, and the WMH surveys, although rich in data on individual correlates of mental disorders, did not measure the kind of sociocultural and attitudinal factors suggested here as potential mediators of cross-national variation. Future studies could draw on the example provided by the cross-national studies of social wellbeing, some of which include many countries and information on both national and individual characteristics (Jorm & Ryan, Reference Jorm and Ryan2014). Such studies could be elaborated to include some of the hypothesized mediators suggested above together with brief assessment of one or more common mental disorders.
In conclusion, the relatively low prevalence of mental disorders in a country where the population faces multiple challenges in daily living is surprising given known risk factors for mental disorders, but there are plausible substantive explanations that deserve further research. Identification of specific cultural or sociodemographic factors that mediate the reduced prevalence of mental disorders in this setting may have implications for clinical or policy interventions aimed at facilitating resilience in other settings and countries.
Supplementary material
The supplementary material for this article can be found at https://doi.org/10.1017/S0033291720001464
Acknowledgments
The authors gratefully acknowledge and thank the professional staff of three collaborating partners who together made this work possible: The survey staff of the Institute for Social and Environmental Research – Nepal for their outstanding fieldwork collecting the data reported here; the staff of the Survey Research Operations unit of the University of Michigan's Survey Research Center for development and support of the technical systems that made the fieldwork in Nepal possible; and Professor Ron Kessler and the World Mental Health Consortium staff at Harvard University for their input into the design and all subsequent steps of collecting and analyzing the data reported here.
This work was supported by the National Institute of Mental Health (W.A., S.C., D.G., Y.Z., grant number R01MH110872); and the Eunice Kennedy Shriver National Institute of Child Health and Human Development (W.A., D.G., grant number P2CHD041028).
Conflict of interest
Ghimire is also the Director of the Institute for Social and Environmental Research in Nepal (ISER-N) that collected the data for the research reported here. Ghimire's conflict of interest management plan is approved and monitored by the Regents of the University of Michigan.
Ethical standards
The authors assert that all procedures contributing to this work comply with the ethical standards of the relevant national and institutional committees on human experimentation and with the Helsinki Declaration of 1975, as revised in 2008. All procedures were approved by the University of Michigan Institutional Review Board and by the Nepal Health Research Council. Written or verbal informed consent was obtained from all participants.


