


Introduction
Mood disorders account for almost 50% of the burden of mental disorders (Kupfer, Frank, & Phillips, Reference Kupfer, Frank and Phillips2012). Among them, major depression has a chronic, recurrent course, and is highly prevalent. In fact, its chronicity is especially difficult to tackle, as research is usually focused on the management of acute depressive episodes (Andrews, Reference Andrews2008). In addition, depression has heterogeneous trajectories, varying from a single or a few episodes to an intermittent course that can persist over the lifespan (Musliner, Munk-Olsen, Eaton, & Zandi, Reference Musliner, Munk-Olsen, Eaton and Zandi2016).
However, relatively little is known on the sociodemographic and clinical predictors associated with depression recurrence and incidence, as most available cohort data present limitations. For instance, several cohort studies investigated specific subgroup of patients (e.g. perinatal depression, geriatric depression, and depression in children and adolescents), enrolled only those already depressed at baseline, performed a short-term follow-up, or presented high attrition rates (Beard, Tracy, Vlahov, & Galea, Reference Beard, Tracy, Vlahov and Galea2008; Musliner et al., Reference Musliner, Munk-Olsen, Eaton and Zandi2016; Skapinakis, Weich, Lewis, Singleton, & Araya, Reference Skapinakis, Weich, Lewis, Singleton and Araya2006; Spijker et al., Reference Spijker, de Graaf, Bijl R, Beekman, Ormel and Nolen2004). An additional issue is that most studies have been conducted in developed countries (Musliner et al., Reference Musliner, Munk-Olsen, Eaton and Zandi2016). It is reasonable to assume that the course of depression is different in low- and middle-income countries that present substantial economic disparity and low social support for the poorest people.
Furthermore, standard investigation has focused on traditional statistical approaches focused on group-level results (Bzdok, Altman, & Krzywinski, Reference Bzdok, Altman and Krzywinski2018). In this context, machine learning approaches can be advantageous and have increasingly been used in prognostic psychiatry, as they can model complex datasets to produce accurate predictive tools based on learning algorithms. In addition, machine learning focuses on results at the individual patient level (Bzdok et al., Reference Bzdok, Altman and Krzywinski2018; Dwyer, Falkai, & Koutsouleris, Reference Dwyer, Falkai and Koutsouleris2018). For example, there is supporting evidence for the influence of socioeconomic inequality in the association between depression and gender (Rai, Zitko, Jones, Lynch, & Araya, Reference Rai, Zitko, Jones, Lynch and Araya2013).
In this study, we used a machine learning approach to predict depression cases, incidence, and chronicity in a large Brazilian occupational cohort, using clinical and sociodemographic data. This study has the potential to aid in mental health policies development. Additionally, our findings could be employed in other low- and middle-income countries that present populations with similar characteristics.
Methods
Study design and participants
ELSA-Brasil is an occupational, prospective cohort study of 15 105 civil servants from six public institutions in major Brazilian cities (São Paulo, Rio de Janeiro, Salvador, Porto Alegre, Belo Horizonte, and Vitória) (Aquino et al., Reference Aquino, Barreto, Bensenor, Carvalho, Chor, Duncan and Szklo2012). All active or retired employees of these institutions aged 35–74 years were eligible for the study. Exclusion criteria were current or recent pregnancy (4 months prior to the first interview), intention to quit working at the institution in the near future, severe cognitive or communication impairments, and, if retired, residing outside of a study center's corresponding metropolitan area. All local ethics committees approved the study and all participants provided written, informed consent prior to assessment. Since this was an observational cohort, subjects were informed of all their clinical and mental diagnoses and referred to an appropriate medical appointment, but no intervention was provided by the study.
The first wave (n = 15 105 participants) of ELSA took place from August 2008 to December 2010 and the second wave (n = 13 922 participants) took place from September 2012 to December 2014.
Predictor variables
As predictors, we selected variables that are easily accessible to clinicians and that can be collected in a single clinic visit. In consequence, the models created can be used in large populations without a significant increase in the cost of assistance.
The following baseline variables were investigated as predictors:
(a) For sociodemographic variables, information was collected regarding sex, age, educational level (presence or absence of a university degree), self-reported race (white v. non-white), marital status (married v. other), and familial monthly income.
(b) Regarding clinical variables, we assessed obesity (defined as a body mass index >30 kg/m2 and obtained by measured weight and height) and smoking status (never a smoker v. past or present smoker). To evaluate general health status, participants were asked to judge their health according to a Likert scale (Chor et al., Reference Chor, de Alves, Giatti, Cade, Nunes, del Molina and de Oliveira2013). The answers were categorized into very good/good health status v. moderate/poor/very poor health. Finally, we used dietary information to identify those who presented a heavy alcohol consumption (Chor et al., Reference Chor, de Alves, Giatti, Cade, Nunes, del Molina and de Oliveira2013), defined as more than 210 (men) or 140 (women) grams of alcohol consumed per week (equivalent to 15 and 10 glasses of drink per week, respectively) (Piccinelli et al., Reference Piccinelli, Tessari, Bortolomasi, Piasere, Semenzin, Garzotto and Tansella1997).
(c) Regarding mental disorders, we used the Portuguese version of the Clinical Interview Schedule-Revised (CIS-R) (Nunes et al., Reference Nunes, Pinheiro, Bessel, Brunoni, Kemp, Benseñor and Schmidt2016), which is a structured interview for measurement and diagnosis of non-psychotic psychiatric morbidity in the community (Lewis, Pelosi, Araya, & Dunn, Reference Lewis, Pelosi, Araya and Dunn1992). The questionnaire includes 14 sections covering common psychiatric symptoms and assessing the following ICD-10 diagnosis: general anxiety disorder (GAD, F41.1), panic disorder (PD, F41.0), social anxiety disorder (SAD, F40.1), and obsessive-compulsive disorder (F42). The sensitivity/specificity of the CIS-R is 74/98% for any mental disorder and 75/98% for depressive episodes based on the ICD-10 diagnostic criteria (Head et al., Reference Head, Stansfeld, Ebmeier, Geddes, Allan, Lewis and Kivimäki2013).
(d) For psychotropic use, all participants were asked regarding the use of prescription and non-prescription medicines, and continuous and non-continuous use of medication taken in the past 2 weeks. All participants were instructed to bring to the study clinic all medications and prescription forms for examination. We assessed whether participants were using antidepressants and/or benzodiazepines as a categorical variable (yes or no). A complete review on psychotropic use in the ELSA-Brasil study can be found elsewhere (Brunoni et al., Reference Brunoni, Nunes, Figueiredo, Barreto, da Fonseca, Lotufo and Benseñor2013).
(e) Finally, we assessed the presence or absence of at least one of the following negative life events in the past 12 months: being assaulted or robbed, being hospitalized, bereavement/mourning of a relative, severe financial problems, or ending an intimate relationship.
Outcome variables
At both waves, a shortened version of the CIS-R was applied to diagnose depression. Therefore, we could define the following clinical courses: no depression (absence of depression at both waves), incident depression (depression only at wave 2), and chronic depression (depression at both waves). Of note, the CIS-R limits detailed enquiry to the previous week of the assessment, since memory for psychological symptoms and the validity of the responses becomes poor when a longer period of enquiry is used in community samples (Das-Munshi, Castro-Costa, Dewey, Nazroo, & Prince, Reference Das-Munshi, Castro-Costa, Dewey, Nazroo and Prince2014). Since the CIS-R does not evaluate the entire period between baseline and follow-up, it is not possible to differentiate if a subject that was depressed at both waves had a persistent or a recurrent course. In addition, due to the low number of participants with depression at the baseline, we did not develop models including only depressed subjects.
Data analysis
Descriptive analyses were reported as means (with standard deviations) or absolute and relative frequencies. We divided participants into four groups based on the outcomes. We used χ2 or Student t tests to analyze demographic and clinical variables among these groups.
The machine learning analysis was performed with R software (Version R 3.3.1) and R Studio (Version 0.99.902) using the R package caret (Version 6. 0-73) (R Core Team, 2018). Machine learning approaches may outperform traditional multiple regression: (1) coefficients are unstable when high correlations exist among predictors, which leads to low replication of predictions in independent samples (Berk, Reference Berk2016); and (2) traditional regression assumes additivity, whereas the predictors considered here might have non-additive effects.
Machine learning analysis
The elastic net is a machine learning method that uses regularization with an embedded feature selection procedure. Through a cost function composed of both L1 (Lasso regression) and L2 (Ridge regression) weight magnitude penalties, the method can remove predictors with low impact to the outcome while regularizing for improved generalization. The coefficients of the non-relevant features are shrunk toward zero, eliminating correlated variables, simplifying the model, and reducing overfitting. As our dataset is composed of several attributes, identifying the most important ones enables a wider applicability and more practical use of our predictive models. We performed bivariate elastic net regularization to explore the association of the predictive variables and the outcome. The training procedure was performed with 10-fold classification, feature selection, hyperparameter tuning, and sampling correction. To select the hyperparameters α and λ, we selected a sequence of values from 0.1 to 0.9 in intervals of 0.1 (α), and from 0.001 to 0.1 in intervals of 0.001 (λ) and tested all combinations of these values in cross-validation loop. The hyperparameters combination that maximized the AUC was selected for the final model.
Using both wave 1 and wave 2, we defined the following outcomes: (1) no depression (absence of depression at baseline and follow-up); (2) any depression (incident, chronic, or remitted depression); (3) incident depression (depression at wave 2 but not at wave 1); and (4) chronic depression (depression at both waves). Then, the following models were developed to distinguish: (A) no depression v. any type of depressive course (incident or chronic or remitted); (B) no depression v. incident depression; and (C) no depression v. chronic depression. All variables were normalized or standardized before being used in the elastic net equation. We performed the missing data imputation by using median for numeric variables and mode for categorical variables, using the training dataset (van Buuren, Reference van Buuren2018).
Individual-level predicted probabilities based on the elastic net algorithm were created, as well as the receiver operating characteristic (ROC) curves, and the area under the curve (AUC) was calculated to evaluate the predictive performance. Additionally, we calculated sensitivity, specificity, balanced accuracy, positive predictive value (PPV), and negative predictive value (NPV). We used a cut-off of 0.5 as the boundary for class decision, i.e. the algorithm will classify probabilities above 50% as belonging to the positive outcome level and below to the negative outcome level. Finally, we plotted how PPV and NPV change vis-à-vis different cut-offs for class boundary decision.
Cross-validation
For each analysis, we randomly split our baseline data into training (75% of the whole sample) and test datasets (25%). We deployed a standard machine learning protocol with 10-fold cross-validation, feature selection, hyperparameter tuning, and class imbalance correction in the training dataset (Fig. 1). We repeated 10-fold cross-validation 10 times to improve tuning.

Fig. 1. Elastic net procedure for training and testing data.
Class imbalance
Class imbalance introduces a bias toward classifying all the data as the majority class, which usually leads to poor detection of the infrequent class. The class imbalance problem was addressed through a resampling step, which entailed under-sampling the majority class in each analysis followed by algorithm training. Specifically, we used down-sampling, a procedure that randomly selects instances of the majority class to match class frequencies of the minority class. This process was repeated in 1000 iterations to allow us to use all instances in the training set. The algorithm-predicted probabilities were averaged over the resampling iterations. In unbalanced sets, the regular accuracy can be a misleading measure of performance, biased toward predicting the majority class. There is a possibility, for example, for the classifier to simply predict all cases of the majority class, leading to an artificial high performance that, on the other hand, is unable to predict most or all instances of the minority class, which is the event we were initially trying to detect (Brodersen, Ong, Stephan, & Buhmann, Reference Brodersen, Ong, Stephan and Buhmann2010).
The balanced accuracy can be defined as 1/2((TP/P) + (TN/N)) based on a confusion matrix of predicted instances v. actual instances, with TP being true-positive cases, TN true-negative cases, P all positive cases, and N all negative cases. This way, if the algorithm is poor to detect either the true-positive or the true-negative cases, the balanced accuracy will be low and close to chance. Therefore, when dealing with unbalanced datasets, AUC and balanced accuracies are more proper performance metrics to evaluate a machine learning classifier than the traditional accuracy values (Buda, Maki, & Mazurowski, Reference Buda, Maki and Mazurowski2018; Luque, Carrasco, Martín, & de las Heras, Reference Luque, Carrasco, Martín and de las Heras2019).
Supplementary analysis
In addition to the main analysis, eight more models are available in the online Supplementary material (online Supplementary Tables S4–S7), including models: (a) excluding subjects with missing data in the generalized anxiety disorder variable, (b) with no correction for class imbalance, (c) using the random forest algorithm, (d) with 100 random splits for train/test, (e) with sensitivity analyses excluding SAD, GAD, and OCD variables, one at a time, (f) using the least absolute shrinkage and selection operator (LASSO) algorithm. The selected α and λ parameters for the main models (online Supplementary Table S8) and the elastic net regression penalized β coefficients for the main models (online Supplementary Table S9) are also available in the online Supplementary material.
Results
Out of the 15 105 participants included at wave 1, 1180 (7.8%) did not complete the assessment at wave 2, the main reasons being death and moving outside of the metropolitan area of the study after retiring. We found that 499 (3.58%) participants presented with a new depressive episode, 426 (3.06%) remitted, 160 (1.15%) persisted or recurred in a depressive episode, and 12 837 (92.21%) presented no depression at both waves. Descriptive analyses of demographic and clinical variables are described in online Supplementary Table S1, and missing data frequency and distribution for each variable are presented in online Supplementary Fig. S1 and Table S2.
Table 1 shows model performance for each analysis when the cut-off for class boundary decision is set at a 0.5 probability, i.e. if the individual has a probability ⩾0.5, it is classified as positive, and when the probability is <0.5, as negative. Figure 2 shows the ROC curves and AUC values for the predictive models regarding outcomes 1–3, and the selected variables with their relative relevance weights to each model. Online Supplementary Fig. S2 and Table S3 show PPVs and NPVs for different cut-offs of class boundaries. Supplementary analysis can be found in online Supplementary Tables S4–S7. Online Supplementary Table S8 shows the selected values for hyperparameters α and λ parameters selected in the main analysis.

Fig. 2. ROC curve and AUC value for the predictive models of depression courses and variables selected by the elastic net model with relative relevance weights. Models differentiating (a) participants with depression from non-depressed participants; (b) participants with incident depression from participants who did not develop depression; (c) participants without depression from those with chronic depression.
Table 1. Performance metrics for the elastic net models to predict the three clinical outcomes

AUC, area under the curve; NPV, negative predictive value; PPV, predictive positive value.
(A) Depression v. non-depression; (B) incident depression v. non-depression; (C) chronic depression v. non-depression.
Classifying depressed and non-depressed participants
Considering both baseline and follow-up, 1085 participants presented with a history of depression, while 12 387 participants have not experienced any depressive episode. The elastic net model had an AUC of 0.79 (0.76–0.82) with a balanced accuracy of 73%. The model retained all variables except past or present history of smoking. In the five top features selected, there were four psychiatric comorbidities (SAD, OCD, GAD, and PD) and the self-reported health evaluation.
Prediction of incident depression
There was a total of 499 participants with a new depressive episode at follow-up. The model was trained to differentiate these incidents cases from the non-depressed patients at wave 2. The model had an AUC of 0.71 (0.66–0.77) and a balanced accuracy of 68%. Among the five top variables, there were two comorbidities (OCD and GAD), two clinical features (use of antidepressants and use of benzodiazepines), and sex. Past or present history of smoking and educational level were discarded by the model.
Distinguishing chronic depression and non-depressed patients
At wave 2, 160 patients that were depressed at wave 1 persisted in a depressive episode. The model was trained to differentiate chronically (persistent or recurrent) depressed participants from those without a depressive episode, and had an AUC of 0.90 (0.86–0.95), with a balanced accuracy of 82%. OCD and GAD were the most relevant features, with sex, self-report health, and negative life events following. The only variable discarded by the model was the self-reported race.
Sensitivity analyses
Since the use of antidepressants may be a confounder, we repeated the analysis for outcomes 1 and 3 without this variable to check if the performance could be inflated by its inclusion. The results can be seen in Fig. 3 and Table 2. The model to distinguish depressed from non-depressed maintained the same AUC 0.79 (0.78–0.81), while the model to distinguish non-depressed participants from those with a chronic depressive course had an absolute increase from 0.90 (0.86–0.95) to 0.91 (0.89–0.94), although with a significant overlap in the confidence intervals. The same two variables previously excluded (history of smoking for model 1 and ethnicity for model 3) were also excluded in the sensitivity analysis models. A sensitivity analysis for GAD, SAD, and OCD for the three comparisons can also be found in the online Supplementary material.
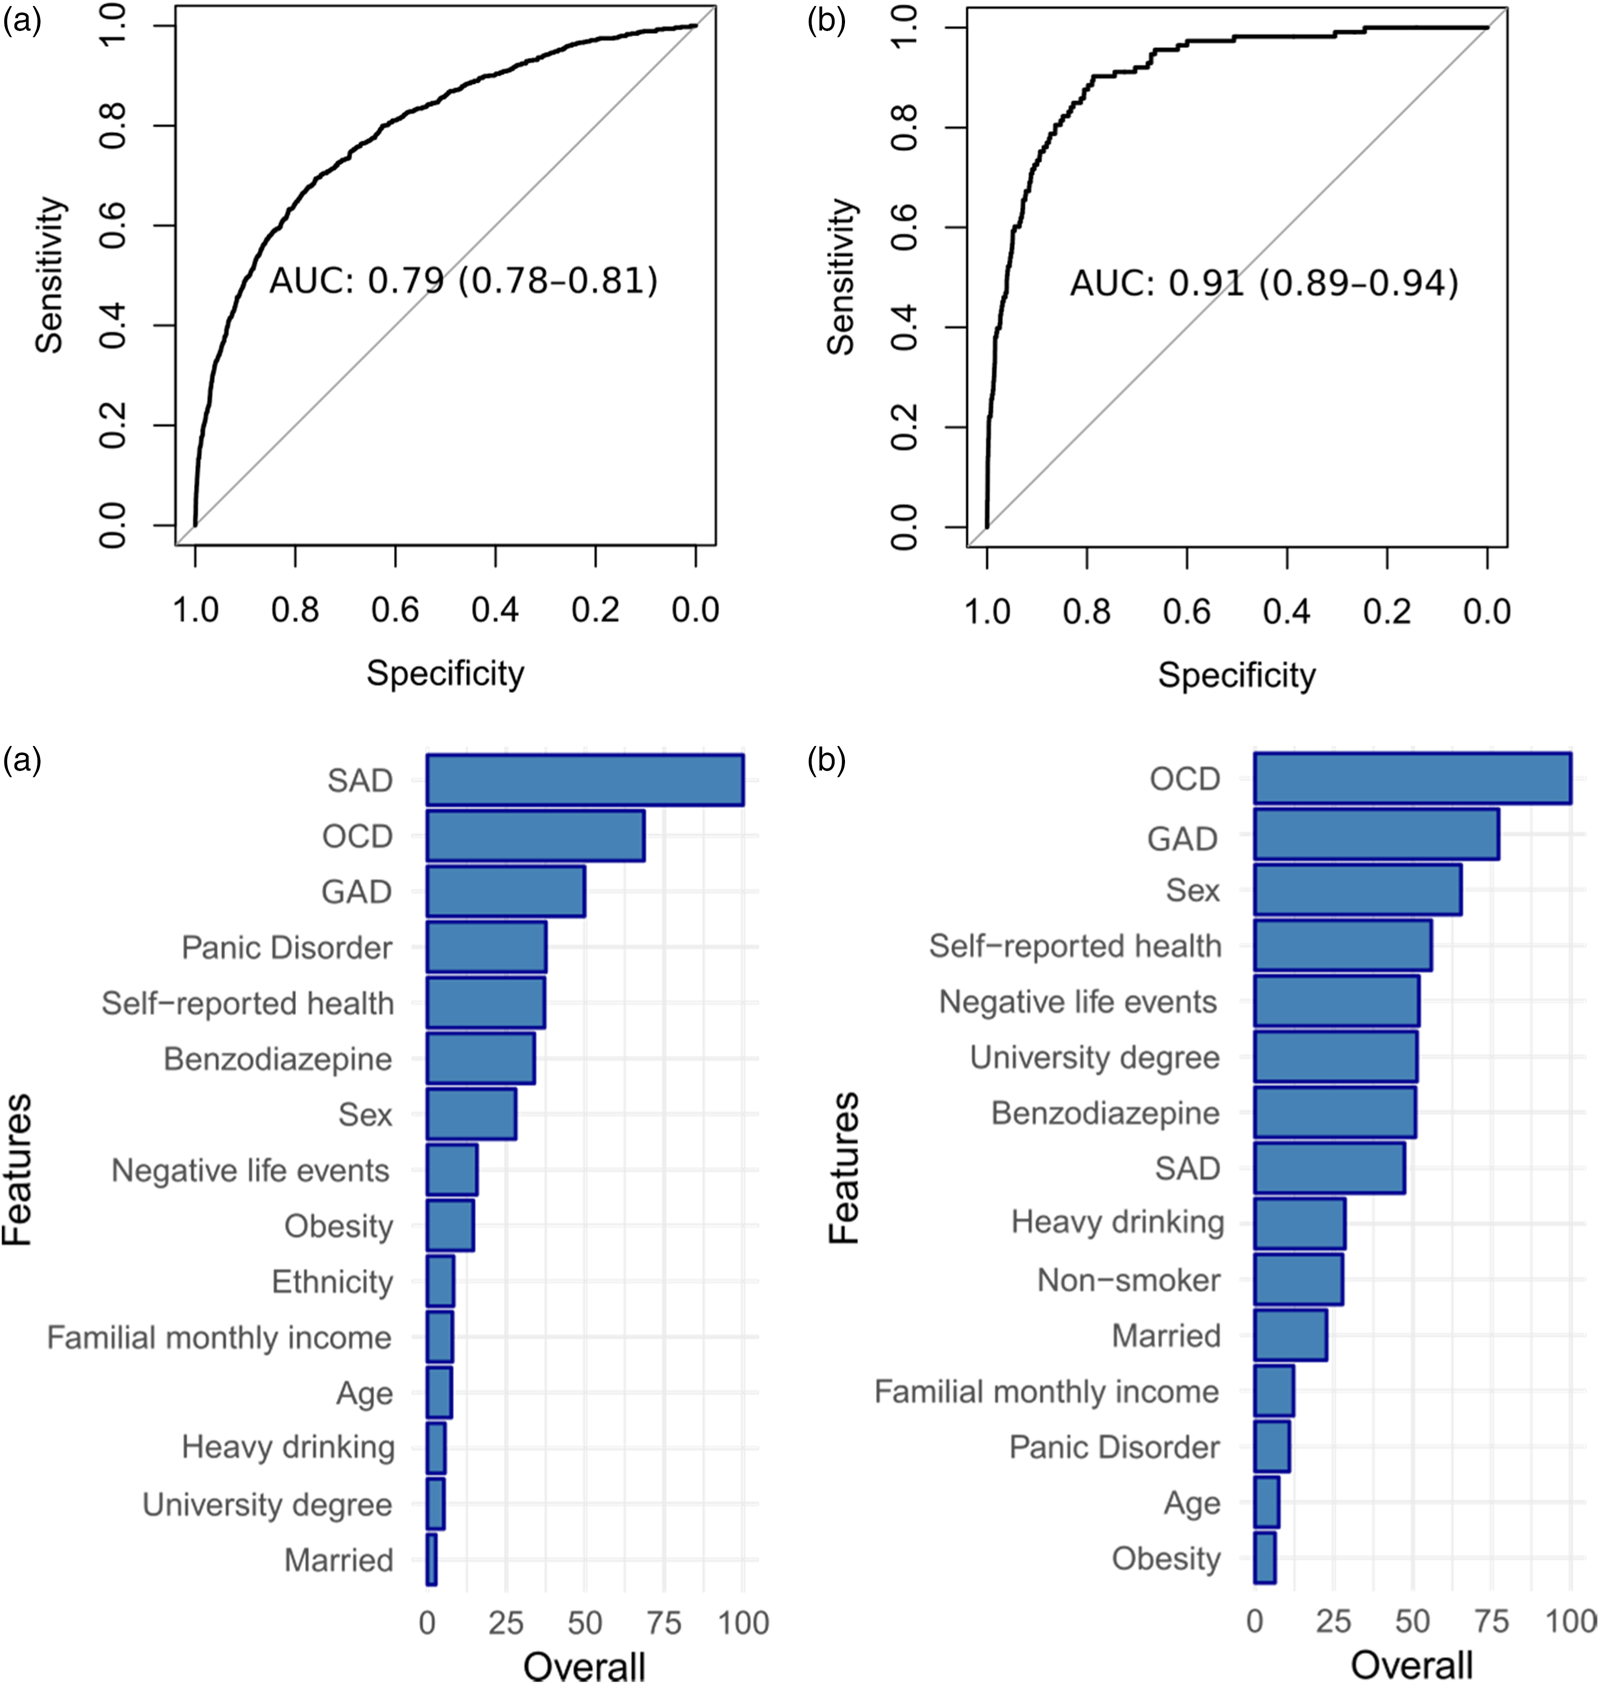
Fig. 3. ROC curves and selected variables with their relative relevance weights for sensitivity analysis for outcomes 1 and 3. (a) Depressed v. non-depressed patients. (b) Chronic depression v. non-depressed patients.
Table 2. Performance metrics for the sensitivity analysis for outcomes 1 and 3

χ2 = 72.06, p value <2.2 × 10⁻¹⁶.
Models with 100 random splits
To assess the stability of the predictive models, we repeated the analysis with 100 random splits for the training/testing sets (online Supplementary Tables S5–S7 and Fig. S4) obtaining similar results and confidence intervals for the AUC.
Discussion
The present study investigated three machine learning models for classifying cases of depression and predicting incidence, and chronicity of depression within the ELSA-Brasil cohort, using baseline variables from wave 1 (2008–2010) as predictors, and the courses defined at wave 2 (2012–2014). The present study is the first to assess depression prognosis in a large sample using machine learning techniques. Particularly, we designed predictive models to distinguish (a) participants with depression from those without depression; (b) participants with incident depression from those without depression; and (c) participants with chronic depression (persistent or recurrent) from those without depression. We obtained AUCs ranging from 0.71 to 0.90, and balanced accuracies ranging from 68% to 82%.
Our first predictive model can be used to screen subjects with or at-risk of developing depression in a populational sample with a small set of features, easily accessible to the clinician. The evaluation of only individuals with depression requires extensive screening and diagnostic procedures that usually incur in great costs and small samples, many times unsuited for a proper machine learning analysis. Our second model can detect patients who will develop depression in the follow-up, and then can be used to monitor these cases, enabling both preventive measures and early intervention. Finally, our third model can be used to detect which patients will have a chronic course of depression, marked by either a persistent or recurrent trajectory, which are more likely to have a course marked by functioning impairment and poor outcomes, and that are likely to need tertiary care. In the context of a developing country, these may help to better allocate resources and improve assessment.
The models presented low PPV, given the low prevalence of depression in the sample, and high NPV. Nevertheless, in the context of a developing country with scarce resources, the algorithm may serve as a screening tool that can aid to prioritize resources in cases at-risk. Two other studies also evaluated depression in population-based cohorts. Wang et al. assessed 28 059 individuals from waves 1 and 2 from the National Epidemiological Survey on Alcohol and Related conditions, obtaining a model with C statistics of 0.7538 to discriminate those individuals that will develop a first-onset major depression (Wang et al., Reference Wang, Sareen, Patten, Bolton, Schmitz and Birney2014). Rosellini et al. used the same dataset to predict the risk of several psychiatric disorders, obtaining an AUC of 0.73 to predict depression. We found no studies predicting depression in population-based cohorts in developing countries (Rosellini et al., Reference Rosellini, Liu, Anderson, Sbi, Tung and Knyazhanskaya2020).
Predicting which individuals are at-risk to convert to depression can enable timely and personalized preventive strategies to take place, shifting our focus from only treating acute episodes to directly intervening in the course of the disorder. This may yield a substantial impact to ease the burden directly associated with depression, such as cognitive and functioning impairments (Lépine & Briley, Reference Lépine and Briley2011), high risk for suicidal behavior (Bostwick & Pankratz, Reference Bostwick and Pankratz2000; Ösby, Brandt, Correia, Ekbom, & Sparén, Reference Ösby, Brandt, Correia, Ekbom and Sparén2001), and decreased quality of life (Brenes, Reference Brenes2007). In addition, it could impact also in mortality and disability rates, as well as in the economic and family burden associated with the disorder (Kessler, Reference Kessler2012). For example, depression is a risk factor for clinical diseases such as diabetes (Brown, Majumdar, Newman, & Johnson, Reference Brown, Majumdar, Newman and Johnson2005), coronary heart disease (Gan et al., Reference Gan, Gong, Tong, Sun, Cong, Dong and Lu2014; O'Neil et al., Reference O'Neil, Fisher, Kibbey, Jacka, Kotowicz, Williams and Pasco2016), and autoimmune diseases(Andersson et al., Reference Andersson, Gustafsson, Okkels, Taha, Cole, Munk-Jørgensen and Goodwin2015), with patients being twice as likely to die prematurely when compared to subjects without depression (Lépine & Briley, Reference Lépine and Briley2011). Our findings show a potential application of machine learning in predicting incidence, persistence, and remission of depressive episodes at an individual level. In addition, the models developed in this study are easy to implement, since all variables can be accessed at any moment by a clinician, without incurring in additional costs. Interventions focused on the course of the disorder can be designed to target the relevant factors selected in the predictive models, since from all included variables, only age, sex, and ethnicity are not modifiable (Andersson et al., Reference Andersson, Gustafsson, Okkels, Taha, Cole, Munk-Jørgensen and Goodwin2015).
Comorbidities were between the most relevant predictive features in all models. This is in accordance with a previous study by our group that showed large effect sizes for OCD and anxiety disorders to predict incident and persistent depression, using traditional statistical methods (Brunoni et al., Reference Brunoni, Santos, Passos, Goulart, Koyanagi, Carvalho and Benseñor2020). The present study differs from our previous one as we employed more variables, tested more outcomes, and used a machine learning approach. Our findings are also in accordance with a recent meta-analysis of 66 prospective studies that showed that anxiety disorders predict depressive disorder, with effect sizes of 2.58 (1.81–5.2) for GAD, 2.06 (1.71–3.97) for SAD, and 5.60 (4.21–6.01) for OCD (Jacobson & Newman, Reference Jacobson and Newman2017). Some authors also consider the presence of high anxiety traits as a phenotype with an increased predisposition to stress-induced depression (Weger & Sandi, Reference Weger and Sandi2018). While SAD was the most important feature to differentiate depressed from non-depressed patients, it had an intermediate relevance for the other outcomes.
Regarding medication use, the use of benzodiazepines had an intermediate relevance for the three models. The use of antidepressants had an intermediate relevance for most models, except for the one predicting incident depression, in which it was the fourth more relevant feature. Of note, we decided to include use of antidepressants in all our models because patients may be using these for other reasons than being depressed, such as treatment of chronic pain, anxiety disorders, and obsessive-compulsive disorder. For example, there is evidence that subjects with GAD not treated with antidepressants have a higher risk to develop a depressive episode (Goodwin & Gorman, Reference Goodwin and Gorman2002). When performing a sensitivity analysis removing this variable for models 1 and 3, the first model had a mild decrease in performance, while the third remained at a similar value.
Among all sociodemographic features, the most relevant for all models was sex, being the third most relevant feature to predict incident and chronic depression, and the sixth more relevant to distinguish between depressed and non-depressed patients. The role of sex in depression is well-known, with women being twice as likely to develop depression (Kuehner, Reference Kuehner2003), although there is no conclusive evidence of its role in remission, recurrence, or persistence (Salk, Hyde, & Abramson, Reference Salk, Hyde and Abramson2017). The difference in incidence seems to be higher during adolescence, the period which was not included in our population. Having a university degree was the sixth more important variable to predict chronic depression, although it was discarded by the model of incident depression. Other sociodemographic variables had an intermediate to small relevance in the models. Age, for example, was among the five less relevant features in all models. This could be explained by the age range of our sample (35–74 years) and the fact the incidence is higher during adolescence and early adulthood (Saluja et al., Reference Saluja, Iachan, Scheidt, Overpeck, Sun and Giedd2004).
Depression rates observed in the present study were lower than expected in Brazil, in which higher depression rates have been reported (Brunoni et al., Reference Brunoni, Santos, Passos, Goulart, Koyanagi, Carvalho and Benseñor2020). Our depression rates might be lower due to several reasons, such as differences in variables associated with depression (such as age and socioeconomic position) and occupational cohort characteristics, as civil servants enrolled have advantages such as job stability and healthcare access not necessarily available to the Brazilian population. Therefore, ecological replication of our findings is warranted.
Our study had some limitations. Since this is an occupational cohort, it is uncertain if the findings can be generalized to a community sample. Due to the nature of the sample, unemployment, which is known as a risk factor for both depression and a more pernicious course of depressive symptoms, could not be included as a predictor. Although the lack of a large set of features can be considered a limitation, since other variables could improve further the model performance, it can also be seen as an advantage, since a small set of features that are easy and fast to collect makes a more feasible tool that can be used in large populations with small costs. In addition, we had a large sample size available, which makes the machine learning process more robust. Another limitation lies in the fact that the machine learning model uses the features to predict the outcome class, but these features are not necessarily causal factors for it, and thus the directionality predictors–outcome is hard to establish, especially regarding psychiatric comorbidities. It is also important to notice that the selected variables and their relevance are bound to the model, population, and predictors selected, and using different algorithms or parameters may alter the selected features and their relevance. In this sense, although machine learning can provide some insights into pathophysiological mechanisms or risk factors, it is not an appropriate and conclusive analysis for this purpose. Finally, an important limitation is the short follow-up period, which may have influenced the high rates of false positives found, and the fact that the CIS-R only evaluates the week before the assessment. Because of that, relevant data to the courses of the depressive disorder may be lost and even depressive episodes may not be accounted for, while for a more reliable determination of depressive trajectories, more frequent evaluations and longer periods of follow-up are required.
Conclusion
In the present study, we developed three predictive models of depressive course in an occupational cohort, using machine learning techniques. Using a small number of clinical and sociodemographic predictors, we showed that it is possible to distinguish non-depressed participants from those with depression, including incident and chronic cases, with high model performance. In addition, we also showed that clinical variables seem to be, at least for this sample, more relevant than sociodemographic variables. Knowing beforehand which individuals will have a depressive episode, and within these, which will have a more chronic and debilitating course, could help improve how we assess patients in clinical settings, shifting our focus from treating acute episodes to preventing them.
Supplementary material
The supplementary material for this article can be found at https://doi.org/10.1017/S0033291720001579.
Financial support
The ELSA-Brasil study was supported by the Brazilian Ministry of Health and CNPq (grants 01060010.00RS, 01060212.00BA, 01060300.00ES, 01060278.00MG, 01060115.00SP, 01060071.00RJ).
Conflict of interest
The authors declare that they have no competing interests.


