


Introduction
Depression is a common psychiatric feature of Huntington's disease (HD), an autosomal dominant cysteine-adenosine-guanine (CAG) triplet repeat neurodegenerative disorder with abnormal movements and dementia. Depression can occur at any point in time during the course of HD, with its severity ranging from subthreshold depressive symptoms to major depressive disorder (MDD) (Epping & Paulsen, Reference Epping and Paulsen2011). The estimated prevalence of depression in symptomatic HD varies between 30% and 45% (Paulsen et al. Reference Paulsen, Nehl, Hoth, Kanz, Benjamin, Conybeare, McDowell and Turner2005), with an estimated prevalence rate of MDD of 16.5% compared with 5.5% in the normal population (van Duijn et al. Reference van Duijn, Kingma, Timman, Zitman, Tibben, Roos and van der Mast2008). In HD, depression is highly debilitating and a key determinant of social functioning, life satisfaction and well-being (Ho et al. Reference Ho, Gilbert, Mason, Goodman and Barker2009).
MDD is a neuropsychiatric condition with low mood, loss of interest and the inability to derive pleasure from activities as its core symptoms. The aetiology of MDD is not entirely understood but biological, psychological and environmental factors very probably all contribute. Prospective longitudinal data suggest that subthreshold depressive symptoms such as mild forms of depressed mood, decreased interest in, or pleasure derived from, activities, hopelessness, worrying, decreased self-esteem and irritability may be prodromal to, and thus constitute risk factors of, MDD (Cuijpers & Smit, Reference Cuijpers and Smit2004; Iacoviello et al. Reference Iacoviello, Alloy, Abramson and Choi2010).
Several neural structures have been implicated in MDD including the mediofrontal and orbitofrontal as well as the prefrontal, premotor and cingulate cortex, hippocampus, ventral striatum, caudate, amygdala, the mid-brain ventral tegmental area and the insula (Drevets et al. Reference Drevets, Price and Furey2008; Mayberg, Reference Mayberg2009; Sexton et al. Reference Sexton, Mackay and Ebmeier2009; Liu et al. Reference Liu, Xu, Xu, Wang, Zhao, Lv, Cao, Zhang and Du2010; Peng et al. Reference Peng, Liu, Nie, Li, Shan, Wang and Li2011; Sprengelmeyer et al. Reference Sprengelmeyer, Steele, Mwangi, Kumar, Christmas, Milders and Matthews2011; Cole et al. Reference Cole, Chaddock, Farmer, Aitchison, Simmons, McGuffin and Fu2012; Liao et al. Reference Liao, Huang, Wu, Yang, Kuang, Du, Lui, Yue, Chan, Kemp and Gong2013). Recent studies have also identified the cerebellum as a structure potentially involved in MDD (Liu et al. Reference Liu, Xu, Xu, Wang, Zhao, Lv, Cao, Zhang and Du2010; Peng et al. Reference Peng, Liu, Nie, Li, Shan, Wang and Li2011; Zeng et al. Reference Zeng, Shen, Liu, Wang, Li, Fang, Zhou, Li and Hu2012).
Brain-structural changes can be detected in HD years before the occurrence of first motor signs (Tabrizi et al. Reference Tabrizi, Scahill, Durr, Roos, Leavitt, Jones, Landwehrmeyer, Fox, Johnson, Hicks, Kennard, Craufurd, Frost, Langbehn, Reilmann and Stout2011). In addition to volume loss in the striatum other brain regions are affected including parts of the depression network such as the anterior cingulate cortex (ACC), insula and cerebellum. However, less is known about the neuroanatomy underlying depression in HD than about the neuroanatomy of MDD in other contexts. Mayberg et al. (Reference Mayberg, Starkstein, Peyser, Brandt, Dannals and Folstein1992) used 2-[18F]-fluoro-2-deoxy-d-glucose (18FDG) positron emission tomography in depressed and non-depressed early HD and control participants and found that caudate, putamen and cingulate activity differentiated between controls and HD subjects regardless of mood, while mediofrontal hypometabolism differentiated the depressed from the non-depressed HD participants. Hobbs et al. (Reference Hobbs, Pedrick, Say, Frost, Dar Santos, Coleman, Sturrock, Craufurd, Stout, Leavitt, Barnes, Tabrizi and Scahill2011) found in a combined group of pre-symptomatic and symptomatic HD participants volume of the anterior part of the cingulate to be significantly correlated with the severity of depressive symptoms. Jurgens et al. (Reference Jurgens, van de Wiel, van Es, Grimbergen, Witjes-Ane, van der Grond, Middelkoop and Roos2008) reported no significant correlations between basal ganglia volume and severity of depressive symptoms in pre-symptomatic HD.
In HD, the diagnosis of MDD is challenging because many of the physical symptoms required to make a diagnosis of MDD according to the Diagnostic and Statistical Manual of Mental Disorders, fourth edition, text revision (DSM-IV-TR) can also be part of HD even in the absence of the core symptoms of sadness and anhedonia. In our study, we focus on the neuroanatomy underlying subthreshold core depressive symptoms in HD not fulfilling DSM-IV-TR criteria for MDD because subthreshold depressive symptoms are very common in HD, debilitating and sometimes qualified as a normal response to adverse life circumstances. As a consequence they may remain untreated. Insight into the neuroanatomy of subthreshold depressive symptoms in HD may help to distinguish whether they are (a) normal reactions to adverse life circumstances (e.g. sadness), (b) caused by the neuropathology of HD, and thus are an expression of HD itself, or (c) prodromal to MDD so that HD and depression are two separate disorders (Folstein et al. Reference Folstein, Abbott, Chase, Jensen and Folstein1983; Folstein & Folstein, Reference Folstein and Folstein1983). The experience of sadness involves brain structures implicated in MDD (Mayberg et al. Reference Mayberg, Liotti, Brannan, McGinnis, Mahurin, Jerabek, Silva, Tekell, Martin, Lancaster and Fox1999; Damasio et al. Reference Damasio, Grabowski, Bechara, Damasio, Ponto, Parvizi and Hichwa2000); however, a normal reaction to adverse life circumstances alone presumably does not cause macro- or microstructural brain alterations. If subthreshold depressive symptoms were caused by the neuropathology of HD, we would expect an association with neural structures typically affected in early HD (Tabrizi et al. Reference Tabrizi, Scahill, Durr, Roos, Leavitt, Jones, Landwehrmeyer, Fox, Johnson, Hicks, Kennard, Craufurd, Frost, Langbehn, Reilmann and Stout2011). If, however, subthreshold depressive symptoms were prodromal to MDD, we would expect a neuroanatomical pattern similar to that observed in MDD.
This differentiation may have treatment implications. For sadness simple psychological support may suffice while depressive symptoms linked to the neuropathology of HD may respond to HD-specific medication. In contrast, an association of subthreshold depressive symptoms with a neuroimaging signature typical for MDD would suggest a co-morbidity and indicate the need to consider interventions for preventing the progression of subthreshold depressive symptoms to full-blown MDD.
To differentiate these possibilities we explored micro- and macrostructural aspects of the neuroanatomy underlying subthreshold depressive symptoms by comparing a group of HD participants with subthreshold depressive symptoms with a group of non-depressed HD participants using voxel-based morphometry (VBM) and diffusion tensor imaging (DTI).
Method
Work Package 2 of the multi-national multi-centre PADDINGTON project (Pharmacodynamic Approaches to Demonstration of Disease-modification in Huntington's Disease by SEN0014196; http://www.paddingtonproject.eu) aims to identify biomarkers for monitoring disease progression of HD. For this, 101 participants (61 HD and 40 controls) were assessed at three different points in time, with the first and second assessments 6 months apart, and the second and third assessments 9 months apart. Participants underwent 3 T magnetic resonance imaging (MRI) (T1-, T2- and diffusion-tensor imaging) as well as motor, cognitive and neuropsychiatric testing. We report here data from participants' first assessments focusing on neuropsychological performance, depressive symptoms and their underlying neuroanatomy.
HD and control participants were recruited from the Department of Neurology at Leiden University Medical Centre, The Netherlands, the National Hospital for Neurology and Neurosurgery – University College London, England, the Department of Genetics and Cytogenetics at the Salpêtrière Hospital – UPMC, Paris, France, and the Department of Neurology, University of Ulm, Germany. A username- and password-secured web portal was used in Leiden, London, Paris and Ulm for entering the pseudonymized clinical data and for uploading MRI scans. Clinical data and MRI scans were stored on a secure server within central coordination of the European Huntington's Disease Network (EHDN) at the University of Ulm, Germany.
The project was approved by the local ethics committees and informed and written consent was obtained from all participants according to ICH (International Conference on Harmonisation) guidelines.
Behavioural assessment
Motor signs, the ability to cope with the demands of daily life, affect and cognition were assessed with the Unified Huntington's Disease Rating Scale (UHDRS; Huntington Study Group, 1996), the Hospital Anxiety and Depression Scale – Snaith Irritability Scale (HADS-SIS; Snaith et al. Reference Snaith, Constantopoulos, Jardine and McGuffin1978; Zigmond & Snaith, Reference Zigmond and Snaith1983) and neuropsychological tests.
The UHDRS motor score (range between 0 = unimpaired, and 124 = severely impaired) summarizes clinical ratings of voluntary and involuntary movements. The UHDRS total functioning capacity (TFC) score (range between 13 = unimpaired, and 0 = severely impaired) reflects the ability of participants to handle occupational, domestic and financial matters.
The HADS-SIS is a short self-report questionnaire addressing depressive symptoms (seven items), anxiety (seven items) and irritability (eight items), with a score ranging between 0 and 3 for each item, resulting in a maximum score of 21 for depression and anxiety, and 24 for irritability. For assessing irritability, we used items 4, 6, 8, 10, 12, 14, 16 and 18 of the Irritability–Depression–Anxiety (IDA) scale (Snaith et al. Reference Snaith, Constantopoulos, Jardine and McGuffin1978). These items now form the SIS extending the HADS.
To assess cognitive functioning, we used the Trail Making Test (TMT-A and TMT-B), a lexical and semantic word fluency task (WFL), and the Symbol Digit Modality Test (SDMT), all forming part of the UHDRS. In addition, we administered the Hopkins Verbal Learning Test (HVLT). The HVLT contains a list of 12 words, which have to be learned in three consecutive trials. Word lists have to be recalled immediately after each trial, and in a delayed recall condition after 20 min.
Participants
HD participants and controls
Eligible participants with HD were at least 18 years old with a CAG repeat length of 36 or larger. All participants with HD had unequivocal motor signs. Of the HD participants, 56 had UHDRS TFC scores between 11 and 13 (disease stage I, early HD), four participants had TFCs between 7 and 10 (disease stage II), and one participant had a TFC of 5 (disease stage III). Exclusion criteria were current psychiatric disorders (such as MDD, psychosis, or drug and alcohol abuse as defined by DSM-IV-TR criteria), past and current neurological disorders other than HD, head injury, currently participating in a clinical drug trial, and not being able to tolerate and safely undergo MRI. The same exclusion criteria applied to controls. Controls were partners and friends of HD participants or were recruited from hospital staff. For demographic and clinical details, see Table 1.
Table 1. Description of groups

Data are given as mean (standard deviation).
HD, Huntington's disease; non-dep, non-depressed; dep, subthreshold depressive symptoms; HADS-SIS, Hospital Anxiety and Depression Scale – Snaith Irritability Scale; UHDRS, Unified Huntington's Disease Rating Scale; TFC, total functioning capacity; CAG, cysteine-adenosine-guanine.
a Disease burden = [(CAG allele large − 35.5) × age] (Penney et al. Reference Penney, Vonsattel, MacDonald, Gusella and Myers1997).
Age was similar in controls and HD participants (t = 1.37, p = 0.17) but years of formal education tended to be higher in the control group (t = 1.95, p = 0.054).
‘Non-depression’ and ‘subthreshold depression’ HD groups
To identify neural substrates associated with subthreshold depressive symptoms in HD, the group of 61 participants with HD was divided into two groups based on the overall HD group's median depression score of 3 (as assessed with the HADS-SIS). This resulted in a group of 30 non-depressed participants (23 female), with a mean depression score of 0.8 (s.d. = 0.7), and a group of 31 participants (14 female) with subthreshold depressive symptoms. This group had a mean depression score of 7.3 (s.d. = 3.5) (Table 1). Thus, the depressed group's mean HADS depression score conforms to the optimum threshold for identifying patients likely to have MDD (Bjelland et al. Reference Bjelland, Dahl, Haug and Neckelmann2002; Vodermaier & Millman, Reference Vodermaier and Millman2011). In the ‘non-depression’ HD group, six participants were treated with anti-depressants, five participants received anti-hyperkinetic medication, and two participants a combination of anti-depressants and anti-hyperkinetic medication. In the ‘subthreshold depression’ group, six participants received anti-depressants, five participants received anti-hyperkinetic medication, and seven participants a combination of anti-depressant and anti-hyperkinetic medication.
From the 31 HD participants with subthreshold depressive symptoms, six were from Leiden, six from London, eight from Paris and 11 from Ulm. From the 30 non-depressed HD participants, 11 were from Leiden, 10 from London, five from Paris and four from Ulm. Although not stratified a priori to reach an equal distribution of HD participants with and without subthreshold depression across centres, post-hoc analysis showed no significant differences between centres [χ 2 (3, n = 61) 6.41, p = 0.093].
Both HD groups were similar for age (t = −0.90, p = 0.37), years of formal education (t = −0.021, p = 0.83), disease duration (t = −0.18, p = 0.86), UHDRS motor score (Mann–Whitney Z = −0.25, p = 0.80), UHDRS TFC (Mann–Whitney Z = −0.23, p = 0.98), number of CAG repeats on the large allele (t = 0.39, p = 0.70) or number of CAG repeats on the short allele (t = –0.84, p = 0.41) and disease burden (t = −0.78, p = 0.44).
MRI
MRI data of 101 participants were acquired using 3 T head MRI systems. Each site used a different system: Philips Achieva in Leiden, Siemens Magnetom Allegra in Ulm, Siemens Verio in Paris, and Siemens Tim Trio in London. The scanning protocol was standardized (for specifications, see online Supplementary Table S1) with careful preparatory work to ensure comparability of data from multi-site 3 T MRI (Tabrizi et al. Reference Tabrizi, Langbehn, Leavitt, Roos, Durr, Craufurd, Kennard, Hicks, Fox, Scahill, Borowsky, Tobin, Rosas, Johnson, Reilmann, Landwehrmeyer and Stout2009).
DTI: image processing and analysis
We used the DTI analysis software TIFT (Tensor Imaging and Fiber Tracking) (Mueller et al. Reference Mueller, Unrath, Sperfeld, Ludolph, Riecker and Kassubek2007) for image post-processing and for the statistical comparison of functional anisotropy (FA) maps. Prior to FA calculation, motion artifacts were eliminated in each volume and each subject separately (Mueller et al. Reference Mueller, Suessmuth, Landwehrmeyer, Ludolph, Tabrizi, Kloppel and Kassubek2011). All individual datasets were aligned to the AC-PC (anterior commissure–posterior commissure) line and linearly transformed to fit with manually set landmarks. In order to spatially normalize the scans on the Montreal Neurological Institute (MNI) stereotactic standard space (Brett et al. Reference Brett, Johnsrude and Owen2002), both a (b = 0) template and an FA template had to be created (Unrath et al. Reference Unrath, Müller, Riecker, Ludolph, Sperfeld and Kassubek2010). The first (b = 0) template was created by arithmetically averaging the (b = 0) volumes of all subjects. From averaging all FA maps of landmark-normalized datasets, the first FA template was calculated. Non-linear MNI normalization was performed using iteratively (b = 0) and FA templates. The resulting MNI normalized datasets were then used for creating improved (b = 0) and FA templates, obtained from the previous normalization step. The whole process is iterative and stops when the correlation of all individual MNI normalized (b = 0) images with the (b = 0) template is r > 0.70.
After normalization, all individual DTI datasets were used to calculate the second-rank diffusion tensor, the Eigenvalues, the Eigenvectors and the FA for quantification of the diffusion anisotropy (Basser & Jones, Reference Basser and Jones2002). For subsequent smoothing, we used an 8 mm full-width at half-maximum Gaussian filter (Unrath et al. Reference Unrath, Müller, Riecker, Ludolph, Sperfeld and Kassubek2010). FA maps of HD groups were compared voxel-wise using t tests. FA values below 0.2 were excluded from analysis (Kunimatsu et al. Reference Kunimatsu, Aoki, Masutani, Abe, Hayashi, Mori, Masumoto and Ohtomo2004). Statistical results were corrected for multiple comparisons using the false-discovery-rate algorithm (Genovese et al. Reference Genovese, Lazar and Nichols2002) with a significance level set at p < 0.05. To further reduce the α-error, we eliminated all clusters smaller than 268 voxels (corresponds to a sphere with radius 4 mm). Data from the same 61 HD participants and 40 controls as used in the current study revealed no systematic effect of scanner on the DTI FA (Mueller et al. Reference Mueller, Groen, Sprengelmeyer, Kassubek, Ludolph, Hobbs, Cole, Roos, Duerr, Tabrizi, Landwehrmeyer and Suessmuth2013).
VBM: image processing and analysis
After visually checking for data artifacts, VBM analysis was computed using Christian Gaser's VBM toolbox (http://dbm.neuro.uni-jena.de/vbm8/) running within the Statistical Parametric Mapping software package version 8 (SPM8; http://www.fil.ion.ucl.ac.uk/spm). The segmentation algorithm used by this toolbox is based on an adaptive ‘maximum a posteriori’ (MAP) technique. This approach does not require a priori information about tissue probabilities, i.e. the tissue probability maps are used for spatial normalization only (Rajapakse et al. Reference Rajapakse, Giedd and Rapoport1997). During MAP estimation, local parameter variations are modelled as varying spatial functions, taking intensity inhomogeneity and other local intensity variations into account. During the data segmentation step, each participant's original T1 image was spatially normalized and segmented into grey matter (GM), white matter (WM) and cerebrospinal fluid (CSF) based on MAP estimation. This is followed by partial volume estimation (Tohka et al. Reference Tohka, Zijdenbos and Evans2004), data de-noising based on a spatially adaptive non-local means filter (Manjon et al. Reference Manjon, Coupe, Marti-Bonmati, Collins and Robles2010) and the application of Markov random fields (Rajapakse et al. Reference Rajapakse, Giedd and Rapoport1997). The SPM8 toolbox also integrates ‘Diffeomorphic Anatomic Registration through Exponentiated Lie’ (DARTEL) algebra normalization (Ashburner, Reference Ashburner2007). After data preprocessing, the modulated normalized GM and WM segments were smoothed using an 8 mm full-width at half-maximum Gaussian filter prior to between-group analyses at the second level. Between-group comparisons were computed using t tests treating age, sex and ICV (i.e. the sum of GM, WM and CSF as derived from the segmentation process) as nuisance variables. Separate analyses were calculated to test for GM and WM volume (GMV/WMV) differences between the groups using an exploratory lenient significance threshold of p < 0.001 (uncorrected at the voxel level), p < 0.05 (corrected for spatial extent).
Data analysis and statistics
We used Student's t tests and univariate analyses of variance (ANOVA) for between-group comparisons of interval-scaled, and non-parametric Mann-Whitney U tests for ordinal-scaled measures. For correlational statistics, we used Pearson's product-moment correlation, Spearman's rank correlation, or point biserial correlation depending on the levels of measurement. Categorical variables were analysed using Pearson's χ 2 test or Fisher's exact test. All statistical tests were performed using SPSS version 19 (IBM, USA).
Results
Neuropsychological tests
HD participants performed worse than controls on the TMT-A (t = –5.65, p < 0.001), the TMT-B (t = –6.40, p < 0.001) and the lexical WFL (t = 5.53, p < 0.001) and semantic WFL (t = 6.00, p < 0.001) tasks. HD participants performed also worse than controls on the three immediate conditions and the delayed condition of the HVLT (5.40 < t < 6.33, p < 0.001), and on the SDMT (t = 7.24, p < 0.001).
The HD subgroups did not differ on the lexical WFL (t = 1.20, p = 0.12) or semantic WFL (t = 0.62, p = 0.27) tasks. However, there was a trend towards significance for the SDMT (t = 1.62, p = 0.06), and three of the four conditions of the HVLT differed significantly between groups (HVLT 1: t = 1.77, p < 0.05; HVLT 3: t = 1.71, p < 0.05; HVLT 20 min delay: t = 1.80, p < 0.05), while the remaining one showed a trend towards significance (HVLT 2: t = 1.61, p = 0.06). Groups differed significantly on the TMT-A (t = –2.03, p < 0.05), but not on the TMT-B (t = –0.60, p = 0.28). See Table 2 for details.
Table 2. Neuropsychological background tests

Data are given as mean (standard deviation).
HD, Huntington's disease; non-dep, non-depressed; dep, subthreshold depressive symptoms; WFL, Word Fluency Task; HVLT, Hopkins Verbal Learning Test; TMT-A, Trail Making Test-A; TMT-B, Trail Making Test-B; SDMT, Symbol Digit Modality Test.
Depressive symptoms, anxiety and irritability
First, we examined the participants' medical histories for a clinical diagnosis of depression and for suicide attempts. In the healthy control group, 11 participants (27.5%) had a previous clinical diagnosis of depression, and no one in this group attempted suicide. In the HD group, the number of participants with a previous diagnosis of depression was 30 (49.2%), and the number of participants with a documented suicide attempt was six (9.8%). The number of participants with a previous diagnosis of depression [χ 2 (1, n = 61) = 4.71, p < 0.05] or documented suicide attempts (Fisher's exact test, p < 0.05) was significantly higher in the HD group than in controls.
The frequencies of a history of depression [χ 2 (1, n = 61) = 1.99, p = 0.16] and suicide attempts [χ 2 (1, n = 61) = 0.002, p = 0.97] were similar in the HD subgroups. In the group with subthreshold depressive symptoms, 13 out of 31 participants (42%) had no history of depression, compared with 18 participants out of 30 (60%) in the non-depressed HD group. In either HD subgroup, three participants (10%) had attempted suicide.
We next analysed the frequency of current depressive symptoms. Using a lenient HADS-SIS depression score of 7 as a cut-off (Bjelland et al. Reference Bjelland, Dahl, Haug and Neckelmann2002), we found that 7.7% of controls had mild to moderate depressive symptoms, but 23% of participants with HD [χ 2 (1, n = 101) = 3.93, p < 0.05].
Overall, the HADS-SIS depression score (Mann–Whitney Z = −2.09, p < 0.05) and the HADS-SIS irritability score (Mann–Whitney Z = −2.40, p < 0.05) were significantly higher in the entire HD group compared with controls, while the HADS-SIS anxiety score (Mann–Whitney Z = −1.55, p = 0.12) was similar. In the HD subgroups derived from the HADS-SIS depression score median split, the HADS-SIS anxiety score (Mann–Whitney Z = −3.66, p < 0.001) and the HADS-SIS irritability score (Mann–Whitney Z = −3.38, p < 0.01) were higher in the ‘subthreshold depression’ group.
We finally analysed whether the HADS-SIS depression score was linked to the severity of HD. The depression score was not related to the UHDRS motor score (Spearman's ρ = 0.01, p = 0.95) or disease burden (Spearman's ρ = 0.10, p = 0.46).
DTI results
The main aim of this study was to explore the neuroanatomy of subthreshold depressive symptoms in HD. To this end, the group of 61 participants with HD was divided into two groups based on the overall HD group's median HADS-SIS depression score of 3. Whole-brain-based spatial t-statistics revealed seven clusters with a voxel size of greater than 268, in which FA was significantly reduced in the ‘subthreshold depression’ compared with the ‘non-depression’ HD group. FA was decreased in the left and right cerebellum, the left and right ventromedial frontal cortex, the left insula, the ACC and the left superior frontal cortex (Fig. 1 a–d; see Table 3 for MNI coordinates, cluster size and mean significance levels of the identified clusters). In a univariate ANOVA with averaged FA values of these clusters as the dependent variable and group (‘non-depression’ versus ‘subthreshold depression’) as a fixed factor (F 1,58 = 18.26, p < 0.001), the covariates sex, lexical and semantic WFL, SDMT, HVLT, TMT-A and TMT-B were not significant (0.31 < F < 2.48, 0.12 < p < 0.86).
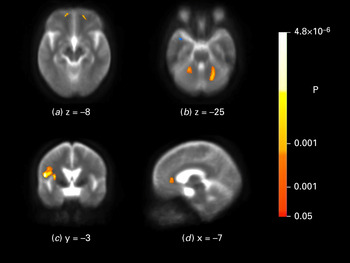
Fig. 1. Brain maps depicting fractional anisotropy (FA) differences between the ‘non-depression’ and ‘subthreshold depression’ Huntington's disease groups. In the ‘subthreshold depression’ group FA was lower in the left and right cerebellum (a), in the left and right ventromedial frontal cortex (b), in the insula (c) and in the anterior cingulate cortex (d). Brain maps are shown according to neurological convention.
Table 3. Cerebral regions with reduced fractional anisotropy in Huntington's disease participants with subthreshold depression

ACC, Anterior cingulate cortex; VMFC, ventromedial frontal cortex; SFC, superior frontal cortex.
a Cluster is below the threshold of 268 voxels, but symmetrical to the contralateral VMFC and therefore reported.
In the HD group (n = 61), there was a strong correlation of the HADS-SIS depression score with the anxiety (Spearman's ρ = 0.64, p < 0.001) and irritability score (Spearman's ρ = 0.58, p < 0.001). We therefore correlated the HADS-SIS anxiety and irritability scores of the 61 HD participants with the overall mean FA value of the clusters resulting from the comparison of the ‘non-depression’ and ‘subthreshold depression’ HD groups. This gave strong correlations for the anxiety score (Spearman's ρ = 0.40, p < 0.01) and the irritability score (Spearman's ρ = 0.45, p < 0.001).
We next assessed whether there was an association of the overall mean FA values of brain regions associated with depressive symptoms with indicators of HD severity. There was no significant correlation of FA values with the UHDRS motor score (Spearman's ρ = −0.12, p = 0.36) or disease burden (Spearman's ρ = 0.16, p = 0.22).
We then tested whether FA differences were due to a history of depression, and thus may reflect chronic brain-structural changes as a result of previous depression. The overall mean FA of depression-relevant regions was not associated with a previous diagnosis of depression [point biserial correlation r (pb) = 0.14, p = 0.30].
Given that depression may be associated with mild neuropsychological impairments, we explored the potential contribution of the identified regions to cognitive deficits. Most prominent were the moderate to strong correlations of the HVLT and TMT-A and SDMT outcome variables with FA values of the ACC, and the moderate correlations of the HVLT and TMT-A scores with FA of the insula (see Table 4).
Table 4. Correlation (Spearman's ρ) of fractional anisotropy of cerebral regions linked to depressive symptoms with neuropsychological background data

ACC, Anterior cingulate cortex; VMFC, ventromedial frontal cortex; SFC, superior frontal cortex; WFL, Word Fluency Task; HVLT, Hopkins Verbal Learning Test; TMT-A, Trail Making Test-A; TMT-B, Trail Making Test-B; SDMT, Symbol Digit Modality Test.
* p < 0.05, ** p < 0.01, two-sided; significant results: n = 61; α = 0.05; power (1 − β) > 0.80.
VBM results
There were no significant between-group differences for GMV and WMV measures. Calculating a whole-brain voxel-wise second-level regression model with GMV and WMV as the dependent variable, HADS-SIS depression score as the predictor variable, and age, sex, and history of depression as covariates there were no significant effects for any of the entered variables (p < 0.001, uncorrected at the voxel level; p < 0.05 corrected for spatial extent).
Discussion
Our explorative study shows that in early HD participants, subthreshold depressive symptoms are more common and more severe than in controls but are not linked to clinical or biological indicators of HD severity. Neuroimaging further revealed that subthreshold depressive symptoms in early HD are associated with microstructural changes – without evidence of concomitant loss of GM or WM – in brain regions known to be involved in MDD but not those predominantly associated with HD pathology.
Consistent with previous literature, the frequency of current subthreshold depressive symptoms was higher in participants with HD than in our spouse controls in whom depression was probably higher than in the normal population (van Duijn et al. Reference van Duijn, Kingma, Timman, Zitman, Tibben, Roos and van der Mast2008). In HD, depressive symptoms were closely associated with symptoms of anxiety and irritability. This is consistent with the notion that these symptom complexes are part of a spectrum of related indicators of emotional discomfort.
Our HD participants were in the early stages of disease, a time when people with HD start being confronted with the reality of suffering from an inexorably progressive degenerative disease that invariably leads to the loss of independence. The need for complex adjustments coupled with preserved insight into the significance of HD symptoms may be one factor explaining why depressive symptoms seem to be particularly common in early HD (Paulsen et al. Reference Paulsen, Nehl, Hoth, Kanz, Benjamin, Conybeare, McDowell and Turner2005). Adverse life circumstances may therefore play an important role in triggering and maintaining depression in people with HD.
There is also evidence that links depression to the biology of HD. In non-symptomatic at-risk individuals undergoing predictive testing, ‘HD gene carriers’ had a higher rate of depression than those who turned out not to have inherited the HD mutation (Julien et al. Reference Julien, Thompson, Wild, Yardumian, Snowden, Turner and Craufurd2007). Those without the HD mutation had a rate of depressive symptoms only marginally higher than in the normal population. These findings emphasize the potential biological role that the HD gene may play as an important factor in developing depression. However, a strong link between depression and the neuropathology of HD would imply that all people with HD are depressed and that depressive symptoms worsen with progression of the disease.
Our data show no significant correlation of motor impairment, or disease burden, with depression score. This is in line with a previous report (Zappacosta et al. Reference Zappacosta, Monza, Meoni, Austoni, Soliveri, Gellera, Alberti, Mantero, Penati, Caraceni and Girotti1996). In addition, van Duijn et al. (Reference van Duijn, Reedeker, Giltay, Roos and van der Mast2012) reported an increase in severity of motor deficits and a significant decrease in severity of depression in a 2-year follow-up study. These findings suggest that motor and affective processes are separable on a functional level and imply a double dissociation, in that affective disturbances and motor deficits in HD are possibly associated with separable neural substrates.
Cognitive test performance differed significantly between controls and participants with HD, reflecting the impact of disease progression on the cognitive domain. In addition, we found reduced cognitive performance in the ‘subthreshold depression’ compared with the ‘non-depression’ HD group, which suggests a relationship between mood and cognition in the HD group with subthreshold depressive symptoms (Nehl et al. Reference Nehl, Ready, Hamilton and Paulsen2001; Smith et al. Reference Smith, Mills, Epping, Westervelt and Paulsen2012).
We next explored the brain-structural basis of subthreshold depressive symptoms in HD participants. To this end we compared WMV and GMV, and brain microstructural changes, of the ‘subthreshold depression’ and ‘non-depression’ group. WMV and GMV were similar in both groups. DTI FA maps, however, revealed microstructural changes that differentiated the ‘non-depression’ from the ‘subthreshold depression’ HD group. In the latter group we identified clusters of reduced FA in the medial frontal and superior frontal cortex, the ACC, the insular cortex and the cerebellum. This pattern of clusters strikingly resembled that described previously for MDD (Drevets et al. Reference Drevets, Price and Furey2008; Fitzgerald et al. Reference Fitzgerald, Laird, Maller and Daskalakis2008) but contrasts with the DTI metrics differentiating HD from controls using the same 61 HD and 40 control participants as in the present study (Mueller et al. Reference Mueller, Groen, Sprengelmeyer, Kassubek, Ludolph, Hobbs, Cole, Roos, Duerr, Tabrizi, Landwehrmeyer and Suessmuth2013). The involvement of ventromedial and superior frontal regions as well as the ACC in affective disorders has been reported in numerous studies (Drevets et al. Reference Drevets, Price and Furey2008). Volume reduction of the insular cortex in current and remitted MDD has been found (Takahashi et al. Reference Takahashi, Yücel, Lorenzetti, Tanino, Whittle, Suzuki, Walterfang, Pantelis and Allen2010; Peng et al. Reference Peng, Liu, Nie, Li, Shan, Wang and Li2011; Soriano-Mas et al. Reference Soriano-Mas, Hernandez-Ribas, Pujol, Urretavizcaya, Deus, Harrison, Ortiz, Lopez-Sola, Menchon and Cardoner2011) as well as decreased regional homogeneity in resting-state functional MRI (Liu et al. Reference Liu, Xu, Xu, Wang, Zhao, Lv, Cao, Zhang and Du2010). In addition, insular cortex volume correlates with severity of depressive symptoms (Sprengelmeyer et al. Reference Sprengelmeyer, Steele, Mwangi, Kumar, Christmas, Milders and Matthews2011) in people with MDD. Recent research also suggests that the cerebellum may form part of the neural substrate underlying depression (Fitzgerald et al. Reference Fitzgerald, Laird, Maller and Daskalakis2008; Liu et al. Reference Liu, Xu, Xu, Wang, Zhao, Lv, Cao, Zhang and Du2010; Peng et al. Reference Peng, Liu, Nie, Li, Shan, Wang and Li2011; Zeng et al. Reference Zeng, Shen, Liu, Wang, Li, Fang, Zhou, Li and Hu2012).
In our HD participants, microstructural changes as well as severity of current depressive symptoms were not associated with a history of depression. Thus, microstructural changes are probably due to current depressive symptoms and not residuals from a depressive episode earlier in life. Consistent with their strong correlation with depressive symptoms, measures of anxiety and irritability were also correlated with FA values in the brain regions associated with depression. This does not mean that they are necessarily an expression of the same underlying disorder. Irritability is often more severe in HD than in people suffering from MDD. In addition, in HD depression and irritability can be separated using factor analysis (Epping et al. Reference Epping, Mills, Beglinger, Fiedorowicz, Craufurd, Smith, Groves, Bijanki, Downing, Williams, Long and Paulsen2013), and both depression and irritability follow different trajectories across different disease stages (Tabrizi et al. Reference Tabrizi, Scahill, Durr, Roos, Leavitt, Jones, Landwehrmeyer, Fox, Johnson, Hicks, Kennard, Craufurd, Frost, Langbehn, Reilmann and Stout2011). Future studies therefore need to differentiate the neural substrates of depression, anxiety and irritability.
In line with the subthreshold nature of depressive symptoms, the microstructural changes were not associated with changes in WMV or GMV. This suggests that depression-related microstructural changes precede the loss of GMV or WMV that can be observed in MDD.
Depression and HD may be two separate disorders (Folstein et al. Reference Folstein, Abbott, Chase, Jensen and Folstein1983; Folstein & Folstein, Reference Folstein and Folstein1983). This would account for the higher incidence rate of depression in non-symptomatic and symptomatic HD gene carriers compared with non-carriers from HD families and the normal population. It would also explain the relative independence of core symptoms of HD and depression.
HD-specific brain-structural changes may include brain regions involved in depression. In HD patients with the predisposition for depression, HD-related and depression-related brain-structural changes can add up and cause mood alterations, emotional dysfunction and mild cognitive deficits (Smith et al. Reference Smith, Mills, Epping, Westervelt and Paulsen2012). In our participants, the association of mood and cognition is supported by the association of cognitive performance with microstructural changes in the ACC, the insular cortex and the cerebellum. This is in accordance with findings from previous studies linking the ACC with more general aspects of cognition, such as cognitive control and error monitoring (Bush et al. Reference Bush, Luu and Posner2000), and the insula and cerebellum with verbal memory functions (Grasby et al. Reference Grasby, Frith, Friston, Bench, Frackowiak and Dolan1993; Manes et al. Reference Manes, Springer, Jorge and Robinson1999). Together, mood alterations and cognitive impairments may further reduce the ability to cope with challenging situations. Once initiated, a vicious cycle of depression starts, with subthreshold depressive symptoms eventually progressing to MDD. In contrast, people with no predisposition for depression may only suffer from HD-specific brain changes, which do not involve depression-relevant brain regions to such a degree that depressive symptoms occur.
Our findings may have implications for the treatment and care of people with non-symptomatic and symptomatic HD. Given that subthreshold depressive symptoms show a similar imaging signature as MDD, these symptoms are potentially prodromal to, and may develop into, MDD similar to people not having HD. This emphasizes the importance of careful screening and monitoring of even mild depressive symptoms, e.g. using the HADS-SIS. Further research is needed to probe whether depressive symptoms in HD patients not fulfilling DSM-IV-TR criteria for MDD should be treated just like MDD with anti-depressants and psychotherapy tailored to the needs of people with HD. The potential role of adverse environmental circumstances for triggering depression implies that challenging life situations and stressful events have to be seen as risk factors and need to be addressed.
Supplementary material
For supplementary material accompanying this paper, visit http://dx.doi.org/10.1017/S003329171300247X.
Acknowledgements
The authors thank all participants who took part in this study, along with all the Work Package 2 site staff at Leiden, London, Paris and Ulm. This work has been supported by the European Union PADDINGTON project (contract no. HEALTH-F2-2010-261358). Some of this work was undertaken at University College London Hospital and University College London (UCLH/UCL), which received a proportion of funding from the Department of Health's National Institute for Health Research (NIHR) Biomedical Research Centres Funding Scheme.
Declaration of Interest
None.


