


Introduction
Schizophrenia and bipolar disorder are highly heritable disorders with phenotypic and genotypic overlap (Lichtenstein et al., Reference Lichtenstein, Yip, Bjork, Pawitan, Cannon, Sullivan and Hultman2009; Tesli et al., Reference Tesli, Espeseth, Bettella, Mattingsdal, Aas, Melle, Djurovic and Andreassen2014). Despite intensive research, the underlying mechanisms are still unresolved (Grande et al., Reference Grande, Berk, Birmaher and Vieta2016; Owen et al., Reference Owen, Sawa and Mortensen2016). To enable better treatments and potentially preventive measures, there is a continuing need for research pursuing pathophysiological components by taking advantage of new and advanced methods for mapping of biological processes.
The complexity of neuroactive substances and signaling involved in mental processes imply the need for comprehensive assessments of signaling pathways and physiological processes to unveil the mechanisms of severe mental disorders. Metabolomics, the analysis of a broad spectrum of metabolites from the metabolic processes and interactions in the body, is an emerging method enabling characterization of the actual metabolic status of an individual (Kaddurah-Daouk and Krishnan, Reference Kaddurah-Daouk and Krishnan2009; Guest et al., Reference Guest, Guest and Martins-de2015; Sethi and Brietzke, Reference Sethi and Brietzke2015). Metabolomics have already been applied in both central and peripheral tissues in severe mental disorders and other brain disorders (Yao et al., Reference Yao, Dougherty, Reddy, Keshavan, Montrose, Matson, McEvoy and Kaddurah-Daouk2010a, Reference Yao, Dougherty, Reddy, Keshavan, Montrose, Matson, Rozen, Krishnan, McEvoy and Kaddurah-Daouk2010b, Reference Yao, Condray, Dougherty, Keshavan, Montrose, Matson, McEvoy, Kaddurah-Daouk and Reddy2012; Condray et al., Reference Condray, Dougherty, Keshavan, Reddy, Haas, Montrose, Matson, McEvoy, Kaddurah-Daouk and Yao2011; Kaddurah-Daouk et al., Reference Kaddurah-Daouk, Yuan, Boyle, Matson, Wang, Zeng, Zhu, Dougherty, Yao, Chen, Guitart, Carlson, Neumeister, Zarate, Krishnan, Manji and Drevets2012, Reference Kaddurah-Daouk, Zhu, Sharma, Bogdanov, Rozen, Matson, Oki, Motsinger-Reif, Churchill, Lei, Appleby, Kling, Trojanowski, Doraiswamy and Arnold2013; Motsinger-Reif et al., Reference Motsinger-Reif, Zhu, Kling, Matson, Sharma, Fiehn, Reif, Appleby, Doraiswamy, Trojanowski, Kaddurah-Daouk and Arnold2013; Fazio et al., Reference Fazio, Lionetto, Curto, Iacovelli, Cavallari, Zappulla, Ulivieri, Napoletano, Capi, Corigliano, Scaccianoce, Caruso, Miele, De Fusco, Di Menna, Comparelli, De Carolis, Gradini, Nistico, De Blasi, Girardi, Bruno, Battaglia, Nicoletti and Simmaco2015; Gupta et al., Reference Gupta, Neavin, Liu, Biernacka, Hall-Flavin, Bobo, Frye, Skime, Jenkins, Batzler, Kalari, Matson, Bhasin, Zhu, Mushiroda, Nakamura, Kubo, Wang, Kaddurah-Daouk and Weinshilboum2016; Rotroff et al., Reference Rotroff, Corum, Motsinger-Reif, Fiehn, Bottrel, Drevets, Singh, Salvadore and Kaddurah-Daouk2016; Zhang et al., Reference Zhang, Zhang, Ali, Al, Pickard and Watson2016). These studies have identified several potential biomarkers (Oresic et al., Reference Oresic, Tang, Seppanen-Laakso, Mattila, Saarni, Saarni, Lonnqvist, Sysi-Aho, Hyotylainen, Perala and Suvisaari2011; Kaddurah-Daouk et al., Reference Kaddurah-Daouk, Yuan, Boyle, Matson, Wang, Zeng, Zhu, Dougherty, Yao, Chen, Guitart, Carlson, Neumeister, Zarate, Krishnan, Manji and Drevets2012; Yoshimi et al., Reference Yoshimi, Futamura, Kakumoto, Salehi, Sellgren, Holmen-Larsson, Jakobsson, Palsson, Landen and Hashimoto2016), being able to distinguish diagnostic groups from healthy controls (Bicikova et al., Reference Bicikova, Hill, Ripova, Mohr and Hampl2013; Motsinger-Reif et al., Reference Motsinger-Reif, Zhu, Kling, Matson, Sharma, Fiehn, Reif, Appleby, Doraiswamy, Trojanowski, Kaddurah-Daouk and Arnold2013; Fukushima et al., Reference Fukushima, Iizuka, Yokota, Suzuki, Ohno, Kono, Nishikiori, Seki, Ichiba, Watanabe, Hongo, Utsunomiya, Nakatani, Sadamoto and Yoshio2014; Liu et al., Reference Liu, Zheng, Liu, Xu, Mu, Guo, Huang, Meng and Xie2014; Xu et al., Reference Xu, Zheng, Ren, Liu, Mu, Guo, Cao, Liu, Meng and Xie2014; Tasic et al., Reference Tasic, Pontes, Carvalho, Cruz, Dal, Sethi, Pedrini, Rizzo, Zeni-Graiff, Asevedo, Lacerda, Bressan, Poppi, Brietzke and Hayashi2017). Disease-related processes indicated by biomarkers from metabolomics studies include such as neurotransmission, energy metabolism, mitochondrial functioning and oxidative stress (Sethi and Brietzke, Reference Sethi and Brietzke2015).
Despite promising results, metabolomics is a novel approach and studies of severe mental disorders suffer from essential shortcomings. These include potential for confounding effects of medication and other extraneous factors (Turck and Filiou, Reference Turck and Filiou2015) and risk of type 1 errors due to multiple testing based on a broad range of metabolites. To overcome these limitations, large and well-characterized samples of patients and healthy controls are needed to be able to control for several confounders, including analyzes of metabolite levels in individuals free from psychotropic drugs and other medications. Moreover, the use of large samples across psychotic disorders makes it possible to alleviate the issue of multiple testing. As bipolar disorders and schizophrenia spectrum disorders are pathophysiological related disorders (Cardno and Owen, Reference Cardno and Owen2014; Volk et al., Reference Volk, Sampson, Zhang, Edelson and Lewis2016) metabolite findings of one group could be tested in the other diagnostic group. Being able to replicate findings across the two disorders would strengthen the findings and simultaneously indicate mechanisms in common for the disorders.
In the present metabolomics study, we investigated a predefined range of metabolites including monoamine-, purine- and sulfur amino acid pathways, in a large sample of both bipolar and schizophrenia spectrum disorders. We aimed at identifying pathophysiologically related metabolites targeting well-known candidate pathways of psychosis spectrum disorders mechanisms. We hypothesized dysregulations mainly related to tryptophan, tyrosine and purine pathways (Fig. 1) as established pathophysiological candidates involving dopamine, norepinephrine, epinephrine, serotonin and purine metabolism (Gysin et al., Reference Gysin, Kraftsik, Sandell, Bovet, Chappuis, Conus, Deppen, Preisig, Ruiz, Steullet, Tosic, Werge, Cuenod and Do2007; Michel et al., Reference Michel, Sheldrick, Camara, Grunblatt, Schneider and Riederer2011; Ortiz et al., Reference Ortiz, Ulrich, Zarate and Machado-Vieira2015; Grande et al., Reference Grande, Berk, Birmaher and Vieta2016; Owen et al., Reference Owen, Sawa and Mortensen2016; Lieberman and First, Reference Lieberman and First2018), and with conclusions based on replicated findings in the two diagnostic groups in medication-free individuals.
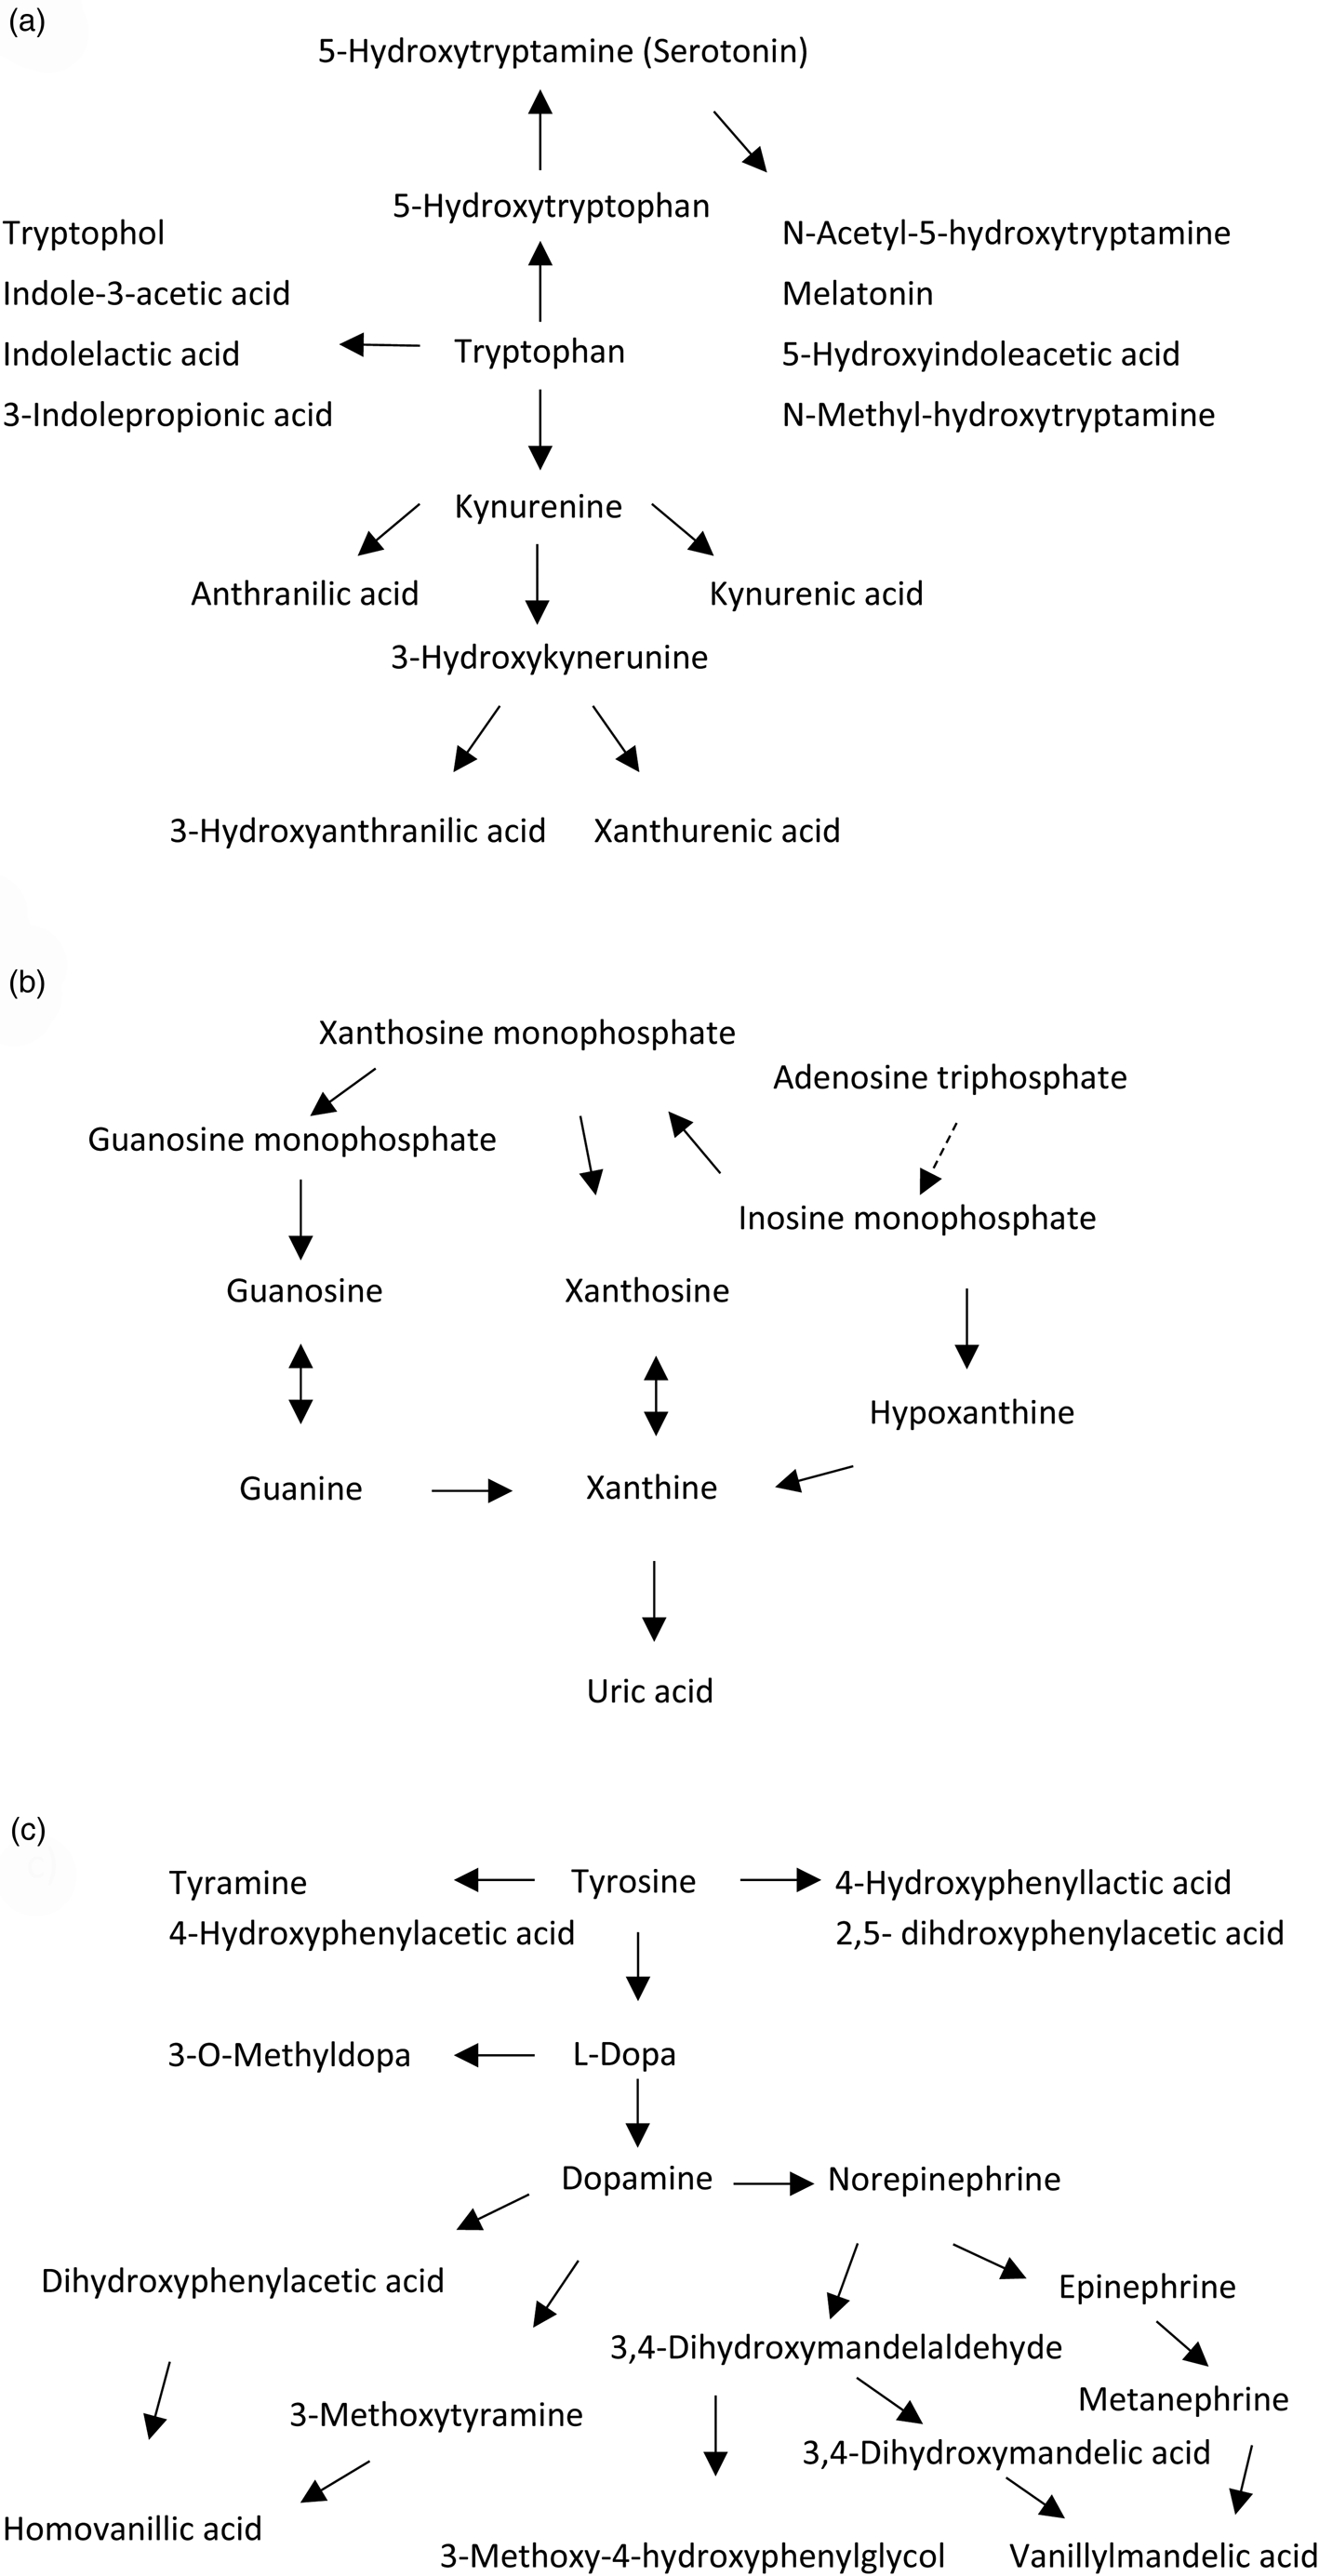
Fig. 1. Metabolites of the (a) tryptophan, (b) purine and (c) tyrosine pathways assessed in the study.
Methods
Participants
Patients were included through the ongoing Thematically Organized Psychosis (TOP) Study carried out at the University Hospitals of Oslo, Norway. General inclusion criteria for the TOP study are (1) being registered in the psychiatric services of any one of the participating hospitals, (2) age 18–65 years, (3) meeting the Diagnostic and Statistical Manual of Mental Disorders (DSM)-IV criteria for bipolar or schizophrenia spectrum disorders, and (4) to be willing and able to give written, informed consent to participation. General exclusion criteria are a history of moderate or severe head injury, serious somatic illness, neurological disorder and mental retardation.
Included in the current substudy were consecutively referred patients (N = 212) and a healthy control group (N = 68) included from 2004 to 2013, with metabolomics measurements. Duration of illness [median (interquartile range)] was 4 (9) years for the total patient sample and 7 (16) years for the unmedicated (N = 52) patients. The patients had a DSM-IV Schizophrenia and Other Psychotic Disorders diagnosis, excluding Psychotic Disorder Due to a General Medical Condition and Substance-Induced Psychotic Disorder, in the following termed ‘schizophrenia spectrum’ [SCZ, N = 139 (25 unmedicated)], or any type of DSM-IV Bipolar Disorder diagnosis, in the following termed ‘bipolar disorder’ [BD, N = 73 (27 unmedicated)]. The reason for not receiving medication was usually early phase of disease or discontinuation. The healthy control group [N = 68, (50 unmedicated), 18 typically used over-the-counter painkillers, contraceptives or antiallergics] was randomly selected from statistical records from the same catchment area as the patients. Table 1 shows the sample characteristics.
Table 1. Demographic and clinical variables across the sample

BD, Bipolar disorders; BMI, Body mass index; CDSS, Calgary depression scale for schizophrenia; GAF-S, Global assessment of functioning, symptom scale; HC, Healthy controls; IDS, Inventory of depressive symptomatology; SCI-PANSS, Structured clinical interview for the positive and negative syndrome scale; SCZ, Schizophrenia and other psychotic disorders (DSM IV, excluding Psychotic Disorder due to a General Medical Condition and Substance-Induced Psychotic Disorder); YMRS, Young mania rating scale.
a 15.1% missing values for CDSS total score and 31.7% missing values for YMRS total score in the SCZ group; 17.6% missing values for BMI in the HC group. Other variables: 0–9.6% missing values per variable within each patient group.
*p < 0.05, **p⩽0.01 and ***p < 0.001 v. SCZ. HC did not differ significantly from the diagnostic groups on sex or age.
Clinical assessments
Inclusion and diagnostic interviews were done by trained medical doctors and psychologists using The Structured Clinical Interview for DSM-IV Axis I Disorders, SCID 1 (First et al., Reference First, Spitzer, Gibbon and Williams1995). The Inventory of Depressive Symptomatology-Clinician Rated (IDS-C, BD group) (Rush et al., Reference Rush, Gullion, Basco, Jarrett and Trivedi1996), Calgary depression scale for schizophrenia (CDSS, SCZ group) (Addington et al., Reference Addington, Addington and Schissel1990), Young Mania Rating Scale (YMRS) (Young et al., Reference Young, Biggs, Ziegler and Meyer1978), the Structured Clinical Interview for the Positive and Negative Syndrome Scale (SCI-PANSS) (Kay et al., Reference Kay, Fiszbein and Opler1987), and Global Assessment of Functioning, symptom scale (GAF-S) (Pedersen et al., Reference Pedersen, Hagtvet and Karterud2007) were used for symptom assessments (Table 1).
In addition, a series of clinical characteristics were assessed including illicit drug use (number of times used in the last 2 weeks), use of tobacco (yes/no), body mass index (BMI) and diet (complete list given in Table 1). Diet was assessed by interview as very or moderate unhealthy or healthy during the last 6 months, and dichotomized as unhealthy (very or moderate) or healthy in the analyses. The items early morning awakening from IDS and CDSS were used as a measure of sleep pattern (Mukherjee et al., Reference Mukherjee, Krishnamurthy, Millett, Reider, Can, Groer, Fuchs, Postolache and Saunders2018).
Sample collection and metabolomics concentration analyses
Blood was drawn from the antecubital vein in the morning while participants were fasting. The sample was centrifuged for 15 min at 1200 × g while the temperature was kept at 4 °C in a cooled centrifuge. Then the plasma was rapidly collected in a conic tube and immediately frozen at −80 °C. All samples were collected and prepared by the same personnel at the same laboratory.
Plasma samples were analyzed using a liquid chromatography electrochemical array (LCECA) platform that has been extensively validated and used in our prior studies in neurodegenerative and psychiatric disorders (Rozen et al., Reference Rozen, Cudkowicz, Bogdanov, Matson, Kristal, Beecher, Harrison, Vouros, Flarakos, Vigneau-Callahan, Matson, Newhall, Beal, Brown and Kaddurah-Daouk2005; Bogdanov et al., Reference Bogdanov, Matson, Wang, Matson, Saunders-Pullman, Bressman and Flint2008; Johansen et al., Reference Johansen, Wang, Aasly, White, Matson, Henchcliffe, Beal and Bogdanov2009; Kaddurah-Daouk et al., Reference Kaddurah-Daouk, Zhu, Sharma, Bogdanov, Rozen, Matson, Oki, Motsinger-Reif, Churchill, Lei, Appleby, Kling, Trojanowski, Doraiswamy and Arnold2013; Zhu et al., Reference Zhu, Bogdanov, Boyle, Matson, Sharma, Matson, Churchill, Fiehn, Rush, Krishnan, Pickering, Delnomdedieu and Kaddurah-Daouk2013). Targeted assays with the LCECA platform include compounds from the tyrosine, tryptophan, purine and sulfur amino acid pathways, vitamins, oxidative, nitrative and methylation markers and a number of drugs and metabolites. The complete list of metabolites analyzed is shown in Table 2.
Table 2. List of metabolites assessed

Metabolites from tyrosine, tryptophan, phenylalanine, purine and sulfur amino acid pathways and vitamins analyzed with a liquid chromatography electrochemical array (LCECA) platform.
a Non-parametric analyses applied.
Ethics
The investigation was carried out in accordance with the Declaration of Helsinki. After complete description of the study to the subjects, written informed consent was obtained. The Regional Ethics Committee and The Norwegian Data Inspectorate approved the study. The Norwegian Directorate of Health approved the biobank.
Statistical analysis
For testing between-group differences of demographic and clinical data we used Mann–Whitney U test and χ2 test for continuous and categorical variables, respectively (Table 1). Metabolite plasma concentrations were compared between all patients and healthy controls and between SCZ and BD with ANCOVA, applying adjustments with backward elimination of number of affective episodes, number of psychotic episodes (proxies for duration of illness and illness course), BMI, GAF-S (for comparison of SCZ and BD), age and sex. Due to skewed distributions, metabolite concentrations were transformed using logarithmic, square root and inverse transformations as appropriate. Number of psychotic and affective episodes were set at zero for healthy controls. The Mann–Whitney U test was used for variables not fulfilling criteria for parametric analyses (see Table 2).
To further test the significant associations of the main analyses for potential confounding of the demographic and clinical variables not recorded in healthy controls [use of illicit drugs, alcohol and tobacco; diet; level of symptoms (general; affective, including sleep pattern; and psychosis)], we first identified the variables significantly associated with metabolite concentrations in the patient group (Table 3). Secondly, we grouped patients according to being below or above (defined as equal or above) the median (continuous variables) and according to the categories (dichotomous variables) of these variables. We then compared metabolite concentrations of each of these subgroups of patients with those of the healthy control group. Spearman's rho was applied for the association analyses between metabolite concentrations and continuous clinical variables and independent samples t tests were applied for analyses across groups (Mann–Whitney U test for 2,5 dihdroxyphenylacetic acid (HGA)) (Table 3).
Table 3. Metabolite plasma concentrations according to demographic and clinical variables in patients

CDSS, Calgary depression scale for schizophrenia; GAF-S, Global assessment of functioning, symptom scale; HGA, 2,5 dihdroxyphenylacetic acid; ns, not significant; MN, metanephrine; r, Spearman's rho; SCI-PANSS, Structured clinical interview for the positive and negative syndrome scale; SCZ, Schizophrenia and other psychotic disorders (DSM IV, excluding Psychotic Disorder Due to a General Medical Condition and Substance-Induced Psychotic Disorder); 3OHKY, 3-hydroxykynurenine; XANU, xanthurenic acid
Less-than and greater-than signs (‘<’, ‘>’) indicate relative level of metabolite concentrations between groups
Underlining explains abbreviations of the categories within each variable.
Analyses of patients (P) v. healthy controls (HC): Trendp < 0.1, *p < 0.05, **p ⩽ 0.01, ***p < 0.001.
Analyses within the total patient sample: †p < 0.05, ††p ⩽ 0.01 and †††p < 0.001.
a Last 2 weeks.
b Unhealthy = medium or very unhealthy, patient-rated.
c Total score.
d Lifetime number.
Level of significance was set at p < 0.00096 for the testing of metabolite concentration differences in the total patient sample of both medicated and medication-free individuals v. healthy controls, to correct for multiple statistical testing (a total of 52 metabolites). Significant findings in the total patient sample were further tested using ANCOVA with adjustments for sex and age in only medication-free individuals for replicated differences in both SCZ and BD separately at the level of p < 0.05; significant findings in the psychosis spectrum group, SCZ, are only reported if findings in the more uniform group of patients with a schizophrenia specific diagnosis (SZdiagn) were insignificant.
Results
Metabolite concentrations in patients and healthy controls
Total patient sample v. healthy controls
Plasma concentrations of 3-hydroxykynurenine (3OHKY), xanthurenic acid (XANU), xanthine (XAN), vanillylmandelic acid (VMA) and metanephrine (MN) differed significantly in the total patient sample compared to the healthy controls in analyses independent of medication status. Lower concentrations in patients v. healthy controls were found for 3OHKY (F = 11.5, df = 1, p = 0.0008, Fig. 2a), XANU (F = 19.5, df = 1, p = 1.5×10⁻⁵, Fig. 2b), VMA (F = 17.2, df = 1, p = 4.5×10⁻⁵, Fig. 2c) and MN (F = 15.0, df = 1, p = 0.0001). Higher plasma concentrations in patients v. healthy controls were found for XAN (F = 17.7, df = 1, p = 3.5×10⁻⁵, Fig. 2d). For p-values of metabolite comparisons between all patients and healthy controls not given in the main text, please see online Supplementary Table S1.

Fig. 2. Box plots of plasma concentration measured in ng/ml of (a) 3-hydroxykynurenine (3OHKY), (b) xanthurenic acid (XANU), (c) vanillylmandelic acid (VMA) and (d) xanthine (XAN) with significant differences in both Schizophrenia or Schizophrenia spectrum disorders and Bipolar disorder samples relative to healthy controls in medication-free (left side of plots) individuals; the right side of the plots shows the respective blood concentrations of the total sample of patients v. healthy controls independent of medication status. The boxes represent 25th and 75th percentiles and whiskers represent 1.5 times the interquartile range. Markers for particularly high plasma concentration values (ng/ml) of unmedicated bipolar disorder [(a): 87.0], unmedicated healthy controls [(b): 307.2; (c): 274.3, 348.7, 365.7], all patients [(a): 87.0, 97.6, 149.6, 154.8, 223.4, 236.2; (b): 294.2; (c): 430.7; (d): 359.9] and all healthy controls [(a): 91.2, 112.9; (b): 307.2; (c): 274.3, 348.7, 365.7; (d): 251.3, 378.3] are omitted from the plots to get a suitable scaling of the y-axis.
BD v. SCZ
Glutathione (reduced) was lower in BD compared to SCZ (p = 0.017), and 5-hydroxytryptophan higher in BD compared to SCZ (p = 0.037). Otherwise there were no significant metabolite concentration differences between BD and SCZ.
BD and SCZ medication-free subsamples v. healthy controls
Of those metabolites with significantly different plasma levels in the total patient sample compared to healthy controls, significantly lower plasma concentration of 3OHKY [SCZ (p = 0.021); BD (p = 0.013), Fig. 2a], XANU [SZdiagn (p = 0.007); BD (p = 0.0002), Fig. 2b] and VMA [SCZ (p = 0.027); BD (p = 0.003), Fig. 2c], and significantly higher plasma concentration of XAN [SCZ (p = 0.002); BD (p = 0.013), Fig. 2d] were found across SCZ and BD medication-free subsamples. MN did not differ significantly from healthy controls in SCZ or BD medication-free subsamples.
Lower plasma concentration of HGA were suggested across SCZ (p = 0.011) and BD (p = 0.033) medication-free subsamples based on a trend level lower concentration in the total patient sample (p = 0.003, online Supplementary Fig. S1). Lower plasma concentrations of dopamine were suggested in all patients (trend level, p = 0.00097) compared to healthy controls, but were not replicated across SCZ (ns) and BD (p = 0.014) in medication-free subsamples. Otherwise there were no metabolites with significant differences in both the medication-free subsamples v. healthy controls.
Metabolite concentrations and sample characteristics
Significant associations between metabolite plasma concentrations and sample characteristics not recorded in healthy controls, including affective and psychosis symptoms, are given in Table 3. To control for potential confounding of these variables, metabolite concentrations in subgroups of patients were compared to metabolite concentrations among (all) healthy controls.
3OHKY, XANU, VMA, XAN, MN and HGA
Diet: Plasma concentration of XANU was significantly lower in patients with healthy (p < 0.001) and unhealthy (p = 0.002) diet compared to healthy controls.
Illicit drugs: Plasma concentrations of 3OHKY were significantly lower in patients with and without the use of illicit drugs compared to healthy controls (both p < 0.001).
Symptoms: Higher plasma concentrations of MN were associated with less symptoms on several rating scales [GAF-S, SCI-PANSS and CDSS (SCZ)] and higher levels of HGA were associated with lower GAF-S scores; significantly lower concentrations of MN and HGA in patients were shown in the subgroups with symptom scores below (trend level significance for HGA) and above the median symptom scores, compared to healthy controls (Table 3). Plasma concentrations of 3OHKY and XANU were not associated with symptom levels. Sleep pattern measured as early morning awakening was not significantly associated with the metabolite concentrations.
Metabolite concentrations of VMA and XAN were not significantly associated with the demographic or clinical variables. Further details of statistical associations of metabolite concentrations and demographic and clinical variables and subgroup analyses for 3OHKY, XANU, HGA and MN are given in Table 3.
Discussion
The main findings of the present study are decreased plasma concentration of 3OHKY, XANU and VMA and increased concentration of XAN across diagnostic categories in psychotic disorders. Differences in metabolite concentrations were significant in the overall patient group and confirmed across subsamples of schizophrenia spectrum and bipolar disorders in medication-free individuals. Although not reaching statistical significance after correcting for multiple testing, data were also suggestive of decreases in HGA across SCZ and BD. Decreased concentration was found for MN in the overall patient group; however, without being replicated across the medication-free subsamples.
The present findings in the kynurenine pathway are in line with the pathway being increasingly implicated in the pathogenesis of SCZ and BD in recent years (Erhardt et al., Reference Erhardt, Schwieler, Imbeault and Engberg2017). Kynurenic acid has antagonistic effects on NMDA receptors and seems to be increased at central levels in psychotic disorders (Erhardt et al., Reference Erhardt, Schwieler, Imbeault and Engberg2017; Plitman et al., Reference Plitman, Iwata, Caravaggio, Nakajima, Chung, Gerretsen, Kim, Takeuchi, Chakravarty, Remington and Graff-Guerrero2017). In line with the present findings, 3OHKY and its metabolite XANU of the kynurenine pathway were recently reported decreased in serum of patients with SCZ (Fazio et al., Reference Fazio, Lionetto, Curto, Iacovelli, Cavallari, Zappulla, Ulivieri, Napoletano, Capi, Corigliano, Scaccianoce, Caruso, Miele, De Fusco, Di Menna, Comparelli, De Carolis, Gradini, Nistico, De Blasi, Girardi, Bruno, Battaglia, Nicoletti and Simmaco2015). The same study reported decreased XANU in relatives of the patients and suggested XANU as a trait marker and potentially a drug target in SCZ. XANU is reported in neurons in the rodent brain (Gobaille et al., Reference Gobaille, Kemmel, Brumaru, Dugave, Aunis and Maitre2008; Roussel et al., Reference Roussel, Bessede, Klein, Maitre and Mensah-Nyagan2016), it seem to influence glutamate synaptic transmission (Neale et al., Reference Neale, Copeland, Uebele, Thomson and Salt2013; Fazio et al., Reference Fazio, Lionetto, Curto, Iacovelli, Cavallari, Zappulla, Ulivieri, Napoletano, Capi, Corigliano, Scaccianoce, Caruso, Miele, De Fusco, Di Menna, Comparelli, De Carolis, Gradini, Nistico, De Blasi, Girardi, Bruno, Battaglia, Nicoletti and Simmaco2015) and with a suggested role in cognition (Sathyasaikumar et al., Reference Sathyasaikumar, Tararina, Wu, Neale, Weisz, Salt and Schwarcz2017). The present findings replicate deficient levels of 3OHKY and XANU in SCZ, and expand the finding to include BD in line with the psychosis continuum hypothesis (Lichtenstein et al., Reference Lichtenstein, Yip, Bjork, Pawitan, Cannon, Sullivan and Hultman2009; Van Snellenberg and de Candia, Reference Van Snellenberg and de Candia2009; Tesli et al., Reference Tesli, Espeseth, Bettella, Mattingsdal, Aas, Melle, Djurovic and Andreassen2014). Although kynurenine pathway dysfunction has previously been linked to BD pathophysiology (Sellgren et al., Reference Sellgren, Kegel, Bergen, Ekman, Olsson, Larsson, Vawter, Backlund, Sullivan, Sklar, Smoller, Magnusson, Hultman, Walther-Jallow, Svensson, Lichtenstein, Schalling, Engberg, Erhardt and Landen2016), this is to the best of our knowledge the first data indicating reduced levels of XANU in BD. Potential mechanisms of kynurenine pathway dysfunction in psychotic disorders include genetic and immune regulatory mechanisms (Wonodi et al., Reference Wonodi, Stine, Sathyasaikumar, Roberts, Mitchell, Hong, Kajii, Thaker and Schwarcz2011; Kegel et al., Reference Kegel, Bhat, Skogh, Samuelsson, Lundberg, Dahl, Sellgren, Schwieler, Engberg, Schuppe-Koistinen and Erhardt2014; Chaves Filho et al., Reference Chaves Filho, Lima, Vasconcelos, de Lucena, Maes and Macedo2018). Cytokines are regulatory factors in the conversion of tryptophan to N-formylkynurenine, catalyzed by the enzymes indoleamine 2,3-dioxygenase and tryptophan 2,3-dioxygenase (Chaves Filho et al., Reference Chaves Filho, Lima, Vasconcelos, de Lucena, Maes and Macedo2018). In a study of bipolar disorder, Sellgren et al. (Reference Sellgren, Kegel, Bergen, Ekman, Olsson, Larsson, Vawter, Backlund, Sullivan, Sklar, Smoller, Magnusson, Hultman, Walther-Jallow, Svensson, Lichtenstein, Schalling, Engberg, Erhardt and Landen2016) recently reported an association between the minor allele of a SNP at 1p21.3 and increased kynurenic acid mediated by cytokine activation. Interestingly, immunological pathogenetic mechanisms are amongst the most robust novel findings in psychotic disorders (Dieset et al., Reference Dieset, Djurovic, Tesli, Hope, Mattingsdal, Michelsen, Joa, Larsen, Agartz, Melle, Rossberg, Aukrust, Andreassen and Ueland2012; Aberg et al., Reference Aberg, Liu, Bukszar, McClay, Khachane, Andreassen, Blackwood, Corvin, Djurovic, Gurling, Ophoff, Pato, Pato, Riley, Webb, Kendler, O'Donovan, Craddock, Kirov, Owen, Rujescu, St, Werge, Hultman, Delisi, Sullivan and van den Oord2013; Volk et al., Reference Volk, Chitrapu, Edelson, Roman, Moroco and Lewis2015; Hartwig et al., Reference Hartwig, Borges, Horta, Bowden and Davey2017). Furthermore, dysregulation of the kynurenine pathway seems to be common to several mental disorders (Aarsland et al., Reference Aarsland, Landaas, Hegvik, Ulvik, Halmoy, Ueland and Haavik2015; Lim et al., Reference Lim, Essa, de Paula Martins, Lovejoy, Bilgin, Waly, Al-Farsi, Al-Sharbati, Al-Shaffae and Guillemin2016), indicating shared etiological factors in line with recent evidence of broad genetic correlations across mental disorders (Anttila et al., Reference Anttila, Bulik-Sullivan, Finucane, Walters, Bras, Duncan, Escott-Price, Falcone, Gormley, Malik, Patsopoulos, Ripke, Wei, Yu, Lee, Turley, Grenier-Boley, Chouraki, Kamatani, Berr, Letenneur, Hannequin, Amouyel, Boland, Deleuze, Duron, Vardarajan, Reitz, Goate, Huentelman, Kamboh, Larson, Rogaeva, St George-Hyslop, Hakonarson, Kukull, Farrer, Barnes, Beach, Demirci, Head, Hulette, Jicha, Kauwe, Kaye, Leverenz, Levey, Lieberman, Pankratz, Poon, Quinn, Saykin, Schneider, Smith, Sonnen, Stern, Van Deerlin, Van Eldik, Harold, Russo, Rubinsztein, Bayer, Tsolaki, Proitsi, Fox, Hampel, Owen, Mead, Passmore, Morgan, Nothen, Rossor, Lupton, Hoffmann, Kornhuber, Lawlor, McQuillin, Al-Chalabi, Bis, Ruiz, Boada, Seshadri, Beiser, Rice, van der Lee, De Jager, Geschwind, Riemenschneider, Riedel-Heller, Rotter, Ransmayr, Hyman, Cruchaga, Alegret, Winsvold, Palta, Farh, Cuenca-Leon, Furlotte, Kurth, Ligthart, Terwindt, Freilinger, Ran, Gordon, Borck, Adams, Lehtimaki, Wedenoja, Buring, Schurks, Hrafnsdottir, Hottenga, Penninx, Artto, Kaunisto, Vepsalainen, Martin, Montgomery, Kurki, Hamalainen, Huang, Huang, Sandor, Webber, Muller-Myhsok, Schreiber, Salomaa, Loehrer, Gobel, Macaya, Pozo-Rosich, Hansen, Werge, Kaprio, Metspalu, Kubisch, Ferrari, Belin, van den Maagdenberg, Zwart, Boomsma, Eriksson, Olesen, Chasman, Nyholt, Avbersek, Baum, Berkovic, Bradfield, Buono, Catarino, Cossette, De Jonghe, Depondt, Dlugos, Ferraro, French, Hjalgrim, Jamnadas-Khoda, Kalviainen, Kunz, Lerche, Leu, Lindhout, Lo, Lowenstein, McCormack, Moller, Molloy, Ng, Oliver, Privitera, Radtke, Ruppert, Sander, Schachter, Schankin, Scheffer, Schoch, Sisodiya, Smith, Sperling, Striano, Surges, Thomas, Visscher, Whelan, Zara, Heinzen, Marson, Becker, Stroink, Zimprich, Gasser, Gibbs, Heutink, Martinez, Morris, Sharma, Ryten, Mok, Pulit, Bevan, Holliday, Attia, Battey, Boncoraglio, Thijs, Chen, Mitchell, Rothwell, Sharma, Sudlow, Vicente, Markus, Kourkoulis, Pera, Raffeld, Silliman, Boraska Perica, Thornton, Huckins, William Rayner, Lewis, Gratacos, Rybakowski, Keski-Rahkonen, Raevuori, Hudson, Reichborn-Kjennerud, Monteleone, Karwautz, Mannik, Baker, O'Toole, Trace, Davis, Helder, Ehrlich, Herpertz-Dahlmann, Danner, van Elburg, Clementi, Forzan, Docampo, Lissowska, Hauser, Tortorella, Maj, Gonidakis, Tziouvas, Papezova, Yilmaz, Wagner, Cohen-Woods, Herms, Julia, Rabionet, Dick, Ripatti, Andreassen, Espeseth, Lundervold, Steen, Pinto, Scherer, Aschauer, Schosser, Alfredsson, Padyukov, Halmi, Mitchell, Strober, Bergen, Kaye, Szatkiewicz, Cormand, Ramos-Quiroga, Sanchez-Mora, Ribases, Casas, Hervas, Arranz, Haavik, Zayats, Johansson, Williams, Dempfle, Rothenberger, Kuntsi, Oades, Banaschewski, Franke, Buitelaar, Arias Vasquez, Doyle, Reif, Lesch, Freitag, Rivero, Palmason, Romanos, Langley, Rietschel, Witt, Dalsgaard, Borglum, Waldman, Wilmot, Molly, Bau, Crosbie, Schachar, Loo, McGough, Grevet, Medland, Robinson, Weiss, Bacchelli, Bailey, Bal, Battaglia, Betancur, Bolton, Cantor, Celestino-Soper, Dawson, De Rubeis, Duque, Green, Klauck, Leboyer, Levitt, Maestrini, Mane, De-Luca, Parr, Regan, Reichenberg, Sandin, Vorstman, Wassink, Wijsman, Cook, Santangelo, Delorme, Roge, Magalhaes, Arking, Schulze, Thompson, Strohmaier, Matthews, Melle, Morris, Blackwood, McIntosh, Bergen, Schalling, Jamain, Maaser, Fischer, Reinbold, Fullerton, Guzman-Parra, Mayoral, Schofield, Cichon, Muhleisen, Degenhardt, Schumacher, Bauer, Mitchell, Gershon, Rice, Potash, Zandi, Craddock, Ferrier, Alda, Rouleau, Turecki, Ophoff, Pato, Anjorin, Stahl, Leber, Czerski, Cruceanu, Jones, Posthuma, Andlauer, Forstner, Streit, Baune, Air, Sinnamon, Wray, MacIntyre, Porteous, Homuth, Rivera, Grove, Middeldorp, Hickie, Pergadia, Mehta, Smit, Jansen, de Geus, Dunn, Li, Nauck, Schoevers, Beekman, Knowles, Viktorin, Arnold, Barr, Bedoya-Berrio, Bienvenu, Brentani, Burton, Camarena, Cappi, Cath, Cavallini, Cusi, Darrow, Denys, Derks, Dietrich, Fernandez, Figee, Freimer, Gerber, Grados, Greenberg, Hanna, Hartmann, Hirschtritt, Hoekstra, Huang, Huyser, Illmann, Jenike, Kuperman, Leventhal, Lochner, Lyon, Macciardi, Madruga-Garrido, Malaty, Maras, McGrath, Miguel, Mir, Nestadt, Nicolini, Okun, Pakstis, Paschou, Piacentini, Pittenger, Plessen, Ramensky, Ramos, Reus, Richter, Riddle, Robertson, Roessner, Rosario, Samuels, Sandor, Stein, Tsetsos, Van Nieuwerburgh, Weatherall, Wendland, Wolanczyk, Worbe, Zai, Goes, McLaughlin, Nestadt, Grabe, Depienne, Konkashbaev, Lanzagorta, Valencia-Duarte, Bramon, Buccola, Cahn, Cairns, Chong, Cohen, Crespo-Facorro, Crowley, Davidson, DeLisi, Dinan, Donohoe, Drapeau, Duan, Haan, Hougaard, Karachanak-Yankova, Khrunin, Klovins, Kucinskas, Lee Chee Keong, Limborska, Loughland, Lonnqvist, Maher, Mattheisen, McDonald, Murphy, Nenadic, van Os, Pantelis, Pato, Petryshen, Quested, Roussos, Sanders, Schall, Schwab, Sim, So, Stogmann, Subramaniam, Toncheva, Waddington, Walters, Weiser, Cheng, Cloninger, Curtis, Gejman, Henskens, Mattingsdal, Oh, Scott, Webb, Breen, Churchhouse, Bulik, Daly, Dichgans, Faraone, Guerreiro, Holmans, Kendler, Koeleman, Mathews, Price, Scharf, Sklar, Williams, Wood, Cotsapas, Palotie, Smoller, Sullivan, Rosand, Corvin, Neale, Schott, Anney, Elia, Grigoroiu-Serbanescu, Edenberg and Murray2018).
Plasma concentrations of kynurenine and related metabolites other than 3OHKY and XANU, did not differ between patients and healthy controls in the overall sample or in the medication-free subsamples of SCZ and BD. In line with the present results, a recent systematic review and meta-analysis found no significant difference in peripheral kynurenic acid levels, but increased central levels in SCZ compared to controls (Plitman et al., Reference Plitman, Iwata, Caravaggio, Nakajima, Chung, Gerretsen, Kim, Takeuchi, Chakravarty, Remington and Graff-Guerrero2017). In BD, normal blood levels of kynurenine, 3OHKY and anthranilic acid and reduced kynurenic acid relative to healthy controls were recently reported (Birner et al., Reference Birner, Platzer, Bengesser, Dalkner, Fellendorf, Queissner, Pilz, Rauch, Maget, Hamm, Herzog-Eberhard, Mangge, Fuchs, Moll, Zelzer, Schutze, Schwarz, Reininghaus, Kapfhammer and Reininghaus2017). In a study using skin fibroblasts, increased production of 3OHK and kynurenic acid was indicated in BD, as well as in SCZ (Johansson et al., Reference Johansson, Owe-Larsson, Asp, Kocki, Adler, Hetta, Gardner, Lundkvist, Urbanska and Karlsson2013). In the present sample, unaltered levels of kynurenine, kynurenic acid and anthranilic acid and decreased levels of 3OHKY were consistent across the overall sample and medication-free subsamples. Further data are needed to determine the characteristics of kynurenine pathway metabolites at peripheral levels (Erhardt et al., Reference Erhardt, Schwieler, Imbeault and Engberg2017); divergent findings between studies could be due to the impact of several factors, including clinical characteristics (Carlborg et al., Reference Carlborg, Jokinen, Jonsson, Erhardt and Nordstrom2013; Chiappelli et al., Reference Chiappelli, Pocivavsek, Nugent, Notarangelo, Kochunov, Rowland, Schwarcz and Hong2014) and psychopharmacological agents. Importantly, contrary to the present study, all patients in the samples of Johansson et al. (Reference Johansson, Owe-Larsson, Asp, Kocki, Adler, Hetta, Gardner, Lundkvist, Urbanska and Karlsson2013) and Birner et al. (Reference Birner, Platzer, Bengesser, Dalkner, Fellendorf, Queissner, Pilz, Rauch, Maget, Hamm, Herzog-Eberhard, Mangge, Fuchs, Moll, Zelzer, Schutze, Schwarz, Reininghaus, Kapfhammer and Reininghaus2017) used psychopharmacological agents, making analyses independent of medication status impossible.
Significantly increased levels of XAN are in line with the established hypothesis of purinergic system dysfunction in psychotic disorders (Michel et al. Reference Michel, Sheldrick, Camara, Grunblatt, Schneider and Riederer2011; Yao et al. Reference Yao, Dougherty, Reddy, Matson, Kaddurah-Daouk and Keshavan2013; Ortiz et al. Reference Ortiz, Ulrich, Zarate and Machado-Vieira2015; Bartoli et al. Reference Bartoli, Crocamo, Gennaro, Castagna, Trotta, Clerici and Carra2016). XAN is oxidized to uric acid by the enzyme xanthine oxidase as the last step of purine catabolism (Day et al., Reference Day, Kamel, Kannangara, Williams and Graham2016). The purinergic system is essential in brain function by various processes including energy metabolism and neurotransmission (Lindberg et al., Reference Lindberg, Shan, Ayers-Ringler, Oliveros, Benitez, Prieto, McCullumsmith and Choi2015). Studies of peripheral levels have indicated increased uric acid in BD (Albert et al., Reference Albert, De Cori, Aguglia, Barbaro, Bogetto and Maina2015; Bartoli et al., Reference Bartoli, Crocamo, Gennaro, Castagna, Trotta, Clerici and Carra2016, Reference Bartoli, Crocamo, Dakanalis, Brosio, Miotto, Capuzzi, Clerici and Carra2017b). Decreased levels have been suggested in SCZ (Reddy et al., Reference Reddy, Keshavan and Yao2003; Yao et al., Reference Yao, Dougherty, Reddy, Keshavan, Montrose, Matson, McEvoy and Kaddurah-Daouk2010a). Few studies have reported on XAN in psychotic disorders; however, two studies with mixed samples consisting of about 35% BD, indicated associations between cerebrospinal fluid XAN and hypoxanthine levels and depressive symptomatology and monoamine metabolites (Agren et al., Reference Agren, Niklasson and Hallgren1983; Niklasson et al., Reference Niklasson, Agren and Hallgren1983). Furthermore, Yao et al. (Reference Yao, Dougherty, Reddy, Keshavan, Montrose, Matson, McEvoy and Kaddurah-Daouk2010a) reported unaltered XAN, but increased xanthosine plasma levels, a metabolite interconverting to XAN, in neuroleptic-naive first episode psychosis patients. The authors suggest a metabolic shift towards xanthosine. In the present sample, xanthosine levels were similar across patients and healthy controls. Importantly, the current patient sample is larger, and with replicated findings across SCZ and BD in medication-free individuals. Uric acid levels were unaltered in patients compared to healthy controls; however, the finding of increased XAN in both SCZ and BD support purinergic system dysfunction as a trait component in common across psychotic disorders. The underlying mechanism is unclear, but could be linked to alterations in xanthine oxidase activity (Akyol et al., Reference Akyol, Herken, Uz, Fadillioglu, Unal, Sogut, Ozyurt and Savas2002; Brunstein et al., Reference Brunstein, Ghisolfi, Ramos and Lara2005; Michel et al., Reference Michel, Sheldrick, Camara, Grunblatt, Schneider and Riederer2011; Bartoli et al., Reference Bartoli, Crocamo, Clerici and Carra2017a).
There were reduced plasma levels of the epinephrine metabolite MN and the in common metabolite VMA of epinephrine and norepinephrine relative to healthy controls in the overall patient sample. However, only VMA was replicated across the diagnostic categories. Norepinephrine has been linked to the pathophysiology of both BD (Manji et al., Reference Manji, Quiroz, Payne, Singh, Lopes, Viegas and Zarate2003) and SCZ (Fitzgerald, Reference Fitzgerald2014; Maletic et al., Reference Maletic, Eramo, Gwin, Offord and Duffy2017), and the precursor of VMA, 3-Methoxy-4-hydroxyphenylglycol (MHPG) (Goldstein et al., Reference Goldstein, Eisenhofer and Kopin2003), have been associated with symptom scores of both disorders (Maas et al., Reference Maas, Contreras, Miller, Berman, Bowden, Javors, Seleshi and Weintraub1993; Kurita et al., Reference Kurita, Nishino, Numata, Okubo and Sato2014). Thus, decreased plasma levels of VMA in the present patient sample support the hypothesis of noradrenergic dysfunction in psychosis spectrum disorders. Indicated reductions of HGA in SCZ and BD and of dopamine similarly suggest alterations related to tyrosine metabolism. To the best of our knowledge, the suggested association of HGA with psychotic disorders has not previously been reported.
The current study has noteworthy strengths. Due to the well-characterized sample of related psychotic disorders, we were able to utilize the large size of the overall sample by combining the various diagnostic categories as well as testing associations with an extensive range of potential confounders. Despite phenotypic differences, there are solid evidence of overlapping pathogenetic factors between SCZ and BD (Lichtenstein et al., Reference Lichtenstein, Yip, Bjork, Pawitan, Cannon, Sullivan and Hultman2009; Cross-Disorder Group of the Psychiatric Genomics Consortium, 2013), and we were able to confirm findings indicated from the total sample in small well-defined medication-free independent diagnostic subsamples (SZdiagn or SCZ and BD). This procedure reduces the possibility of type 1 errors. Importantly, there were only differences between SCZ and BD in two of 52 metabolites (p-value levels of 0.02 and 0.04) and no significant differences of 3OHKY, XANU, VMA, MN or XAN.
Conclusions about the direction of effects are tentative due to the cross-sectional design. However, the present significant findings generally involve pathways previously suggested in the pathophysiology of psychotic disorders. Moreover, a broad range of demographic and clinical variables did not seem to explain the main findings. Due to non-normality of some metabolite concentrations and recording of several characteristics only in patients [use of illicit drugs, alcohol and tobacco; diet; level of symptoms (general; affective, including sleep pattern; and psychosis)], we were unable to perform statistical adjustments of these variables in the main analyses. However, separate analyses of associations between demographic and clinical variables and the metabolite plasma concentrations were performed. Importantly, higher plasma levels of XANU in patients with unhealthy diet and lower levels of 3OHKY in patients using illicit drugs, seem unable to explain lower metabolite levels in patients compared to controls, due to corresponding significant differences in analyses of subgroups of patients (Table 3). Nevertheless, it should be noted that the findings might be prone to residual confounding including stress-related changes (Chiappelli et al., Reference Chiappelli, Pocivavsek, Nugent, Notarangelo, Kochunov, Rowland, Schwarcz and Hong2014); however, the stress system has been implicated in the pathophysiology of psychotic disorders (van Winkel et al., Reference van Winkel, Stefanis and Myin-Germeys2008). The subgroup analyses of medication-free individuals could be susceptible to bias, and the re-identification of significant metabolites in the subsamples could be seen as likely, although the patient subsample were only 25% of the total patient sample. Moreover, the assay variation of the metabolites of the current study was not available; however, the analysis platform has been extensively validated and used in a range of prior studies (see Methods section).
We measured peripheral metabolite levels as compared to central levels. This complicates the interpretation of the results. Metabolites of pathways indicated as dysfunctional in the present analyses, cross the blood-brain barrier (Esler et al., Reference Esler, Lambert, Ferrier, Kaye, Wallin, Kalff, Kelly and Jennings1995; Gobaille et al., Reference Gobaille, Kemmel, Brumaru, Dugave, Aunis and Maitre2008; Bowman et al., Reference Bowman, Shannon, Frei, Kaye and Quinn2010), giving grounds for peripheral sampling; however, dynamics are uncertain. Correlations of MN and HGA with symptom measures suggest central communication. In the case of the kynurenine pathway, peripheral kynurenine and probably 3OHKY readily crosses the blood-brain barrier and influence the central kynurenine pathway metabolism (Fukui et al., Reference Fukui, Schwarcz, Rapoport, Takada and Smith1991; Schwarcz et al., Reference Schwarcz, Bruno, Muchowski and Wu2012; Hestad et al., Reference Hestad, Engedal, Whist and Farup2017), indicating the utility of blood sampling, especially as the method enables a large sample without being distressing or conferring risk of serious complications as with lumbar puncture (Wright et al., Reference Wright, Lai and Sinclair2012). Moreover, peripheral measurements is a widely used method in psychiatric research of metabolic processes (Grossman and Potter, Reference Grossman and Potter1999; Bicikova et al., Reference Bicikova, Hill, Ripova, Mohr and Hampl2013; Albert et al., Reference Albert, De Cori, Aguglia, Barbaro, Bogetto and Maina2015; Fazio et al., Reference Fazio, Lionetto, Curto, Iacovelli, Cavallari, Zappulla, Ulivieri, Napoletano, Capi, Corigliano, Scaccianoce, Caruso, Miele, De Fusco, Di Menna, Comparelli, De Carolis, Gradini, Nistico, De Blasi, Girardi, Bruno, Battaglia, Nicoletti and Simmaco2015; Bartoli et al., Reference Bartoli, Crocamo, Gennaro, Castagna, Trotta, Clerici and Carra2016; Birner et al., Reference Birner, Platzer, Bengesser, Dalkner, Fellendorf, Queissner, Pilz, Rauch, Maget, Hamm, Herzog-Eberhard, Mangge, Fuchs, Moll, Zelzer, Schutze, Schwarz, Reininghaus, Kapfhammer and Reininghaus2017). Also, studies of brain samples have the inherent risk of biases due to the postmortem interval (Lewis, Reference Lewis2002). The selection of metabolites could influence the interpretation of the findings. Several metabolites were not measured, including quinolinic acid and picolinic acid of the kynurenine pathway. Interestingly, a recent study of IgA responses to tryptophan catabolites in deficit and nondeficit schizophrenia reported increased responses to quinolinic acid, picolinic acid, 3OHKY and XANU; however, the relation to serum levels is unclear (Kanchanatawan et al., Reference Kanchanatawan, Sirivichayakul, Ruxrungtham, Carvalho, Geffard, Ormstad, Anderson and Maes2018). The reason for dysregulation of only certain metabolites of the pathways is unclear, but indicate complex regulatory mechanism.
In conclusion, the results indicate dysfunctions of the kynurenine pathway and the noradrenergic and purinergic system in common across SCZ and BD. Of special interest is the association with XANU, a metabolite with recently revealed features relevant for psychotic disorders and previously not focused in BD. The study was able to take advantage of the psychosis continuum model by confirming associations from the total patient sample in medication-free independent subsamples of SCZ and BD, thus strengthening the findings as well as indicating pathophysiological mechanisms in common for the psychosis continuum. The present findings may contribute to the understanding of the pathophysiology of psychotic disorders and the possibility of better pharmacological treatment. Future studies may aim to include large well-characterized samples with targeted metabolomic, immune and genetic data to further disentangle specific gene × environmental mechanisms. Moreover, longitudinal designs combining peripheral and central assessments would be of major benefit to elucidate the underlying dynamics.
Supplementary material
The supplementary material for this article can be found at https://doi.org/10.1017/S0033291719000400.
Author ORCIDs
Nils Eiel Steen, 0000-0001-6442-1179
Acknowledgements
The authors thank the patients for participating in the study, and the TOP study group members for contributing data collection. The work was supported by the Research Council of Norway, Oslo, Norway (213837, 223273, 217776); the South-East Norway Regional Health Authority, Hamar, Norway (2017-112); and the KG Jebsen Foundation, Bergen, Norway.
Conflict of interest
NES, ID, SH, TSJI, OBS, IA, IM, SD, EGJ and MB declare no conflicts of interest. RKD and WM are inventors on patents in the metabolomics field. OAA has received speakers’ honorarium from Lundbeck.


