


Introduction
Young adulthood, from approximately 19 to 34 years, is a critical life stage involving separation from childhood family, identity formation, major decisions about education and career, and often also parenthood (Slater, Reference Slater2003; Vaillant, Reference Vaillant2003; Park et al. Reference Park, Paul Mulye, Adams, Brindis and Irwin2006). Mental disorders in young adulthood may hamper psychological, social, academic and career development.
General population surveys have found high prevalences of mental disorders in young adults (Bijl et al. Reference Bijl, Ravelli and van Zessen1998; Wittchen et al. Reference Wittchen, Nelson and Lachner1998b; Andrews et al. Reference Andrews, Henderson and Hall2001; Alonso et al. Reference Alonso, Angermeyer, Bernert, Bruffaerts, Brugha, Bryson, de Girolamo, Graaf, Demyttenaere, Gasquet, Haro, Katz, Kessler, Kovess, Lépine, Ormel, Polidori, Russo, Vilagut, Almansa, Arbabzadeh-Bouchez, Autonell, Bernal, Buist-Bouwman, Codony, Domingo-Salvany, Ferrer, Joo, Martínez-Alonso, Matschinger, Mazzi, Morgan, Morosini, Palacin, Romera, Taub and Vollebergh2004; Jacobi et al. Reference Jacobi, Wittchen, Hölting, Höfler, Pfister, Müller and Lieb2004). For example, the lifetime prevalence of any DSM-IV Axis I disorder among 18- to 29-year-olds was 52.4% in the National Comorbidity Survey Replication study (NCS-R) (Kessler et al. Reference Kessler, Berglund, Demler, Jin, Merikangas and Walters2005a). The most prevalent disorders were anxiety (30.2%), mood (21.4%) and substance-use disorders (16.7%) (Kessler et al. Reference Kessler, Berglund, Demler, Jin, Merikangas and Walters2005a). High lifetime prevalences in this age group are consistent with early age of onset of most mental disorders (Kim-Cohen et al. Reference Kim-Cohen, Caspi, Moffitt, Harrington, Milne and Poulton2003; Kessler et al. Reference Kessler, Berglund, Demler, Jin, Merikangas and Walters2005a). In the NCS-R, three-quarters of lifetime mental disorders had emerged by 24 years of age (Kessler et al. Reference Kessler, Berglund, Demler, Jin, Merikangas and Walters2005a).
Mental health in large general population surveys is usually assessed using structured psychiatric interviews conducted by lay interviewers. However, the concordance between diagnoses based on structured interviews conducted by lay interviewers and blind clinical re-interviews is not perfect (Taub et al. Reference Taub, Morgan, Brugha, Lambert, Bebbington, Jenkins, Kessler, Zaslavsky and Hotz2005; Kessler et al. Reference Kessler2007). A two-phase study design with clinical re-interview for selected persons improves diagnostic accuracy, although reducing the precision of prevalence estimates (Taub et al. Reference Taub, Morgan, Brugha, Lambert, Bebbington, Jenkins, Kessler, Zaslavsky and Hotz2005). Case-notes from mental health treatments to complement interview information enhance diagnostic accuracy further (Perälä et al. Reference Perälä, Suvisaari, Saarni, Kuoppasalmi, Isometsä, Pirkola, Partonen, Tuulio-Henriksson, Hintikka, Kieseppä, Härkänen, Koskinen and Lönnqvist2007), but are rarely available.
The Mental Health in Early Adulthood in Finland (MEAF) study investigated mental health in young adults in Finland. In this article, we present the methods used in the study, examine non-response, present 1-month and lifetime prevalences for DSM-IV disorders, their sociodemographic associations and mental health treatment contacts, and compare two different methods of analysing prevalences in a two-phase study.
Method
The Health 2000 study design and assessment
MEAF was a follow-up study of the Health 2000 young adult study sample. As described in detail elsewhere (Aromaa & Koskinen, Reference Aromaa and Koskinen2004; Koskinen et al. Reference Koskinen, Kestilä, Martelin and Aromaa2005; Pirkola et al. Reference Pirkola, Isometsä, Suvisaari, Aro, Joukamaa, Poikolainen, Koskinen, Aromaa and Lönnqvist2005), Health 2000 was a health survey based on a nationally representative two-stage cluster sample which included 8028 persons aged ⩾30 years (the adult sample) and 1894 persons aged 18–29 years (the young adult sample). Assessment of the young adult sample, carried out in 2001, involved the use of an interview and a questionnaire to gather information on sociodemographic factors, childhood and school experiences, health, use of medication and health services, and life-style. Although there were questions related to mental health, a structured diagnostic interview was not conducted. The ethics committees of the National Public Health Institute and the Hospital District of Helsinki and Uusimaa approved the Health 2000 survey and the MEAF reassessment. Participants provided written informed consent (Aromaa & Koskinen, Reference Aromaa and Koskinen2004; Koskinen et al. Reference Koskinen, Kestilä, Martelin and Aromaa2005).
The MEAF study design
The study flow of the MEAF study is presented in Fig. 1. A questionnaire was mailed 2–4 years after the original study to all members of the young adult sample, excluding those who had died or refused further contacts. It included several scales assessing mental health and substance use. Persons reporting symptoms above a defined threshold in any screening scale were asked to participate in the mental health interview. In addition, all Health 2000 young adults who had had hospital treatment because of any mental disorder [International Classification of Diseases (ICD)-10 section F, ICD-8 and ICD-9 290-319] according to the Finnish Hospital Discharge Register information were asked to participate in the interview, along with a random subsample of Health 2000 young adults regardless of their answers to the screening questionnaire. Persons selected via the Discharge Register who had not returned the MEAF questionnaire were contacted through the person responsible for the treatment, usually their general practitioner or psychiatrist.
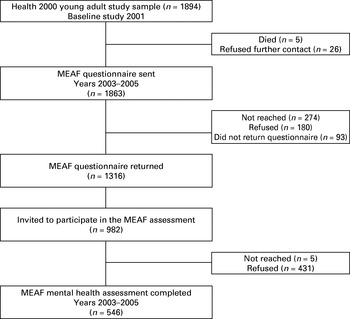
Fig. 1. Mental Health in Early Adulthood in Finland (MEAF) study flow.
The MEAF questionnaire and screen for mental health interview
The screens for mental health interview in the MEAF questionnaire were as follows: the Kessler Psychological Distress Scale (K10; Kessler et al. Reference Kessler, Barker, Colpe, Epstein, Gfroerer, Hiripi, Howes, Normand, Manderscheid, Walters and Zaslavsky2003) and the General Health Questionnaire (GHQ-12; Goldberg et al. Reference Goldberg, Gater, Sartorius, Üstün, Piccinelli, Gureje and Rutter1997) for general psychological distress, the SCOFF (Morgan et al. Reference Morgan, Reid and Lacey1999) for eating disorders, the Munich-Composite International Diagnostic Interview's 22 questions on delusions and hallucinations for psychotic disorders (Wittchen et al. Reference Wittchen, Lachner, Wunderlich and Pfister1998a), the Mood Disorder Questionnaire (Hirschfeld et al. Reference Hirschfeld, Williams, Spitzer, Calabrese, Flynn, Keck, Lewis, McElroy, Post, Rapport, Russell, Sachs and Zajecka2000) for manic symptoms and the ‘Cut down, Annoyed, Guilty, Eye opener’ (CAGE) questionnaire (Mayfield et al. Reference Mayfield, McLeod and Hall1974) for alcohol abuse. All persons who had ever had contact with health services for mental health-related problems, who had used any illicit drug at least six times, who had attempted suicide, or who reported need for treatment for mental health problems were also asked to participate in the interview. The cut-off points for each screen, and the numbers of persons thereby selected for interview are presented in Table 1. The MEAF questionnaire also contained questions on education, occupation, social relationships, general health, and alcohol and tobacco use.
Table 1. Screens used for selecting persons to mental health interview, their cut-off points, and the number of persons selected for interview by each screen

GHQ-12, General Health Questionnaire; K10, Kessler Psychological Distress Scale; CIDI, Composite International Diagnostic Interview; MDQ, Mood Disorder Questionnaire; CAGE, ‘Cut-down, Annoyed, Guilty, Eye-opener’ questionnaire; ICD, International Classification of Diseases.
Mental health assessment
The mental health interview was conducted using the research version of the Structured Clinical Interview for DSM-IV-TR (SCID-I) (First et al. Reference First, Spitzer, Gibbon and Williams2001). The sections on mood, and psychotic, substance-use, anxiety and eating disorders were included in the assessment, and the SCID Screening Module was used at the beginning of the interview to enhance reliability (Kessler, Reference Kessler2007). All interviews were reviewed by the interviewer together with a psychiatrist (J.H. or J.S.) in once- or twice-monthly sessions.
The assessment started with a neuropsychological test battery, selected to cover attention, working memory, learning and memory, executive functioning and basic ability (Castaneda et al. Reference Castaneda, Suvisaari, Marttunen, Perälä, Saarni, Aalto-Setälä, Aro, Koskinen, Lönnqvist and Tuulio-Henriksson2008). The mental health interview began with questions on sociodemographic factors and treatment received for mental health problems, followed by the SCID-I interview, questions assessing the lifetime occurrence of suicidal ideation and behaviour, and a structured assessment of Global Assessment of Functioning and Social and Occupational Functioning Assessment Scale (SOFAS) scores (APA, 2000). The assessments were conducted by experienced research nurses or psychologists who attended a 1-week training period plus regular follow-up sessions. Assessments took place at the most convenient location for the participant, usually the National Public Health Institute, local health care centre, or their own home.
Another questionnaire was given to participants after the interview. The post-interview questionnaire provided further information on the person's mental health and associated factors.
Final diagnostic assessment
For the final diagnostic assessment, all case-notes from hospital and out-patient treatments were obtained with the participants' approval. Permission to view non-participants' case-notes was obtained from the Finnish Ministry of Social Affairs and Health, excluding those who had refused any participation in the Health 2000 study. Case-notes were compiled using information from the Hospital Discharge Register, self-reported mental health care contacts and primary care health centres. The aim was to gather information on all lifetime treatments for mental health disorder. Case-notes were obtained for 104 of 120 persons with a hospital treatment for any mental disorder. The remaining 16 had refused participation in the study. In addition, we had case-notes from 87 participants who reported an out-patient treatment contact. The final best-estimate diagnoses using DSM-IV-TR criteria were made by four experienced clinicians, a psychiatrist (J.S.), a child psychiatrist (T.A.-S.) and two residents in psychiatry (S.I.S. and J.P.). Diagnostic assessment was based on all available systematically evaluated information from the interview and/or case records. Disorders not covered by SCID-I were also evaluated, including personality disorders. The reliability of the diagnoses was tested on 40 cases rated by all four clinicians. Unweighted κ values between each pair of raters ranged from 0.94 to 1.00 for major depressive disorder, from 0.90 to 1.0 for any depressive disorder, from 0.94 to 1.00 for any anxiety disorder, from 0.94 to 1.00 for alcohol abuse or dependence, from 0.48 to 1.00 for eating disorders, and from 0.51 to 0.78 for personality disorders.
Statistical analysis
Both the initial cluster sampling design and the two-phase screening for mental health interview had to be taken into account when calculating prevalences (Dunn et al. Reference Dunn, Pickles, Tansella and Vázquez-Barquero1999). For the cluster sampling design (Aromaa & Koskinen, Reference Aromaa and Koskinen2004) this was done by using sudaan release 9.0 software (Research Triangle Institute, Research Triangle Park, NC, USA). To adjust for non-response, post-stratification weights were calibrated by Statistics Finland using the method developed by Deville & Särndal (Deville & Särndal, Reference Deville and Särndal1992; Deville et al. Reference Deville, Särndal and Sautory1993). Original inclusion probability, sex and age, place of residence, and attained education in 2001 were used to estimate post-stratification weights. Calibrated weights correct the survey distributions to correspond to the population distributions. The two-phase screening design was dealt with using two different procedures: expansion weights as described by Pickles et al. (Reference Pickles, Dunn and Vázquez-Barquero1995), and multiple imputation (MI) as described by Schafer & Graham (Reference Schafer and Graham2002).
Expansion weights were calculated for the screen-positives by dividing their total number (M) by the number interviewed (M1), i.e. M/M1, and for the screen-negatives in the same way, N/N1 (Pickles et al. Reference Pickles, Dunn and Vázquez-Barquero1995). These weights were calculated separately for men and women. The final weights used in statistical analyses were obtained by multiplying the expansion weights by the post-stratification weights. These calculations were carried out in SAS version 9.1.3 (SAS Institute, Inc., Cary, NC, USA). Thereafter, prevalences were calculated using sudaan release 9.0 (Research Triangle Institute).
MI was conducted to compare and validate the prevalence estimates produced by the weighting method for the main categories of depressive, anxiety and substance-use disorders. For each disorder category, we produced 50 imputed datasets in which the missing outcome values were replaced by imputed values. We used the logistic regression method for monotone missing data of the MI procedure in SAS 9.1.3 (SAS Institute, Inc.). Thereafter, prevalences were calculated using the imputed data in sudaan (Research Triangle Institute), adjusting for the study design. Variables that were used to predict missing values were chosen by examining partial correlations between the variables and psychiatric diagnoses, and by examining their predictive value in a logistic regression model for the main diagnostic categories. The predictors used for the imputation of lifetime depressive disorders were age, marital status, education, treatment contact for mental health problem, perceived need for treatment, depressive mood for at least 2 weeks during the past 12 months, and K10 score. In imputing lifetime anxiety disorders, the predictors were otherwise similar, but instead of depressed mood, one question assessing the frequency of anxious feelings was used. For substance abuse or dependence, we used age, education, treatment contact for mental health problem, CAGE score, and information on use of any illicit drug at least six times. Prevalences were imputed separately for men and women.
The odds of having mental disorder, adjusted for age and/or sex, were calculated separately for sex, age (19–24, 25–29, or 30–34 years), basic education (high school v. lower), employment (employed, unemployed, student, and other) and marital status (married or cohabiting v. other) by Axis I disorder group (depressive, anxiety, substance use, any) using logistic regression. The proportions of persons with Axis I disorders with current and lifetime treatment contacts were calculated. These analyses were conducted in sudaan (Research Triangle Institute), using expansion weights and adjusting for the study design.
Because of the two-phase study design, we had two types of non-respondents: those who did not return the questionnaire, and those who returned it but did not participate in the interview despite invitation. Non-response to the MEAF questionnaire was analysed using information available from the whole sample (age, sex, register information), and from the baseline study participants. In the analysis of non-participation in the interview, information from the MEAF questionnaire was used. Differences between responders and non-responders were tested using the t test for continuous variables, and the χ2 test for categorical variables. These analyses were conducted in sudaan (Research Triangle Institute), taking account of the sampling design. Unweighted κ values were calculated in SAS 9.1.3 (SAS Institute, Inc.).
Results
Participants and assessment of non-response
The MEAF questionnaire was sent to 1863 persons and returned by 1316 (70.6%). It was returned by 75.2% of the baseline interview participants, 67.8% of those in the Health 2000 baseline study who only returned the questionnaire for non-responders, and 25.0% of baseline non-participants. Those who returned the MEAF questionnaire were younger, more often women, had finished high school more often, and had less often than non-responders been treated for any mental health problem in a mental or general hospital according to the Finnish Hospital Discharge Register. There were no other socio-economic disparities, nor differences in mental health service use or in the frequency of psychiatric symptoms reported in the baseline interview (Supplementary Table 1, available online).
There were 821 screen-positive persons, of whom 701 were screen-positive based on the questionnaire screen, 63 based on hospital treatment for mental health problems, and 57 based on both. Of the screen-positives, 458 (55.8%) participated in the interview. Screen-positives who participated were more often women and had more often completed high school than non-participants, while persons with a hospital treatment because of mental disorder according to the Hospital Discharge Register were less likely to participate. There were no differences between participants and non-participants in any of the questionnaire screens (Supplementary Table 2, available online).
We invited 161 screen-negative persons to the interview, of whom 88 (54.7%) participated. Screen-negative persons who participated in the interview were more likely to have finished high school than non-participants. Otherwise, there were no differences between screen-negative participants and non-participants (Supplementary Table 2).
Prevalences of mental disorders
Almost 40% of the sample had at least one lifetime Axis I mental disorder. The most prevalent lifetime disorders were depressive disorders (17.7%), followed by substance abuse or dependence (14.2%) and anxiety disorders (12.6%) (Table 2). The prevalences obtained using expansion weights (Table 2) and MI (Supplementary Table 3, available online) were quite similar. Of persons with any Axis I lifetime disorder, 40.8% had one, 35.3% two, and 23.9% three or more Axis I disorders. The prevalence of personality disorders was 6.8% (Table 2).
Table 2. Lifetime prevalences of Axis-I disorders in the MEAF studyFootnote a

MEAF, Mental Health in Early Adulthood in Finland; CI, confidence interval; NOS, not otherwise specified.
a Calculated using expansion weights.
Prevalences were significantly different between men and women:
* p<0.05, ** p<0.01, *** p<0.001.
Of current (1-month) disorders, substance abuse or dependence were the most common (6.0%), followed by anxiety disorders (5.6%) and depressive disorders (1.8%). The prevalence of any current Axis I disorder was 15.3%. (Table 3).
Table 3. One-month prevalences of Axis I disorders in the MEAF study

MEAF, Mental Health in Early Adulthood in Finland; CI, confidence interval; NOS, not otherwise specified.
Prevalences were significantly different between men and women:
* p<0.05, ** p<0.01.
Association of sociodemographic factors with mental disorders
Lifetime Axis I disorders were most common in the oldest (30–34 years) age group. Women had lower odds of current and lifetime substance-use disorders, but higher odds of lifetime depressive and any Axis I disorder than men. Being married or cohabiting was associated with lower odds for lifetime diagnosis of depressive and any Axis I disorder. Persons who had graduated from high school had lower odds for current and lifetime substance use or dependence, anxiety disorders, and any Axis I disorder than persons with lower basic education. Currently unemployed persons had higher odds of current or lifetime substance abuse or dependence, current anxiety disorder, and any current or lifetime Axis I disorder than those who were employed (Table 4).
Table 4. Age- and sex-adjusted odds of current and lifetime Axis I disorders in different sociodemographic groups

CI, Confidence interval.
* p<0.05, ** p<0.01, *** p<0.001.
Treatment contacts for mental disorders
Although 58.3% of persons with a current Axis I disorder had had treatment contact at some point in their lives, only 24.2% had current treatment. However, only 29.3% of persons with a current Axis I disorder felt currently in need of treatment for mental health problems; 77.1% of them had current treatment contact, 16.8% had past treatment contact, and 6% had never received psychiatric treatment. Of persons with a lifetime diagnosis of any Axis I disorder, 50.1% had received treatment. Lifetime treatment was most common in bipolar disorders (89.6%) and least common in alcohol abuse or dependence (45.6%) (Table 5).
Table 5. Self-reported current and past treatment for mental health problems in persons with current or lifetime Axis I disorders

Discussion
We found in this population-based study that 40% of young Finnish adults had had at least one Axis I psychiatric disorder during their lifetime, and 15% had a current Axis I disorder. Mental disorders were associated with lower education and unemployment. Only 24% of persons with a current Axis I disorder had current treatment contact.
Lifetime prevalences
Our prevalences of major depressive disorder, alcohol abuse and dependence, and panic disorder with or without agoraphobia were fairly similar to the lifetime prevalences in the 18–29 years age group in recent surveys from the USA (Hasin et al. Reference Hasin, Goodwin, Stinson and Grant2005; Kessler et al. Reference Kessler, Berglund, Demler, Jin, Merikangas and Walters2005a). In contrast, our prevalences of specific phobia, social phobia, post-traumatic stress disorder (PTSD), dysthymia, and bipolar I and II disorders were lower (Kessler et al. Reference Kessler, Berglund, Demler, Jin, Merikangas and Walters2005a). The disparities in the prevalences of specific phobia, social phobia and dysthymia may have been caused by different diagnostic methods. In our study, the diagnoses were based on SCID-I interviews, supplemented by case records of all lifetime treatment contacts. All interviews were conducted by experienced psychiatric nurses or psychologists and reviewed with psychiatrists, and the clinical significance of symptoms was carefully assessed. Symptoms of social phobia and specific phobia that did not interfere significantly with the person's normal routine or occupational or social functioning were much more common than diagnosed disorders, as in the study byWittchen et al. (Reference Wittchen, Nelson and Lachner1998b). Only current dysthymia is considered in the SCID, which probably explains its low prevalence. Careful diagnostic assessment often revealed a previous major depressive episode that was currently in partial remission, rather than dysthymia. Lower prevalences of PTSD and bipolar disorders may be due to genuine differences between the countries (Perälä et al. Reference Perälä, Suvisaari, Saarni, Kuoppasalmi, Isometsä, Pirkola, Partonen, Tuulio-Henriksson, Hintikka, Kieseppä, Härkänen, Koskinen and Lönnqvist2007).
Compared with other European studies, our lifetime prevalences were similar to those found in young adults in the European Study of the Epidemiology of Mental Disorders (ESEMeD) study (Alonso & Lépine, Reference Alonso and Lépine2007) and in two German studies (Wittchen et al. Reference Wittchen, Nelson and Lachner1998b; Jacobi et al. Reference Jacobi, Wittchen, Hölting, Höfler, Pfister, Müller and Lieb2004) but lower than in the Netherlands Mental Health Survey and Incidence Study (NEMESIS; Bijl et al. Reference Bijl, Ravelli and van Zessen1998). However, the most striking differences between our results and both NEMESIS and NCS-R study prevalences were in social phobia and simple phobia.
Co-morbidity was common: only 41% of persons with any Axis I disorder had only one Axis I disorder. Co-morbidity was more common than in many other surveys (Bijl et al. Reference Bijl, Ravelli and van Zessen1998; Andrews et al. Reference Andrews, Henderson and Hall2001; Jacobi et al. Reference Jacobi, Wittchen, Hölting, Höfler, Pfister, Müller and Lieb2004; Pirkola et al. Reference Pirkola, Isometsä, Suvisaari, Aro, Joukamaa, Poikolainen, Koskinen, Aromaa and Lönnqvist2005; Alonso & Lépine, Reference Alonso and Lépine2007), but at the same level as in the NCS-R (Kessler et al. Reference Kessler, Berglund, Demler, Jin, Merikangas and Walters2005a). One reason for the high lifetime co-morbidity may be that all Axis I disorders, not just those covered by the SCID, were taken into account in the final diagnostic assessment utilizing all available information.
Our prevalence of personality disorders must be interpreted with caution, because a diagnostic interview of personality disorders was not conducted. This meant we were only able to ascertain persons with severe personality disorders, most of whom had sought treatment. Our prevalence estimate accords with a previous Finnish study focusing on adults aged 20–24 years (Aalto-Setälä et al. Reference Aalto-Setälä, Marttunen, Tuulio-Henriksson, Poikolainen and Lönnqvist2001), but is lower than in surveys specifically focused on personality disorders (Torgersen et al. Reference Torgersen, Kringlen and Cramer2001; Samuels et al. Reference Samuels, Eaton, Bienvenu, Brown, Costa and Nestadt2002; Grant et al. Reference Grant, Hasin, Stinson, Dawson, Chou, Ruan and Pickering2004).
One-month prevalences
The 1-month prevalence of major depressive disorder was low compared with, among others, a previous Finnish study of adults aged 20–24 years (Aalto-Setälä et al. Reference Aalto-Setälä, Marttunen, Tuulio-Henriksson, Poikolainen and Lönnqvist2001). Our participants were allowed to choose the date of the interview from a relatively broad time-frame, and it is possible that some currently depressed persons postponed the actual interview date. During the study, we noticed this problem and modified the protocol so that the K10 and GHQ-12 were also completed at the interview. A future study will investigate longitudinal changes in K10 and GHQ scores and their relationship to current mental disorders. With the exception of depressive disorders, our 1-month prevalences were similar to previous surveys (Regier et al. Reference Regier, Boyd, Burke, Rae, Myers, Kramer, Robins, George, Karno and Locke1988; Aalto-Setälä et al. Reference Aalto-Setälä, Marttunen, Tuulio-Henriksson, Poikolainen and Lönnqvist2001; Andrews et al. Reference Andrews, Henderson and Hall2001).
Sociodemographic associations of mental disorders
In line with previous studies in this age group (Bebbington et al. Reference Bebbington, Dunn, Jenkins, Lewis, Brugha, Farrell and Meltzer1998; Wittchen et al. Reference Wittchen, Nelson and Lachner1998b; Aalto-Setälä et al. Reference Aalto-Setälä, Marttunen, Tuulio-Henriksson, Poikolainen and Lönnqvist2001; Andrews et al. Reference Andrews, Henderson and Hall2001; Jenkins et al. Reference Jenkins, Lewis, Bebbington, Brugha, Farrell, Gill and Meltzer2003; Alonso et al. Reference Alonso, Angermeyer, Bernert, Bruffaerts, Brugha, Bryson, de Girolamo, Graaf, Demyttenaere, Gasquet, Haro, Katz, Kessler, Kovess, Lépine, Ormel, Polidori, Russo, Vilagut, Almansa, Arbabzadeh-Bouchez, Autonell, Bernal, Buist-Bouwman, Codony, Domingo-Salvany, Ferrer, Joo, Martínez-Alonso, Matschinger, Mazzi, Morgan, Morosini, Palacin, Romera, Taub and Vollebergh2004; Kessler et al. Reference Kessler, Berglund, Demler, Jin, Merikangas and Walters2005a; Pirkola et al. Reference Pirkola, Isometsä, Suvisaari, Aro, Joukamaa, Poikolainen, Koskinen, Aromaa and Lönnqvist2005; Alonso & Lépine, Reference Alonso and Lépine2007), women had higher prevalences of depressive and anxiety disorders, while men had higher prevalences of substance-use disorders. However, the sex disparity in substance-use disorders was smaller than in the Health 2000 adult sample, where the difference in the prevalence of alcohol-use disorder between men and women was over five-fold (Pirkola et al. Reference Pirkola, Isometsä, Suvisaari, Aro, Joukamaa, Poikolainen, Koskinen, Aromaa and Lönnqvist2005), possibly suggesting that substance-use disorders are becoming more prevalent among women in younger birth cohorts. Lower education was associated with higher prevalence of mental disorders. This is consistent with the NEMESIS (Bijl et al. Reference Bijl, Ravelli and van Zessen1998), among others, but in the NCS-R (Kessler et al. 2005 a) and the ESEMeD (Alonso et al. Reference Alonso, Angermeyer, Bernert, Bruffaerts, Brugha, Bryson, de Girolamo, Graaf, Demyttenaere, Gasquet, Haro, Katz, Kessler, Kovess, Lépine, Ormel, Polidori, Russo, Vilagut, Almansa, Arbabzadeh-Bouchez, Autonell, Bernal, Buist-Bouwman, Codony, Domingo-Salvany, Ferrer, Joo, Martínez-Alonso, Matschinger, Mazzi, Morgan, Morosini, Palacin, Romera, Taub and Vollebergh2004), education was only associated with substance-use disorders. We only considered basic education, since younger participants had often not completed their post-secondary education. The unemployed had over four-fold odds of current mental disorders compared with the currently employed. This is consistent with previous studies (Bijl et al. Reference Bijl, Ravelli and van Zessen1998; Andrews et al. Reference Andrews, Henderson and Hall2001; Jenkins et al. Reference Jenkins, Lewis, Bebbington, Brugha, Farrell, Gill and Meltzer2003; Alonso et al. Reference Alonso, Angermeyer, Bernert, Bruffaerts, Brugha, Bryson, de Girolamo, Graaf, Demyttenaere, Gasquet, Haro, Katz, Kessler, Kovess, Lépine, Ormel, Polidori, Russo, Vilagut, Almansa, Arbabzadeh-Bouchez, Autonell, Bernal, Buist-Bouwman, Codony, Domingo-Salvany, Ferrer, Joo, Martínez-Alonso, Matschinger, Mazzi, Morgan, Morosini, Palacin, Romera, Taub and Vollebergh2004; ; Jacobi et al. Reference Jacobi, Wittchen, Hölting, Höfler, Pfister, Müller and Lieb2004; Pirkola et al. Reference Pirkola, Isometsä, Suvisaari, Aro, Joukamaa, Poikolainen, Koskinen, Aromaa and Lönnqvist2005), but the odds ratio related to unemployment was higher than in studies including all those of working age (Bijl et al. Reference Bijl, Ravelli and van Zessen1998; Andrews et al. Reference Andrews, Henderson and Hall2001; Jenkins et al. Reference Jenkins, Lewis, Bebbington, Brugha, Farrell, Gill and Meltzer2003; Alonso et al. Reference Alonso, Angermeyer, Bernert, Bruffaerts, Brugha, Bryson, de Girolamo, Graaf, Demyttenaere, Gasquet, Haro, Katz, Kessler, Kovess, Lépine, Ormel, Polidori, Russo, Vilagut, Almansa, Arbabzadeh-Bouchez, Autonell, Bernal, Buist-Bouwman, Codony, Domingo-Salvany, Ferrer, Joo, Martínez-Alonso, Matschinger, Mazzi, Morgan, Morosini, Palacin, Romera, Taub and Vollebergh2004; Jacobi et al. Reference Jacobi, Wittchen, Hölting, Höfler, Pfister, Müller and Lieb2004; Pirkola et al. Reference Pirkola, Isometsä, Suvisaari, Aro, Joukamaa, Poikolainen, Koskinen, Aromaa and Lönnqvist2005), suggesting that unemployment may be particularly stressful for young adults – or that mental disorders are one cause of current unemployment (Kessler, Reference Kessler2007). Unemployment was particularly strongly associated with substance-use disorders: 24.6% of the unemployed had current substance abuse or dependence, compared with 5.1% of the currently employed. Not being married or cohabiting was associated mainly with depressive disorders, while in previous studies it has usually been associated with a broader range of mental disorders (Bijl et al. Reference Bijl, Ravelli and van Zessen1998; Andrews et al. Reference Andrews, Henderson and Hall2001; Jenkins et al. Reference Jenkins, Lewis, Bebbington, Brugha, Farrell, Gill and Meltzer2003; Jacobi et al. Reference Jacobi, Wittchen, Hölting, Höfler, Pfister, Müller and Lieb2004; Joutsenniemi et al. Reference Joutsenniemi, Martelin, Martikainen, Pirkola and Koskinen2006). This probably relates to the young age of the participants: being single is still normative in this age group. In the Australian Longitudinal Study on Women's Health, relationship breakdown, but not being single in itself, was associated with depression in young adults (Lee & Gramotnev, Reference Lee and Gramotnev2007). The observed association between not being married or cohabiting and depressive disorders may reflect such life events.
Treatment for mental disorders
Lifetime treatment contacts were most common in bipolar and least common in substance-use disorders. The proportion of persons having mental disorder with a lifetime treatment contact is comparable with many previous studies (Wittchen et al. Reference Wittchen, Nelson and Lachner1998b; Aalto-Setälä et al. Reference Aalto-Setälä, Marttunen, Tuulio-Henriksson, Poikolainen and Lönnqvist2002; Jacobi et al. Reference Jacobi, Wittchen, Hölting, Höfler, Pfister, Müller and Lieb2004), but the proportion of those with a current Axis I disorder who were currently receiving treatment, 24.2%, was lower than in many other recent studies (Andrews et al. Reference Andrews, Henderson and Hall2001; Kessler et al. Reference Kessler, Demler, Frank, Olfson, Pincus, Walters, Wang, Wells and Zaslavsky2005c) although similar to a previous Finnish study focusing on young adults (Aalto-Setälä et al. Reference Aalto-Setälä, Marttunen, Tuulio-Henriksson, Poikolainen and Lönnqvist2001). The rate of treatment for current major depressive disorder was somewhat higher than in the Health 2000 adult sample, and for current anxiety disorders somewhat lower (Hämäläinen et al. Reference Hämäläinen, Isometsä, Sihvo, Pirkola and Kiviruusu2008). However, almost 80% of persons with a current mental disorder who felt that they needed treatment had current treatment contact. This suggests that while treatment is available to those who seek it, unidentified mental disorders remain a challenge to health care.
Imputation versus weighting in the estimation of prevalences
Both MI and weighting are acceptable ways of accounting for missing values in a two-phase survey design (Pickles et al. Reference Pickles, Dunn and Vázquez-Barquero1995; Dunn et al. Reference Dunn, Pickles, Tansella and Vázquez-Barquero1999; Schafer & Graham, Reference Schafer and Graham2002). Weighting is technically easier, and thus we used MI only to compare and validate results obtained using the weights. The prevalences were quite similar regardless of the method used in their calculation. This suggests that a two-phase study design for assessing mental disorders, with several self-report scales in the first phase, is a viable option in large population surveys. However, using MI to predict individual disorders would have been more imprecise.
Attrition
Attrition in the MEAF questionnaire depended on age, sex and education, but not on self-reported mental health disorders. Persons with a lifetime hospital treatment for mental health problems returned the questionnaire less often, but this was compensated for by the case records we obtained. These factors were also most strongly related to attrition in the interview. None of the scores in any of the screens we used for the mental health interview differed between interview participants and non-participants. Our results on attrition are similar to another Finnish longitudinal study in which male sex and poor school performance were the only significant predictors of non-response (Eerola et al. Reference Eerola, Huurre and Aro2005). Similarly, in the NEMESIS (de Graaf et al. Reference de Graaf, Bilj, Smit, Ravelli and Vollebergh2000) and the National Health and Nutritional Examination Study (NHANES) I (Farmer et al. Reference Farmer, Locke, Liu and Moscicki1994), psychopathology was only weakly associated with failure to locate participants and not related to refusals.
Strengths and limitations
The two-phase study design enabled us to conduct SCID-I interviews, which require clinical judgement. These were complemented by case records from mental health treatment contacts, with the final diagnostic assessment being based on all available information. This is exceptional in population-based studies and a definite strength of the present study, which forms part of the longitudinal Health 2000 study. The study sample is being followed up continuously from health-care registers, the next face-to-face follow-up being due in 2009–10. This programme allows longitudinal investigation of determinants and consequences of mental disorders.
The limitation of a two-phase study design is that confidence intervals of prevalence estimates become wider. Also, attrition increases when there are two study phases (Jenkins et al. Reference Jenkins, Lewis, Bebbington, Brugha, Farrell, Gill and Meltzer1997). Compared with a mental health reassessment conducted in the Health 2000 adult sample (Perälä et al. Reference Perälä, Suvisaari, Saarni, Kuoppasalmi, Isometsä, Pirkola, Partonen, Tuulio-Henriksson, Hintikka, Kieseppä, Härkänen, Koskinen and Lönnqvist2007), attrition in the MEAF interview was greater. This young age group has also been the least likely to participate in other recent surveys (de Graaf et al. Reference de Graaf, Bilj, Smit, Ravelli and Vollebergh2000), which may be related to age, but might also be a cohort effect. It is possible that attrition will present an increasing problem in future epidemiological surveys (Kessler et al. Reference Kessler, Birnbaum, Demler, Falloon, Gagnon, Guyer, Howes, Kendler, Shi, Walters and Wu2005b). Although we used several methods to adjust for attrition, our estimates are less precise than if the total sample had participated in the survey.
Problems with recall may lead to underestimates of lifetime prevalences (Kruijshaar et al. Reference Kruijshaar, Barendregt, Vos, de Graaf, Spijker and Andrews2005). Problems with recall increase with time since the episode (Coughlin, Reference Coughlin1990), and therefore recall bias should be less of a problem in a young adult sample compared with studies involving the whole adult population. We were able to overcome recall bias to some extent by utilizing information from medical records.
Interviews were conducted 2–4 years after the initial sample was drawn from the general population. Although the Finnish population is more stable than in most other European countries, the interval may have caused slight imprecision in the prevalence estimates.
Conclusions
Mental disorders in young adults are common and often co-morbid. They are strongly associated with lower education and unemployment. Although some form of treatment is available to those who seek it, the high proportion of unidentified mental disorders presents a challenge to health care.
Acknowledgements
We thank Merja Blom, Margit Keinänen-Guillaume, Helena Kurru, Maija Lindgren, M.Psych., Taina Laajasalo, Ph.D., Marko Manninen, MPsych, Tuula Mononen and Sebastian Therman, M.Psych. for the skilfully conducted interviews, and Tuula Koski, Kirsi Niinistö and Satu Viertiö, M.Sc. for administrative work. We also thank Arpo Aromaa, M.D., Ph.D. and all the other collaborators in the Health 2000 study group, as well as all participants.
Declaration of Interest
This study was supported by grants from the Academy of Finland (J.S.), the Yrjö Jahnsson Foundation (J.S., T.A.-S. and J.P.) and the Jalmari and Rauha Ahokas Foundation (T.A.-S.).
Note
Supplementary material accompanies this paper on the Journal's website (http://journals.cambridge.org).


