Introduction
In the first half of the twentieth century, the common wisdom based on clinical and anecdotal reports was that menopause conferred an increased risk of depression. Indeed, DSM-II included a mood disorder called Involutional Melancholia, a diagnosis specific to menopause, which was subsequently removed from DSM-III because of the lack of data to support its existence (Weissman, Reference Weissman1979). In the past two decades, numerous, mostly cross-sectional, studies have reported inconsistent findings, with the majority reporting either no association or an association between the menopausal transition and depressive symptoms (Matthews et al. Reference Matthews, Bromberger, Egland and Korenman1990; Hunter, Reference Hunter1992; Kaufert et al. Reference Kaufert, Gilbert and Tate1992; Avis et al. Reference Avis, Brambilla, McKinlay and Vass1994; O'Connor et al. Reference O'Connor, Del Mar, Sheehan, Siskind, Fox-Young and Cragg1994; Kuh et al. Reference Kuh, Wadsworth and Hardy1997; Maarten et al. Reference Maarten, Knottnerus and Pop2002; Freeman et al. Reference Freeman, Sammel, Lui, Gracia, Nelson and Hollander2004). Specifically, we have moved from the ‘belief’ that women were particularly susceptible to depression after the menopausal transition to the current empirically supported conclusion that middle-aged women are at a greater risk for depression during the transition than before (Maarten et al. Reference Maarten, Knottnerus and Pop2002; Freeman et al. Reference Freeman, Sammel, Lui, Gracia, Nelson and Hollander2004; Cohen et al. Reference Cohen, Soares, Vitonis, Otto and Harlow2006; Bromberger et al. Reference Bromberger, Matthews, Schott, Brockwell, Avis, Kravitz, Everson-Rose, Gold, Sowers and Randolph2007). Three limitations in the literature to date are important. First, the conclusions are based primarily on longitudinal studies of depressive symptoms, not depression diagnoses, albeit using standard instruments such as the Center for Epidemiological Studies of Depression Scale (CES-D). Second, the longitudinal data on the risk for depression immediately after the transition (post-menopause) are inconclusive because few studies follow women beyond the final menses for any length of time. Third, it is unclear whether any effects obtained are due to a lifetime history of elevated risk for depression as most studies do not have data with regard to past history.
It is also unclear whether the reproductive hormones that change markedly during the menopausal transition (i.e. gonadotropins and ovarian hormones) are associated with major depression. Increased odds of high depressive symptoms were associated with variability in serum estradiol (E2) and follicle-stimulating hormone (FSH) levels in one study (Freeman et al. Reference Freeman, Sammel, Lin and Nelson2006) and with declines in serum E2 and large increases in FSH levels in another (Schmidt et al. Reference Schmidt, Murphy, Haq, Danaceau and St Clair2002). Neither study found a significant association between odds of depressive symptoms and absolute hormone levels.
The Study of Women's Health Across the Nation (SWAN) Pittsburgh site provides an opportunity to address three questions: (1) Does the risk for a major depressive episode (MDE) increase during the menopausal transition or immediately thereafter and is the risk independent of a history of major depression at study entry and upsetting events at annual visits? (2) Do annually measured reports of ‘frequent’ vasomotor symptoms (VMS) or circulating levels of, or changes in, reproductive hormones, E2, FSH or testosterone (T), account for or attenuate the association of menopausal status and major depression? (3) If the risk for an episode during the post-menopause increases, how long is the period of increased risk? We also explored whether risk for an MDE varies by race (African Americans and Caucasians).
Method
Subjects and procedures
This study was conducted among participants in the Pittsburgh site of SWAN, a multi-site community-based cohort investigation of the menopause and aging. Of the 463 women enrolled in the Pittsburgh SWAN, 443 participated in the SWAN ancillary study, the Mental Health Study (MHS). At study entry, about half of the women were pre-menopausal and half were early peri-menopausal. The sample for the current analyses consisted of the 77 African American and 144 Caucasian women, aged 42–52 years, who were pre-menopausal at study entry. We selected this subset to provide a more conservative estimate of the relative odds of experiencing an MDE during and after the menopausal transition compared to pre-menopause. In the MHS, psychiatric interviews were conducted to obtain information on lifetime and current psychiatric disorders in addition to the extensive data collected as part of the larger SWAN study, which tracks a variety of health parameters in a multi-ethnic community-based sample of women as they transition through menopause.
The sampling procedures and design of the SWAN have been described previously (Sowers et al. Reference Sowers, Crawford, Sternfeld, Morganstein, Gold, Greendale, Evans, Neer, Matthews, Sherman, Lo, Weiss, Kelsey, Lobo, Kelsey and Marcus2000). Each site recruited Caucasian women and a sample of a predetermined minority group. Pittsburgh participants were recruited using random digit dialing that was supplemented by a voter's registration list and enrolled 162 African American women and 301 Caucasian women. Eligibility criteria for the SWAN included being aged between 42 and 52 years, having an intact uterus, having had at least one menstrual period and no use of reproductive hormones in the previous 3 months, and self-identifying with one of the site's designated race/ethnic groups. In Pittsburgh, 3540 telephone numbers called were of unknown usability (e.g. busy signals, never home, moved), 2148 contacts yielded unknown cohort eligibility (e.g. incomplete screening interview, refusal to be screened), 12 027 women were ineligible to be screened (e.g. out of age range, no period in past 3 months), and 2604 completed the screening interview. Of the latter, 1050 were eligible and 463 of those eligible entered the SWAN study in Pittsburgh. Participants and those who were eligible but did not participate did not vary by ethnicity, marital status, parity, quality of life, social support, perceived stress or reports of feeling ‘blue or depressed’ in the prior 2 weeks measured during the screener. There were no significant differences between the 443 MHS participants and the 20 non-participants with respect to sociodemographic factors and CES-D scores ⩾16.
At the beginning of the study all participants signed an informed consent in accordance with the University of Pittsburgh Institutional Review Board guidelines. The women provided extensive health, psychosocial, lifestyle and biologic data at baseline and at annual follow-up visits as part of the larger SWAN study. Height and weight were measured using a common protocol and body mass index (BMI) was calculated (kg/m2). Women were scheduled for venipuncture for assays of reproductive hormones prior to 1000 h on days 2–5 of a spontaneous menstrual cycle occurring within 60 days of recruitment at the baseline visit, and annually thereafter. If a timed sample could not be obtained after two attempts, a random fasting sample was taken within a 90-day window of the anniversary of the baseline visit. The Structured Clinical Interview for the Diagnosis of DSM-IV Axis I Disorders (SCID) was administered 2–9 months after the SWAN baseline assessment and annually within 3 months of the annual SWAN visit.
Measures
Assessment of psychiatric disorders
Diagnoses of lifetime and current major depressive disorders were determined from interviews conducted by trained clinicians using the SCID (Spitzer et al. Reference Spitzer, William, Gibbon and First1992). The SCID has been used with many different ethnic groups and field testing has demonstrated its suitability for research purposes; adequate reliability has been demonstrated in numerous studies (Williams et al. Reference Williams, Gibbon, First, Spitzer, Davies, Borus, Howes, Kane, Pope and Rounsaville1992). All interviewers had extensive clinical experience and at least a master's degree in a relevant field, such as social work or psychology. Interviewers were supervised by the first author (J.T.B.).
Extensive training and qualitative procedures were used to ensure and monitor consistency of SCID administration, symptom elicitation, and diagnostic decision making. These included central training conducted by biometrics, follow-up practice with community volunteers, and ongoing supervision by the principal investigator (J.T.B.). All interviews with study participants were audiotaped. Tapes were used for supervision, to monitor rater drift and to estimate inter-rater reliability. Using a systematic sampling procedure, 24–36 audiotapes were selected and reviewed by all interviewers and the supervisor (J.T.B.) and consultant (H.M.K.) to estimate inter-rater reliability for lifetime diagnoses of selected disorders and subsequent follow-up diagnoses. Inter-rater reliability was very good to excellent for lifetime major depressive disorder (κ=0.81) and for major depression in the past year (κ=0.76–0.89, reliability at several follow-ups).
A history of major depression was defined as the occurrence of major depression prior to the SWAN baseline assessment. Annual SCIDs assessed MDEs that occurred in the previous year or were current at the baseline or annual assessment.
Participants with current major depression were asked by the interviewer whether they were receiving treatment or had considered seeking help for the distress/depression they were experiencing. If treatment had not been obtained, information regarding resources available in the community was offered. The presence of current suicidal ideation is assessed as part of the Mood Disorders module of the SCID. The SCID Manual of Operations includes procedures to intervene and arrange for emergency referrals if women report suicidal thoughts during the interview.
Independent variables
Menopausal status
Menopausal status was based on menstrual bleeding patterns in the previous 12 months and was categorized as follows: (a) pre-menopausal: menstrual period in the past 3 months with no change in regularity in the past 12 months; (b) menopausal transition/peri-menopausal: menstrual period in the past 3 months with change in regularity over the previous 12 months or no menstrual period within the past 3 months, but some menstrual bleeding within the past 12 months; (c) post-menopausal: no menstrual period within the past 12 months. The classifications are similar to those recommended by the World Health Organization (WHO, 1996). Based on SWAN eligibility requirements, all women were pre-menopausal or early peri-menopausal at baseline. As noted, the women in the current analyses were all pre-menopausal at baseline.
VMS
Data on VMS (hot flashes or night sweats) were obtained with a self-report checklist of symptoms commonly included in studies of the menopause (Neugarten & Kraines, Reference Neugarten and Kraines1965; McKinlay et al. Reference McKinlay and Jefferys1974; Matthews et al. Reference Matthews, Wing, Kuller, Leilahn and Plantinga1994). At each visit, women were asked how often they had experienced hot flashes and night sweats in the past 2 weeks: not at all, 1–5 days, 6–8 days, 9–13 days, daily. We defined frequent VMS as those occurring at least 6 days in the past 2 weeks.
Reproductive hormones
The fasting blood draw was targeted to days 2–5 of the follicular phase of the menstrual cycle in menstruating women and within 90 days of the anniversary of the baseline examination date. If a timed sample could not be obtained after two attempts, a random fasting sample was taken within a 90-day window of the annual visit. Blood was refrigerated within 1–2 h after phlebotomy. All samples were maintained at 4°C until separated; following centrifugation, the serum was aliquotted, frozen at −80°C, and shipped on dry ice to the central laboratory, the SWAN Endocrine Laboratory at the University of Michigan, Ann Arbor, where all assays were performed using an ACS-180 automated analyzer (Bayer Diagnostics Corporation, USA). The assays involved a chemiluminescent immunoassay with a solid-phase anti- (Ig)G immunoglobulin conjugated to paramagnetic particles, anti-ligand antibody, and competitive ligand labeled with dimethylacridinium ester. E2 assays were conducted in duplicate and FSH and T in singlicate. The respective intra- and interassay coefficients of variation were 8.5% and 13.8% for E2, 12.0% and 6.0% for FSH and 9.7% and 11.3% for T (Randolph et al. Reference Randolph, Sowers, Bondarenko, Gold, Greendale, Bromberger, Brockwell and Matthews2005).
Covariates
Demographic factors relevant to the current analyses included baseline marital status, level of educational attainment and age at annual visit. Marital status was categorized as single, married/partnered, or separated/divorced/widowed. Educational attainment was classified in three categories: completed high school or less, high school plus some college, or completed college or more. Race/ethnicity was self-identified based on the participant's response to the question ‘What is your primary racial or ethnic group?’ At each visit, women completed a checklist of 18 negative life events indicating whether any of these had occurred in the past year and, if so, to rate these according to how upsetting they were: not at all, somewhat, or very upsetting. Women were categorized as having experienced at least one ‘very upsetting’ event versus none/somewhat upsetting event since their last study visit. Psychotropic medication use in the past year and BMI at each visit were also considered for inclusion to account for potential confounding with depression.
Statistical analysis
The analytic sample consisted of 221 pre-menopausal women for whom we had 1698 person-years of observations, 89% of a possible 1913, over the 10 years of assessments. The possible number of observations was based on the number of women expected at each visit and whose data were eligible for inclusion. For example, pre- or peri-menopausal women who were using hormone therapy (HT) at a visit were not considered as possible observations because their data from that visit were excluded, as noted below. However, a missed visit would have been included as a possible person-year of observation.
We used repeated-measures random effects logistic regression models to examine whether the menopausal transition was associated with an increased odds of meeting criteria for an MDE in the past year or currently at each annual visit. The inclusion of a (woman-specific) random intercept allows for the correlation between all observations from a given woman to be modeled and enables us to ascribe a ‘woman-specific’ interpretation to model parameters. Random effects logistic regression models are relatively robust to missing data and make use of all available data across all visits. Data from women who reported a surgical menopause were censored at that visit forward and data from those who were pre- or peri-menopausal and were using HT were excluded at the visit at which they reported its use because HT use affects bleeding patterns and obfuscates menopausal status. The data from these HT users were included at subsequent visits when they had not been using HT for 1 year and menopausal status could be determined. Data from post-menopausal women using HT were included.
We first used random effects logistic regression analyses to examine the odds of an MDE for each of the variables marital status and education individually, and for the time-dependent variables: upsetting life events, psychotropic medication use, BMI, HT use (during post-menopause), VMS and levels of natural log transformed hormones and change in log hormones from baseline. Variables associated with MDE at p<0.10 in these univariate analyses were candidates for inclusion in the multi-variable models. To examine our first aim, we modeled the odds of having an MDE at any given annual assessment or in the previous year as a function of the participant's menopausal status, age, race, and history of major depression at study entry. Race was included as an independent variable because of the study design. We next added the covariates associated with an MDE at p<0.10 in the univariate analyses to control for their confounding with depression. To address our second aim, we added to the model, individually, frequent VMS and endogenous hormones that were significant at p<0.10 in the univariate analyses. For our third aim, we divided post-menopause into early (⩽2 years amenorrheic) and late (>2 years amenorrheic) post-menopause and conducted analyses as described above. Analyses were run using SAS version 8 (SAS Institute, Inc., USA) and Stata version 7 (StataCorp LP, USA).
Results
All women had at least one peri-menopause visit and 131 had at least one post-menopause visit, with the numbers of visits for each participant during each stage of menopause ranging from 1 to 10. Among those who reached post-menopause during the study, the average number of visits was 8.98 out of 10 possible visits.
Figure 1 shows the total number of actual person-years of observations and the numbers of observations during each menopausal stage for the 221 participants. The total number of MDEs and the number diagnosed during each stage are also shown. It can be seen that there were a total of 146 MDEs diagnosed during 1698 annual visits: 31 occurred during a pre-menopause visit, 71 during a peri-menopause visit, and 44 during a post-menopause visit. Thus, MDEs were diagnosed during 5.8% (n=31) of 535 pre-menopause visits, 9.1% (n=71) of 782 peri-menopause visits, and 9.8% (n=44) of 381 post-menopause visits. Over the 10 years of the study, 69 (23.8%) women had at least one MDE: 33.8% of African Americans and 29.9% of Caucasians. Of these, 15 (21.7%) had three or more episodes: six (14.0%) Caucasian women and nine (34.6%) African American women.

Fig. 1. Number of person-years of observations (visits) for total sample (maximum possible=1913) and for pre-, peri- and post-menopause visits. □, Number of observations; ▪, number of major depressive episodes.
At baseline, women with and without at least one MDE over the study did not differ by race, marital status or education. Nor did they vary by prevalence of frequent VMS, log E2 or log FSH. A significantly higher proportion of women who ever had an MDE had very upsetting life events in the past year, current use of psychotropic medications, a history of major depression and a lower mean log T compared with those who never had an MDE (Table 1). Because reproductive hormone levels have been shown to vary with BMI (Burger et al. Reference Burger, Dudley, Hopper, Groome, Guthrie, Green and Dennerstein1999), analyses for each hormone were also adjusted for BMI. This did not change substantively the association of hormones with MDE.
Table 1. Baseline characteristics of women who never or ever had an episode of major depression across 10 years
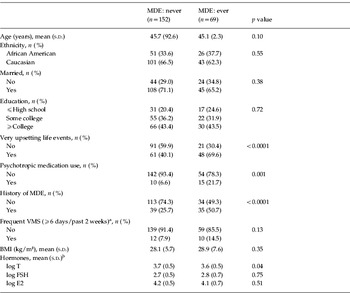
MDE, Major depressive episode; VMS, vasomotor symptoms; BMI, body mass index; T, testosterone; FSH, follicle-stimulating hormone; E2, estradiol; s.d., standard deviation.
a One woman was missing complete data on VMS.
b The results for hormones were similar when adjusted for BMI.
In the univariate repeated-measures analyses (Table 2), being peri- or post-menopausal, compared to being pre-menopausal, was associated with a significantly greater odds of experiencing an MDE over time. Also significant were age, history of major depression, use of psychotropic medications, very upsetting life events, BMI and frequent VMS. One reproductive hormone, log FSH, showed only a non-significant trend (p=0.08); HT use and race were not significant.
Table 2. Univariate repeated-measures associations of baseline and annual measures with odds of a major depressive episode (MDE) from baseline to visit 9

HT, Hormone therapy; VMS, vasomotor symptoms; BMI, body mass index; E2, estradiol; T, testosterone; FSH, follicle-stimulating hormone; OR, odds ratio; CI, confidence interval.
a The results for hormones were similar when adjusted for BMI.
b Adjusted for baseline value.
Table 3 presents the results of the three multi-variable models. Model A shows that being peri- or post-menopausal compared to being pre-menopausal was significantly associated with an increased odds of experiencing an MDE and that the odds ratios (ORs) increased as women progressed through the transition to post-menopause, independent of age, race and history of major depression. Model B shows that peri- and post-menopause remained significantly related to the development of a new MDE independent of covariates. Having a history of major depression at baseline, psychotropic medication use, higher BMI, and very upsetting life events annually were each associated with odds of an MDE. Model C shows that frequent VMS were marginally significant as 95% confidence intervals (CIs) included 1.0 and reduced the ORs for peri- and post-menopause compared with pre-menopause by 4.8% and 10.6% respectively. However, peri- and post-menopause remained significant predictors of MDEs (ORs 1.98 and 3.86 respectively). Log FSH was not significant (data not shown).
Table 3. Results of random effects logistic regression analyses for odds of a major depressive episode (MDE) from baseline to visit 9 by menopausal status

BMI, Body mass index; VMS, vasomotor symptoms.
Model A: adjusted for age and race. Model B: addition of history of major depression at baseline, annual psychotropic medication, annual very upsetting life events, and BMI. Model C: final model with addition of annual frequent VMS.
When the post-menopause period was divided into early (⩽2 years amenorrheic) and late (>2 years amenorrheic), the multi-variable analyses showed that the early post-menopause posed a significantly greater risk for MDEs than did pre-menopause (OR 5.01, 95% CI 1.66–15.17) whereas late post-menopause did not (OR 2.93, 95% CI 0.92–9.36). Frequent VMS was marginally significant (OR 1.76, 95% CI 0.99–3.13), as was peri-menopause (OR 1.91, 95% CI 0.99–3.72).
Discussion
In longitudinal analyses that spanned 10 years, we found that the odds of experiencing an MDE were significantly greater when women were peri- and post-menopausal than when they were pre-menopausal, independent of a baseline history of major depression and annually measured very upsetting life events, use of psychotropic medications, reproductive hormone characteristics, BMI and frequent VMS. These findings are consistent with previous results in the entire SWAN cohort (n=3296) showing that the odds of high depressive symptoms (CES-D score ⩾16) were significantly greater as women progressed through the menopausal transition (Bromberger et al. Reference Bromberger, Matthews, Schott, Brockwell, Avis, Kravitz, Everson-Rose, Gold, Sowers and Randolph2007).
In the past three decades, epidemiological studies of menopause have found no relationship between depressive symptoms and menopausal status (Kaufert et al. Reference Kaufert, Gilbert and Tate1992; Matthews et al. Reference Matthews, Wing, Kuller, Leilahn and Plantinga1994; McKinlay et al. Reference Avis, Brambilla, McKinlay and Vass1994), or in some cases, higher levels of symptoms during peri-menopause (Hunter, Reference Hunter1992; Avis et al. Reference Avis, Brambilla, McKinlay and Vass1994; Kuh et al. Reference Kuh, Wadsworth and Hardy1997). These studies were mostly cross-sectional and had numerous methodological limitations, including select or small samples, non-standard measures of depressive symptoms, and inconsistent definitions of menopausal status. The results of more recent longitudinal studies (Maarten et al. Reference Maarten, Knottnerus and Pop2002; Freeman et al. Reference Freeman, Sammel, Lui, Gracia, Nelson and Hollander2004; Cohen et al. Reference Cohen, Soares, Vitonis, Otto and Harlow2006) have more consistently found that the odds of high depressive symptoms were greater during peri-menopause than pre-menopause. Compared to the earlier studies, these recent studies had larger or more diverse samples, longer and more frequent follow-up, more consistent, careful definitions of menopausal status and used sophisticated analyses that utilized fully the longitudinal data. With one exception (Maarten et al. Reference Maarten, Knottnerus and Pop2002), these studies did not find an increased risk for depressive symptoms post-menopause. The null findings may have been due to insufficient power because of the relatively small numbers of women followed through post-menopause. For example, the Penn Ovarian Aging (POA) study (Freeman et al. Reference Freeman, Sammel, Lui, Gracia, Nelson and Hollander2004) reported an increase in depressive symptoms in the peri-menopause and a subsequent decline post-menopause over 4 years of follow-up. However, in that study 73% of the 332 participants remained pre-menopausal over the 4 years of follow-up.
Three longitudinal studies of menopause have assessed depressive disorders (Freeman et al. Reference Freeman, Sammel, Lui, Gracia, Nelson and Hollander2004; Schmidt et al. Reference Schmidt, Nazli and Rubinow2004; Cohen et al. Reference Cohen, Soares, Vitonis, Otto and Harlow2006). The POA study found that depressive disorders were not more likely to occur during the menopausal transition than pre-menopausal (Freeman et al. Reference Freeman, Sammel, Lui, Gracia, Nelson and Hollander2004). However, the study was limited by having only 4 years of data collection, only 3% of the sample had reached post-menopause, and the assessment of MDE covered only the past month, making the numbers for post-menopause and MDE too small to determine statistical significance. The POA study and the Harvard Study of Moods and Cycles reported an increased risk of first-onset depressive disorder during peri-menopause compared to pre-menopause over 8 years (Cohen et al. Reference Cohen, Soares, Vitonis, Otto and Harlow2006). Importantly, neither study included women who had ceased menstruating and both examined a only subset of women.
Our findings of an increased risk of MDE during post-menopause and particularly during the first 2 years after the final menstrual period are similar to those reported in a small longitudinal study (5 years) that followed 29 regularly cycling women in their forties through 1 year after their last menses (Schmidt et al. Reference Schmidt, Nazli and Rubinow2004). In that study, detailed measures of menstrual cycles, symptoms and depression, and also plasma FSH, were collected every 3–6 months and the SCID was conducted to obtain data on episodes of minor and major depression. The results indicated that women were significantly more likely to experience an episode of clinical depression (primarily minor depression) during the year before or after their final menstrual period than when they were pre-menopausal.
In our sample, the increased vulnerability to an MDE during and after the menopausal transition was not accounted for by frequent VMS or by levels of or changes in reproductive hormones. Lack of a statistically significant association between frequent VMS and MDE may be due to the short time-frame over which we assessed VMS (i.e. the past 2 weeks). It is possible that a measure of VMS frequency over a longer period of time may have been more strongly related to major depression onset in the multivariate analysis and may have attenuated the association between menopausal status and MDE, particularly because VMS can wax and wane across a period of time. Nonetheless, future studies should continue to examine the role of VMS in the development of MDEs.
We found no significant associations between any reproductive hormone and MDEs, which is consistent with the literature showing no direct associations between depression and serum E2 levels (Schmidt et al. Reference Schmidt, Murphy, Haq, Danaceau and St Clair2002). However, single annual hormone samples have limited ability to provide information about the underlying hormonal dynamics that occur during the menopausal transition. Reproductive hormone secretion, especially that of E2, is subject to great variability during the menopausal transition. It has been hypothesized that the fluctuations in reproductive hormones in susceptible women pose a risk for depression. However, we found no association between change or variability in hormones over time with major depression. By contrast, the POA study of first-onset depression did report an association between the variability of E2 and FSH measured at two consecutive monthly assessments with high depressive symptoms or depressive disorder (Freeman et al. Reference Freeman, Sammel, Lin and Nelson2006). Our null result for T was in contrast to our previously reported associations between high depressive symptom scores (CES-D ⩾16) and T levels and changes in these over the first 8 years of the SWAN in the entire cohort. The conflicting findings may be due to the relatively small sample of women in the current analysis (n=221) compared to the SWAN cohort of more than 3000 women. Perhaps T is more likely to be associated with the level of depressive symptoms than with the syndromal cluster represented by an MDE.
It is noteworthy that the odds of an MDE were nearly tripled in those with a history of major depression at baseline or at least one very upsetting event at the annual visits (OR 2.83 and 2.93 respectively), indicating that, in addition to and independent of menopausal status, lifetime depression history and the experience of recent life stressors made significant contributions to the risk of an MDE. Both factors are known to be consistently related to major depression (Kendler & Gardner, Reference Kendler and Gardner2010) but prior studies of menopause have not assessed their importance relative to the menopausal transition.
In addition to the limitations concerning the measures of VMS and hormones described above, other limitations of the current report are important. Because of the small size of the sample, we were limited in our ability to examine racial/ethnic differences in major depression according to menopausal status and/or history of major depression at study entry. However, in a future paper encompassing a longer period of follow-up we will focus on the characteristics and subgroups of midlife women who may be particularly vulnerable to an MDE. Furthermore, structured interviews, although they improve diagnostic reliability and validity, are subject to subjective recall and interpretation of symptoms.
Finally, we do not know the potential bias introduced by the absence of data on women whom we could not contact or who refused to complete the initial telephone screener. If this group of women included more who were depressed at the time of contact than did the group who participated, there would probably be more cases of major depression during the study. Because our sample is not large enough to determine whether women with a prior history of depression would be more likely to experience a subsequent MDE when they were peri- or post-menopausal than when they were pre-menopausal, we cannot know how our current findings would be affected.
The current study is unique in its ability to assess major depression annually in midlife African American and Caucasian women as they transitioned through peri-menopause and post-menopause. We used a standard semi-structured interview to assess MDEs during the time between visits and currently, which allowed us to account for episodes for the entire 10-year period. The current findings confirm the greater risk for MDEs during the menopausal transition than before. Although our data also indicate that the years immediately after the transition are a high-risk period for MDEs, these findings warrant confirmation when all SWAN participants become late post-menopausal. Many questions remain regarding the factors that contribute to the elevated risk of MDEs during the menopausal transition and after, including the role of reproductive hormone changes and the characteristics of the subgroup of vulnerable women. When all women enrolled in our study complete the menopausal transition, we will be able to address these important questions in further detail.
Acknowledgments
The Study of Women's Health Across the Nation (SWAN) has grant support from the National Institutes of Health (NIH) and the Department of Health and Human Services (DHHS) through the National Institute on Aging (NIA), the National Institute of Nursing Research (NINR), the National Institute of Mental Health (NIMH) and the NIH Office of Research on Women's Health (ORWH) (Grants NR004061, AG012505, AG012535, AG012531, AG012539, AG012546, AG012553, AG012554, AG012495, and MH59689). The content of this article is solely the responsibility of the authors and does not necessarily represent the official views of the NIA, NINR, ORWH or NIH.
Clinical Centers: University of Michigan, Ann Arbor (M. Sowers, PI); Massachusetts General Hospital, Boston, MA (J. Finkelstein, PI 1999–present; R. Neer, PI 1994–1999); Rush University, Rush University Medical Center, Chicago, IL (H. Kravitz, PI 2009–present; L. Powell, PI 1994–2009); University of California, Davis/Kaiser (E. Gold, PI); University of California, Los Angeles (G. Greendale, PI); Albert Einstein College of Medicine, Bronx, NY (R. Wildman, PI 2010; N. Santoro, PI 2004–2010); University of Medicine and Dentistry, New Jersey Medical School, Newark (G. Weiss, PI 1994–2004); and University of Pittsburgh, PA (K. Matthews, PI). NIH Program Office: NIA, Bethesda, MD (S. Sherman, 1994–present; M. Ory, 1994–2001); NINR, Bethesda, MD (Project Officer). Central Laboratory: University of Michigan, Ann Arbor (D. McConnell, Central Ligand Assay Satellite Services. Coordinating Center: University of Pittsburgh, PA (K. Sutton-Tyrrell, PI 2001–present); New England Research Institutes, Watertown, MA (S. McKinlay, PI 1995–2001). Steering Committee: S. Johnson, Current Chair; C. Gallagher, Former Chair.
We thank the study staff at each site and all the women who participated in SWAN.
Declaration of Interest
None.