Introduction
Major depressive disorder (depression) is the most prevalent mental health disorder, with a lifetime prevalence rate of approximately 17% (Kessler et al., Reference Kessler, Berglund, Demler, Jin, Merikangas and Walters2005). According to the World Health Organization, depression is a leading cause of disability worldwide, affecting more than 300 million people across the lifespan (World Health Organization, 2017). Although there are a variety of empirically supported treatments for depression, behavioral activation (BA) is a parsimonious, cost-effective, and easily disseminated psychotherapy for depression (Richards et al., Reference Richards, Ekers, McMillan, Taylor, Byford, Warren and Finning2016).
According to behavioral models of depression, depressive symptoms develop as a result of a reduction in experiences with positive outcomes (response-contingent positive reinforcement, RCPR) coupled with an increase in negative or aversive events (Ferster, Reference Ferster1973). This reduction in RCPR is exacerbated by diminished reinforcement of positive outcomes, a consequence of depressed mood (Lewinsohn, Sullivan, & Grosscup, Reference Lewinsohn, Sullivan and Grosscup1980; MacPhillamy & Lewinsohn, Reference MacPhillamy and Lewinsohn1974), thereby creating a vicious cycle of decreased activity and low mood. BA treatments have been developed as a means of breaking this negative feedback loop by increasing participation in rewarding activities (Martell, Dimidjian, & Herman-Dunn, Reference Martell, Dimidjian and Herman-Dunn2013). Through the process of increasing activity, the patient has more opportunities to come into contact with rewarding experiences, which is thought to decrease depression over time. BA primarily involves self-monitoring and activity scheduling aimed at increasing overt behaviors that are intended to bring the individual into contact with positive reinforcers in the environment.
Previous meta-analyses have supported the efficacy of BA for reducing depressive symptoms in adults (Cuijpers, Reijnders, & Huibers, Reference Cuijpers, Reijnders and Huibers2019b; Cuijpers, van Straten, & Warmerdam, Reference Cuijpers, van Straten and Warmerdam2007; Ekers et al., Reference Ekers, Webster, Van Straten, Cuijpers, Richards and Gilbody2014; Mazzucchelli, Kane, & Rees, Reference Mazzucchelli, Kane and Rees2009; Sturmey, Reference Sturmey2009). For example, Ekers et al. (Reference Ekers, Webster, Van Straten, Cuijpers, Richards and Gilbody2014) showed that BA had large antidepressant effects relative to control conditions and Barth et al. (Reference Barth, Munder, Gerger, Nüesch, Trelle, Znoj and Cuijpers2013) reported that changes in depression severity are not different in BA from those observed with other established interventions (e.g. interpersonal psychotherapy, cognitive behavior therapy, and problem-solving therapy).
Indeed, most individuals with depression experience co-occurring anxiety. In a large cohort study conducted in the Netherlands, an estimated 75% of individuals with depression had a lifetime comorbid anxiety disorder (Lamers et al., Reference Lamers, van Oppen, Comijs, Smit, Spinhoven, van Balkom and Penninx2011). Accordingly, estimating the effects of BA on anxiety symptom severity has potential to guide clinicians in their treatment planning. Currently, there is limited information available to guide clinicians in selection of psychotherapies for depression and co-occurring disorders. We included activation as an outcome in this meta-analysis because it is a core mechanistic target of BA and an estimate of target engagement has the potential to guide future efforts to optimize BA efficacy. We also tested whether the effect sizes on depression symptoms varied depending on the nature of the BA protocol. Specifically, more recent BA interventions have expanded the focus on incorporating a value assessment (Lejuez, Hopko, Acierno, Daughters, & Pagoto, Reference Lejuez, Hopko, Acierno, Daughters and Pagoto2011; Lejuez, Hopko, & Hopko, Reference Lejuez, Hopko and Hopko2001) in activity scheduling as a means to maximize activation and improve outcomes. Hence, we tested whether including a discussion of values in treatment resulted in better depression outcomes.
The current meta-analysis sought to expand on this literature by examining the effects of BA on additional relevant outcomes for patients with depression, namely the reduction in anxiety symptoms and the increase in activation. Specifically, the objective of this meta-analysis was to evaluate and summarize the current scientific knowledge regarding the effects of BA on (1) depression symptoms, (2) activation, and (3) anxiety symptoms compared to both inactive and active control conditions. We further aimed to examine the moderating effect of incorporating a discussion of values into treatment of depression symptoms.
Method
Protocol and registration
The PRISMA statement guidelines for systematic review were followed for this review (Moher, Liberati, Tetzlaff, Altman, & Group, Reference Moher, Liberati, Tetzlaff, Altman and Group2009). In accordance with these guidelines, the protocol for this review was pre-registered on PROSPERO (CRD42019124300).
Search strategy
The Cochrane Library, PsycINFO, and PubMed databases were searched for relevant articles using the following search terms: (‘behavioral activation’ OR ‘behavioural activation’ OR ‘activity scheduling’ OR ‘pleasant events’ OR ‘pleasant activities’) AND depress*. Results were limited to studies published in English before 1 February 2019 in peer-reviewed articles examining human subjects. We also used references extracted from previously published meta-analyses and systematic reviews and an existing database of psychotherapy studies of depression (for further details about this database refer to Cuijpers, Karyotaki, de Wit, and Ebert, Reference Cuijpers, Karyotaki, de Wit and Ebert2019a).
Study selection
Results from the search were uploaded into Covidence (Covidence systematic review software, 2019), which was used to manage data throughout the review process. Study titles and abstracts were first screened by two independent reviewers (AS and EC) for possible relevance to topic and eligibility criteria. Studies that were clearly not relevant or not meeting eligibility criteria based on title and abstract were excluded. Full text of the remaining studies was reviewed by two independent reviewers (AS and EC) and assessed for eligibility criteria. The two reviewers discussed any discrepancies and final determinations were made through consensus. If consensus could not be reached, a third author assisted in determinations (JS). Data were then extracted by two independent researchers (AS and EC) into Covidence. The independent reviewers then compared the data extracted and resolved discrepancies as discussed above.
We employed the following inclusion criteria: (1) Studies were published in English in peer-reviewed, scholarly journals before February 2019. (2) Studies aimed to evaluate the effect of BA on depression. For the purpose of this study, BA was defined as a time-limited treatment delivered individually (as opposed to group) by a trained clinician (as opposed to electronically), in which the primary treatment components were activity scheduling and self-monitoring for the purpose of reducing symptoms of depression. (3) Additional treatment components (e.g. cognitive restructuring, social skills training, and problem solving) were acceptable as long as they were not a primary aim of the treatment (e.g. did not comprise entire treatment sessions). (4) Studies included a sample of adults (⩾18 years of age) receiving treatment for depressed mood. We included studies that involved participants with medical and/or psychiatric comorbidity as long as the primary aim of the intervention was reduction in depression symptom severity. Hence, studies that tested the efficacy of combination interventions (e.g. targeting both depression and another co-occurring symptom or condition) were not included. (5) Employed a randomized controlled trial design (randomization must occur at the individual level), involving any type of control comparison condition. We did not include studies in which the control arm was another version of the same intervention (e.g. BA-delivered individual v. group, internet v. in-person). (6) Administered psychometrically-sound measures of depression symptoms before and after the intervention.
Data extraction
All data were extracted by two independent authors (AS and EC) and entered in Covidence (Covidence systematic review software, 2019). The data were then exported into a spreadsheet and checked independently by both authors prior to analyses. For all outcomes, sample sizes, means, and standard deviations were extracted. When those data were not reported, authors were contacted with requests for additional information. If authors did not respond to two requests for the data, effect size data were extracted from either the original study report or a prior meta-analysis, when possible.
Quality assessment
Two authors (AS and EC) independently rated risk of bias of all included studies using the Cochrane Collaboration's Risk of Bias tool (Higgins et al., Reference Higgins, Altman, Gotzsche, Juni, Moher and Oxman2011). Disagreements were resolved by discussion until consensus was reached. The following elements were rated: (1) random sequence generation (selection bias), (2) allocation concealment (selection bias), (3) blinding of outcome assessment (detection bias), (4) incomplete outcome data (attrition bias), and (5) selective reporting (reporting bias). Each element was rated to have a high, low, or unclear risk of bias. Because studies of psychological interventions are typically not able to blind participants and personnel to condition, blinding of participants and personnel was not rated for this review.
Data synthesis and analysis
CMA version 3 (Borenstein, Hedges, Higgins, & Rothstein, Reference Borenstein, Hedges, Higgins and Rothstein2013) was used to estimate controlled effect sizes using Hedges's g (Hedges & Olkin, Reference Hedges and Olkin2014). Hedges's g was used because it corrects for small sample sizes, providing a more accurate estimate (Hedges & Olkin, Reference Hedges and Olkin2014). Hedges's g was calculated from extracted means and standard deviations and significance tests when appropriate. Hedges's g was interpreted using the same conventions as Cohen's d, with 0.2, 0.5, and 0.8 representing small, medium, and large effect sizes, respectively. Pooled effect sizes were calculated for each outcome (depression, anxiety, and activation) by control type (inactive or active) using random effects models. Random effects models were used due to the heterogeneity of included studies. A control condition was deemed ‘inactive’ if it was selected by the researcher(s) as a comparison condition to BA and expected to offer none to minimal therapeutic benefits. This included waitlist, pill placebo, psychological placebo (e.g. supportive counseling), and treatment as usual that did not include psychiatric care (e.g. primary care, referrals). A control condition was deemed ‘active’ if it was selected by the researcher(s) as a comparison condition to BA and expected to offer therapeutic benefits. This included other psychotherapies (e.g. CBT, psychodynamic, and problem-solving therapy), antidepressant medication, or treatment as usual that did include psychiatric care. In order to avoid including multiple comparison conditions from the same study in the effect size analyses (this violates the independence assumption), we selected one control condition per analysis. If there were multiple inactive conditions, we opted to include the most stringent control condition (e.g. placebo/supportive counseling over waitlist). If there were multiple active control conditions, we favored interventions that were of the same treatment modality as BA (e.g. psychotherapy over pharmacotherapy). If there were multiple active conditions that were similar modalities to BA (e.g. multiple psychotherapy conditions), we chose the psychotherapy that was conceptually furthest from BA (e.g. psychodynamic over CBT). If there were multiple outcome measures for a single outcome, these measures were pooled for analyses.
Heterogeneity was assessed using the Q and I 2 statistics. Cochran's Q-test was used to test whether the observed variability between effect sizes is greater than what would be expected due to sampling error (Higgins, Thompson, Deeks, & Altman, Reference Higgins, Thompson, Deeks and Altman2003). The I 2 statistic (Higgins et al., Reference Higgins, Thompson, Deeks and Altman2003) is the percent of total variance explained by heterogeneity. Values can range from 0% (zero heterogeneity) to 100% (the difference in effect sizes is explained by sampling error), with 25, 50, and 75% indicating low, moderate, and high heterogeneity, respectively. I 2 was calculated using CMA and 95% confidence intervals were computed in Excel using formulas provided by Borenstein, Hedges, Higgins, & Rothstein (Reference Borenstein, Hedges, Higgins and Rothstein2011).
For each effect size analysis, a funnel plot was visually inspected for publication bias (Egger, Smith, Schneider, & Minder, Reference Egger, Smith, Schneider and Minder1997). Duval and Tweedie's trim and fill procedure was used to test for missing studies (Duval & Tweedie, Reference Duval and Tweedie2000). Egger's test, which quantifies bias in the funnel plot, was also used to assess publication bias (Hedges & Olkin, Reference Hedges and Olkin1985). It is important to note that these methods for testing heterogeneity and publication bias may be biased when there is a small number of studies and therefore should be interpreted cautiously. In an effort to mitigate this bias, multiple methods were used and confidence intervals were reported.
Moderation analysis
Subgroup analyses were conducted to investigate the moderating effect of a discussion of values on depression symptom outcomes in BA v. inactive control. A mixed effect model was used, in which subgroups were pooled based on the presence or absence of a discussion on values for the random effects model. Differences between subgroups were tested using the fixed effects model.
Results
Search results and trial characteristics
A flow chart of study inclusion is presented in Fig. 1. Database searches and review of prior meta-analyses yielded 2117 studies, which were considered for inclusion in the meta-analysis. As depicted in the PRISMA diagram, 28 studies (n = 1853) were identified for inclusion in the meta-analyses (Fig. 1). Characteristics of included studies are described in Table 1.

Fig. 1. Flow diagram of study inclusion.
Table 1. Properties of included studies

A, activation; AA, African American or Black; AI/AN, American Indian or Alaskan Native; AS, Asian; Ax, anxiety; ADM, antidepressant medication; BA, behavioral activation; BADS, Behavioral Activation for Depression Scale; BAI, Beck Anxiety Inventory; BDI, Beck Depression Inventory; C, Caucasian or White; CT, cognitive therapy; CBT, cognitive behavioral therapy; D, depression; EROS, Environmental Reward Observation Scale; GAD, generalized anxiety disorder; GAS-ID, Glasgow Anxiety Scale for people with an Intellectual Disability; GDS, Geriatric Depression Scale; GDS-LD, Glasgow Depression Scale for people with a learning disability; GSH, guided self-help; HRSD, Hamilton Rating Scale for Depression; HSCL, Hopkins Symptom Checklist; I/ME, Indian or Middle Eastern; L, Hispanic or Latinx; M, mean number of completed sessions; MDD, major depressive disorder; MF, mindfulness; PES, pleasant events schedule; PHQ-9, Patient Health Questionnaire-9; PDN, psychodynamic; PL, placebo; PST, problem-solving therapy; RPI, Reward Probability Index; SC, supportive counseling; TAU, treatment as usual; USA, United States of American; UK, United Kingdom; Zung, Zung self-rating depression scale; WAT, walking and talking intervention; WL, waitlist.
a Numbers of sessions represent the number of planned sessions, except for two studies which reported the mean number of completed sessions, denoted by ‘M = ’.
Bias risk assessment/study quality ratings
A visual summary of study quality ratings generated using RevMan (Review Manager, 2014) is displayed in Fig. 2. Overall, 4/28 (14%) studies had low risk of bias on all five outcomes, 4/28 (14%) had low risk of bias on 4/5 outcomes, 2/28 (7%) had low risk of bias on 3/5 outcomes, 11/28 (39%) had low risk of bias on 2/5 outcomes, 5/28 (18%) had low risk of bias on 1/5 outcomes, and 2/28 (7%) did not have low risk of bias any of the five outcomes. Among included studies, random sequence generation yielded a low risk of bias in 11/28 (39%) of studies and was unclear in 17/28 (61%) of studies. Allocation concealment yielded a low risk of bias in 7/28 (25%) of studies, was unclear in 19/28 (68%) of studies, and was high in 2/28 (7%) studies. Blinding of outcome assessment yielded a low risk of bias in 22/28 (79%) of studies, was unclear in 5/28 (18%) of studies, and was high in one (4%) study. Incomplete outcome data yielded a low risk of bias in 21/28 (75%) of studies, was unclear in 6/28 (21%) of studies, and was high in one (4%) study. Selective reporting yielded a low risk of bias in 8/28 (29%) of studies, was unclear in 19/28 (68%) of studies, and was high in one (4%) study.

Fig. 2. Study quality assessment.
Effect of behavioral activation and publication bias
A summary table of the primary outcome analyses is displayed in Table 2.
Table 2. Summary of primary outcomes

Effect of behavioral activation on depression compared to inactive control
BA for depression was compared to inactive controls using data from 19 studies and 844 participants.
The effect of BA v. inactive control was g = 0.83 (95% CI 0.58–1.08, p < 0.001), representing a large effect size (Fig. 3a). There was significant and moderate to high heterogeneity (Q = 48.88, I 2 = 63 (95% CI 40–99), p < 0.001), which is greater than what would be expected due to sampling error.

Fig. 3. (a) Forrest plot of BA v. inactive control for depression symptoms. (b) Funnel plot of BA v. inactive control for depression symptoms.
The funnel plot was visually inspected and revealed asymmetry, suggesting publication bias (Fig. 3b). Tests of publication bias revealed a high likelihood of publication bias. The Duval and Tweedie trim and fill procedure imputed seven studies [Duval and Tweedie adjusted g = 0.47 (95% CI 0.19–0.75)]. Results of the Egger's test also indicated a high likelihood of publication bias (Egger test intercept = 2.66, s.e. = 0.74, p = 0.002).
Moderation analysis
A subgroup analysis using a mixed-effects model was used to evaluate the moderating effect of the inclusion of a discussion on values in BA compared to inactive control using data from 19 studies and 844 participants. The effect size for the subgroup with a discussion of values was g = 0.86, whereas the effect size for the subgroup without values was g = 0.82. Using this model, the presence of a discussion on values did not predict a significantly different depression effect size [Q(1) = 0.07, p = 0.79].
Effect of behavioral activation on depression compared to active control
BA for depression was compared to active controls using data from 15 studies and 1098 participants. The effect of BA v. active control was g = 0.15 [(95% CI −0.02 to 0.33), p = 0.084], representing a negligible effect size (Fig. 4a). There was significant and moderate heterogeneity (Q = 23.73, I 2 = 41 (95% CI 0–98), p = 0.049), which is greater than what would be expected due to sampling error.

Fig. 4. (a) Forrest plot of BA v. active control for depression symptoms. (b) Funnel plot of BA v. active control for depression symptoms.
The funnel plot was visually inspected and did not reveal substantial asymmetry, suggesting minimal publication bias (Fig. 4b). Tests of publication bias revealed a low likelihood of publication bias. The Duval and Tweedie trim and fill procedure did not impute any studies or adjust the effect size. The results of the Egger's test also indicated a low likelihood of publication bias (Egger test intercept = 0.20, s.e. = 0.79, p = 0.80).
Effect of behavioral activation on anxiety compared to inactive control
BA for anxiety was compared to inactive controls using data from five studies and 426 participants. The effect of BA v. inactive control was g = 0.37 (95% CI 0.18–0.57, p < 0.001), representing a small effect size (Fig. 5a). There was not significant heterogeneity (Q = 1.58, I 2 = 0 (95% CI 0–73), p = 0.81), which is consistent with what would be expected due to sampling error. However, this metric should be interpreted with caution due to the small number of studies included in this analysis.

Fig. 5. (a) BA v. inactive control for anxiety symptoms. (b) Funnel plot for BA v. inactive control for anxiety symptoms.
The funnel plot was visually inspected and did not reveal substantial asymmetry, suggesting minimal publication bias (Fig. 5b). Tests of publication bias revealed a low likelihood of publication bias. The Duval and Tweedie trim and fill procedure did not impute any studies or adjust the effect size. The results of the Egger's test also indicated a low likelihood of publication bias (Egger test intercept = −0.12, s.e. = 0.96, p = 0.91).
Effect of behavioral activation on anxiety compared to active control
BA for anxiety was compared to active controls using data from four studies and 599 participants. The effect of BA v. active control was g = 0.03 (95% CI −0.13 to 0.19, p = 0.74), representing a negligible effect (Fig. 6a). There was no significant heterogeneity [Q = 0.92, I 2 = 0 (95% CI 0–66, p = 0.92)], which is consistent with what would be expected due to sampling error. However, this metric should be interpreted with caution due to the small number of studies included in this analysis.

Fig. 6. (a) Forrest plot of BA v. active control for anxiety symptoms. (b) Funnel plot of BA v. active control for anxiety symptoms.
The funnel plot was visually inspected and did not reveal substantial asymmetry, suggesting minimal publication bias (Fig. 6b). Tests of publication bias revealed a low likelihood of publication bias. The Duval and Tweedie trim and fill procedure did not impute any studies or adjust the effect size. The results of the Egger's test also indicated a low likelihood of publication bias (Egger test intercept = −0.11, s.e. = 0.90, p = 0.92).
Effect of behavioral activation on activation compared to inactive control
BA for activation was compared to inactive controls using data from eight studies and 358 participants. The effect of BA v. inactive control was g = 0.64 (95% CI 0.39–0.88, p < 0.001), representing a medium effect size (Fig. 7a). There was no significant heterogeneity [Q = 8.58, I 2 = 18 (95% CI 0–96, p = 0.29)], which is consistent with what would be expected due to sampling error. However, this metric should be interpreted with caution due to the small number of studies included in this analysis.

Fig. 7. (a) Forrest plot of BA v. active control for activation. (b) Funnel plot of BA v. active control for activation.
The funnel plot was visually inspected and revealed slight asymmetry, suggesting potential publication bias (Fig. 7b). Tests of publication bias revealed a moderate likelihood of publication bias. The Duval and Tweedie trim and fill procedure imputed one study [Duval and Tweedie adjusted g = 0.60 (95% CI 0.34–0.85)]. However, the Egger's test did not find a high likelihood of publication bias (Egger test intercept = 0.73, s.e. = 1.22, p = 0.57).
Effect of behavioral activation on activation compared to active control
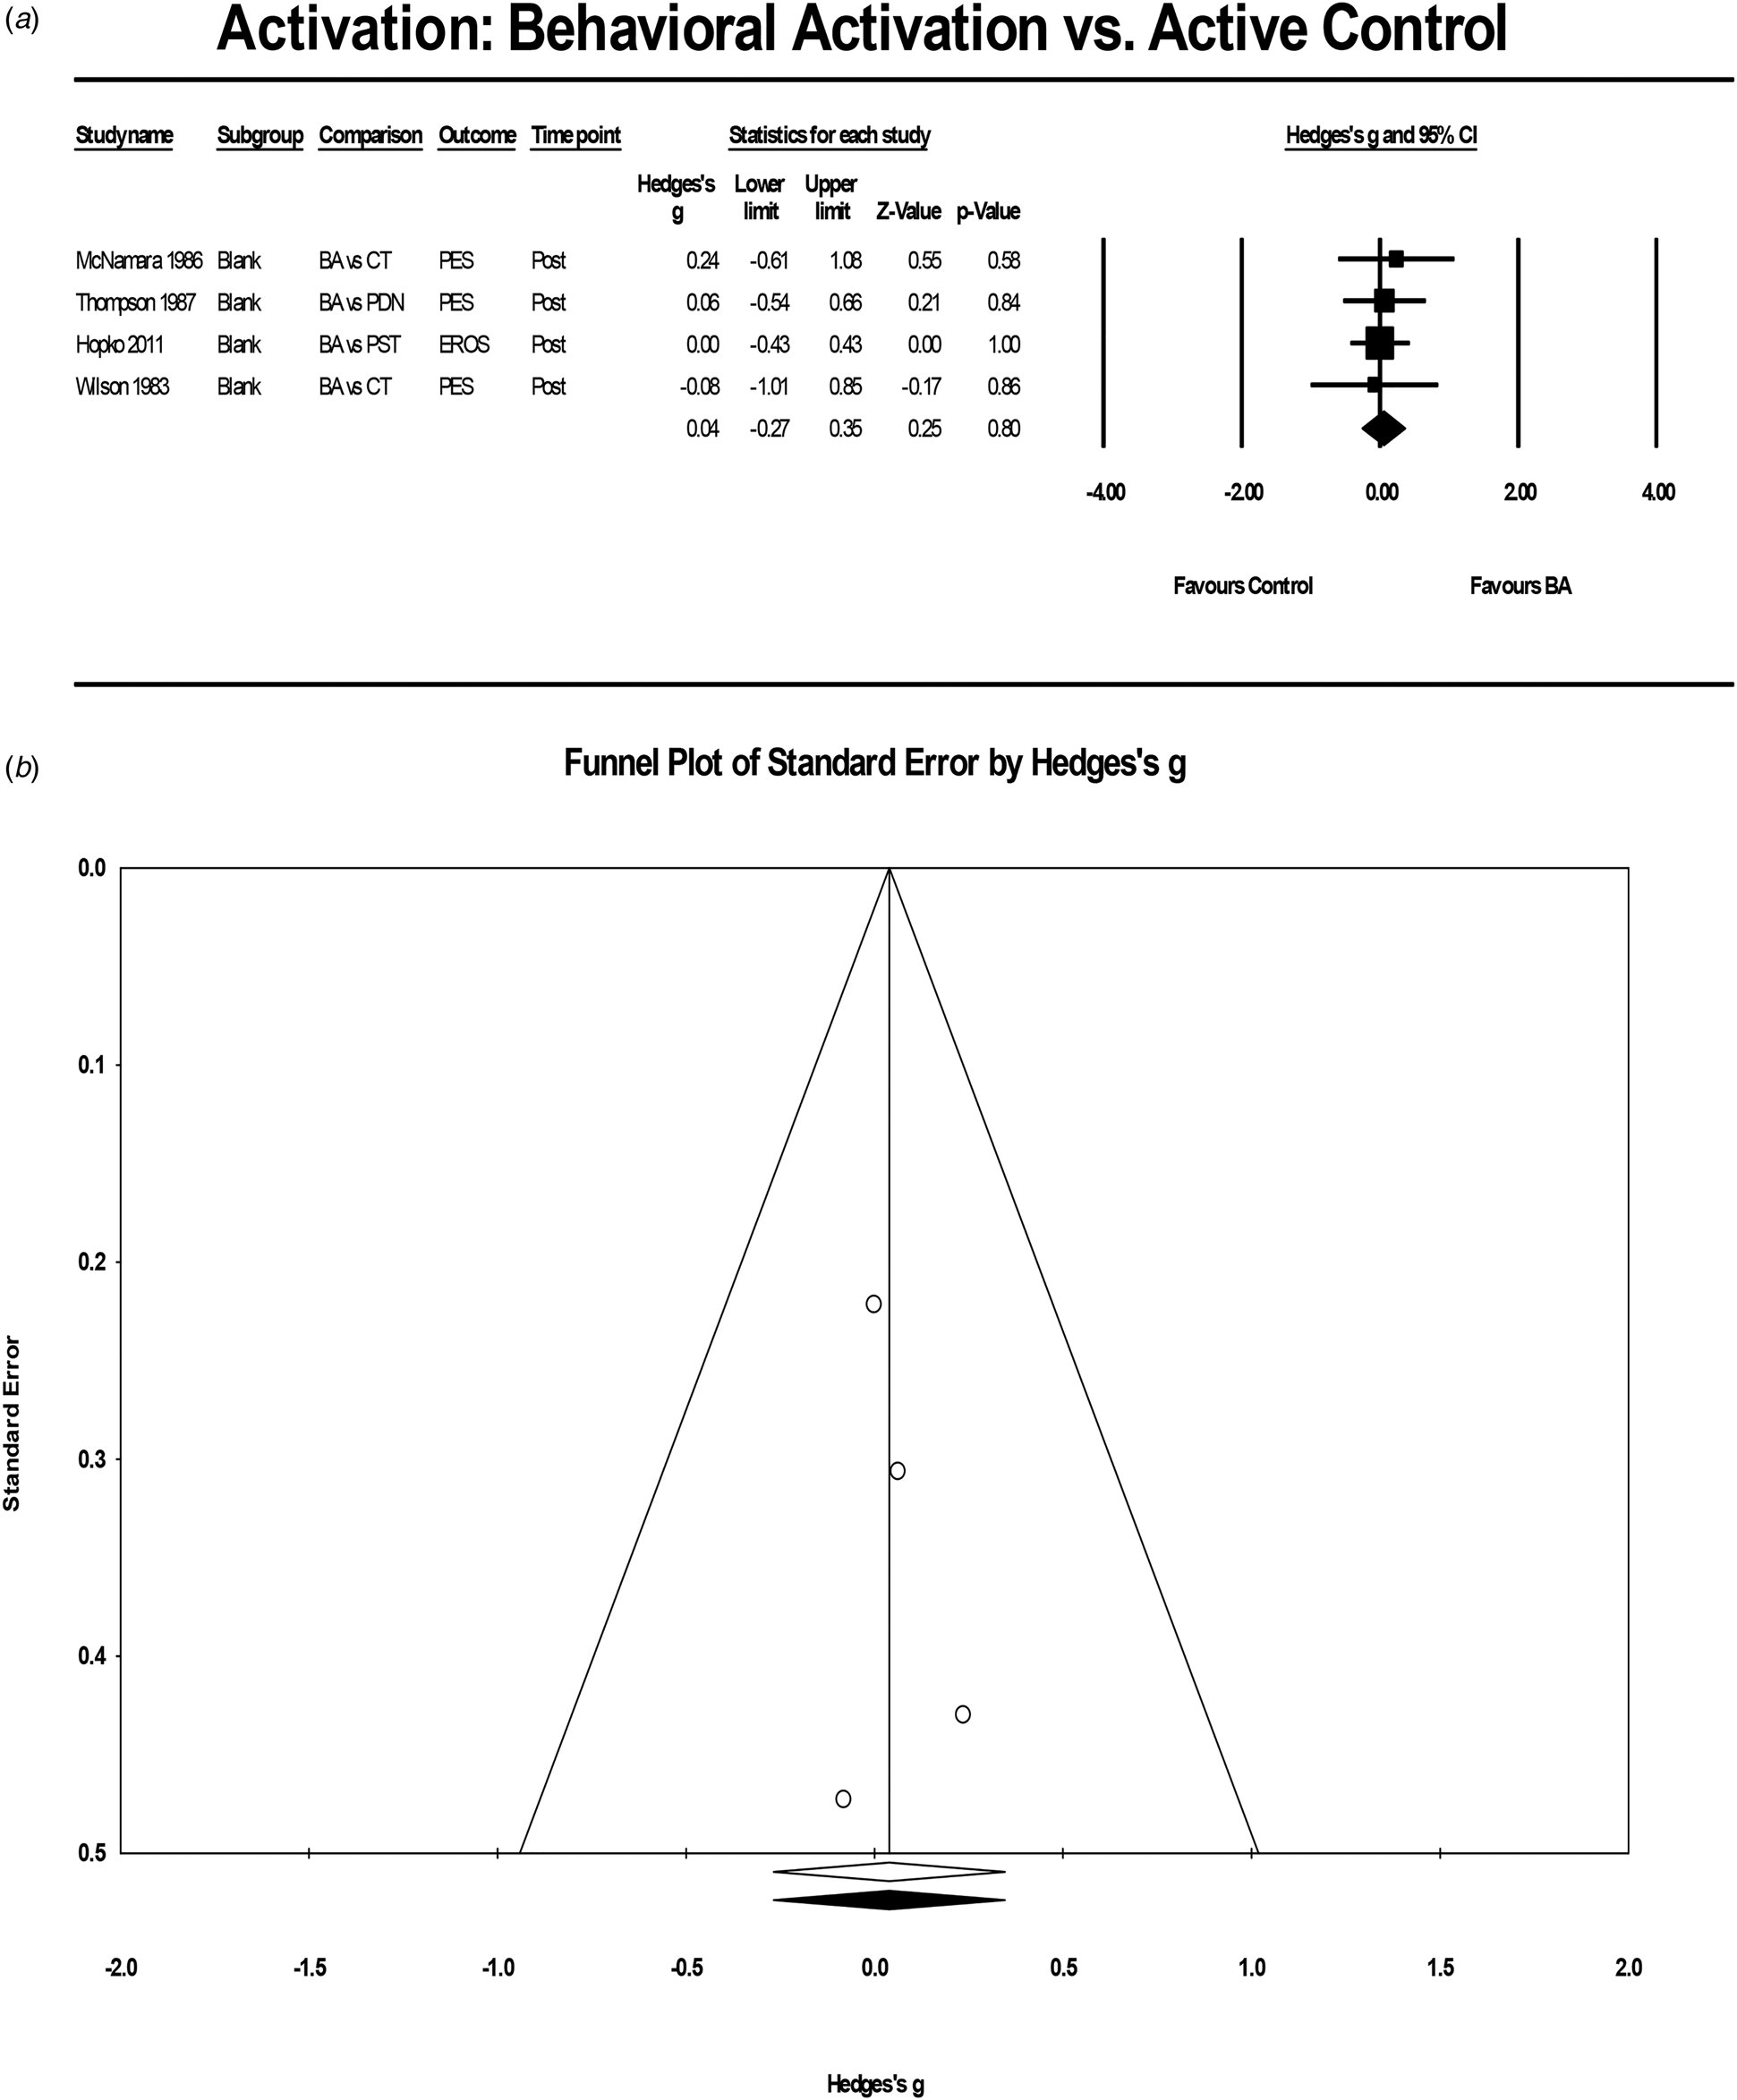
BA for activation was compared to active controls using data from four studies and 157 participants. The effect of BA v. active control was g = 0.04 (95% CI −0.27 to 0.35, p = 0.80) (Fig. 8a), representing a negligible effect. There was no significant heterogeneity [Q = 0.31, I 2 < 0.01 (95% CI 0–52, p = 0.96)], which is consistent with what would be expected due to sampling error. However, this metric should be interpreted with caution due to the small number of studies included in this analysis.

Fig. 8. (a) Forrest plot of BA v. active control for activation. (b) Funnel plot of BA v. active control for activation.
The funnel plot was visually inspected and did not reveal substantial asymmetry, suggesting minimal publication bias (Fig. 8b). Tests of publication bias revealed a low likelihood of publication bias. The Duval and Tweedie trim and fill procedure did not impute any studies or adjust the effect size. The results of the Egger's test also indicated a low likelihood of publication bias (Egger test intercept = 0.31, s.e. = 0.63, p = 0.67).
Discussion
In addition to depressive symptoms, changes in anxiety symptoms and activation are important outcomes in BA. Accordingly, we aimed to update and build on the extant literature documenting the antidepressant effects of BA by analyzing the efficacy of BA for depression, anxiety, and activation. We also examined the moderating effect of a discussion of values on depression symptoms.
Results from studies comparing BA to inactive control yielded a large effect size (g = 0.83) for reducing depression symptoms. Results from studies comparing BA to active control conditions yielded a small, non-significant effect size (g = 0.15). These findings are consistent with prior research examining the effect of BA on depressive symptoms relative to inactive control conditions (g = 0.74 in Ekers et al., Reference Ekers, Webster, Van Straten, Cuijpers, Richards and Gilbody2014). However, the current study examined a larger body of literature.
Results from studies comparing BA to inactive control yielded a small effect size (g = 0.37) for reducing anxiety symptoms. Results from studies comparing BA to active control conditions yielded a negligible, nonsignificant effect size (g = 0.03). To our knowledge, these results provide the first pooled estimates of controlled effect sizes of BA for improving anxiety symptoms. This small effect size of BA relative to inactive control is somewhat smaller than what has been observed in a prior meta-analysis of psychotherapy for depression trials (g = 0.52; Weitz, Kleiboer, van Straten, and Cuijpers, Reference Weitz, Kleiboer, van Straten and Cuijpers2018). This smaller than expected effect of BA on anxiety could be partially explained by overlapping symptoms between anxiety and depression (Zbozinek et al., Reference Zbozinek, Rose, Wolitzky-Taylor, Sherbourne, Sullivan, Stein and Craske2012) or by the fact that anxiety symptoms are often secondary to depression (Fava et al., Reference Fava, Rankin, Wright, Alpert, Nierenberg, Pava and Rosenbaum2000). These findings suggest that, when anxiety is secondary to depression, BA may be an appropriate treatment as it appears to help alleviate anxiety symptoms, albeit minimally.
In terms of engaging its core putative therapeutic mechanism, BA appeared effective at increasing activation (g = 0.64 for BA v. inactive control), although not more so than active control conditions (g = 0.04). The latter finding may point to the bi-directional nature of activation and depressed mood. According to the behavioral model of depression, one would expect an increase in activation to precede improvement in depressed mood, but would also expect that an improvement in mood would result in increased activation. Thus, it is possible that any treatment that is effective at improving depressed mood will also increase activation. Indeed, a meta-analysis of dysfunctional thinking in CBT (i.e. an alternative therapeutic target for treatments of depression) did not yield a significant difference between CBT and other psychotherapies or pharmacotherapies for reducing dysfunctional thinking (Cristea et al., Reference Cristea, Huibers, David, Hollon, Andersson and Cuijpers2015). It is important to note, however, that the active control conditions, such as CBT, also include elements of BA. Accordingly, it is possible that the between-group effect would be stronger had these control conditions been excluded. Collectively, these findings highlight the need for further research understanding the working mechanism of psychological interventions for depression.
Despite evidence for target engagement, the magnitude of the effect size suggests that there is room for improvement in increasing activation in BA. Among other strategies, those that facilitate homework completion may boost the effects of BA (Burns & Spangler, Reference Burns and Spangler2000; Busch, Uebelacker, Kalibatseva, & Miller, Reference Busch, Uebelacker, Kalibatseva and Miller2010; Kazantzis, Deane, & Ronan, Reference Kazantzis, Deane and Ronan2000; Mausbach, Moore, Roesch, Cardenas, & Patterson, Reference Mausbach, Moore, Roesch, Cardenas and Patterson2010; Ryba & Hopko, Reference Ryba and Hopko2012). Initial evidence from our group points to brief-guided practice as a potential viable augmentation strategy (Stein, Shumake, Beevers, & Smits, Reference Stein, Shumake, Beevers and Smits2019). Another approach to increasing activation is positive affect training, which incorporates a number of strategies for increasing reward sensitivity to increase positive affect (Craske et al., Reference Craske, Meuret, Ritz, Treanor, Dour and Rosenfield2019). Indeed, reward sensitivity has been shown to discriminate between treatment responders and non-responders to antidepressant medication, suggesting that it may be an important treatment target (Wichers et al., Reference Wichers, Barge-Schaapveld, Nicolson, Peeters, de Vries, Mengelers and van Os2009).
More recent versions of BA have included a discussion of values, assuming that such emphasis would help ensure that new and targeted activities would be guided by the patients' values, which in turn may facilitate depression symptom reduction. Our findings cannot speak to whether such discussion indeed leads to a different set of new activities and that the increase in activities is qualitatively different from protocols that do not include a discussion of values. Our analysis did fail to support the hypothesis that this added strategy would offer better depression outcomes. We should note that there were only six studies that included a values discussion included in our analyses and three of them were only single session interventions. We were underpowered to include additional covariates in this model, but future research with a larger number of studies, should control for the number of sessions. Nonetheless, additional research in the field is needed directly comparing BA with and without a values discussion in a well-powered randomized controlled trial to better address this question.
These results must be considered in light of several limitations. First, it is important to note that the confidence intervals around these effect sizes were large and many studies were of low quality and/or had small sample sizes, especially the analyses of anxiety, activation, and values. Although it is possible to examine this empirically by conducting sensitivity analyses using studies with low risk of bias, we did not have a sufficient number of low risk studies to perform meaningful sensitivity analyses (i.e. fewer than five low risk studies per comparison). Second, there was considerable variability in the ‘dosing’ of the intervention, with the number of sessions ranging from 1 to 24; however, previous meta-analyses have found that the number of sessions was not a significant moderator of treatment effect (Ekers et al., Reference Ekers, Webster, Van Straten, Cuijpers, Richards and Gilbody2014). There was also substantial heterogeneity between the studies (e.g. difference between treatment protocols, depression severity, and co-occurring conditions) which needs to be considered when interpreting the findings. Third, several studies included multiple active comparison conditions, which resulted in the exclusion of some data from the analysis. As is the case with any meta-analysis, decisions were made by the researchers with respect to the selection of outcome measure and comparison conditions, which impacts the results. Fourth, there was evidence of publication bias in the included studies, which suggests that there may have been negative trials of BA that were not published. This implies that the true effect size of BA relative to control may be smaller than the observed effect size. Finally, there were too few studies measuring the long-term effects of BA, so we were only able to examine the acute effects of the intervention. In addition to more studies with larger samples, many of the included studies are older and were published before reporting guidelines, such as PRISMA, existed. Thus, the risk of bias in many studies is high. There is a need for well-powered, low risk of bias (i.e. high quality) studies of BA.
In summary, our meta-analysis provides updated evidence supporting the efficacy of BA for depression, and preliminary evidence supporting its efficacy for anxiety and activation. These findings support BA as at least as effective as other active treatments for depression and substantially more effective than inactive control conditions for all outcomes. We did not find an effect of including a discussion on values on depression symptom outcome. Additional well-powered studies of BA are needed, particularly comparing different versions of the intervention. Clinically, these results may support the use of BA for depression across a variety of populations and settings, including for individuals with co-occurring anxiety symptoms. Future versions of BA may consider augmentation strategies for bolstering the effects of the intervention on activation and anxiety.
Financial support
This research received no specific grant from any funding agency, commercial, or not-for-profit sectors.
Conflict of interest
Aliza T. Stein, Emily Carl, Pim Cuijpers, and Eirini Karyotaki declare that they have no conflicts of interest. Jasper A.J. Smits has received monetary compensation for his work as a clinical advisor to Big Health, Ltd.